China
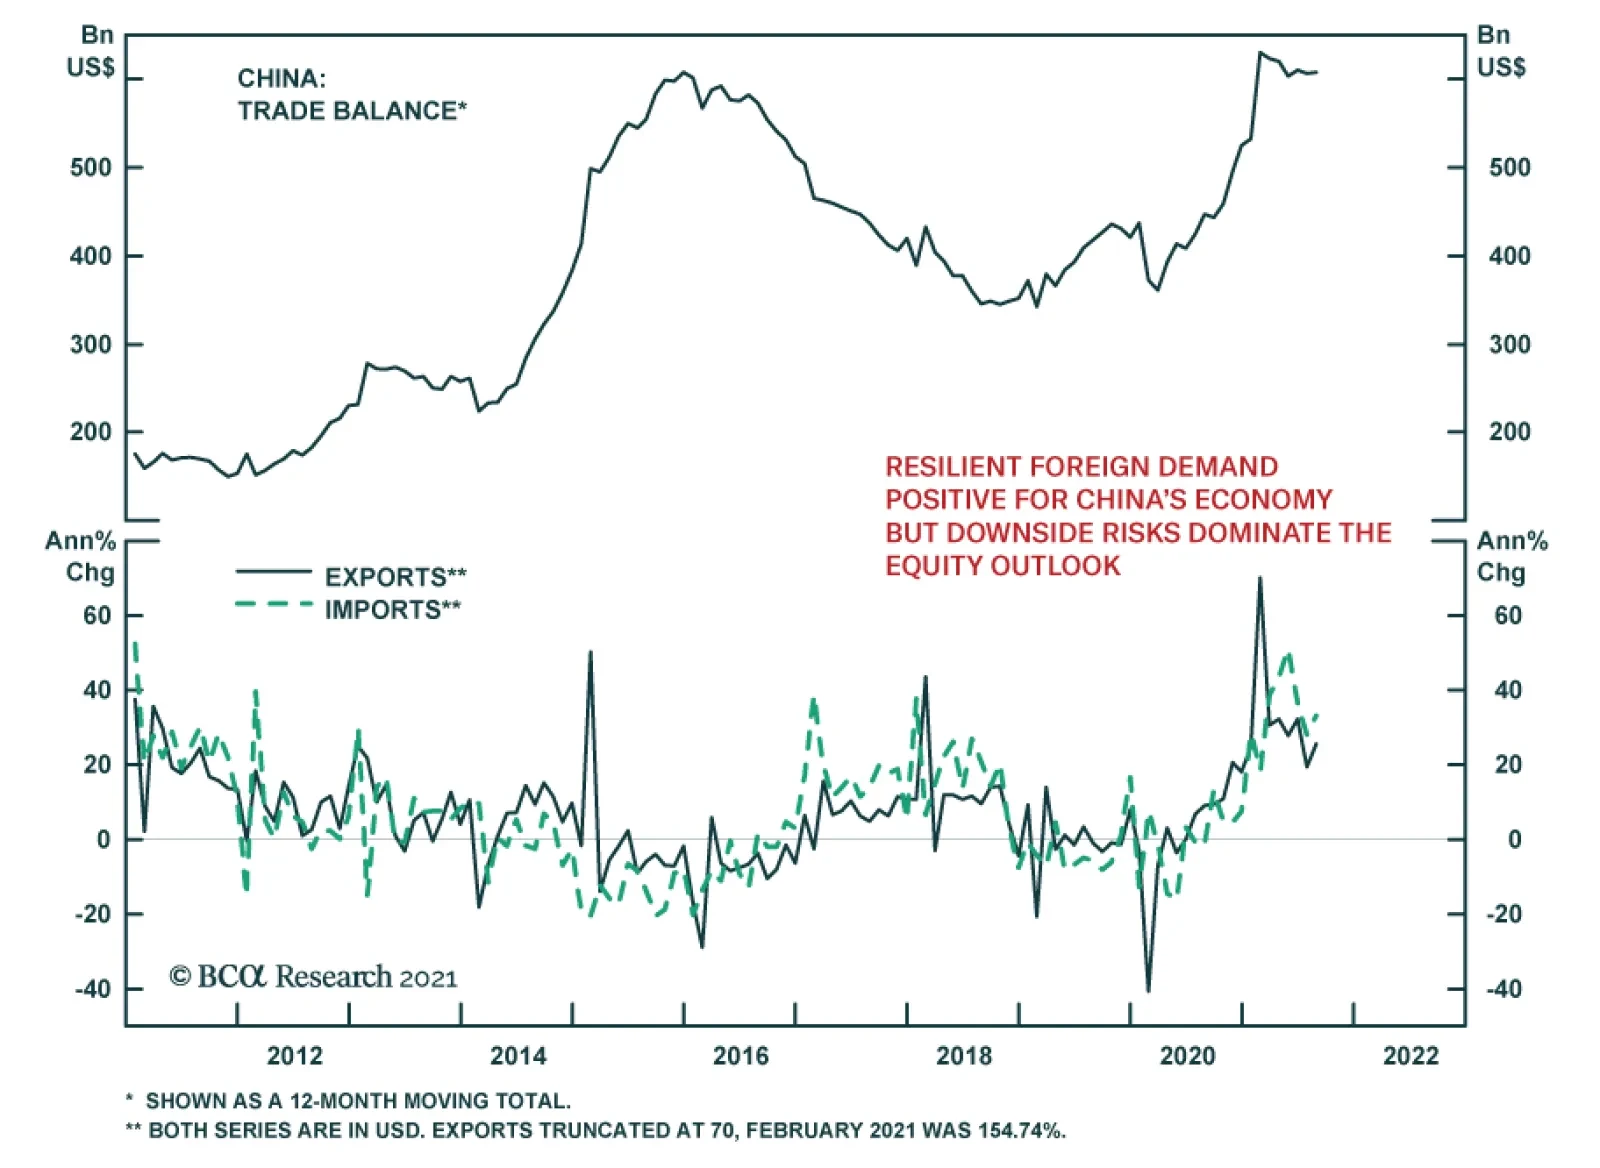
China's trade balance widened unexpectedly in August, rising to USD 58.3 billion from July's USD 56.6 billion. Both exports and imports surprised to the upside and reached all-time highs. Exports accelerated to 25.6% y/y versus an anticipated slowdown to…

Highlights An Iran crisis is imminent. We still think a US-Iran détente is possible but our conviction is lower until Biden makes a successful show of force. Oil prices will be volatile. Fiscal drag is a risk to the cyclical global macro view. But developed markets are more fiscally proactive than they were after the global financial crisis. Elections will reinforce that, starting in Germany, Canada, and Japan. The Chinese and Russian spheres are still brimming with political and geopolitical risk. But China will ease monetary and fiscal policy on the margin over the coming 12 months. Afghanistan will not upset our outlook on the German and French elections, which is positive for the euro and European stocks. Feature Chart 1Bull Market In Iran Tensions
Biden's Show Of Force (GeoRisk Update)
Biden's Show Of Force (GeoRisk Update)
Iran is now the most pressing geopolitical risk in the short term (Chart 1). The Biden administration has been chastened by the messy withdrawal from Afghanistan and will be exceedingly reactive if it is provoked by foreign powers. Nuclear weapons improve regime survivability. Survival is what the Islamic Republic wants. Iran is surrounded by enemies in its region and under constant pressure from the United States. Hence Iran will never ultimately give up its nuclear program, as we have maintained. Chart 2Biden Unlikely To Lift Iran Sanctions Unilaterally
Biden's Show Of Force (GeoRisk Update)
Biden's Show Of Force (GeoRisk Update)
However, Supreme Leader Ali Khamenei could still agree to a deal in which the US reduces economic sanctions while Iran allows some restrictions on uranium enrichment for a limited period of time (the 2015 nuclear deal’s key provisions expire from 2023 through 2030). This would be a stopgap measure to delay the march into war. The problem is that rejoining the 2015 deal requires the US to ease sanctions first, since the US walked away from the deal in 2018. Iran would need domestic political cover to rejoin it. Biden has the executive authority to ease sanctions unilaterally but after Afghanistan he lacks the political capital to do so (Chart 2). So Biden cannot ease sanctions until Iran pares back its nuclear activities. But Iran has no reason to pare back if the US does not ease sanctions. Iran is now enriching some uranium to a purity of 60%. Israeli Defense Minister Benny Gantz says it will reach “nuclear breakout” capability – enough fissile material to build a bomb – within 10 weeks, i.e. mid-October. Anonymous officials from the Biden administration told the Associated Press it will be “months or less,” which could mean September, October, or November (Table 1). Table 1Iran Nearing "Breakout" Nuclear Capability
Biden's Show Of Force (GeoRisk Update)
Biden's Show Of Force (GeoRisk Update)
Meanwhile the new Iranian government of President Ebrahim Raisi, a hardliner who is tipped to take over as Supreme Leader once Ali Khamenei steps down, is implying that it will not rejoin negotiations until November. All of these timelines are blurry but the implication is that Iran will not resume talks until it has achieved nuclear breakout. Israel will continue its campaign of sabotage against the regime. It may be pressed to the point of launching air strikes, as it did against nuclear facilities in Iraq in 1981 and Syria in 2007 under what is known as the “Begin Doctrine.” Chart 3Israel Cannot Risk Losing US Security Guarantee
Biden's Show Of Force (GeoRisk Update)
Biden's Show Of Force (GeoRisk Update)
The constraint on Israel is that it cannot afford to lose America’s public support and defense alliance since it would find itself isolated and vulnerable in its region (Chart 3). But if Israeli intelligence concludes that the Iranians truly stand on the verge of achieving a deliverable nuclear weapon, the country will likely be driven to launch air strikes. Once the Iranians test and display a viable nuclear deterrent it will be too late. Four US presidents, including Biden, have declared that Iran will not be allowed to get nuclear weapons. Biden and the Democrats favor diplomacy, as Biden made clear in his bilateral summit with Israeli Prime Minister Naftali Bennett last week. But Biden also admitted that if diplomacy fails there are “other options.” The Israelis currently have a weak government but it is unified against a nuclear-armed Iran. At very least Bennett will underscore red lines to indicate that Israel’s vigilance has not declined despite hawkish Benjamin Netanyahu’s fall from power. Still, Iran may decide it has an historic opportunity to make a dash for the bomb if it thinks that the US will fail to support an Israeli attack. The US has lost leverage in negotiations since 2015. It no longer has troops stationed on Iran’s east and west flanks. It no longer has the same degree of Chinese and Russian cooperation. It is even more internally divided. Iran has no guarantee that the US will not undergo another paroxysm of nationalism in 2024 and try to attack it. The faction that opposed the deal all along is now in power and may believe it has the best chance in its lifetime to achieve nuclear breakout. The only reason a short-term deal is possible is because Khamenei may believe the Israelis will attack with full American support. He agreed to the 2015 deal. He also fears that the combination of economic sanctions and simmering social unrest will create a rift when he dies or passes the leadership to his successor. Iran has survived the Trump administration’s “maximum pressure” sanctions but it is still vulnerable (Chart 4). Chart 4Supreme Leader Focuses On Regime Survival
Supreme Leader Focuses On Regime Survival
Supreme Leader Focuses On Regime Survival
Moreover Biden is offering Khamenei a deal that does not require abandoning the nuclear program and does not prevent Iran from enhancing its missile capabilities. By taking the deal he might prevent his enemies from unifying, forestall immediate war, and pave the way for a smooth succession, while still pursuing the ultimate goal of nuclear weaponization. Bringing it all together, the world today stands at a critical juncture with regard to Iran and the unfinished business of the US wars in the Middle East. Unless the US and Israel stage a unified and convincing show of force, whether preemptively or in response to Iranian provocations, the Iranians will be justified in concluding that they have a once-in-a-generation opportunity to pursue the bomb. They could sneak past the global powers and obtain a nuclear deterrent and regime security, like North Korea did. This could easily precipitate a war. Biden will probably continue to be reactive rather than proactive. If the Iranians are silent then it will be clear that Khamenei still sees the value in a short-term deal. But if they continue their march toward nuclear breakout, as is the case as we go to press, then Biden will have to make a massive show of force. The goal would be to underscore the US’s red lines and drive Iran back to negotiating table. If Biden blinks, he will incentivize Iran to make a dash for the bomb. Either way a crisis is imminent. Israel will continue to use sabotage and underscore red lines while the Iranians will continue to escalate their attacks on Israel via militant proxies and attacks on tankers (Map 1). Map 1Secret War Escalates In Middle East
Biden's Show Of Force (GeoRisk Update)
Biden's Show Of Force (GeoRisk Update)
Bottom Line: After a crisis, either diplomacy will be restored, or the Middle East will be on a new war path. The war path points to a drastically different geopolitical backdrop for the global economy. If the US and Iran strike a short-term deal, Iranian oil will flow and the US will shift its strategic focus to pressuring China, which is negative for global growth and positive for the dollar. If the US and Iran start down the war path, oil supply disruptions will rise and the dollar will fall. Implications For Oil Prices And OPEC 2.0 The probability of a near-term conflict is clear from our decision tree, which remains the same as in June 2019 (Diagram 1). Diagram 1US-Iran Conflict: Critical Juncture In Our Decision Tree
Biden's Show Of Force (GeoRisk Update)
Biden's Show Of Force (GeoRisk Update)
Shows of force and an escalation in the secret war will cause temporary but possibly sharp spikes in oil prices in the short term. OPEC 2.0 remains intact so far this year, as expected. The likelihood that the global economic recovery will continue should encourage the Saudis, Russians, Emiratis and others to maintain production discipline to drain inventories and keep Brent crude prices above $60 per barrel. OPEC 2.0 is a weak link in oil prices, however, because Russians are less oil-dependent than the Gulf Arab states and do not need as high of oil prices for their government budget to break even (Chart 5). Periodically this dynamic leads the cartel to break down. None of the petro-states want to push oil prices up so high that they hasten the global green energy transition. Chart 5OPEC 2.0 Keeps Price Within Fiscal Breakeven Oil Price
Biden's Show Of Force (GeoRisk Update)
Biden's Show Of Force (GeoRisk Update)
Chart 6Oil Price Risks Lie To Upside Until US-Iran Deal Occurs
Oil Price Risks Lie To Upside Until US-Iran Deal Occurs
Oil Price Risks Lie To Upside Until US-Iran Deal Occurs
As long as OPEC 2.0 remains disciplined, average Brent crude oil prices will gradually rise to $80 barrels per day by the end of 2024, according to our Commodity & Energy Strategy (Chart 6). Imminent firefights will cause prices to spike at least temporarily when large amounts of capacity are taken offline. Global spare capacity is probably sufficient to handle one-off disruptions but an open-ended military conflict in the Persian Gulf or Strait of Hormuz would be a different story. After the next crisis, everything depends on whether the US and Israel establish a credible threat and thus restore diplomacy. Any US-Iran strategic détente would unleash Iranian production and could well motivate the Gulf Arabs to pump more oil and deny Iran market share. Bottom Line: Given that any US-Iran deal would also be short-term in nature, and may not even stabilize the region, some of the downside risks are fading at the moment. The US and China are also sucking in more commodities as they gear up for great power struggle. The geopolitical outlook is positive for oil prices in these respects. But OPEC 2.0 is the weak link in this expectation so we expect volatility. Global Fiscal Taps Will Stay Open Markets have wavered in recent months over softness in the global economic recovery, COVID-19 variants, and China’s policy tightening. The world faces a substantial fiscal drag in the coming years as government budgets correct from the giant deficits witnessed during the crisis. Nevertheless policymakers are still able to deliver some positive fiscal surprises on the margin. Developed markets have turned fiscally proactive over the past decade. They rejected austerity because it was seen as fueling populist political outcomes that threatened the established parties. Note that this change began with conservative governments (e.g. Japan, UK, US, Germany), implying that left-leaning governments will open the fiscal taps further whenever they come to power (e.g. Canada, the US, Italy, and likely Germany next). Chart 7Global Fiscal Taps Will Stay Open
Biden's Show Of Force (GeoRisk Update)
Biden's Show Of Force (GeoRisk Update)
Chart 7 updates the pandemic-era fiscal stimulus of major economies, with light-shaded bars highlighting new fiscal measures that are in development but have not yet been included in the IMF’s data set. The US remains at the top followed by Italy, which also saw populist electoral outcomes over the past decade. Chart 8US Fiscal Taps Open At Least Until 2023
US Fiscal Taps Open At Least Until 2023
US Fiscal Taps Open At Least Until 2023
The Biden administration is on the verge of passing a $550 billion bipartisan infrastructure bill. We maintain 80% subjective odds of passage – despite the messy pullout from Afghanistan. Assuming it passes, Democrats will proceed to their $3.5 trillion social welfare bill. This bill will inevitably be watered down – we expect a net deficit impact of around $1-$1.5 trillion for both bills – but it can pass via the partisan “budget reconciliation” process. We give 50% subjective odds today but will upgrade to 65% after infrastructure passes. The need to suspend the debt ceiling will raise volatility this fall but ultimately neither party has an interest in a national debt default. The US is expanding social spending even as geopolitical challenges prevent it from cutting defense spending, which might otherwise be expected after Afghanistan and Iraq. The US budget balance will contract after the crisis but then it will remain elevated, having taken a permanent step up as a result of populism. The impact should be a flat or falling dollar on a cyclical basis, even though we think geopolitical conflict will sustain the dollar as the leading reserve currency over the long run (Chart 8). So the dollar view remains neutral for now. Bottom Line: The US is facing a 5.9% contraction in the budget deficit in 2022 but the blow will be cushioned somewhat by two large spending bills, which will put budget deficits on a rising trajectory over the course of the decade. Big government is back. Developed Market Fiscal Moves (Outside The US) Chart 9German Opinion Favors New Left-Wing Coalition
Biden's Show Of Force (GeoRisk Update)
Biden's Show Of Force (GeoRisk Update)
Fiscal drag is also a risk for other developed markets – but here too a substantial shift away from prudence has taken place, which is likely to be signaled to investors by the outperformance of left-wing parties in Germany’s upcoming election. Germany is only scheduled to add EUR 2.4 billion to the 25.6 billion it will receive under the EU’s pandemic recovery fund, but Berlin is likely to bring positive fiscal surprises due to the federal election on September 26. Germany will likely see a left-wing coalition replace Chancellor Angela Merkel and her long-ruling Christian Democrats (Chart 9). The platforms of the different parties can be viewed in Table 2. Our GeoRisk Indicator for Germany confirms that political risk is elevated but in this case the risk brings upside to risk assets (Appendix). Table 2German Party Platforms
Biden's Show Of Force (GeoRisk Update)
Biden's Show Of Force (GeoRisk Update)
While we expected the Greens to perform better than they are in current polling, the point is the high probability of a shift to a new left-wing government. The Social Democrats are reviving under the leadership of Olaf Scholz (Chart 10). Tellingly, Scholz led the charge for Germany to loosen its fiscal belt back in 2019, prior to the global pandemic. Chart 10Germany: Online Markets Betting On Scholz
Biden's Show Of Force (GeoRisk Update)
Biden's Show Of Force (GeoRisk Update)
Chart 11Canada: Trudeau Takes A Calculated Risk
Biden's Show Of Force (GeoRisk Update)
Biden's Show Of Force (GeoRisk Update)
In June, the cabinet approved a draft 2022 budget plan supported by Scholz that would contain new borrowing worth EUR 99.7 bn ($119 billion). This amount is not included in the chart above but it should be seen as the minimum to be passed under the new government. If a left-wing coalition is formed, as we expect, the amount will be larger, given that both the Social Democrats and the Greens have been restrained by Merkel’s party. Canada turned fiscally proactive in 2015, when the institutional ruling party, the Liberals, outflanked the more progressive New Democrats by calling for budget deficits instead of a balanced budget. The Liberals saw a drop in support in 2019 but are now calling a snap election. Prime Minister Trudeau is not as popular in general opinion as he is in the news media but his party still leads the polls (Chart 11). The Conservatives are geographically isolated and, more importantly, are out of step with the median voter on the key issues (Table 3). Table 3Canada: Liberal Agenda Lines Up With Top Voter Priorities
Biden's Show Of Force (GeoRisk Update)
Biden's Show Of Force (GeoRisk Update)
Nevertheless it is a risky time to call an election – our GeoRisk Indicator for Canada is soaring (Appendix). Granting that the Liberals are very unlikely to fall from power, whatever their strength in parliament, the key point is that parliament already approved of CAD 100 billion in new spending over the coming three years. Any upside surprise would give Trudeau the ability to push for still more deficit spending, likely focused on climate change. Chart 12Japan: Suga Will Go, LDP Will Stimulate
Japan: Suga Will Go, LDP Will Stimulate
Japan: Suga Will Go, LDP Will Stimulate
Japanese politics are heating up ahead of the Liberal Democrats’ leadership election on September 29 and the general election, due by November 28. Prime Minister Yoshihide Suga’s sole purpose in life was to stand in for Shinzo Abe in overseeing the Tokyo Olympics. Now they are done and Suga will likely be axed – if he somehow survives the election, he will not last long after, as his approval rating is in freefall. The Liberal Democrats are still the only game in town. They will try to minimize the downside risks they face in the general election by passing a new stimulus package (Chart 12). Rumor has it that the new package will nominally be worth JPY 10-15 trillion, though we expect the party to go bigger, and LDP heavyweight Toshihiro Nikai has proposed a 30 trillion headline number. It is extremely unlikely that the election will cause a hung parliament or any political shift that jeopardizes passage of the bill. Abenomics remains the policy setting – and consumption tax hikes are no longer on the horizon to impede the second arrow of Abenomics: fiscal policy. Not all countries are projecting new spending. A stronger-than-expected showing by the Christian Democrats would result in gridlock in Germany. Meanwhile the UK may signal belt-tightening in October. Bottom Line: Germany, Canada, and Japan are likely to take some of the edge off of expected fiscal drag next year. Emerging Market Fiscal Moves (And China Regulatory Update) Among the emerging markets, Russia and China are notable in Chart 7 above for having such a small fiscal stimulus during this crisis. Russia has announced some fiscal measures ahead of the September 19 Duma election but they are small: $5.2 billion in social spending, $10 billion in strategic goals over three years, and a possible $6.8 billion increase in payments to pensioners. Fiscal austerity in Russia is one reason we expect domestic political risk to remain elevated and hence for President Putin to stoke conflicts in his near abroad (see our Russian risk indicator in the Appendix). There are plenty of signs that Belarussian tensions with the Baltic states and Poland can escalate in the near term, as can fighting in Ukraine in the wake of Biden’s new defense agreement and second package of military aid. China’s actual stimulus was much larger than shown in Chart 7 above because it mostly consisted of a surge in state-controlled bank lending. China is likely to ease monetary and fiscal policy on the margin over the coming 12 months to secure the recovery in time for the national party congress in 2022. But China’s regulatory crackdown will continue during that time and our GeoRisk Indicator clearly shows the uptick in risk this year (Appendix). Chart 13China Expands Unionization?
China Expands Unionization?
China Expands Unionization?
The regulatory crackdown is part of a cyclical consolidation of Xi Jinping’s power as well as a broader, secular trend of reasserting Communist Party and centralization in China. The latest developments underscore our view that investors should not play any technical rebound in Chinese equities. The increase in censorship of financial media is especially troubling. Just as the government struggles to deal with systemic financial problems (e.g. the failing property giant Evergrande, a possible “Lehman moment”), the lack of transparency and information asymmetry will get worse. The media is focusing on the government’s interventions into public morality, setting a “correct beauty standard” for entertainers and limiting kids to three hours of video games per week. But for investors what matters is that the regulatory crackdown is proceeding to the medical sector. High health costs (like high housing and education costs) are another target of the Xi administration in trying to increase popular support and legitimacy. Central government-mandated unionization in tech companies will hurt the tech sector without promoting social stability. Chinese unions do not operate like those in the West and are unlikely ever to do so. If they did, it would compound the preexisting structural problem of rising wages (Chart 13). Wages are forcing an economic transition onto Beijing, which raises systemic risks permanently across all sectors. Bottom Line: Political and geopolitical risk are still elevated in China and Russia. China will ease monetary and fiscal policy gradually over the coming year but the regulatory crackdown will persist at least until the 2022 political reshuffle. Afghanistan: The Refugee Fallout September 2021 will officially mark the beginning of Taliban’s second bout of power in Afghanistan. Will Afghanistan be the only country to spawn an outflux of refugees? Will the Taliban wresting power in Afghanistan trigger another refugee crisis for Europe? How is the rise of the Taliban likely to affect geopolitics in South Asia? Will Afghanistan Be The Last Major Country To Spawn Refugees? Absolutely not. We expect regime failures to affect the global economy over the next few years. The global growth engine functions asymmetrically and is powered only by a fistful of countries. As economic growth in poor countries fails to keep pace with that of top performers, institutional turmoil is bound to follow. This trend will only add to the growing problem of refugees that the world has seen in the post-WWII era. History suggests that the number of refugees in the world at any point in time is a function of economic prosperity (or the lack thereof) in poorer continents (Chart 14). For instance, the periods spanning 1980-90 and 2015-20 saw the world’s poorer continents lose their share in global GDP. Unsurprisingly these phases also saw a marked increase in the number of refugees. With the world’s poorer continents expected to lose share in global GDP again going forward, the number of refugees in the world will only rise. Chart 14Refugee Flows Rise When Growth Weak In Poor Continents
Biden's Show Of Force (GeoRisk Update)
Biden's Show Of Force (GeoRisk Update)
Citizens of Syria, Venezuela, Afghanistan, South Sudan, and Myanmar today account for two-thirds of all refugees globally. To start with, these five countries’ share in global GDP was low at 0.8% in the 1980s. Now their share in global GDP is set to fall to 0.2% over the next five years (Chart 15). Chart 15Refugee Exporters Hit All-Time Low In Global GDP Share
Biden's Show Of Force (GeoRisk Update)
Biden's Show Of Force (GeoRisk Update)
Per capita incomes in top refugee source countries tend to be very low. Whilst regime fractures appear to be the proximate cause of refugee outflux, an economic collapse is probably the root cause of the civil strife and waves of refugee movement seen out of the top refugee source countries. Another factor that could have a bearing is the rise of multipolarity. Shifting power structures in the global economy affect the stability of regimes with weak institutions. Instability in Afghanistan has been a direct result of the rise and the fall of the British and Russian empires. American imperial overreach is just the latest episode. If another Middle Eastern war erupts, the implications are obvious. But so too are the implications of US-China proxy wars in Southeast Asia or Russia-West proxy wars in eastern Europe. Bottom Line: With poorer continents’ economic prospects likely to remain weak and with multipolarity here to stay, the world’s refugee problem is here to stay too. Is A Repeat Of 2015 Refugee Crisis Likely In 2021? No. 2021 will not be a replica of 2015. This is owing to two key reasons. First, Afghanistan has long witnessed a steady outflow of refugees – especially at the end of the twentieth century but also throughout the US’s 20-year war there. The magnitude of the refugee problem in 2021 will be significantly smaller than that in 2015. Secondly, voters are now differentiating between immigrants and refugees with the latter entity gaining greater acceptance (Chart 16). Chart 16DM Attitudes Permissive Toward Refugees
Biden's Show Of Force (GeoRisk Update)
Biden's Show Of Force (GeoRisk Update)
Chart 17Refugees Will Not Change Game In German/French Elections
Biden's Show Of Force (GeoRisk Update)
Biden's Show Of Force (GeoRisk Update)
Concerns about refugees will gain some political traction but it will reinforce rather than upset the current trajectory in the most important upcoming elections, in Germany in September and France next April. True, these countries feature in the list of top countries to which Afghan refugees flee and will see some political backlash (Chart 17). But the outcome may be counterintuitive. In the German election, any boost to the far-right will underscore the likely underperformance of the ruling Christian Democrats. So the German elections will produce a left-wing surprise – and yet, even if the Greens won the chancellorship (the true surprise scenario, looking much less likely now), investors will cheer the pro-Europe and pro-fiscal result. The French election is overcrowded with right-wing candidates, both center-right and far-right, giving President Macron the ability to pivot to the left to reinforce his incumbent advantage next spring. Again, the euro and the equity market will rise on the status quo despite the political risk shown in our indicator (Appendix). Of course, immigration and refugees will cause shocks to European politics in future, especially as more regime failures in the third world take place to add to Afghanistan and Ethiopia. But in the short run they are likely to reinforce the fact that European politics are an oasis of stability given what is happening in the US, China, Brazil, and even Russia and India. Bottom Line: 2021 will not see a repeat of the 2015 refugee crisis. Ironically Afghan refugees could reinforce European integration in both German and French elections. The magnitude of the Afghan crisis is smaller than in the past and most Afghan refugees are likely to migrate to Pakistan and Iran (Chart 17). But more regime failures will ensure that the flow of people becomes a political risk again sometime in the future. What Does The Rise Of Taliban Mean For India? The Taliban first held power in Afghanistan from 1996-2001. This was one of the most fraught geopolitical periods in South Asia since the 1970s. Now optimists argue that Taliban 2.0 is different. Taliban leaders are engaging in discussions with an ex-president who was backed by America and making positive overtures towards India. So, will this time be different? It is worth noting that Taliban 2.0 will have to function within two major constraints. First, Afghanistan is deeply divided and diverse. Afghanistan’s national anthem refers to fourteen ethnic groups. Running a stable government is inherently challenging in this mountainous country. With Taliban being dominated by one ethnic group and with limited financial resources at hand, the Taliban will continue to use brute force to keep competing political groups at bay. Chart 18Taliban In Line With Afghanis On Sharia
Biden's Show Of Force (GeoRisk Update)
Biden's Show Of Force (GeoRisk Update)
At the same time, to maintain legitimacy and power, the Taliban will have to support aligned political groups operating in Afghanistan and neighboring Pakistan. Second, an overwhelming majority of Afghani citizens want Sharia law, i.e. a legal code based on Islamic scripture as the official law of the land (Chart 18). Hence if the Taliban enforces a Sharia-based legal system in Afghanistan then it will fall in line with what the broader population demands. It is against this backdrop that Taliban 2.0 is bound to have several similarities with the version that ruled from 1996-2001. Additionally, US withdrawal from Afghanistan will revive a range of latent terrorist movements in the region. This poses risks for outside countries, not least India, which has a long history of being targeted by Afghani terrorist groups. The US will remain engaged in counter-terrorism operations. To complicate matters, India’s North has an even more unfavorable view of Pakistan than the rest of India. With the northern voter’s importance rising, India’s administration may be forced to respond more aggressively to a terrorist event than would have been the case about a decade ago. It is also possible that terrorism will strike at China over time given its treatment of Uighur Muslims in Xinjiang. China’s economic footprint in Afghanistan could precipitate such a shift. Bottom Line: US withdrawal from Afghanistan is bound to add to geopolitical risks as latent terrorist forces will be activated. India has a long history of being targeted by Afghani terrorist movements. Incidentally, it will take time for transnational terrorism based in Afghanistan to mount successful attacks at the West once again, given that western intelligence services are more aware of the problem than they were in 2000. But non-state actors may regain the element of surprise over time, given that the western powers are increasingly focused on state-to-state struggle in a new era of great power competition. Matt Gertken Vice President Geopolitical Strategy mattg@bcaresearch.com Ritika Mankar, CFA Editor/Strategist ritika.mankar@bcaresearch.com Section II: GeoRisk Indicator China
China: GeoRisk Indicator
China: GeoRisk Indicator
Russia
Russia: GeoRisk Indicator
Russia: GeoRisk Indicator
United Kingdom
UK: GeoRisk Indicator
UK: GeoRisk Indicator
Germany
Germany: GeoRisk Indicator
Germany: GeoRisk Indicator
France
France: GeoRisk Indicator
France: GeoRisk Indicator
Italy
Italy: GeoRisk Indicator
Italy: GeoRisk Indicator
Canada
Canada: GeoRisk Indicator
Canada: GeoRisk Indicator
Spain
Spain: GeoRisk Indicator
Spain: GeoRisk Indicator
Taiwan
Taiwan: GeoRisk Indicator
Taiwan: GeoRisk Indicator
Korea
Korea: GeoRisk Indicator
Korea: GeoRisk Indicator
Turkey
Turkey: GeoRisk Indicator
Turkey: GeoRisk Indicator
Brazil
Brazil: GeoRisk Indicator
Brazil: GeoRisk Indicator
Australia
Australia: GeoRisk Indicator
Australia: GeoRisk Indicator
Section III: Geopolitical Calendar
According to BCA Research's Emerging Markets Strategy service, any near-term bounce in Chinese platform companies from oversold levels is likely to be short-lived. The Chinese government's approach toward platform companies is a structural regime shift.…
Highlights The US government issued its first-ever water-shortage declaration for the Colorado River basin in August, due to historically low water levels at the major reservoirs fed by the river (Chart of the Week). The drought producing the water shortage was connected to climate change by US officials.1 Globally, climate-change remediation efforts – e.g., carbon taxes – likely will create exogenous shocks similar to the oil-price shock of the 1970s. Remedial efforts will compete with redressing chronic underfunding of infrastructure. The US water supply infrastructure, for example, faces an investment shortfall of ~ $3.3 trillion over the next 20 years to replace aging plants and equipment, based on an analysis by the American Society of Civil Engineers (ASCE). This will translate to a $6,000 per-capita cost by 2039 if the current funding gap persists. Fluctuating weather and the increasing prevalence of droughts and floods will increase volatility in markets such as agriculture which rely on stable climate and precipitation patterns.We are getting long the FIW ETF at tonight's close. The ETF tracks the performance of equities in the ISE Clean Edge Water Index, which covers firms providing potable water and wastewater treatment technologies and services. This is a strategic recommendation. Feature A decades-long drought in the US Southwest linked by US officials to climate change will result in further water rationing in the region. The drought has reduced total Colorado River system water-storage levels to 40% of capacity – vs. 49% at the same time last year. It has drawn attention to the impact of climate change on daily life, and the acute need for remediation efforts. The US Southwest is a desert. Droughts and low water availability are facts of life in the region. The current drought began in 2012, and is forcing federal, state, and local governments to take unprecedented conservation measures. The first-ever water-shortage declaration by the US Bureau of Reclamation sets in motion remedial measures that will reduce water availability in the Lower Colorado basin starting in October (Map 1). Chart 1Drought Hits Colorado River Especially Hard
Drought Hits Colorado River Especially Hard
Drought Hits Colorado River Especially Hard
Map 1Colorado River Basin
Investing In Water Supply
Investing In Water Supply
The two largest reservoirs in the US – Lake Powell and Lake Meade, part of the massive engineering projects along the Colorado – began in the 1930s and now supply water to 40mm people in the US Southwest. Half of those people get their water from Lake Powell. Emergency rationing began in August, primarily affecting Arizona, but will be extended to the region later in the year. Lake Powell is used to hold run-off from the upper basin of the Colorado River from Colorado, New Mexico, Utah and Wyoming. Water from Powell is sent south to supply the lower-basin states of California, Arizona, and Nevada. Reduced snowpack due to weather shifts caused by climate change has reduced water levels in Powell, while falling soil-moisture levels and higher evaporation rates, contribute to the acceleration of droughts and their persistence down-river. Chart 2Southwests Exceptionally Hard Drought
Southwests Exceptionally Hard Drought
Southwests Exceptionally Hard Drought
Steadily increasing demand for water from agriculture, energy production and human activity brought on by population growth and holiday-makers have made the current drought exceptional (Chart 2). Most of the Southwest has been "abnormally dry or even drier" during 2002-05 and from 2012-20, according to the US EPA. According to data from the National Oceanic and Atmospheric Administration, most of the US Southwest was also warmer than the 1981 – 2010 average temperature during July (Map 2). The Colorado River Compact of 1922 governing the water-sharing rights of the river expires in 2026. Negotiations on the new treaties already have begun, as the seven states in the Colorado basin sort out their rights alongside huge agricultural interest, native American tribes, Mexico, and fast-growing urban centers like Las Vegas. Map 2Most Of The US Southwest Is Warmer Than Average
Investing In Water Supply
Investing In Water Supply
Global Water Emergency States around the globe are dealing with water crises as a result of climate change. "From Yemen to India, and parts of Central America to the African Sahel, about a quarter of the world's people face extreme water shortages that are fueling conflict, social unrest and migration," according to the World Economic Forum. Droughts, and more generally, changing weather patterns will make agricultural markets more volatile. Food production shortages due to unpredictable weather are compounding lingering pandemic related supply chain disruptions, leading to higher food prices (Chart 3). This could also fuel social unrest and political uncertainty. Floods in China’s Henan province - a key agriculture and pork region - inundated farms. Drought and extreme heat in North America are destroying crops in parts of Canada and the US. While flooding in July damaged Europe’s crops, the continent’s main medium-term risk, will be water scarcity.2 Droughts and extreme weather in Brazil have deep implications for agricultural markets, given the variety and quantity of products it exports. Water scarcity and an unusual succession of polar air masses caused coffee prices to rise earlier this year (Chart 4). The country is suffering from what national government agencies consider the worst drought in nearly a century. According to data from the NASA Earth Observatory, many of the agricultural states in Brazil saw more water evaporate from the ground and plants’ leaves than during normal conditions (Map 3). Chart 3The Pandemic and Changing Weather Patterns Will Keep Food Prices High
The Pandemic and Changing Weather Patterns Will Keep Food Prices High
The Pandemic and Changing Weather Patterns Will Keep Food Prices High
Chart 4Unpredictable Weather Will Increase Volatility In Markets For Agricultural Commodities
Unpredictable Weather Will Increase Volatility In Markets For Agricultural Commodities
Unpredictable Weather Will Increase Volatility In Markets For Agricultural Commodities
Map 3Brazil Is Suffering From Its Worst Drought In Nearly A Century
Investing In Water Supply
Investing In Water Supply
Agriculture itself could be part of a longer-term and irreversible problem – i.e. desertification. Irrigation required for modern day farming drains aquifers and leads to soil erosion. According to the EU, nearly a quarter of Spain’s aquifers are exploited, with agricultural states, such as Andalusia consuming 80% of the state’s total water. Irrigation intensive farming, the possibility of higher global temperatures and the increased prevalence of droughts and forest fires are conducive to soil infertility and subsequent desertification. This is a global phenomenon, with the crisis graver still in north Africa, Mozambique and Palestinian regions. Changing weather patterns could also impact the production of non-agricultural goods and services. One such instance is semiconductors, which are used in machines and devices spanning cars to mobile phones. Taiwan, home to the Taiwan Semiconductor Manufacturing Company – the world’s largest contract chipmaker - suffered from a severe drought earlier this year (Chart 5). While the drought did not seriously disrupt chipmaking, in an already tight market, the event did bring the issue of the impact of water shortages on semiconductor manufacturing to the fore. According to Sustainalytics, a typical chipmaking plant uses 2 to 4 million gallons of water per day to clean semiconductors. While wet weather has returned to Taiwan, relying on rainfall and typhoons to satisfy the chipmaking sector’s water needs going forward could lead to volatility in these markets. Chart 5Taiwan Faced Its Worst Drought In History Earlier This Year
Investing In Water Supply
Investing In Water Supply
Climate Change As A Macro Factor The scale of remediating existing environmental damage to the planet and the cost of investing in the technology required to sustain development and growth will be daunting. Unfortunately, there is not a great deal of research looking into how much of a cost households, firms and governments will incur on these fronts. Estimates of the actual price of CO2 – the policy variable most governments and policymakers focus on – range from as little as $1.30/ton to as much as $13/ton, according to the Peterson Institute for International Economics.3 PIIE's Jean Pisani-Ferry estimates the true cost is around $10/ton presently, after accounting for a lack of full reporting on costs and subsidies that reduce carbon costs. The cost of carbon likely will have to increase by an order of magnitude – to $130/ton or more over the next decade – to incentivize the necessary investment in technology required to deal with climate change and to sufficiently induce, via prices, behavioral adaptations by consumers at all levels. The PIIE notes, "… the accelerated pace of climate change and the magnitude of the effort involved in decarbonizing the economy, while at the same time investing in adaptation, the transition to net zero is likely to involve, over a 30-year period, major shifts in growth patterns." These are early days for assessing the costs and global macro effects of decarbonization. However, PIIE notes, these costs can be expected to "include a significant negative supply shock, an investment surge sizable enough to affect the global equilibrium interest rate, large adverse consumer welfare effects, distributional shifts, and substantial pressure on public finances." Much of the investment required to address climate change will be concentrated on commodity markets. Underlying structural issues, such as lack of investment in expanding supplies of metals and hydrocarbons required during the transition to net-zero CO2 emissions, will impart an upward bias to base metals, oil and natural gas prices over the next decade. We remain bullish industrial commodities broadly, as a result. Investment Implications Massive investment in infrastructure will be needed to address emerging water crises around the world. The American Society of Civil Engineers (ASCE) projects an investment shortfall of ~ $3.3 trillion over the next 20 years to replace aging water infrastructure in the US alone. This will translate to a $6,000 per-capita cost by 2039 if the current funding gap persists.4 At tonight's close we will be getting long the FIW ETF, which is focused on US-based firms providing potable water and wastewater treatment services. This ETF provides direct investment exposure to water remediation efforts and needed infrastructure modernization in the US. We also remain long commodity index exposure – the S&P GSCI and the COMT ETF – as a way to retain exposure to the higher commodity-price volatility that climate change will create in grain and food markets. This volatility will keep the balance of price risks to the upside. Robert P. Ryan Chief Commodity & Energy Strategist rryan@bcaresearch.com Ashwin Shyam Research Associate Commodity & Energy Strategy ashwin.shyam@bcaresearch.com Commodities Round-Up Energy: Bullish Hurricane Ida shut in ~ 96% of total US Gulf of Mexico (GoM) oil production. Colonial Pipeline, a major refined product artery for the US South and East coast closed a few of its lines due to the hurricane but has restarted operations since then. Since the share of US crude oil from this region has fallen, WTI and RBOB gasoline prices have only marginally increased, despite virtually zero crude oil production from the GoM (Chart 6). Prices are, however, likely to remain volatile, as energy producers in the region check for damage to infrastructure. Power outages and a pause in refining activity in the region will also feed price volatility over the coming weeks. Despite raising the 2022 demand forecast and pressure from the US, OPEC 2.0 stuck to its 400k b/d per month production hike in its meeting on Wednesday. Base Metals: Bullish A bill to increase the amount of royalties payable by copper miners in Chile was passed in the senate mining committee on Tuesday. As per the bill, taxes will be commensurate with the value of the red metal. If the bill is passed in its current format, it will disincentivize further private mining investments in the nation, warned Diego Hernandez, President of the National Society of Mining (SONAMI). Amid a prolonged drought in Chile during July, the government has outlined a plan for miners to cut water consumption from natural sources by 2050. Increased union bargaining power - due to higher copper prices -, a bill that will increase mining royalties, and environmental regulation, are putting pressure on miners in the world’s largest copper producing nation. Precious Metals: Bullish Jay Powell’s dovish remarks at the Jackson Hole Symposium were bullish for gold prices. The chairman of the US Central Bank stated the possibility of tapering asset purchases before the end of 2021 but did not provide a timeline. Powell reiterated the absence of a mechanical relationship between tapering and an interest rate hike. Raising interest rates is contingent on factors, such as the prevalence of COVID, inflation and employment levels in the US. The fact that the US economy is not close to reaching the maximum employment level, according to Powell, could keep interest rates lower for longer, supporting gold prices (Chart 7). Ags/Softs: Neutral The USDA crop Progress Report for the week ending August 29th reported 60% of the corn crop was good to excellent quality, marginally down by 2% vs comparable dates in 2020. Soybean crop quality on the other hand was down 11% from a year ago and was recorded at 56%. Chart 6
Investing In Water Supply
Investing In Water Supply
Chart 7
Weaker Real Rates Bullish For Gold
Weaker Real Rates Bullish For Gold
Footnotes 1 Please see Reclamation announces 2022 operating conditions for Lake Powell and Lake Mead; Historic Drought Impacting Entire Colorado River Basin. Released by the US Bureau of Reclamation on August 16, 2021. 2 Please refer to Water stress is the main medium-term climate risk for Europe’s biggest economies, S&P Global, published on August 13, 2021. 3 Please see 21-20 Climate Policy is Macroeconomic Policy, and the Implications Will Be Significant by Jean Pisani-Ferry, which was published in August 2021. 4 Please see The Economic Benefits of Investing in Water Infrastructure, published by the ASCE and The Value of Water Campaign on August 26, 2020. Investment Views and Themes Recommendations Strategic Recommendations Commodity Prices and Plays Reference Table Trades Closed in 2021 Summary of Closed Trades
Highlights Regulatory changes affecting Chinese platform companies are structural – rather than transitory – in nature. These companies might become quasi-SOEs and could be used by the government to achieve its national and geopolitical objectives. China’s regulatory clampdown will produce structurally lower corporate profitability and, thereby, reduce equity valuations for Chinese TMT companies. Chinese policymakers have begun easing monetary and fiscal policies. Money and credit growth will likely bottom in December or so. However, as in H2 2018 and H1 2019, policy will be eased only gradually. During this period EM ex-TMT stocks and industrial metal prices performed poorly. Mainstream EM (countries outside North Asia) will continue suffering from weak growth and rising political volatility, warranting a higher risk premium. The risk-reward tradeoff for EM financial markets is poor. Feature Over the past several days, I have held calls and roundtables with clients located in the EMEA region. In this report, we will share our answers to the most common client questions. Many clients were asking if the selloff in Chinese platform companies is nearing its end or whether much more weakness is to be expected. It is not surprising that with the Hang Seng Tech index down 35% from its February highs, there is great temptation to engage in bottom fishing. So, we start with questions relating to this topic. Chart 1Is This Time Different For Chinese TMT Stocks?
Is This Time Different For Chinese TMT Stocks?
Is This Time Different For Chinese TMT Stocks?
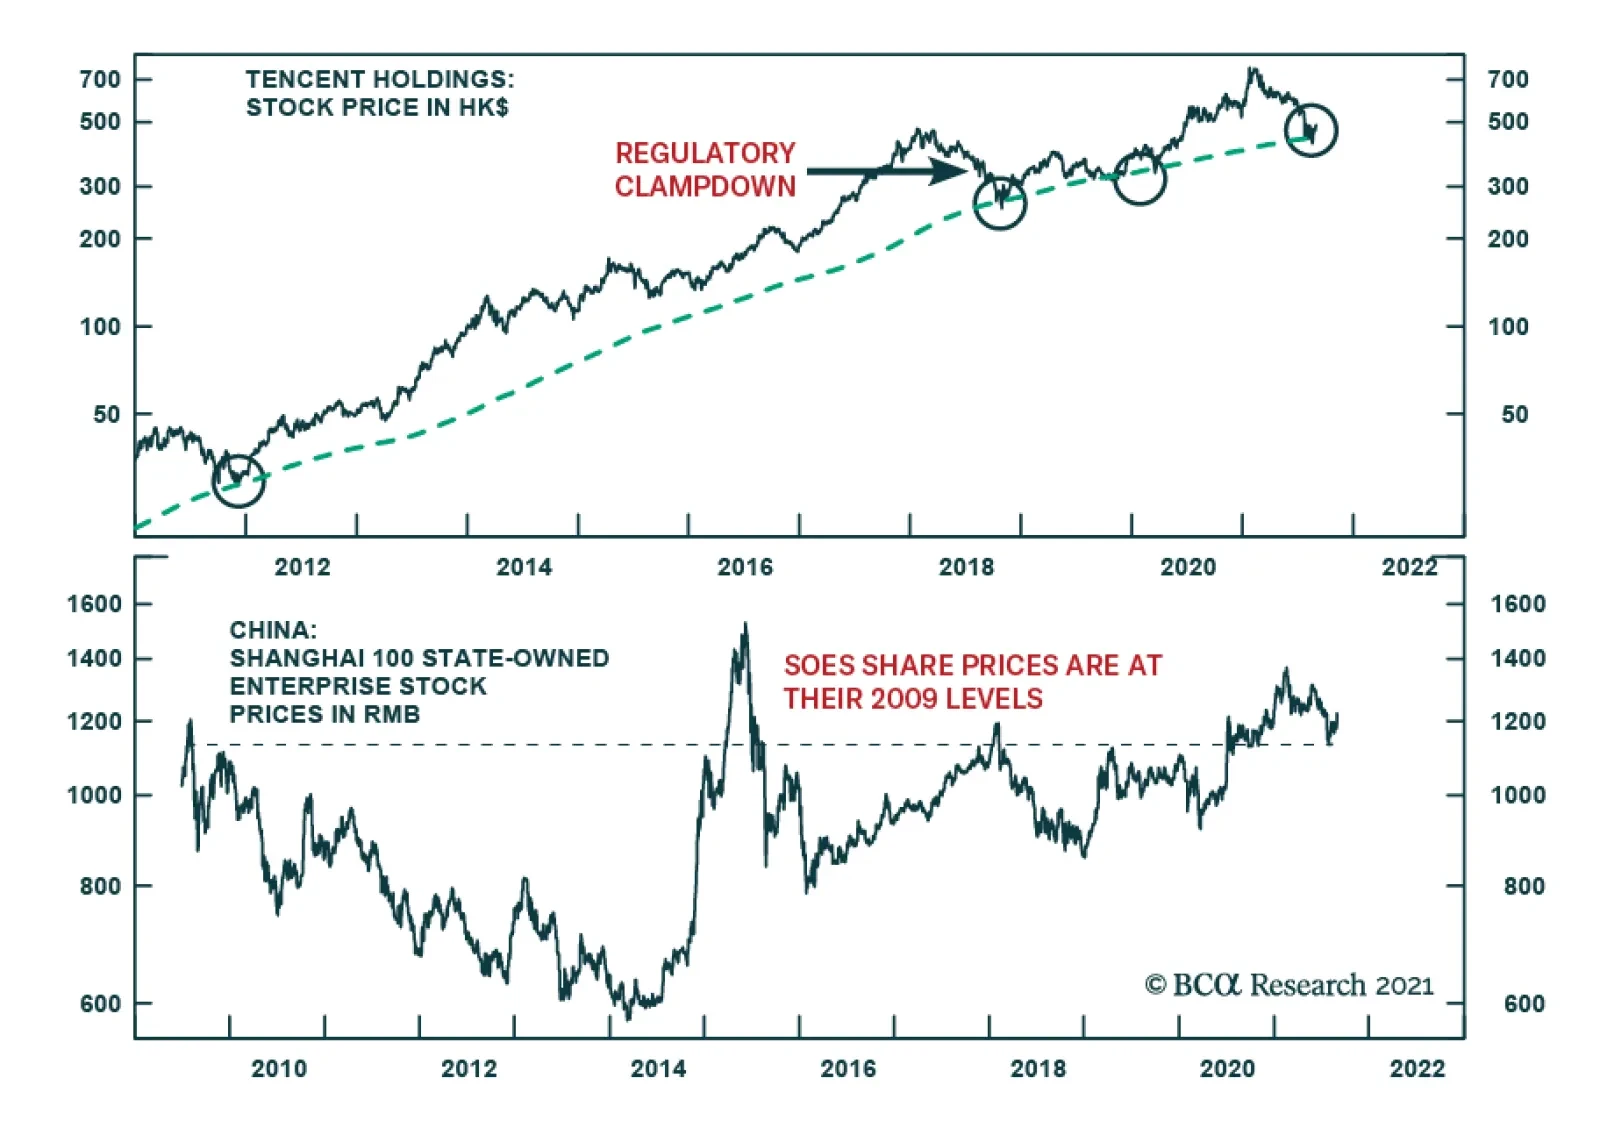
Question: In 2018, the regulatory clampdown on Tencent and other video game companies lasted several months and created a major pullback in their share prices (Chart 1). However, authorities ultimately removed restrictions and these stocks rallied to new highs. Do you expect the same dynamics to emerge this time around? And if not, why? We are witnessing a structural regime shift in the Chinese government’s approach toward platform companies. These changes are much more profound and long lasting than those in 2018. They herald structurally lower corporate profitability and equity multiples for Chinese TMT companies. For these stocks, a bounce from oversold levels is possible over the near term and it could be sharp. However, the rebound will be short-lived, i.e., a cyclical or secular rally is unlikely. Investors – who have not sold – should use this rebound to pare back exposure to Chinese TMT stocks. Chart 2Chinese SOEs: Lackluster Share Price Performance
Chinese SOEs: Lackluster Share Price Performance
Chinese SOEs: Lackluster Share Price Performance
Going forward, these platform companies will be managed in a similar fashion to Chinese state-owned enterprises (SOEs): with the interest of the entire nation in mind, and shareholder interests will take a back seat. China’s SOEs trade at very low multiples and their share prices have been treading water since 2009 (Chart 2). The secular bull market in Chinese TMT share prices is over and more de-rating is likely for the following reasons: Chinese platform/new economy companies possess unique big data that are important to the country’s development. Protecting big data becomes a priority in an era of US-China geopolitical confrontation and amid the elevated risk of cyber attacks. As a result, it is essential for the Chinese government to control companies that possesses big data. Limiting foreign shareholders’ access and decision making in regard to big data is also imperative. We do not believe that Chinese authorities will ever allow these new economy companies to operate as freely as they have in the past. Given platform company importance to both the domestic economy and geopolitical confrontation with the US, we will not be surprised if the government eventually establishes effective control over these platform companies – probably via its affiliated entities. Many of these platform companies are natural monopolies or oligopolies and their profitability should be regulated by authorities according to free market economic textbooks. We discussed this point in the recent report titled Chinese TMT Stocks: A Bad Dream Or A New Reality? Please click on the link to open the report. Going forward, return on equity will be lower than in the past for these stocks, heralding lower valuation multiples. Stocks of many Chinese platform companies trade in the US and are largely owned by US/international (non-Chinese) investors. Neither US nor Chinese authorities want to see shares of Chinese TMT companies trade in the US, albeit for completely different reasons. Chinese authorities want these companies to release little information to their foreign shareholders, especially regarding big data. In turn, the US securities regulator is keen for US investors not to be exposed to the risks of owning Chinese stocks for two main reasons: (1) these companies do not disclose full information and (2) China’s government meddles with the management of these enterprises. Given that authorities from both countries do not support the trading of Chinese stocks in the US, odds are high that the trading of Chinese TMT companies will move from the US to Hong Kong. Moreover, US authorities may recommend US funds avoid owing Chinese stocks. In short, increased government control over Chinese TMT companies and rising geopolitical tensions between the US and the Middle Kingdom may prompt many foreign investors to reduce their exposure to these stocks. This will have negative ramifications on their share prices. Chart 3Little Volatility Spillover From Offshore Into China's Onshore Markets
Little Volatility Spillover From Offshore Into China's Onshore Markets
Little Volatility Spillover From Offshore Into China's Onshore Markets
Question: Don’t you think Chinese authorities may reverse their regulatory clampdown given that Chinese share prices have already dropped a great deal and further weakness could hurt investor and business sentiment? Chinese authorities will not reverse regulatory tightening on platform companies. If investor and business confidence on the mainland is hurt materially, regulators will reduce the intensity of their reforms but will not reverse them. Importantly, the carnage has so far been limited to Chinese offshore financial markets (Chart 3). Neither the onshore equity indexes, nor onshore corporate bonds have sold off much (Chart 3). The majority of platform companies are listed offshore and plunging share prices hurt foreign shareholders more than domestic retail and institutional investors. There is little reason for Chinese policymakers to worry about losses among foreign investors so long as the carnage does not spread to onshore markets. Question: Why would Chinese authorities damage their largest and most successful companies in the new economy sectors? Are they not critical amidst the US-China confrontation? Chinese policymakers understand the importance of platform companies to the country’s domestic growth outlook as well as its geopolitical ambitions. This explains why Chinese authorities seek to establish effective control over decision making in these companies. We elaborated on the strategic importance of big data above. Also, the largest platform companies, such as Alibaba, Tencent and Meituan, have in recent years been acquiring stakes in numerous businesses in Southeast Asia. Beijing might be thinking of using these platform companies to raise its geopolitical influence over other Asian nations and beyond. Many Asian nations will play a prominent role in the US-China confrontation. Whether they side with China or the US will affect the balance of geopolitical power in the region. In this context, having control over soft infrastructure (payment and data systems, among others) in these Asian economies will give Beijing a chance to influence their geopolitical choices, thereby giving China an advantage over the US. Therefore, the Chinese central government might be aiming to establish an effective control over these companies’ strategic decisions. In such a case, shareholder interests will take a back seat in these companies. Question: What about common prosperity initiatives and policies that the Chinese leadership has unveiled in recent weeks? Why now? President Xi will be elected for his third term in the fall of 2022. This constitutes a major political precedent in the Middle Kingdom’s modern history. President Xi wants to secure his support from the bulk of the population. Common prosperity policies entail income and wealth distribution from high-income to middle- and low-income households. Chart 4 and Chart 5 illustrate that there has so far been no equalization of income and wealth distribution. Chart 4China: Income Disparity Has Not Been Narrowing
What Clients Are Asking
What Clients Are Asking
Chart 5Wealth Concentration Remains High In China
Wealth Concentration Remains High In China
Wealth Concentration Remains High In China
It is imperative for President Xi to achieve a meaningful change in income and wealth distribution in the next 12 months before his third term. President Xi’s power stems not from the top 10% of the population but from the remaining (and less wealthy) 90%. Hence, there will be little easing in the push toward common prosperity. If anything, the pace of these initiatives could escalate going forward. As a part of the common prosperity initiatives, companies with excess profitability will be compelled to perform a national duty in the form of financing social programs or providing donations. Large platform companies have already begun making large donations. This trend will intensify in the months ahead. In brief, profits will be distributed away from shareholders of these companies in favor of the general well-being of society. The positive is that low- and middle-income consumer spending in China will be supported by income transfer from companies and wealthy individuals. As a result, investors should favor the companies that sell to low- and middle-income households. Chart 6Chinese Growth Stocks Are Not Yet Cheap
Chinese Growth Stocks Are Not Yet Cheap
Chinese Growth Stocks Are Not Yet Cheap
Going forward, the model of SOEs in China or Russia will be applicable to Chinese platform companies. SOEs in China, Russia and other EM countries often perform national duties at the expense of shareholders. Not surprisingly, their stocks have been trading at much lower multiples than private companies. Presently, Chinese TMT/growth stocks trade at a trailing P/E ratio of 33.5 (Chart 6). We do not expect platform companies’ P/E ratio to drop to the level of SOEs. However, a trailing P/E ratio of 33.5 for China’s TMT companies is still high given: the uncertainty around future business models; a lack of clarity around (still evolving) new regulation; government involvement in their management; the prioritization of national and geopolitical objectives over shareholder interest. Chart 7Mind These Gaps
Mind These Gaps
Mind These Gaps
Question: Isn’t the slowdown in China’s business cycle already well known and priced in related financial markets? Yes, it is well known but we do not think it has been priced in China-exposed plays. There are several market relationships and indicators that lead us to believe so. Both panels in Chart 7 illustrate that industrial metals prices have diverged from the Chinese manufacturing PMI and onshore government bond yields. The latter two variables project the Chinese business cycle. Such a decoupling is unsustainable given that China accounts for 55% of global industrial metal consumption. We continue to expect meaningful downside in industrial metals prices which would hurt EM countries exporting commodities. China’s credit and fiscal spending impulse leads its business cycle by nine months and suggests that economic data will be weakening until Q2 2022 (Chart 8). Finally, net EPS revisions for EM-listed companies remain elevated (Chart 9). Chart 8China's Business Cycle Will Continue Decelerating Well Into Q1 2022
China's Business Cycle Will Continue Decelerating Well Into Q1 2022
China's Business Cycle Will Continue Decelerating Well Into Q1 2022
Chart 9EM EPS Growth Expectations Have Not Yet Been Downgraded
EM EPS Growth Expectations Have Not Yet Been Downgraded
EM EPS Growth Expectations Have Not Yet Been Downgraded
That said, one sentiment indicator that has dropped significantly and is now near its level during previous EM equity lows is the Sentix European investor sentiment index on EM equities (Chart 10). Chart 10European Investor Sentiment On EM Stocks Is Back To Its Previous Lows
European Investor Sentiment On EM Stocks Is Back To Its Previous Lows
European Investor Sentiment On EM Stocks Is Back To Its Previous Lows
Net-net, the risk-reward tradeoff for EM equities and credit markets is not yet attractive. Chinese TMT stocks are vulnerable for reasons discussed above while EM financial markets exposed to China’s old economy are at risk due to decelerating Chinese economic growth. Question: When will authorities in China ease policy? What does it imply for Chinese and EM financial markets? Shouldn’t investors buy China/EM assets now in anticipation of macro policy easing in China? Yes, China has already started easing credit and fiscal policy and will ease more in the coming months. Chart 11 reveals that banks’ excess reserves at the PBOC have turned up and they lead the credit impulse by six months. In turn, the Chinese credit impulse in turn leads EM share price cycles by nine months (Chart 12). Chart 11China's Credit Impulse Will Bottom In Late 2021
China's Credit Impulse Will Bottom In Late 2021
China's Credit Impulse Will Bottom In Late 2021
Chart 12EM Equities Are Not Yet Out Of The Woods
EM Equities Are Not Yet Out Of The Woods
EM Equities Are Not Yet Out Of The Woods
All in all, even though Chinese policymakers have begun easing credit and fiscal policy, financial markets leveraged to the mainland’s old economy could still suffer as growth continues to disappoint in the months to come. Chart 13Chinese Easing In H2 2018 And H1 2019 Did Not Help Much EM Stocks And Metal Prices
Chinese Easing In H2 2018 and H1 2019 Did Not Help Much EM Stocks And Metal Prices
Chinese Easing In H2 2018 and H1 2019 Did Not Help Much EM Stocks And Metal Prices
Importantly, policy easing will be implemented gradually, as in H2 2018 and H1 2019. During this period EM ex-TMT stocks and industrial metal prices performed poorly despite policy easing in China (Chart 13). Question: Given improvements in vaccine availability worldwide, will EM countries close their vaccination gap with developed countries in the coming months? If yes, wouldn’t it allow their economies to catch up, and their financial markets to outperform their DM peers? EM vaccination rates will rise as vaccines become available to developing countries. However, mainstream EM vaccination rates will still remain below those of advanced economies. This gap is due to higher levels of mistrust toward governments in developing countries than in advanced ones. Therefore, the pandemic will continue capping economic activity in mainstream EM. Importantly, the lack of fiscal stimulus, monetary policy tightening and weak banking systems in mainstream EM (i.e., excluding China, Korea and Taiwan) herald weak income and domestic demand growth in these economies. Years of poor income growth and lasting pandemic damage have caused political volatility to flare-up in some countries such as Colombia, Peru, Brazil, South Africa and Malaysia. This trend will likely continue foreshowing a higher risk premium in EM financial markets. Question: What is your inflation outlook for mainstream EM (excluding North Asia)? Will inflation continue to surprise to the upside and will their central banks hike rates enough so that their currencies do not depreciate? We discussed the inflation dynamics and the outlook for local rates for EM in the August 12 report. While commodity price inflation will subside, renewed currency deprecation is the key risk to the inflation outlook in mainstream EM. EM currencies will depreciate because China’s continued slowdown is bearish for EM currencies but bullish for the greenback. The basis is that the US sells little to China while EM are exposed to the Chinese business cycle. Also, domestic demand in mainstream EM will disappoint. That, along with rising political volatility, is negative for their currencies. Finally, high local rates in mainstream EM have often coincided with currency depreciation rather than appreciation. Question: What is the biggest risk in your view? The biggest risk to our view has been and remains TINA (There Is No Alternative). We have strong conviction on fundamentals but very little conviction on fund flows. Given that DM equity and credit markets are expensive and their government bond yields are very depressed, portfolio capital can go into EM financial markets that offer lower valuation than their DM counterparts even though they are not cheap in absolute terms. Our methodology is that fundamentals drive flows in the medium- to-long term. However, with the global financial system flush with liquidity, the importance of fundamentals has declined in recent years. Therefore, we are cognizant that EM markets might not sell off a lot and could bottom at a higher level than warranted by fundamentals. Still, we expect more downside in the coming months because fundamentals are much worse than most investors realize. Chart 14EM Credit Will Continue Underperforming Their US Peers
EM Credit Will Continue Underperforming Their US Peers
EM Credit Will Continue Underperforming Their US Peers
Question: What is your recommended strategy across EM equities, currencies, and fixed-income markets? Global equity portfolios should continue underweighting EM, a recommendation from March 25, 2021. Within the EM equity universe, our overweights are Korea, India, China (preferring onshore to offshore equities), Mexico and Chile. Our underweights are Brazil, Colombia, Peru, South Africa, Turkey, the Philippines and Indonesia. The risk-reward tradeoff for EM currencies remains poor. We continue shorting a basket of BRL, CLP, COP, PEN, ZAR, TRY, PHP, THB and KRW versus the US dollar. Within local markets we overweight Mexico, Russia, Korea, Malaysia, India, China and Chile. Regarding sovereign and corporate credit, we have downgraded EM credit versus US credit on March 25 and this strategy remains intact (Chart 14). The lists of our overweights, underweights and the ones warranting neutral allocation in EM equity, domestic bonds and credit portfolios are presented below and can always be found on the EMS website. Arthur Budaghyan Chief Emerging Markets Strategist arthurb@bcaresearch.com Footnotes
Highlights Regulatory changes affecting Chinese platform companies are structural – rather than transitory – in nature. These companies might become quasi-SOEs and could be used by the government to achieve its national and geopolitical objectives. China’s regulatory clampdown will produce structurally lower corporate profitability and, thereby, reduce equity valuations for Chinese TMT companies. Chinese policymakers have begun easing monetary and fiscal policies. Money and credit growth will likely bottom in December or so. However, as in H2 2018 and H1 2019, policy will be eased only gradually. During this period EM ex-TMT stocks and industrial metal prices performed poorly. Mainstream EM (countries outside North Asia) will continue suffering from weak growth and rising political volatility, warranting a higher risk premium. The risk-reward tradeoff for EM financial markets is poor. Feature Over the past several days, I have held calls and roundtables with clients located in the EMEA region. In this report, we will share our answers to the most common client questions. Many clients were asking if the selloff in Chinese platform companies is nearing its end or whether much more weakness is to be expected. It is not surprising that with the Hang Seng Tech index down 35% from its February highs, there is great temptation to engage in bottom fishing. So, we start with questions relating to this topic. Chart 1Is This Time Different For Chinese TMT Stocks?
Is This Time Different For Chinese TMT Stocks?
Is This Time Different For Chinese TMT Stocks?
Question: In 2018, the regulatory clampdown on Tencent and other video game companies lasted several months and created a major pullback in their share prices (Chart 1). However, authorities ultimately removed restrictions and these stocks rallied to new highs. Do you expect the same dynamics to emerge this time around? And if not, why? We are witnessing a structural regime shift in the Chinese government’s approach toward platform companies. These changes are much more profound and long lasting than those in 2018. They herald structurally lower corporate profitability and equity multiples for Chinese TMT companies. For these stocks, a bounce from oversold levels is possible over the near term and it could be sharp. However, the rebound will be short-lived, i.e., a cyclical or secular rally is unlikely. Investors – who have not sold – should use this rebound to pare back exposure to Chinese TMT stocks. Chart 2Chinese SOEs: Lackluster Share Price Performance
Chinese SOEs: Lackluster Share Price Performance
Chinese SOEs: Lackluster Share Price Performance
Going forward, these platform companies will be managed in a similar fashion to Chinese state-owned enterprises (SOEs): with the interest of the entire nation in mind, and shareholder interests will take a back seat. China’s SOEs trade at very low multiples and their share prices have been treading water since 2009 (Chart 2). The secular bull market in Chinese TMT share prices is over and more de-rating is likely for the following reasons: Chinese platform/new economy companies possess unique big data that are important to the country’s development. Protecting big data becomes a priority in an era of US-China geopolitical confrontation and amid the elevated risk of cyber attacks. As a result, it is essential for the Chinese government to control companies that possesses big data. Limiting foreign shareholders’ access and decision making in regard to big data is also imperative. We do not believe that Chinese authorities will ever allow these new economy companies to operate as freely as they have in the past. Given platform company importance to both the domestic economy and geopolitical confrontation with the US, we will not be surprised if the government eventually establishes effective control over these platform companies – probably via its affiliated entities. Many of these platform companies are natural monopolies or oligopolies and their profitability should be regulated by authorities according to free market economic textbooks. We discussed this point in the recent report titled Chinese TMT Stocks: A Bad Dream Or A New Reality? Please click on the link to open the report. Going forward, return on equity will be lower than in the past for these stocks, heralding lower valuation multiples. Stocks of many Chinese platform companies trade in the US and are largely owned by US/international (non-Chinese) investors. Neither US nor Chinese authorities want to see shares of Chinese TMT companies trade in the US, albeit for completely different reasons. Chinese authorities want these companies to release little information to their foreign shareholders, especially regarding big data. In turn, the US securities regulator is keen for US investors not to be exposed to the risks of owning Chinese stocks for two main reasons: (1) these companies do not disclose full information and (2) China’s government meddles with the management of these enterprises. Given that authorities from both countries do not support the trading of Chinese stocks in the US, odds are high that the trading of Chinese TMT companies will move from the US to Hong Kong. Moreover, US authorities may recommend US funds avoid owing Chinese stocks. In short, increased government control over Chinese TMT companies and rising geopolitical tensions between the US and the Middle Kingdom may prompt many foreign investors to reduce their exposure to these stocks. This will have negative ramifications on their share prices. Chart 3Little Volatility Spillover From Offshore Into China's Onshore Markets
Little Volatility Spillover From Offshore Into China's Onshore Markets
Little Volatility Spillover From Offshore Into China's Onshore Markets
Question: Don’t you think Chinese authorities may reverse their regulatory clampdown given that Chinese share prices have already dropped a great deal and further weakness could hurt investor and business sentiment? Chinese authorities will not reverse regulatory tightening on platform companies. If investor and business confidence on the mainland is hurt materially, regulators will reduce the intensity of their reforms but will not reverse them. Importantly, the carnage has so far been limited to Chinese offshore financial markets (Chart 3). Neither the onshore equity indexes, nor onshore corporate bonds have sold off much (Chart 3). The majority of platform companies are listed offshore and plunging share prices hurt foreign shareholders more than domestic retail and institutional investors. There is little reason for Chinese policymakers to worry about losses among foreign investors so long as the carnage does not spread to onshore markets. Question: Why would Chinese authorities damage their largest and most successful companies in the new economy sectors? Are they not critical amidst the US-China confrontation? Chinese policymakers understand the importance of platform companies to the country’s domestic growth outlook as well as its geopolitical ambitions. This explains why Chinese authorities seek to establish effective control over decision making in these companies. We elaborated on the strategic importance of big data above. Also, the largest platform companies, such as Alibaba, Tencent and Meituan, have in recent years been acquiring stakes in numerous businesses in Southeast Asia. Beijing might be thinking of using these platform companies to raise its geopolitical influence over other Asian nations and beyond. Many Asian nations will play a prominent role in the US-China confrontation. Whether they side with China or the US will affect the balance of geopolitical power in the region. In this context, having control over soft infrastructure (payment and data systems, among others) in these Asian economies will give Beijing a chance to influence their geopolitical choices, thereby giving China an advantage over the US. Therefore, the Chinese central government might be aiming to establish an effective control over these companies’ strategic decisions. In such a case, shareholder interests will take a back seat in these companies. Question: What about common prosperity initiatives and policies that the Chinese leadership has unveiled in recent weeks? Why now? President Xi will be elected for his third term in the fall of 2022. This constitutes a major political precedent in the Middle Kingdom’s modern history. President Xi wants to secure his support from the bulk of the population. Common prosperity policies entail income and wealth distribution from high-income to middle- and low-income households. Chart 4 and Chart 5 illustrate that there has so far been no equalization of income and wealth distribution. Chart 4China: Income Disparity Has Not Been Narrowing
What Clients Are Asking
What Clients Are Asking
Chart 5Wealth Concentration Remains High In China
Wealth Concentration Remains High In China
Wealth Concentration Remains High In China
It is imperative for President Xi to achieve a meaningful change in income and wealth distribution in the next 12 months before his third term. President Xi’s power stems not from the top 10% of the population but from the remaining (and less wealthy) 90%. Hence, there will be little easing in the push toward common prosperity. If anything, the pace of these initiatives could escalate going forward. As a part of the common prosperity initiatives, companies with excess profitability will be compelled to perform a national duty in the form of financing social programs or providing donations. Large platform companies have already begun making large donations. This trend will intensify in the months ahead. In brief, profits will be distributed away from shareholders of these companies in favor of the general well-being of society. The positive is that low- and middle-income consumer spending in China will be supported by income transfer from companies and wealthy individuals. As a result, investors should favor the companies that sell to low- and middle-income households. Chart 6Chinese Growth Stocks Are Not Yet Cheap
Chinese Growth Stocks Are Not Yet Cheap
Chinese Growth Stocks Are Not Yet Cheap
Going forward, the model of SOEs in China or Russia will be applicable to Chinese platform companies. SOEs in China, Russia and other EM countries often perform national duties at the expense of shareholders. Not surprisingly, their stocks have been trading at much lower multiples than private companies. Presently, Chinese TMT/growth stocks trade at a trailing P/E ratio of 33.5 (Chart 6). We do not expect platform companies’ P/E ratio to drop to the level of SOEs. However, a trailing P/E ratio of 33.5 for China’s TMT companies is still high given: the uncertainty around future business models; a lack of clarity around (still evolving) new regulation; government involvement in their management; the prioritization of national and geopolitical objectives over shareholder interest. Chart 7Mind These Gaps
Mind These Gaps
Mind These Gaps
Question: Isn’t the slowdown in China’s business cycle already well known and priced in related financial markets? Yes, it is well known but we do not think it has been priced in China-exposed plays. There are several market relationships and indicators that lead us to believe so. Both panels in Chart 7 illustrate that industrial metals prices have diverged from the Chinese manufacturing PMI and onshore government bond yields. The latter two variables project the Chinese business cycle. Such a decoupling is unsustainable given that China accounts for 55% of global industrial metal consumption. We continue to expect meaningful downside in industrial metals prices which would hurt EM countries exporting commodities. China’s credit and fiscal spending impulse leads its business cycle by nine months and suggests that economic data will be weakening until Q2 2022 (Chart 8). Finally, net EPS revisions for EM-listed companies remain elevated (Chart 9). Chart 8China's Business Cycle Will Continue Decelerating Well Into Q1 2022
China's Business Cycle Will Continue Decelerating Well Into Q1 2022
China's Business Cycle Will Continue Decelerating Well Into Q1 2022
Chart 9EM EPS Growth Expectations Have Not Yet Been Downgraded
EM EPS Growth Expectations Have Not Yet Been Downgraded
EM EPS Growth Expectations Have Not Yet Been Downgraded
That said, one sentiment indicator that has dropped significantly and is now near its level during previous EM equity lows is the Sentix European investor sentiment index on EM equities (Chart 10). Chart 10European Investor Sentiment On EM Stocks Is Back To Its Previous Lows
European Investor Sentiment On EM Stocks Is Back To Its Previous Lows
European Investor Sentiment On EM Stocks Is Back To Its Previous Lows
Net-net, the risk-reward tradeoff for EM equities and credit markets is not yet attractive. Chinese TMT stocks are vulnerable for reasons discussed above while EM financial markets exposed to China’s old economy are at risk due to decelerating Chinese economic growth. Question: When will authorities in China ease policy? What does it imply for Chinese and EM financial markets? Shouldn’t investors buy China/EM assets now in anticipation of macro policy easing in China? Yes, China has already started easing credit and fiscal policy and will ease more in the coming months. Chart 11 reveals that banks’ excess reserves at the PBOC have turned up and they lead the credit impulse by six months. In turn, the Chinese credit impulse in turn leads EM share price cycles by nine months (Chart 12). Chart 11China's Credit Impulse Will Bottom In Late 2021
China's Credit Impulse Will Bottom In Late 2021
China's Credit Impulse Will Bottom In Late 2021
Chart 12EM Equities Are Not Yet Out Of The Woods
EM Equities Are Not Yet Out Of The Woods
EM Equities Are Not Yet Out Of The Woods
All in all, even though Chinese policymakers have begun easing credit and fiscal policy, financial markets leveraged to the mainland’s old economy could still suffer as growth continues to disappoint in the months to come. Chart 13Chinese Easing In H2 2018 And H1 2019 Did Not Help Much EM Stocks And Metal Prices
Chinese Easing In H2 2018 and H1 2019 Did Not Help Much EM Stocks And Metal Prices
Chinese Easing In H2 2018 and H1 2019 Did Not Help Much EM Stocks And Metal Prices
Importantly, policy easing will be implemented gradually, as in H2 2018 and H1 2019. During this period EM ex-TMT stocks and industrial metal prices performed poorly despite policy easing in China (Chart 13). Question: Given improvements in vaccine availability worldwide, will EM countries close their vaccination gap with developed countries in the coming months? If yes, wouldn’t it allow their economies to catch up, and their financial markets to outperform their DM peers? EM vaccination rates will rise as vaccines become available to developing countries. However, mainstream EM vaccination rates will still remain below those of advanced economies. This gap is due to higher levels of mistrust toward governments in developing countries than in advanced ones. Therefore, the pandemic will continue capping economic activity in mainstream EM. Importantly, the lack of fiscal stimulus, monetary policy tightening and weak banking systems in mainstream EM (i.e., excluding China, Korea and Taiwan) herald weak income and domestic demand growth in these economies. Years of poor income growth and lasting pandemic damage have caused political volatility to flare-up in some countries such as Colombia, Peru, Brazil, South Africa and Malaysia. This trend will likely continue foreshowing a higher risk premium in EM financial markets. Question: What is your inflation outlook for mainstream EM (excluding North Asia)? Will inflation continue to surprise to the upside and will their central banks hike rates enough so that their currencies do not depreciate? We discussed the inflation dynamics and the outlook for local rates for EM in the August 12 report. While commodity price inflation will subside, renewed currency deprecation is the key risk to the inflation outlook in mainstream EM. EM currencies will depreciate because China’s continued slowdown is bearish for EM currencies but bullish for the greenback. The basis is that the US sells little to China while EM are exposed to the Chinese business cycle. Also, domestic demand in mainstream EM will disappoint. That, along with rising political volatility, is negative for their currencies. Finally, high local rates in mainstream EM have often coincided with currency depreciation rather than appreciation. Question: What is the biggest risk in your view? The biggest risk to our view has been and remains TINA (There Is No Alternative). We have strong conviction on fundamentals but very little conviction on fund flows. Given that DM equity and credit markets are expensive and their government bond yields are very depressed, portfolio capital can go into EM financial markets that offer lower valuation than their DM counterparts even though they are not cheap in absolute terms. Our methodology is that fundamentals drive flows in the medium- to-long term. However, with the global financial system flush with liquidity, the importance of fundamentals has declined in recent years. Therefore, we are cognizant that EM markets might not sell off a lot and could bottom at a higher level than warranted by fundamentals. Still, we expect more downside in the coming months because fundamentals are much worse than most investors realize. Chart 14EM Credit Will Continue Underperforming Their US Peers
EM Credit Will Continue Underperforming Their US Peers
EM Credit Will Continue Underperforming Their US Peers
Question: What is your recommended strategy across EM equities, currencies, and fixed-income markets? Global equity portfolios should continue underweighting EM, a recommendation from March 25, 2021. Within the EM equity universe, our overweights are Korea, India, China (preferring onshore to offshore equities), Mexico and Chile. Our underweights are Brazil, Colombia, Peru, South Africa, Turkey, the Philippines and Indonesia. The risk-reward tradeoff for EM currencies remains poor. We continue shorting a basket of BRL, CLP, COP, PEN, ZAR, TRY, PHP, THB and KRW versus the US dollar. Within local markets we overweight Mexico, Russia, Korea, Malaysia, India, China and Chile. Regarding sovereign and corporate credit, we have downgraded EM credit versus US credit on March 25 and this strategy remains intact (Chart 14). The lists of our overweights, underweights and the ones warranting neutral allocation in EM equity, domestic bonds and credit portfolios are presented below and can always be found on the EMS website. Arthur Budaghyan Chief Emerging Markets Strategist arthurb@bcaresearch.com Equities Recommendations Currencies, Credit And Fixed-Income Recommendations
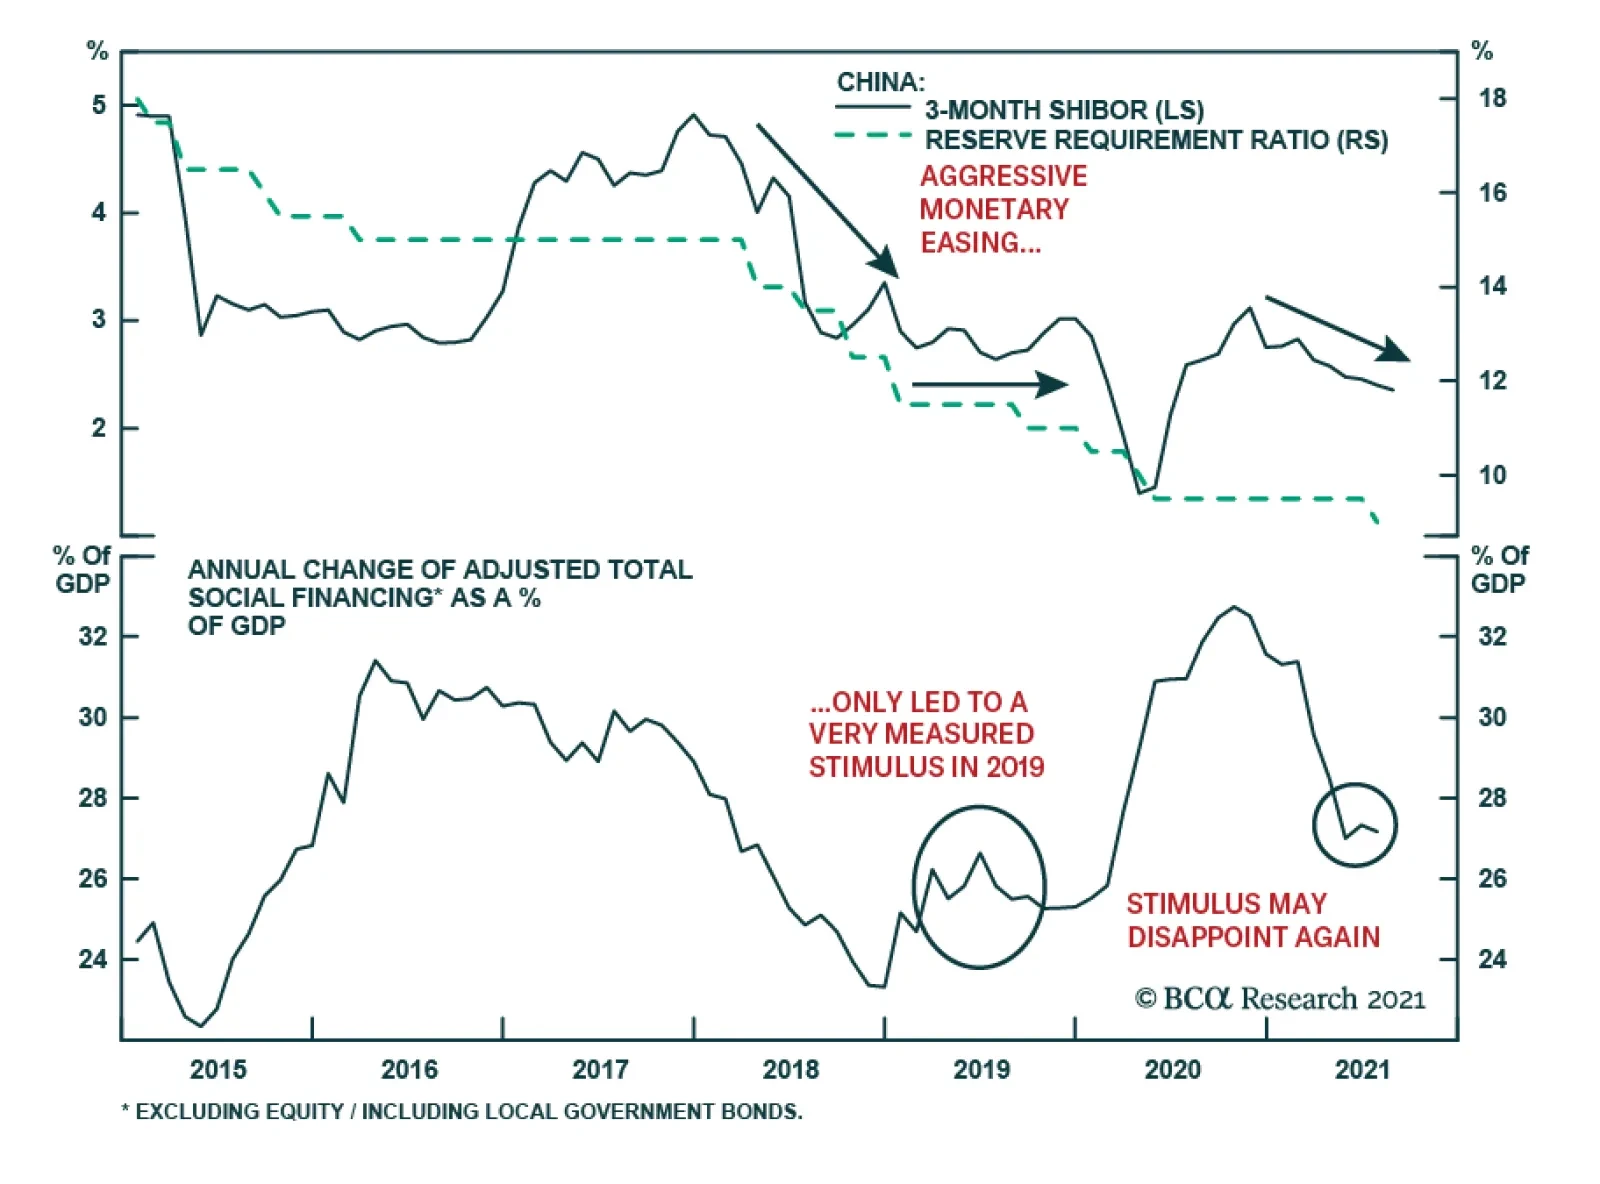
According to BCA Research's China Investment Strategy service, Chinese leaders' response during the 2018/19 Sino-US trade war may be a roadmap for policy direction in the next 12 months. China's policy shift to a cross-cyclical stance has gained more…
Highlights China’s credit tightening may have surpassed maximum strength. Monetary policy will remain accommodative and fiscal policy will become more supportive in the rest of the year. However, overall regulatory oversight is still restrictive, limiting the scope of reflationary effects on the economy. There were signs that the “cross-cyclical” approach – a new catchphrase from the July Politburo meeting - emerged even before the start of the pandemic. The current policy backdrop resembles the situation in 2H2018. China’s new “common prosperity” plan, which sets up guidance for long-term policy direction, will likely have cyclical implications. Chinese investable stocks are in oversold territory and will probably rebound in the near term. In the next 6 to 12 months, however, we remain cautious given the lack of a catalyst to revive investor sentiment. Feature Chart 1Chinese Stocks Are Oversold In Absolute Terms
Chinese Stocks Are Oversold In Absolute Terms
Chinese Stocks Are Oversold In Absolute Terms
China’s economic momentum has slowed, while regulatory crackdowns show no signs of dissipating. Meanwhile, Chinese investable stocks in absolute terms have slumped into technically oversold territory (Chart 1). Global investors are looking at fiscal and monetary policy easing for clues to what may be next. A shift in policy direction from restrictive to reflationary will help to shore up market sentiment and the outlook for the economy. Fiscal policy implementation in 1H21 was tighter than budgeted, leaving room for more support in 2H21. The PBoC’s unexpected reserve requirement ratio (RRR) cut in early July may have been a signal that policy tightening has ended. In short, China’s financial tightening has most likely passed its peak strength. Chart 2Valuations Are Almost Back To 2018 Lows
Valuations Are Almost Back To 2018 Lows
Valuations Are Almost Back To 2018 Lows
We have no doubt that China will announce some compensatory measures in the coming months in response to rising downward pressures on the domestic economy. However, we continue to hold the view that the bar for a fresh round of material stimulus is higher today than it was in the past. The policy focus pivoting from a countercyclical to cross-cyclical adjustment, the rising emphasis on common prosperity, and the ongoing regulatory clampdowns in an array of industries, all limit the extent to which authorities can deploy the expected magnitude in infrastructure spending and bank lending. Therefore, we continue to recommend investors remain underweight Chinese stocks versus their global peers – a stance we have maintained since earlier this year – despite cheapened relative valuations in Chinese equities (Chart 2). Shifting To A Cross-Cycle Approach China’s policy shift to a cross-cyclical stance has gained more market attention since the late-July Politburo meeting. However, there were signs that the cross-cyclical approach emerged even before the start of the pandemic. Chart 3Size Of Stimulus Was Already Getting Smaller
Size Of Stimulus Was Already Getting Smaller
Size Of Stimulus Was Already Getting Smaller
During the height of the 2018/19 US-China trade war, policymakers responded to the economic shocks from imposed import tariffs with much more measured stimulus than in previous cycles (Chart 3). President Xi repetitively used the “Long March” analogy during the trade war, warning Chinese citizens to prepare for protracted hardship stemming from conflict with the US.1 The metaphor had important market implications because the attitude was fundamental to how the government handled the cyclical slowdown in 2018/19. Despite aggressive RRR and policy rate cuts in the second half of 2018, authorities maintained tight restrictions on bank lending and local government spending. Consequentially, aggregate credit growth continued to slide through end-2018 (Chart 4). Furthermore, authorities became uneasy about the sharp rise in the rate of credit expansion in Q1 2019. Following a public spat between the Premier Li Keqiang and the central bank, bank lending slowed sharply in the rest of the year. As a result, the improvement in infrastructure investment growth was small and short-lived. Despite an acceleration in local government bond issuance in 2H18 and Q1 2019, infrastructure investment growth remained on a structural downward trend throughout most of 2018 and 2019 (Chart 5). Chart 4China: A Deja Vu Of 2018-2019?
China: A Deja Vu Of 2018-2019?
China: A Deja Vu Of 2018-2019?
Chart 5Improvement In Infrastructure Investment Was Short-Lived In 2019
Improvement In Infrastructure Investment Was Short-Lived In 2019
Improvement In Infrastructure Investment Was Short-Lived In 2019
Chart 6Financial De-Risking Mode Is Still On
Financial De-Risking Mode Is Still On
Financial De-Risking Mode Is Still On
The current policy backdrop resembles the situation in 2H2018: while the central bank has kept interest rates at historically low levels and preemptively cut the RRR rate in July, lending standards remain tight and shadow bank credit continues to shrink (Chart 6). In the past Chinese authorities stimulated substantially following exogenous shocks, but did not stimulate much when business cycle was slowing in an orderly manner. A resurgence of domestic COVID cases and the severe flood in central China in July and August represent exogenous shocks and occured when the economy was losing steam. Hence, there are higher odds authorities will provide some support in response to these exogenous shocks. However, the recurring battle against COVID and lingering tensions with the US have likely prompted Chinese top leadership to extend their cross-cycle strategy. Officials may feel that a modest easing in both monetary and fiscal policies will be sufficient to offset the current economic weakness without overstimulating the economy. Bottom Line: A cross-cycle policy approach means not only responding early to small shocks with piecemeal stimulus to stabilize growth but also limiting the scope of stimulus and preparing for “protracted battles”. The response from Chinese leaders during the trade war with the US in 2018/19 may be a roadmap for policy direction in the next 12 months. Cyclical Implications From “Common Prosperity” President Xi Jinping laid out a plan for “common prosperity”, a guideline for the country’s national policy in the coming decades, at the August 18th Central Committee for Financial and Economic Affairs. Most of the plan’s objectives have 2035 deadlines and will be achieved gradually in multiple phases.2 However, in the next 12 months and leading to the 20th National Party Congress in the fall of 2022, we expect the authorities to accelerate some reform agendas that are consistent with the 14th Five-Year Plan (2021-2025). A key area that may gain momentum is increasing labor income and household consumption share in national output. Both labor compensation and household consumption as a share of GDP improved from 2011 to 2016, but the progress stalled in recent years and further deteriorated last year in the wake of the pandemic (Chart 7). Policy decision makers can reverse the falling share by either boosting income/consumption or lowering the share of capital formation in the national output, or a combination of both. Regulatory tightening in the property market has reduced investment growth in the sector, which accounts for 66% of the country’s total fixed-asset formation (Chart 8). We expect policy restrictions to continue curbing real estate investment in the rest of the year and into 2022, further shrinking the share of capital formation in the aggregate output.3 Chart 7China's Economic Rebalancing Progress Has Stalled In The Past Five Years
China's Economic Rebalancing Progress Has Stalled In The Past Five Years
China's Economic Rebalancing Progress Has Stalled In The Past Five Years
Chart 8Policymakers Are Moving Away From The 'Old Economy' Pillars
Policymakers Are Moving Away From The 'Old Economy' Pillars
Policymakers Are Moving Away From The 'Old Economy' Pillars
Chart 9Recovery In Household Income And Consumption Has Significantly Lagged Other Sectors
Recovery In Household Income And Consumption Has Significantly Lagged Other Sectors
Recovery In Household Income And Consumption Has Significantly Lagged Other Sectors
Recovery in household income and consumption has significantly lagged other sectors in China’s recent economic rebound (Chart 9). In addition to short-term, pandemic-related factors, household consumption has been sluggish due to China’s long-standing imbalanced income distribution. Given that China will be under more pressure to deliver economic progress in 2022, boosting wage growth and consumption will help to facilitate both the nation’s cross-cyclical economic strategy and President Xi’s longer-term reform plan for income and wealth redistribution. If successfully implemented, a rebalancing of labor income and consumption as a share of the national aggregate will have long-term economic benefits. However, for investors with a cyclical time frame, the transition will likely have the following implications on the market: Policymakers will keep a large fiscal budget deficit and increase spending in public services and social welfare, but there will be more pressure on the central government to keep local government debt in check. The increased fiscal burden also means that while the government will provide subsidies for households and key new-economy industries, policy at margin may move away from boosting investment in traditional infrastructure and construction (Chart 10). Chart 10Traditional Infrastructure Investment Will Remain Subdued
Traditional Infrastructure Investment Will Remain Subdued
Traditional Infrastructure Investment Will Remain Subdued
Empirical research shows that lower-income households have a higher marginal propensity to consume.4 Last year China refrained from meaningful stimulus to incentivize consumption. In contrast, the statement from the August 18th meeting indicated the focus is on securing living standards and wages among lower-income households. Common prosperity related policies may boost consumption of staples and some durable goods but will likely discourage splurging in high-end luxury goods and services. Large corporations and high-net-worth individuals will be expected to share social responsibility and the cost of reducing income inequality, either through higher and stricter tax burdens, raising minimum wages for employees, and/or donations. Bottom Line: The “common prosperity” theme will mostly entail long-term policy initiatives, but it may also have some cyclical market repercussions. Investment Recommendations Chart 11Tactical Bounce Gave Way To Cyclical Downturn In Previous Cycles
Tactical Bounce Gave Way To Cyclical Downturn In Previous Cycles
Tactical Bounce Gave Way To Cyclical Downturn In Previous Cycles
We do not rule out the possibility of a tactical (within the next three months) / technical rebound in Chinese stocks. Our August 4th report discussed how prices managed to rebound strongly within 90 days of the policy-triggered market riots in both 2015 and 2018. However, the rallies quickly faded and stocks fell to new lows (Chart 11). Prices bottomed when policy decisively turned reflationary. For now, the risks to Chinese equities are largely to the downside. Although there are some remedial measures to ease monetary and fiscal policies, officials have not sent a clear signal to ease on the regulatory front. Conversely, there are two scenarios that could prompt us to upgrade Chinese stocks to either neutral or overweight in both absolute and relative terms. Chart 12No Clear Signal Chinese Policymakers Will Ease On The Regulatory Front
No Clear Signal Chinese Policymakers Will Ease On The Regulatory Front
No Clear Signal Chinese Policymakers Will Ease On The Regulatory Front
The first scenario is that the economy does not slow further and a modest policy easing is sufficient to stabilize the economic outlook. This may happen if strong global economic growth and demand continue to support China’s export and manufacturing sectors, while domestic household consumption improves. In this case, the downside risks on the overall economy would abate, but the gradual underlying downtrend in China's old economy would be intact. We would need an additional reflationary tailwind, such as a boost from fiscal spending or a reversal of industry policy tightening, to upgrade Chinese stocks to overweight. We have argued in the past that housing appears to be the best candidate; the catalyst is missing at the moment (Chart 12). In the second scenario, Chinese policymakers may determine that the downside risks to growth are unacceptably large given existing slowdowns in the industrial and service sectors, and decide to temporarily reverse course on structural reforms. We will watch for indications of a shift in attitude. For now, we think that China’s leadership has a higher pain threshold than in the past, suggesting that this outcome is not yet probable. Jing Sima China Strategist jings@bcaresearch.com Footnotes 1"Xi Jinping calls for ‘new Long March’ in dramatic sign that China is preparing for protracted trade war", South China Morning Post. 2"Xi stresses promoting common prosperity amid high-quality development, forestalling major financial risks", Xinhua, English.news.cn 3We use fixed-asset investment (FAI) as a proxy for gross fixed capital formation (GFCF) because the National Bureau of Statistics of China does not publish the GFCF breakdown by sectors. GFCF comprises FAI, less the purchase of existing fixed assets, land and some minor items. Historically, the two series have closely tracked each other. 4"The Stimulative Effect of Redistribution", Federal Reserve Bank of San Francisco Market/Sector Recommendations Cyclical Investment Stance
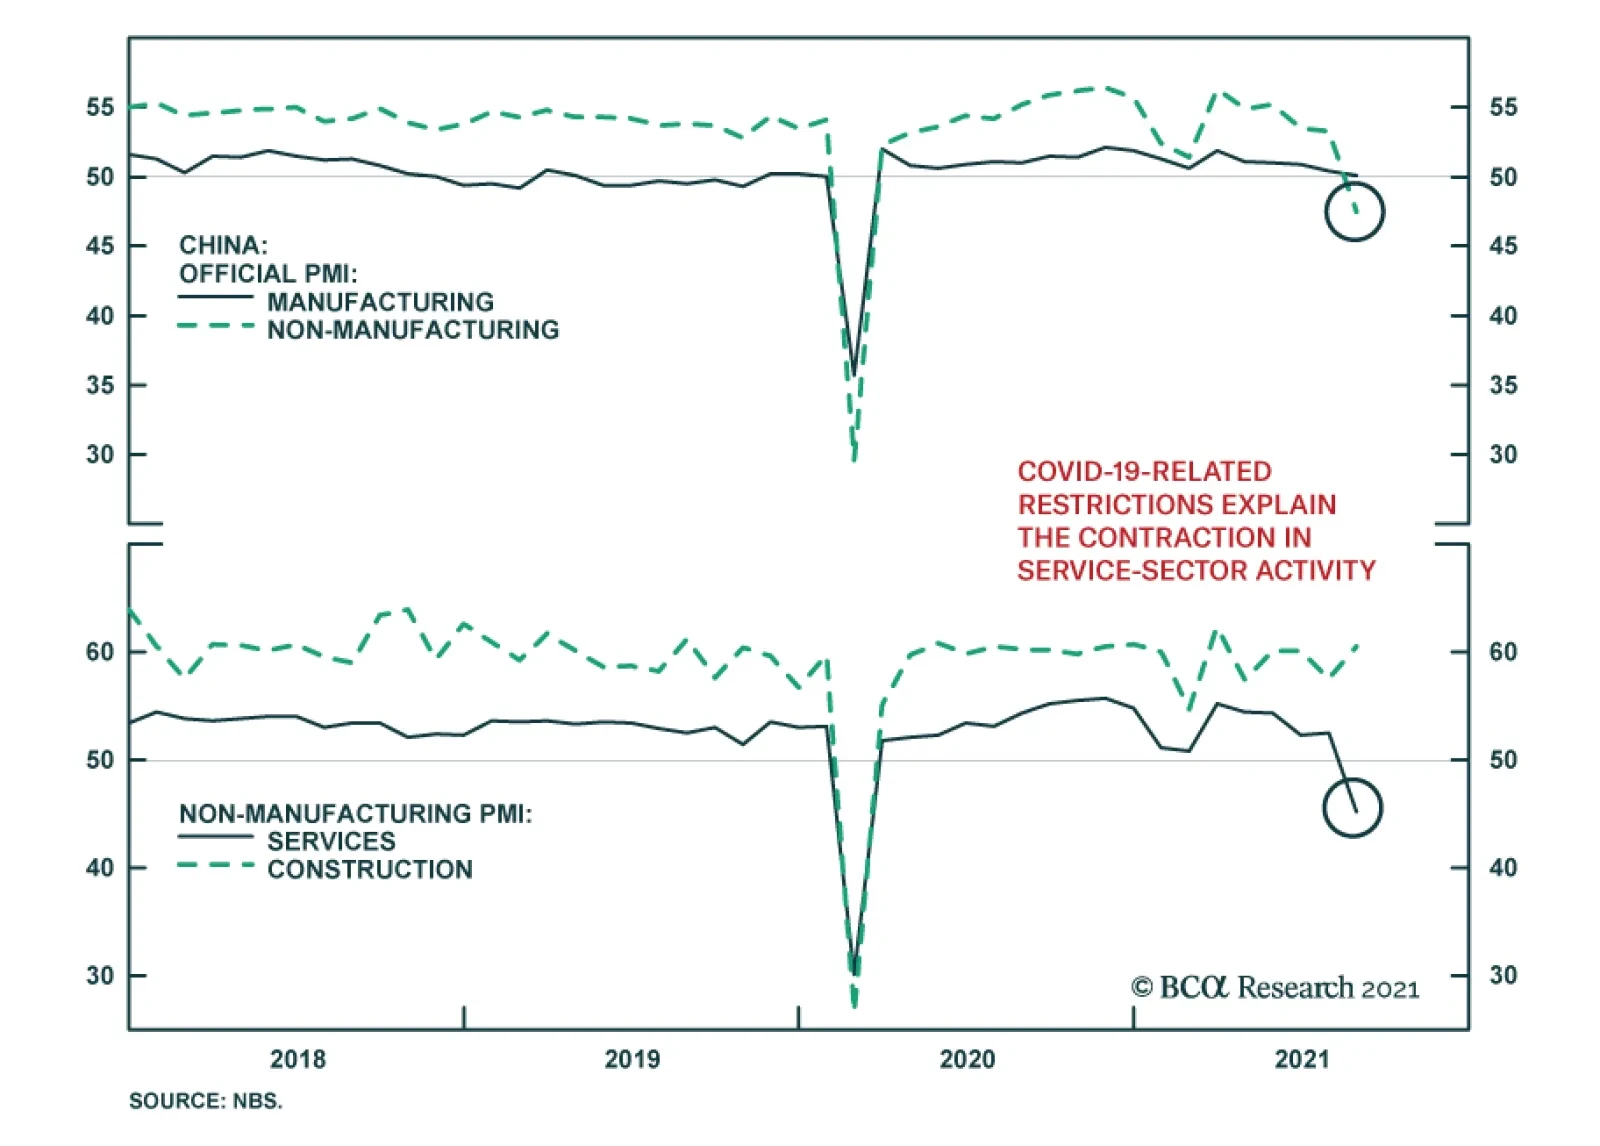
China's official PMIs disappointed in August. The non-manufacturing index fell to contractionary territory of 47.5, below expectations of a more muted 1.3-point decline to 52.0. Similarly, the manufacturing PMI eased by 0.3 points to 50.1 - a hair above…
Highlights The US dollar’s reserve status will remain intact for the foreseeable future. While this privilege is fraying at the edges, there are no viable alternatives just yet. There is an overarching incentive for any country to hold onto its currency’s power. For the US, it is still well within their ability to keep this “exorbitant privilege.” That said, there will be rolling doubts about the ability of the US to maintain its large currency sphere. This will create tidal waves in the currency’s path, providing plenty of trading opportunities for investors. China is on track to surpass the US in economic size, but it is far from dethroning the US in the military realm. However, it is gradually gaining the ability to deny the US access to its immediate offshore areas and may already be capable of winning a war over nearby islands like Taiwan. Watch the RMB over the next few decades. From a macro and cyclical perspective, the dollar is likely to decline as global growth picks up and the Fed lags market expectations in raising rates. From a geopolitical perspective, however, the backdrop is neutral-to-bullish for the dollar over the next three to five years. Feature Having the world’s reserve currency comes with a few advantages, which any governments would be loath to give up. The most important advantage is the ability to settle one’s balance of payments in one’s own currency. This not only facilitates trade for the reserve nation, it also reinforces the turnover of the reserve currency internationally. The value of this privilege is as much symbolic as economic. This “first mover advantage” or adoption of one’s currency internationally automatically ordains the resident central bank as the world’s bank. The primary advantage here is being able to dictate global financial conditions, expanding and contracting money supply to address domestic and global funding pressures. As compensation for this task, the world provides one with non-negligible seigniorage revenue. Being the world’s central bank also comes with another crucial advantage: being able to choose which international projects will be funded, while using cheaply issued local debt to finance these investments. Of course, any sensible society will earn more on its investments than it pays on the debt issued. There is a geopolitical angle to having the world’s reserve currency. A nation’s currency is widely held because of strategic depth—its ability to secure the people who trade in that currency and the property denominated in it. Deposits and transactions can be monitored, secured, or even halted at the behest of the sovereign. Holding the currency means one can maintain one’s purchasing power, given that it is backed by the most powerful country in the world. As the reserve currency becomes the de facto international medium of exchange, having stood the test of time through various crises, this allows the resident country to alter its purchasing power to achieve both national and international goals. Throughout history, having the world’s reserve currency has been the pursuit of many governments and kingdoms. In the current paradigm, the US enjoys this privilege. But could that change? And if so, how and when? Our goal in this report is threefold. First, why would any country want to maintain reserve status? Second, does the US still possess the apparatus to keep the dollar as a reserve asset over the next decade? And finally, are there any identifiable threats to the US dollar reserve status beyond a ten-year horizon? The Imperative To Maintain Status Quo Global trade is still largely conducted in US dollars. According to the BIS triennial central bank survey, 88.3% of transactions globally were in dollars just before the pandemic, a percentage that has been rather resilient over the last two decades (Chart I-1). It is true that currencies such as the Chinese renminbi have been gaining international acceptance, but displacing a currency that dominates almost 90% of global transactions is a herculean task. Surprisingly, the world has been transacting less often in euros and Japanese yen, currencies that also commanded international appeal in recent history. Chart I-1The US Dollar Still Dominates Global Transactions
Is The Dollar’s Reserve Status Under Threat?
Is The Dollar’s Reserve Status Under Threat?
The big benefit for the US comes from being able to settle its balance of payments in dollars. This not only lowers transaction costs (by lowering exchange rate risk), but it also provides the ability to cheaply borrow in your own currency to pay for imports. Having global trade largely denominated in US dollars also establishes a network of systems that make it much easier to settle trade in that currency. It is remarkable that, despite running a persistent current account deficit, the US dollar has tended to appreciate during crises, a privilege other deficit countries do not enjoy (Chart I-2). Strong network effects make the US dollar the currency of choice during crises. Chart I-2Despite Running A Current Account Deficit, The Dollar Tends To Rise During Crises
Is The Dollar’s Reserve Status Under Threat?
Is The Dollar’s Reserve Status Under Threat?
Chart I-3The US Generates Non-Negligible Seignorage Revenue
The US Generates Non-Negligible Seignorage Revenue
The US Generates Non-Negligible Seignorage Revenue
Being at the center of the global financial architecture comes with an important benefit beyond trade: the ability to dictate financial conditions both domestically and globally. Consider a scenario in which the US and the global economy are facing a downturn. In this scenario, the Federal Reserve can be instrumental in turning the tide: To stimulate the US economy, the Fed lowers interest rates and/or runs a wider fiscal deficit. The central bank helps finance this fiscal deficit by expanding the monetary base (benefitting from seigniorage revenue). As the Fed drops interest rates, the yield curve steepens. Banks use the positive term structure to borrow at the short end of the curve and lend at the longer end. This boosts the US money supply. As firms borrow to invest, this increases demand for imports (machinery, commodities, consumer goods), widening the US current account deficit. US trade is settled in dollars, increasing the international supply of the greenback. To maintain competitiveness, other central banks purchase these dollars from the private sector, in exchange for their local currency. As global USD reserves rise, they can be reinvested back into Treasuries and held in custody at the Fed. In essence, the US can finance its budget deficit through a strong capital account surplus. The seigniorage revenue that the US enjoys by easing both domestic and international financing conditions is about $100 billion a year or roughly 0.5% of GDP (Chart I-3). But the goodwill from being able to dictate both domestic and international financial conditions is far greater. At BCA, one of our favorite measures of global dollar liquidity is the sum of the Fed’s custody holdings together with the US monetary base. Every time this measure has severely contracted in the past, the shortage of dollars has triggered a financial crisis somewhere, typically among other countries running deficits (Chart I-4), a highlight of the importance of the US as a global financier. Chart I-4US Money Supply And Global Liquidity
US Money Supply And Global Liquidity
US Money Supply And Global Liquidity
Chart I-5Despite A Liability Shortfall, US Assets Generate A Net Profit
Despite A Liability Shortfall, US Assets Generate A Net Profit
Despite A Liability Shortfall, US Assets Generate A Net Profit
Beyond seigniorage revenue, the US enjoys another advantage—being able to earn much more on its international investments than it pays on its liabilities. The US generates an excess return of 1% of GDP from its external assets, despite having a net liability shortfall of 67% of GDP (Chart I-5). The ability to issue debt that will be gobbled up by foreigners, and in part use these proceeds to generate a higher overall return on investments made abroad, does indeed constitute an “exorbitant privilege.” In a nutshell, there is a very strong incentive for the US to keep the dollar as the world’s reserve currency. One short-term implication is that the Fed might only taper asset purchases and/or raise interest rates in an environment in which both global and US growth are strong, or it could otherwise trigger a global liquidity crisis. This will be particularly the case given the Delta variant of COVID-19 is still hemorrhaging global economic activity. An Overreach In The Dollar’s Influence There is a political advantage to the US dollar’s reserve status that is often overlooked: transactions conducted in US dollars anywhere in the world fall under US law. In simple terms, if a company in any country buys energy from Iran and the transaction is done in US dollars, the Treasury has powers to sanction the parties involved. Since most companies across the world cannot afford to be locked out of the US financial system, they will tend to comply with US sanctions. Even companies that operate under the umbrella of great powers, such as China and Russia, still tend to adhere to US sanctions, because they do not want to jeopardize their trade with US allies, such as the European Union. Of course, China, Russia, and Iran are actively seeking alternative transaction systems to bypass the dollar and US sanctions. But they do not yet trust each other’s currencies. Chart I-6A Deep And Liquid Pool Of Treasurys
A Deep And Liquid Pool Of Treasurys
A Deep And Liquid Pool Of Treasurys
The euro is the only viable alternative; however, the euro’s share of global transactions has fallen, despite the EU’s solidification as a monetary union over the past decade and despite the unprecedented deterioration of US relations with China and Russia. The EU could do great damage to the USD’s standing if it joined Russia’s and China’s efforts wholeheartedly, but the EU is still a major trading partner of the US and shares many of the same foreign policy aims. It is also chronically short of aggregate demand and runs trade and current account surpluses, depriving trade partners of euro savings or a debt market to recycle those savings (Chart I-6). Historically, having the world’s reserve currency allows the US to conduct international accords that serve both domestic and foreign interests. The Plaza Accord, signed in the 1980s to depreciate the US dollar, served both US interests in rebalancing the deficit and international interests in financing global trade. The 1980s were golden years for Japan and the Asian tigers on the back of a weak USD, allowing entities to borrow in greenbacks and profitably invest in Asian growth. Once the US dollar had depreciated by a fair amount, threatening its store of value, the US engineered the Louvre Accord to stabilize exchange rates. Ultimately, when various Asian bubbles popped, investors thought of nowhere better to flee than to the safety of the US dollar. The same thing happened after the emerging market boom of the 2000s and the eventual bust of the 2010s. Today, the US may not be able to organize an international intervention, if one should be necessary in the coming years. Past experience shows that countries act unilaterally and coordinated interventions lack staying power. Neither Europe nor Japan is in the position today to allow currency appreciation, as they were in the past. And the US has shown itself unable to combat its trading partners’ depreciation, as in the case of China, whose renminbi remains below 2014 levels. The bottom line is that there is nothing to stop the US from attempting to stretch its overreach too far, which would create a backlash that diminishes the dollar’s status. This is especially the case given trust in the US government is quite low by historical standards, which for now points to a lower dollar cyclically (Chart I-7). Chart I-7Trust In The US Government And The Dollar
Is The Dollar’s Reserve Status Under Threat?
Is The Dollar’s Reserve Status Under Threat?
This is not to say that other countries with reserve aspirations can tolerate sustained appreciation. China has recommitted to manufacturing supremacy in its latest five-year plan, as it fears the political consequences of rapid deindustrialization. As such, the renminbi will be periodically capped to maintain competitiveness. Can The US Maintain Status Quo? Chart I-8A Lifespan Of Reserve Currencies
Is The Dollar’s Reserve Status Under Threat?
Is The Dollar’s Reserve Status Under Threat?
Over the last few centuries, reserve currencies have tended to have a lifespan of about 100 years (Chart I-8). The reason is that global wars tend to knock the leading power off its geopolitical pedestal, devaluing its currency and giving rise to a new peace settlement with a new ascendant country whose currency then becomes the basis for international trade. Such was the case for Spain, France, the UK, and the United States in a pattern of war and peace since the sixteenth century. Granting that the US dollar took the baton from sterling in the 1920s and that the post-World War II peace settlement is eroding in the face of escalating geopolitical competition, it is reasonable to ask whether or not the US might lose its grip on this power. To assess this possibility, it is instructive to revisit the anatomy of a reserve currency: Typically, a reserve currency tends to be that of the “greatest” nation. For the same reason, the reserve nation tends to be the wealthiest, which ensures that its currency is a store of value and that it can act as a buyer of last resort during crisis (Chart I-9). This reasoning is straightforward when a global empire is recognizable and unopposed. But in the current context of multipolarity, or great power competition, the paradigm could start to shift. Global trade is slowing globally, but it is accelerating in Asia (Chart I-10). China is a larger trading partner than the US for many emerging markets and is slated to surpass the US economy over the next decade. The renminbi has a long way to go to rival the dollar, but it is gradually rising and its place within the global reserve currency basket is much smaller than its share of global trade or output, implying room for growth (Chart I-11). Chart I-9Wealth And Reserve Currency Status Go Hand-In-Hand
Is The Dollar’s Reserve Status Under Threat?
Is The Dollar’s Reserve Status Under Threat?
Chart I-10Trade In Asia Is Booming
Is The Dollar’s Reserve Status Under Threat?
Is The Dollar’s Reserve Status Under Threat?
Chart I-11Adoption Of The RMB Has Room To Grow
Adoption Of The RMB Has Room To Grow
Adoption Of The RMB Has Room To Grow
To maintain hegemonic power (especially controlling the vital supply routes of prosperity), the reserve nation needs military might above and beyond everyone else. It helps that US military spending remains the biggest in the world, in part financed by US liabilities (Chart I-12). China is far from dethroning the US in the military realm. But it is gradually gaining the ability to deny the US access to its immediate offshore areas and may already be capable of winning a war over nearby islands like Taiwan. Moreover, its naval power is set to grow substantially between now and 2030 (Table I-1). Already, over the past decade, the US stood helplessly by when Russia and China annexed Crimea and the reefs of the South China Sea. It is possible to imagine a series of events that erode US security guarantees in the region, even as the US loses economic primacy. Chart I-12The US Still Maintains Military Might
Is The Dollar’s Reserve Status Under Threat?
Is The Dollar’s Reserve Status Under Threat?
Table I-1China’s Economic And Naval Growth Slated To Reduce American Primacy In Asia Pacific
Is The Dollar’s Reserve Status Under Threat?
Is The Dollar’s Reserve Status Under Threat?
The reserve currency nation needs to run deficits to finance activity in the rest of the world. That requires having deep and liquid capital markets to absorb global savings. There is considerable trust or “goodwill” that makes the US Treasury market the most liquid debt exchange pool in the world. This remains the case today (previously mentioned Chart I-6). Even so, this trend is shifting. The growth in euro- and yen-denominated debt is exploding. This mirrors the gradual shift in the allocation of FX reserves away from dollars into other currencies. If the US began to use the dollar as a geopolitical weapon recklessly, foreign entities may have no other choice but to rally into other currency blocks, including the euro (and perhaps eventually the yuan). This will take years, but it is worth noting that global allocation to FX reserves have fallen from around 80% toward USDs in the 70s to around 60% today (Chart I-13). Chart I-13The Dollar Reserve Status Has Been Ebbing
The Dollar Reserve Status Has Been Ebbing
The Dollar Reserve Status Has Been Ebbing
On the political front, there is some evidence that public opinion on the dollar is fading, although it is far from damning. A Pew survey on the trust in the US government is near decade lows and has tracked the ebb and flow of changes in the dollar (previously shown Chart I-7). Trust in government will probably not get much worse in the coming years, as the pandemic will wane and stimulus will secure the economic recovery, but too much stimulus could conceivably ignite an inflation problem that weighs on trust. True, populism has driven the US government under two administrations into extreme deficit spending. With the pandemic as a catalyst, US deficits have reached WWII levels despite the absence of a war. However, the Biden administration’s $3.5 trillion spending bill will be watered down heavily – and the 2022 midterms will likely restore gridlock in Congress, freezing fiscal policy through at least 2025. In other words, fiscal policy is negative for the dollar in the very near term, but the fiscal outlook is not yet so extravagant as to suggest a loss of reserve currency status. After all, there is some positive news for the US. The US demonstrated its leadership in innovation with the COVID-19 vaccines; it survived its constitutional stress test in the 2020 election; it is now shifting from failed “nation building” abroad to nation building at home; and its companies remain the most innovative and efficient, judging by global equity market capitalization (Chart I-14). China, meanwhile, is facing the most severe test of its political and economic system since it marketized its economy in 1979. Investors should not lose sight of the fact that, since the rise of President Xi Jinping and Russia’s invasion of Ukraine, global policy uncertainty has tended to outpace US policy uncertainty, attracting flows into the dollar (Chart I-15). Given that China and Russia are both pursuing autocratic governments at the expense of the private economy, it would not be surprising to see global policy uncertainty take the lead once again, confirming the decade trend of global flows favoring the US when uncertainty rises. Chart I-14American Primacy Still Clear In Equity Market
American Primacy Still Clear In Equity Market
American Primacy Still Clear In Equity Market
Chart I-15Higher Policy Uncertainty Good For Dollar
Higher Policy Uncertainty Good For Dollar
Higher Policy Uncertainty Good For Dollar
The bottom line is that the US dollar is gradually declining as a share of the global currency reserve basket, just as the US economy and military are gradually declining as a share of global output and defense spending. Yet the US will remain the first or second largest economy and premier military power for a long time, and the dollar still lacks a viable single replacement. A major war or geopolitical crisis is probably necessary to precipitate a major breakdown. The Iranian Revolution and September 11 attacks both had this kind of effect (see 1979 and 2001 in Chart I-13 above). But COVID-19 is less clear. If China and Europe emerge as more stable than the US, then the post-pandemic aftermath will bring more bad news for the dollar. Investment Implications From a geopolitical perspective, the backdrop is neutral for the dollar beyond the next twelve to eighteen months. An escalating conflict with Iran—which is possible in the near term—would echo the early 2000s and weigh on the currency. But a deal with Iran and a strategic pivot to Asia would compound China’s domestic political problems and likely boost the greenback. Chart I-16US Twin Deficits And The Dollar
US Twin Deficits And The Dollar
US Twin Deficits And The Dollar
From a macro and cyclical perspective, however, the view is clearly negative for the dollar. Over the next five years, the U.S. Congressional Budget Office (CBO) estimates that the U.S. budget deficit will shrink and then begin expanding again to -5% of GDP. If one assumes that the current account deficit will widen somewhat, then stabilize, the twin deficits will be pinned at around -10% of GDP. Markets have typically punished the dollar on rising twin deficits (Chart I-16). This suggests near-term pressure on the dollar’s reserve status is to the downside. EM currencies may hold a key to the performance of the dollar. While most EM economies remain hostage to the virus, a coiled-spring rebound cannot be ruled out as populations become vaccinated. China’s Politburo signaled in July that it will no longer tighten monetary and fiscal policy. We would expect policy easing over the next twelve months to ensure the economy is stable in advance of the fall 2022 party congress. If the virus wanes and China’s economy is stimulated, global growth will improve and the dollar will fall. Chester Ntonifor Foreign Exchange Strategist chestern@bcaresearch.com Matt Gertken Geopolitical Strategist mattg@bcaresearch.com