China
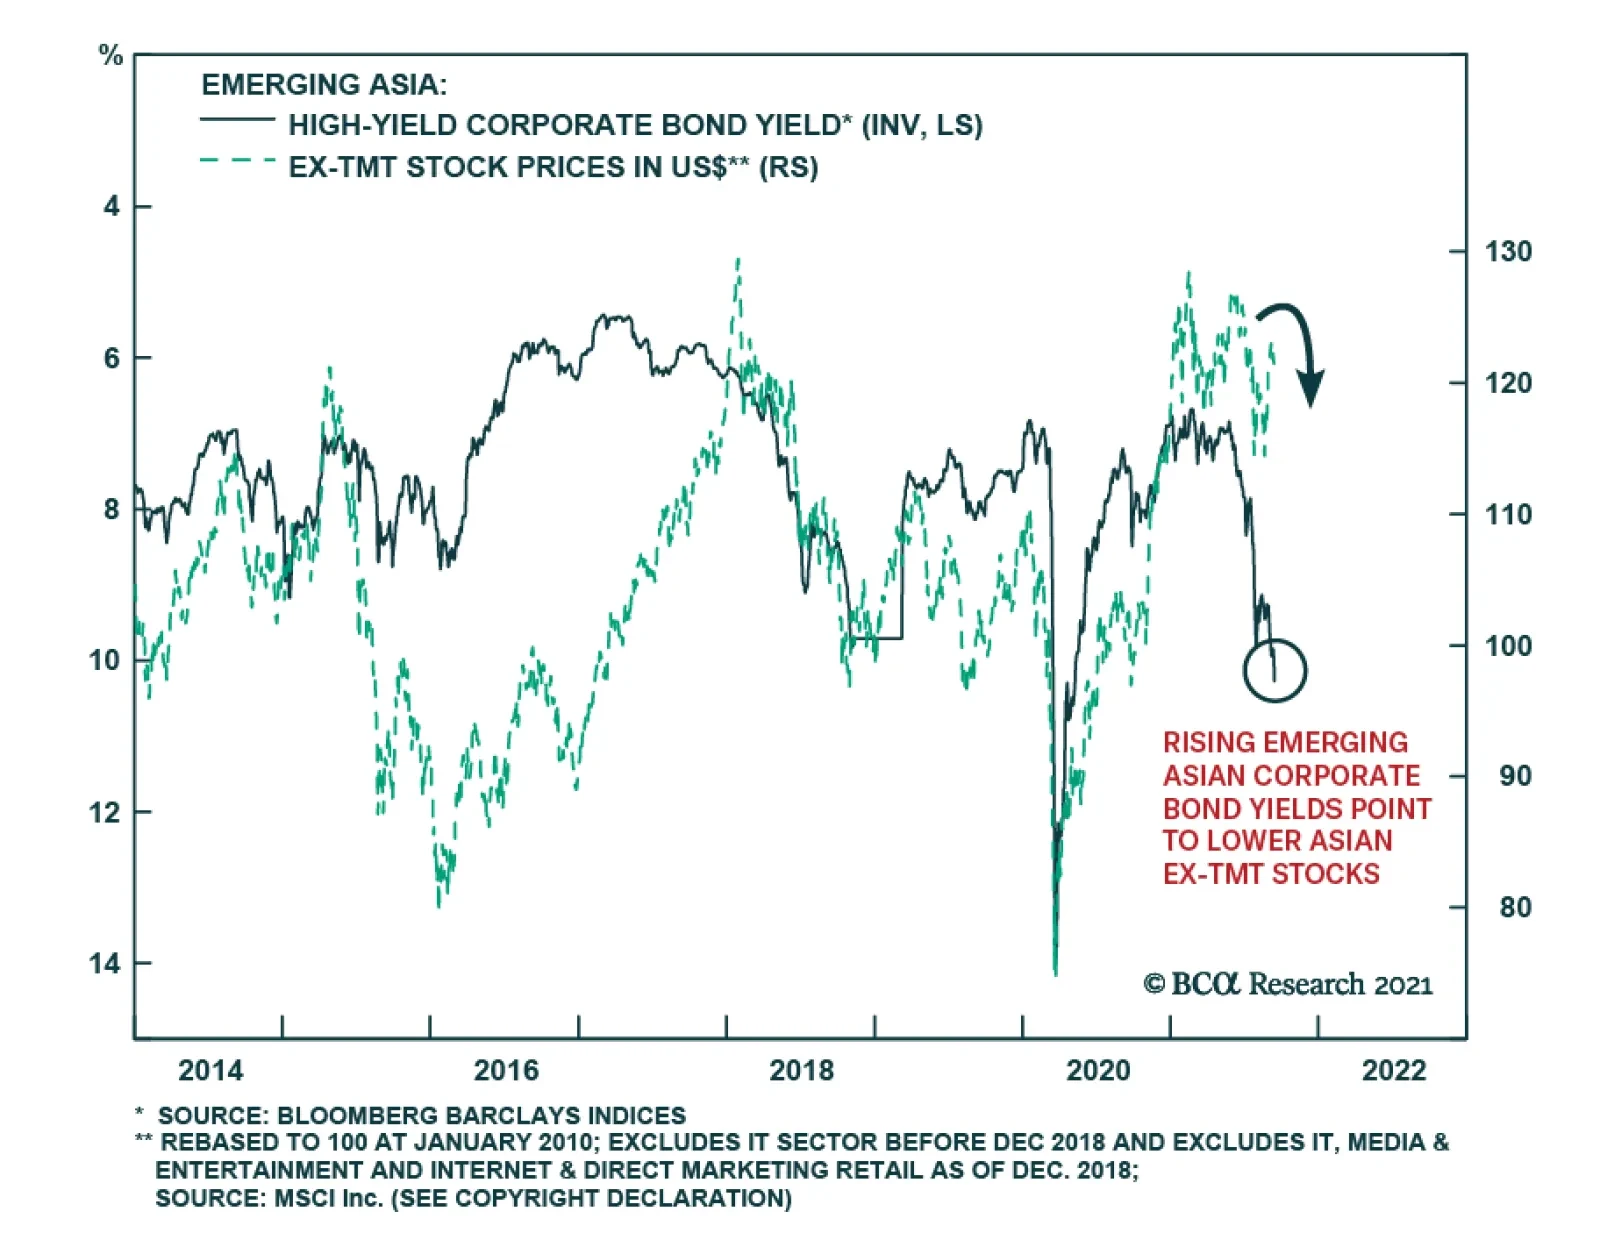
BCA Research's Emerging Markets Strategy service expects Evergrande’s partial default to reinforce credit tightening in China. Evergrande will likely default on some of its liabilities but there will be a bailout or roll-over of its other debt. This raises…
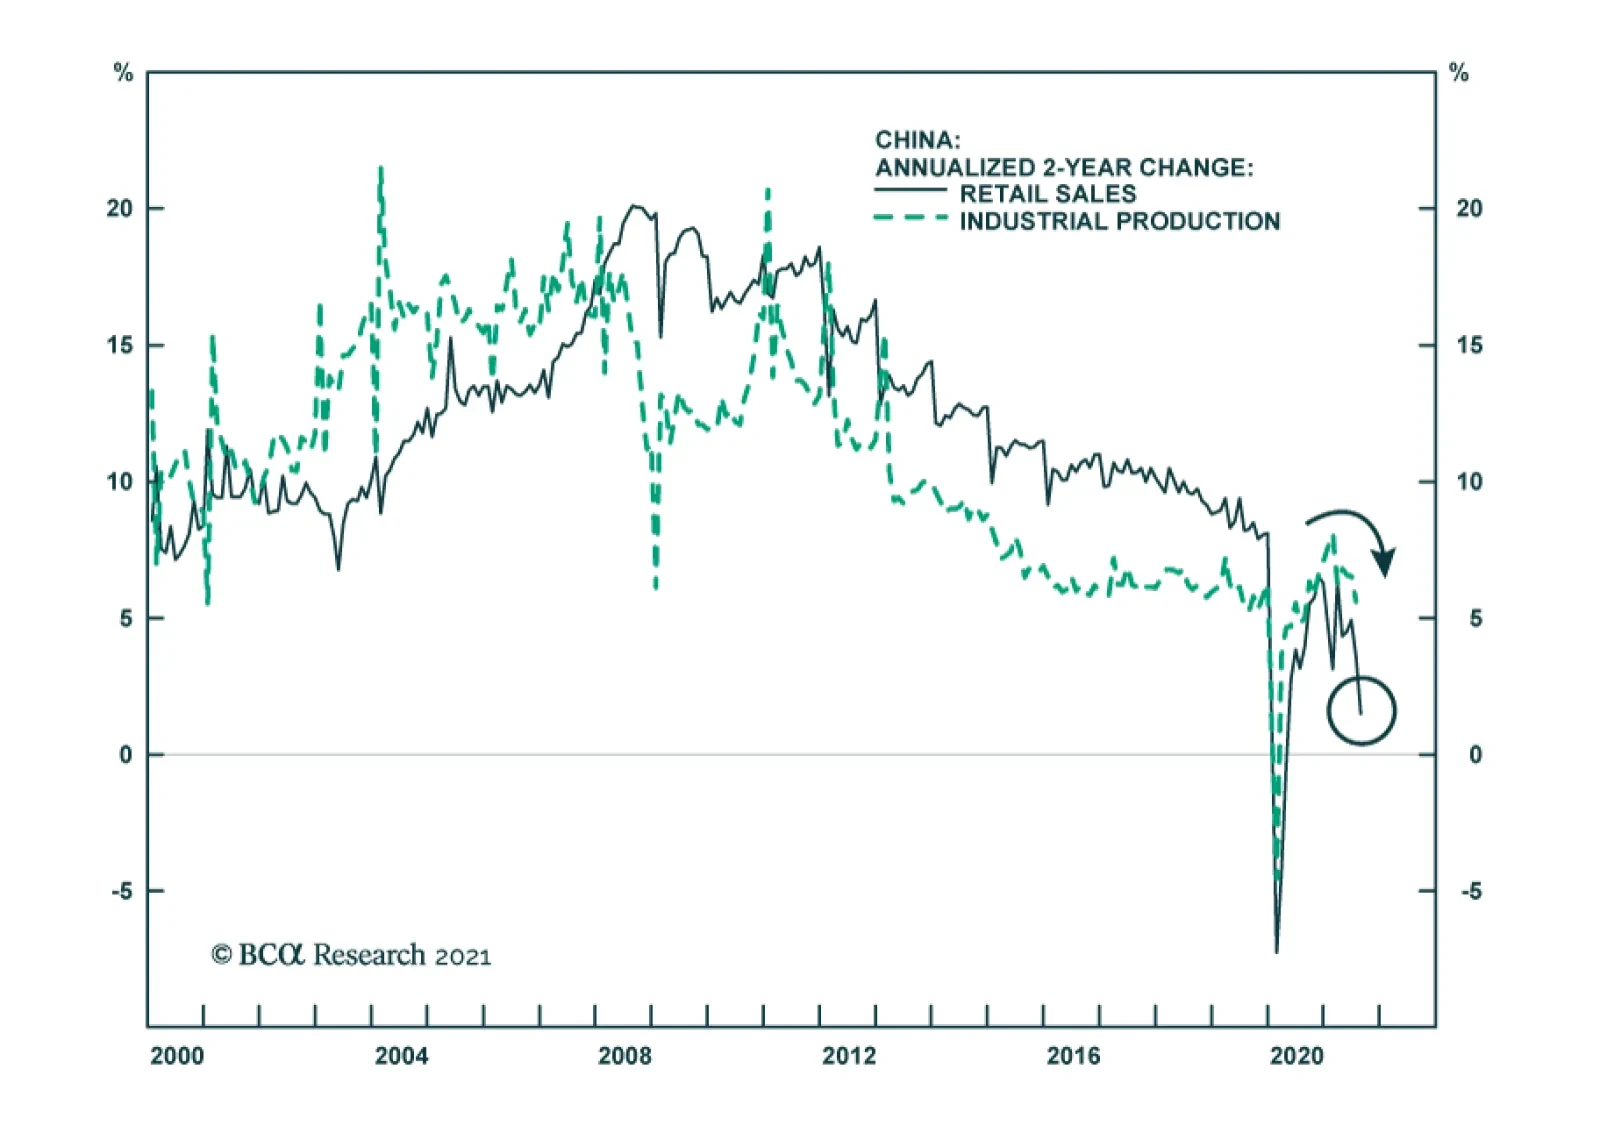
Chinese macro data releases for August surprised to the downside and indicate that the domestic economic slowdown is ongoing. Most notably, retail sales decelerated sharply to 2.5% y/y, significantly slower than the expected 7.0% following July's 8.5%.…
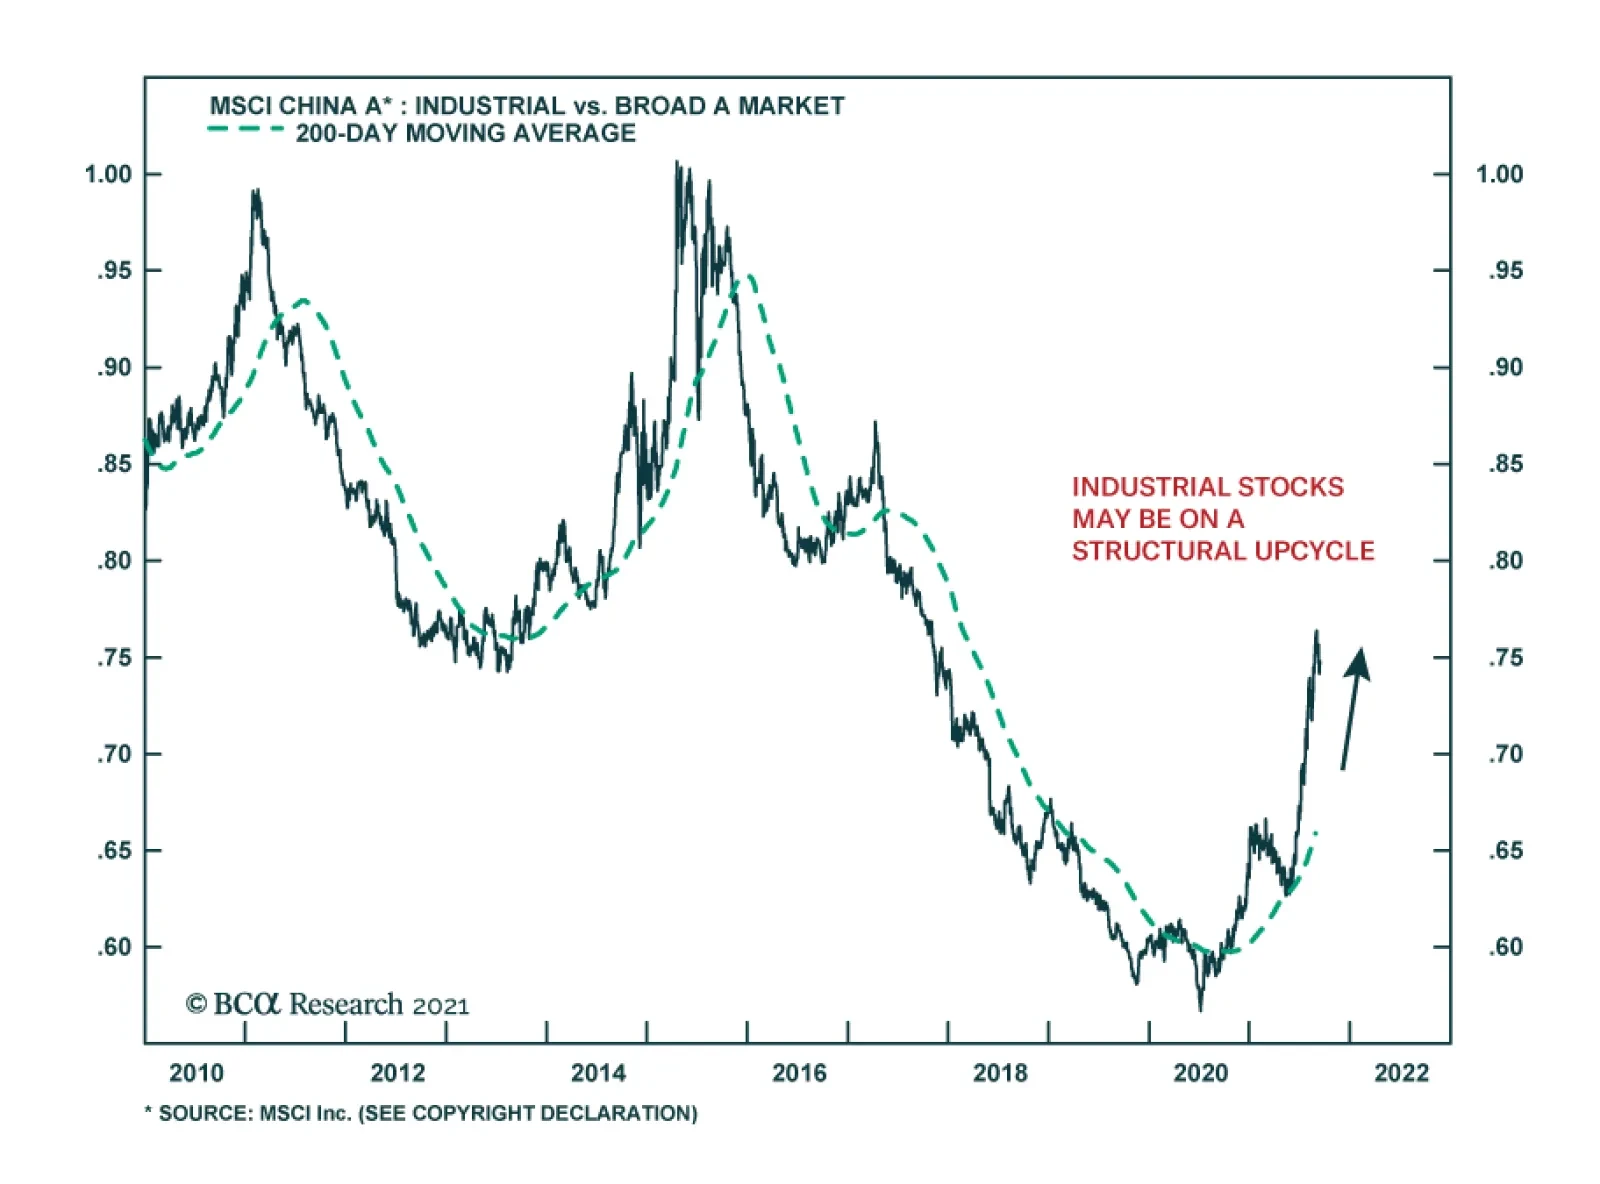
BCA Research's China Investment Strategy service recommends a new trade: long Chinese industrial stocks/short A-shares. Chinese onshore stocks in the infrastructure, materials, and industrial sectors recently advanced strongly in the expectation that…

Dear Client, Next week, in lieu of our regular weekly report, I will be hosting two webcasts where I will discuss our view on China’s economy and financial markets. I will also address the topics that our clients are most concerned about, including China’s regulatory developments, inflation, and policy direction. The webcasts will be held on Wednesday, September 22 at 10:00 am EDT (English), and Thursday, September 23 at 9:00 am HKT (Mandarin). I look forward to discussing with you during the webcast. We will return to our regular publishing schedule on Wednesday, September 29. Best regards, Jing Sima, China Strategist Highlights China is facing cyclical inflationary pressures more than disinflationary ones. Prices of mining, raw materials and manufacturing goods have been rising at record rates. Chinese manufacturers are operating at close to full production, which suggests that there is little slack in demand. Despite soft headline readings in consumer prices, the costs of goods and services have rebounded to pre-pandemic levels. Prices for home durable goods, fuel and utilities have surged to multiyear highs. Measures to boost domestic demand will be limited as long as inflationary pressures continue and manufacturers produce at close to full capacity. Near-term policy support will likely focus on reducing costs for manufacturers and improving wage growth for lower-income households. We are initiating a trade: long industrial stocks/short A-shares. Feature China’s Producer Price index (PPI) registered a 13-year high in August, at the time when the domestic economy continued to slow. On the other hand, consumer prices (CPI) - both headline and core CPI - have been lackluster. The acceleration in producer inflation and the demand dynamics raise the question whether China is in a stagflation, a situation in which prices climb but wages and demand do not follow. Consequentially, economy policy faces a dilemma between boosting demand and containing inflation. Inflationary pressures have been driven by pandemic-related factors and the supply-side constraints will likely continue into Q1 next year. These inflationary pressures, and more importantly, undercurrents in the inflation prints, will constrain Chinese policymakers’ efforts to reflate the economy. The recent rebound in Chinese infrastructure stocks is overdone. Material stocks are also vulnerable to price setbacks. Global commodity prices will soften, although from very elevated levels. Meanwhile, we are initiating a trade: long Chinese industrial stocks relative to the A-share market. Despite falling profit growth in recent months, China’s leadership is increasing its support, both cyclically and structurally, to the manufacturing sector. Inflation Or Deflation? The details in both the PPI and CPI readings indicate that China is facing more inflationary pressures than disinflationary ones. Producers are raising prices across the board. Although consumer prices will likely remain well below the PBoC's 3% inflation target for the year mainly due to low food prices, prices in some of the key consumer goods segments are rising at an alarming pace. The inflationary pressures will continue for producers, at least through the first quarter of 2022. The strength in August’s PPI was concentrated in mining and raw materials (Chart 1, top panel). Robust global demand and tight supply conditions supported high oil and base metals prices, while pushing up coal prices. Chart 1Chinese Mining And Manufacturing Goods Prices Accelerated To Record Highs
Chinese Mining And Manufacturing Goods Prices Accelerated To Record Highs
Chinese Mining And Manufacturing Goods Prices Accelerated To Record Highs
Chart 2Commodity Prices Held Up Despite A Slowing China
Commodity Prices Held Up Despite A Slowing China
Commodity Prices Held Up Despite A Slowing China
We do not expect China’s infrastructure investment growth to pick up and support industrial metal prices. However, this year’s unsynchronized recovery in global demand and severe supply shortages have delayed the global commodity market’s price reaction to slowing Chinese demand (Chart 2). Moreover, as China’s environmental policy remains stringent during the upcoming winter, supply-side constraints from production cuts will partially offset the slowdown in China’s demand for mining and raw materials (Chart 3A and 3B). Chart 3ASupply-Side Constraints And Chinese Production Cuts Likely To Continue Into Early 2022
Supply-Side Constraints And Chinese Production Cuts Likely To Continue Into Early 2022
Supply-Side Constraints And Chinese Production Cuts Likely To Continue Into Early 2022
Chart 3BSupply-Side Constraints And Chinese Production Cuts Likely To Continue Into Early 2022
Supply-Side Constraints And Chinese Production Cuts Likely To Continue Into Early 2022
Supply-Side Constraints And Chinese Production Cuts Likely To Continue Into Early 2022
Manufacturing goods inflation registered its topmost annual growth since data collection started in 1996 (Chart 1, bottom panel). Moreover, capacity utilization rates in the industrial and manufacturing sectors are at the highest levels since 2007, well above their means (Chart 4). Changes in manufacturing capacity are highly correlated with China’s export growth and tightly linked to PPI (Chart 5). Therefore, manufacturing goods prices will remain lofty as long as external demand stays robust and China’s manufacturers continue to produce near maximum output. Chart 4Chinese Manufacturers Are Producing Near Their Max Capacity
Chinese Manufacturers Are Producing Near Their Max Capacity
Chinese Manufacturers Are Producing Near Their Max Capacity
Chart 5Robust Exports Have Been Supporting Strong Chinese Manufacturing Output
Robust Exports Have Been Supporting Strong Chinese Manufacturing Output
Robust Exports Have Been Supporting Strong Chinese Manufacturing Output
The PPI’s weakest component has been consumer goods, which inched up by a mere 0.3% from a year ago (Chart 6). However, consumer goods only account for 25% of PPI, whereas industrial and manufacturing producer goods are 75%. In addition, the underlying data shows that among the four sub-components in the PPI’s consumer goods, only food prices have remained below their pre-pandemic levels (Chart 7, top panel). Prices in durable goods have rebounded strongly since March last year and clothing and daily sundry articles have recovered to their end-2019 rate of growth (Chart 7, mid and bottom panels). Chart 6Producer Prices For Consumer Goods Remain Soft...
Producer Prices For Consumer Goods Remain Soft...
Producer Prices For Consumer Goods Remain Soft...
Chart 7...But Food Prices Have Been The Main Drag
...But Food Prices Have Been The Main Drag
...But Food Prices Have Been The Main Drag
The PPI’s price forces are consistent with the CPI, in which food has been the main drag. Core CPI, along with prices for consumer goods and services, have returned to pre-pandemic growth rates (Chart 8). Durable goods prices, such as home appliances, increased to a multiyear high in August. Fuel and utilities costs have also risen. This suggests that despite the soft CPI readings, inflation has flowed from producers to Chinese consumers through manufacturing goods. The passthrough will likely intensify into Q4 when domestic COVID-cases have been largely brought under control and the September – October holiday season will boost consumption for both goods and services. Chart 8Prices For Other Consumer Goods Categories Have Recovered
Prices For Other Consumer Goods Categories Have Recovered
Prices For Other Consumer Goods Categories Have Recovered
Table 1A Look At China’s CPI Basket – Food Dominates
Inflation, Deflation, Or Stagflation?
Inflation, Deflation, Or Stagflation?
We still expect that headline CPI will remain below the PBoC’s 3% inflation target for the year. Consumer durable goods prices are lightly weighted in China’s CPI, therefore, an acceleration in inflation passthroughs in this component is unlikely to significantly push up the CPI aggregates (Table 1). Chart 9Prices For Healthcare And Education Services On A Structural Downshift
Prices For Healthcare And Education Services On A Structural Downshift
Prices For Healthcare And Education Services On A Structural Downshift
In addition, there are some structural headwinds that will affect prices in the education and healthcare and medical services components, which together account for about 15% of the CPI. Healthcare prices have been on a policy-driven structural downshift since late 2017 and recent regulatory changes in the education industry will depress pricing power in that sector (Chart 9). Despite sluggish aggregate consumer prices, climbing prices in consumer durable goods, services and particularly, fuel and utilities, will likely force China’s leadership to take action on policy. Bottom Line: Price pressures for Chinese producers remain intense and consumers will feel the heat of escalating prices in durable goods, fuel and utilities. Inflation is threatening domestic demand, which is already slowing from its peak earlier this year. Implications On Policy Response Inflation readings –even though they are lagging economic indicators –bear significant forward-looking market implications because changes in inflation dynamics herald various policy responses. Despite slower economic growth, higher inflation coupled with accommodative monetary and fiscal policies may indicate that the economy is in a “goldilocks” stage and corporate profits can still benefit (Chart 10). Chinese onshore stocks reached record high recently (Chart 11). Chart 10Are Chinese Corporates In A 'Sweet Spot'?
Are Chinese Corporates In A 'Sweet Spot'?
Are Chinese Corporates In A 'Sweet Spot'?
Chart 11Accommodative Monetary Conditions Propelled Chinese Stock Prices To Highest Since 2015
Accommodative Monetary Conditions Propelled Chinese Stock Prices To Highest Since 2015
Accommodative Monetary Conditions Propelled Chinese Stock Prices To Highest Since 2015
However, underlying trends in China’s producer and consumer inflation prints raise the risks that policymakers may not deliver the ingredients needed for a “just right” scenario. Even though China has kept a loose monetary policy that we expect to extend into next year, inflationary pressures may force policymakers to either delay or reduce the magnitude of stimulus. Recent policy moves show that the authorities are focused on reducing input cost burdens and bumping up support for small- and medium-sized enterprises (SMEs), which are highly concentrated in mid- to downstream manufacturing and services sectors. In our view, the recent rhetoric from policymakers further reduces the odds of any broadly based stimulus to boost demand. Our view is based on the following observations: The elevated global input costs and limited price passthroughs to consumers are depressing Chinese manufacturers’ profit margins and incentives to expand production capacity. Despite strong exports and production, manufacturing investment has lagged that in infrastructure and real estate this year (Chart 12). Consumers, particularly lower-income households, are bearing most of the burdens; rising costs and slow wage growth are weakening their propensity to spend (Chart 13). Chart 12Slower Manufacturing Investment Recovery Than Infrastructure And Real Estate So Far This Year
Slower Manufacturing Investment Recovery Than Infrastructure And Real Estate So Far This Year
Slower Manufacturing Investment Recovery Than Infrastructure And Real Estate So Far This Year
Chart 13Slow Wage Growth Limits The Pace Of Consumption Recovery
Slow Wage Growth Limits The Pace Of Consumption Recovery
Slow Wage Growth Limits The Pace Of Consumption Recovery
The inflation prints came at the time when China’s top leadership shifted its structural policy goals to reduce income inequality and stabilize manufacturing share in the aggregate economy. The structural goals will likely be reflected in policy responses to the cyclical challenge. Moreover, this year’s manufacturing production volume was growing twice as fast as producer prices, a reversal from 2017 when price increases outpaced production (Chart 14). Price changes are much more important to corporate profits than volume changes. A strong RMB and sharply escalating shipping costs have also reduced exporters’ pricing power and profits (Chart 15). In contrast, mounting prices across various commodities have allowed the upstream industrial sectors, which are dominated by SOEs, to deliver much stronger profits than the downstream and private sector (Chart 16). Chart 14Growth In Manufacturing Output And Prices Starting To Converge
Growth In Manufacturing Output And Prices Starting To Converge
Growth In Manufacturing Output And Prices Starting To Converge
Chart 15Strong RMB And Rising Shipping Costs Have Reduced Chinese Exporters' Profitability
Strong RMB And Rising Shipping Costs Have Reduced Chinese Exporters' Profitability
Strong RMB And Rising Shipping Costs Have Reduced Chinese Exporters' Profitability
It is unsurprising that authorities are increasing support to the private sector in order to maintain manufacturing share in the economy and keep the export sector competitive (Chart 17). A boost in infrastructure investment, on the other hand, would exacerbate upward pressure on commodity prices and mostly benefit upstream SOEs. Chart 16Upstream Industries Disproportionally Benefited From Surging Commodity Prices
Upstream Industries Disproportionally Benefited From Surging Commodity Prices
Upstream Industries Disproportionally Benefited From Surging Commodity Prices
Chart 17Private Sector: Lower Profit Margin, Higher Costs
Private Sector: Lower Profit Margin, Higher Costs
Private Sector: Lower Profit Margin, Higher Costs
Furthermore, stimulating the traditional sectors would not revive household consumption. The subdued recovery in consumption and prices for consumer staple goods is due to slow growth in lower-income household wages and a disrupted recovery in the services sector. Ramping up infrastructure investment can support headline GDP growth, but will do little to provide jobs and wages since China’s private sector provides 80% of all jobs and 90% of annual job creations. Lower-income households have a higher marginal propensity to consume. We expect the government to accelerate fiscal support measures to fortify wages among lower-income households. Bottom Line: Ongoing inflationary pressures and the underlying forces will likely thwart policymakers from stepping up their efforts to stimulate the old economy sectors. Investment Conclusions Chart 18Rebound In Infrastructure Stocks Should Be Short-Lived
Rebound In Infrastructure Stocks Should Be Short-Lived
Rebound In Infrastructure Stocks Should Be Short-Lived
Chinese onshore stocks in the infrastructure, materials, and industrial sectors recently advanced strongly in the expectation that policymakers will ramp up their fiscal support in the old economy sectors, particularly infrastructure. Although we agree that infrastructure investment will improve, we maintain our view that a sizable rebound is highly unlikely this year. Hence, we do not expect that the rally in infrastructure stocks will be long-lasting (Chart 18). We are probably too late in the cycle to re-initiate our long material/broad market trade in the onshore and offshore equity markets (Chart 19). We closed the trade in December last year when Chinese policymakers started pulling back stimulus, and in expectations that raw material prices would tumble. However, we underestimated the intensity of China’s de-carbonization efforts and protracted global supply-side constraints. Although global commodity prices will remain elevated into 2022, the price rallies from this year are not sustainable on a cyclical (6- to 12-month) basis. Therefore, we do not recommend material stocks as a cyclical play. Chart 19Price Rally In Materials Stocks Unlikely To Sustain
Price Rally In Materials Stocks Unlikely To Sustain
Price Rally In Materials Stocks Unlikely To Sustain
Chart 20Industrial Stocks May Be On A Structural Upcycle
Industrial Stocks May Be On A Structural Upcycle
Industrial Stocks May Be On A Structural Upcycle
Instead, we recommend a long industrial/broad A-share market trade (Chart 20). Even though China is in a late business cycle and the upcoming stimulus will be mediocre at best, we think that the industrial sector will benefit from policy support for investment in the manufacturing sector and a faster pace in the sector’s capacity expansion. Jing Sima China Strategist jings@bcaresearch.com Footnotes Market/Sector Recommendations Cyclical Investment Stance
As expected, Chinese credit numbers for August improved relative to July. Aggregate financing increased CNY 2.96 trillion from July's CNY 1.08 trillion and was slightly above consensus estimates of CNY 2.80 trillion. New bank loans also increased, rising to…
Given that Chinese credit has a lagged impact on domestic activity (see The Numbers), China's economy is unlikely to bottom before the end of Q1 2022. In addition to the economic slowdown, regulatory pressures also pose risks to Chinese equities and EM stocks…
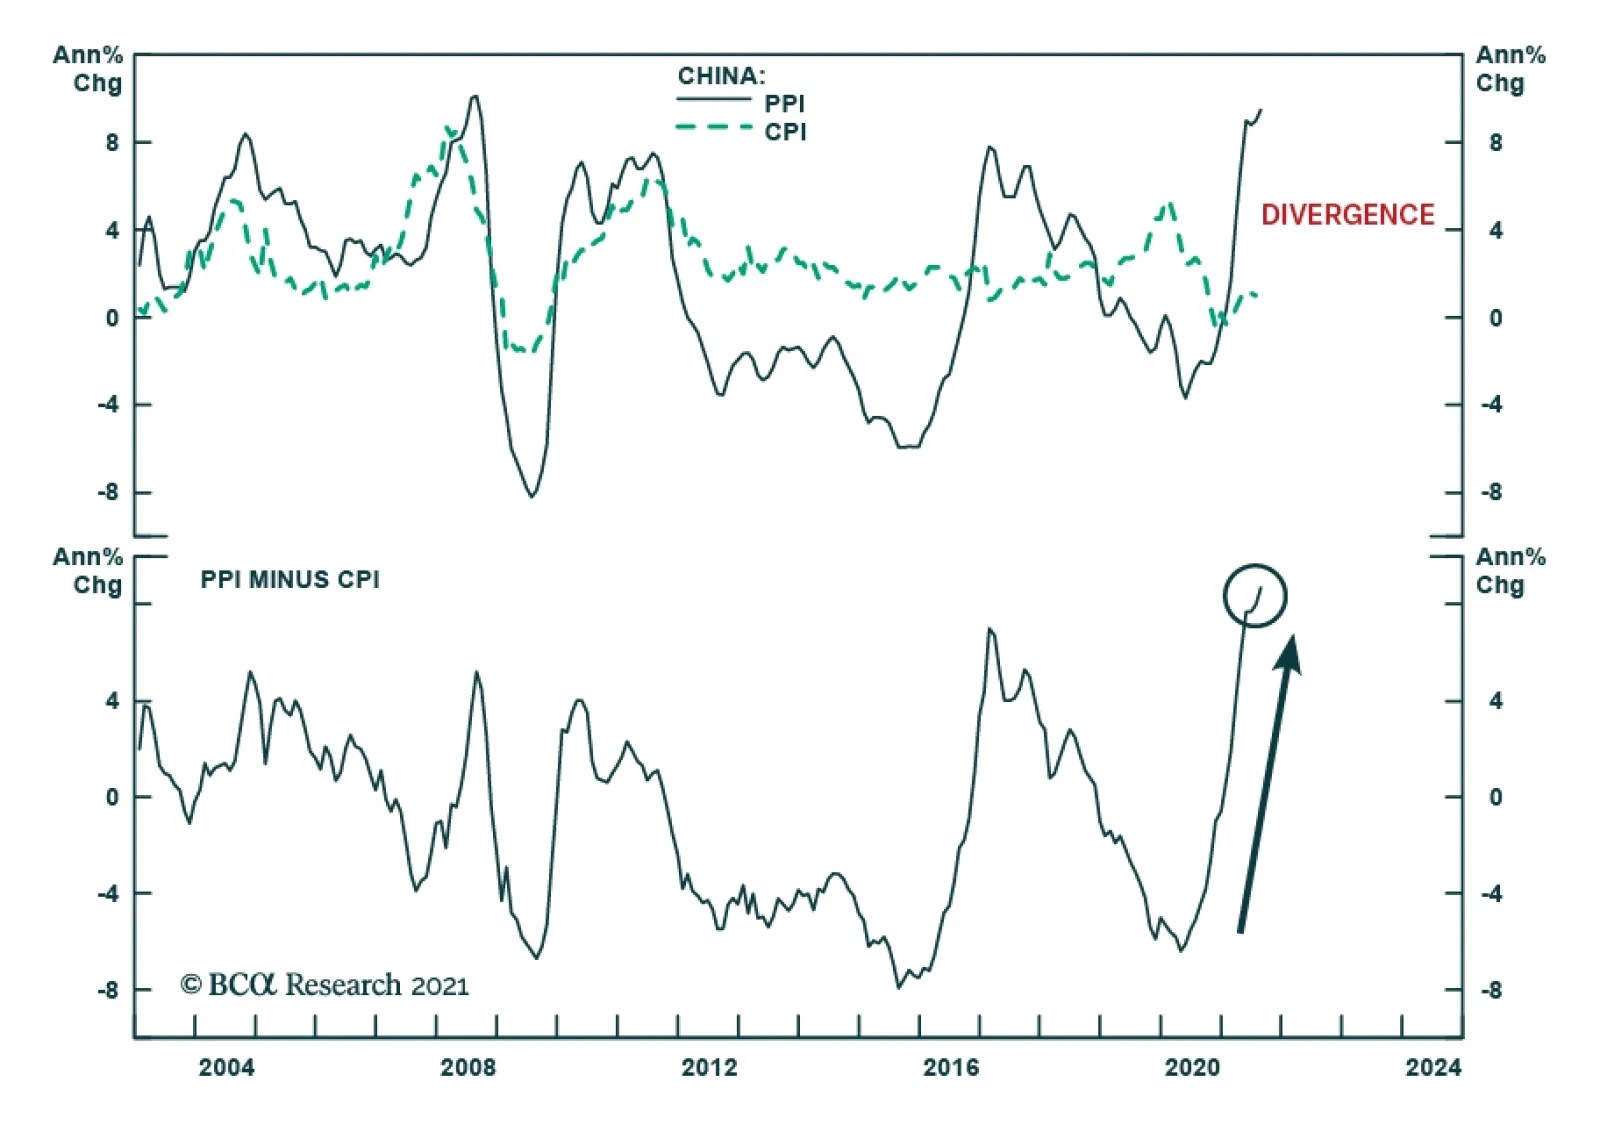
The gap between Chinese producer prices and consumer prices widened to a 31-year high in August. CPI inflation slowed to 0.8% y/y and fell below expectations it would remain unchanged at July's 1.0%. Meanwhile, PPI accelerated to a 13-year high of 9.5%…
Highlights The US Climate Prediction Center gives ~ 70% odds another La Niña will form in the August – October interval and will continue through winter 2021-22. This will be a second-year La Niña if it forms, and will raise the odds of a repeat of last winter's cold weather in the Northern Hemisphere.1 Europe's natural-gas inventory build ahead of the coming winter remains erratic, particularly as Russian flows via Ukraine to the EU have been reduced this year. Russia's Nord Stream 2 could be online by November, but inventories will still be low. China, Japan, South Korea and India – the four top LNG consumers in Asia – took in 155 Bcf of the fuel in June. A colder-than-normal winter would boost demand. Higher prices are likely in Europe and Asia (Chart of the Week). US storage levels will be lower going into winter, as power generation demand remains stout, and the lingering effects from Hurricane Ida reduce supplies available for inventory injections. Despite spot prices trading ~ $1.30/MMBtu above last winter's highs – currently ~ $4.60/MMBtu – we are going long 1Q22 NYMEX $5.00/MMBtu natgas calls vs short NYMEX $5.50/MMBtu natgas calls expecting even higher prices. Feature Last winter's La Niña was a doozy. It brought extreme cold to Asia, North America and Europe, which pulled natural gas storage levels sharply lower and drove prices sharply higher as the Chart of the Week shows. Natgas storage in the US and Europe will be tight going into this winter (Chart 2). Europe's La Niña lingered a while into Spring, keeping temps low and space-heating demand high, which delayed the start of re-building inventory for the coming winter. In the US, cold temps in the Midwest hampered production, boosted demand and caused inventory to draw hard. Chart of the WeekA Return Of La Niña Could Boost Global Natgas Prices
A Return Of La Niña Could Boost Global Natgas Prices
A Return Of La Niña Could Boost Global Natgas Prices
Chart 2Europe, US Gas Stocks Will Be Tight This Winter
NatGas: Winter Is Coming
NatGas: Winter Is Coming
Summer in the US also produced strong natgas demand, particularly out West, as power generators eschewed coal in favor of gas to meet stronger air-conditioning demand. This is partly due to the closing of coal-fired units, leaving more of the load to be picked up by gas-fired generation (Chart 3). The EIA estimates natgas consumption in July was up ~ 4 Bcf/d to just under 76 Bcf/d. Hurricane Ida took ~ 1 bcf/d of demand out of the market, which was less than the ~ 2 Bcf/d hit to US Gulf supply resulting from the storm. As a result, prices were pushed higher at the margin. Chart 3Generators Prefer Gas To Coal
NatGas: Winter Is Coming
NatGas: Winter Is Coming
US natgas exports (pipeline and LNG) also were strong, at 18.2 Bcf/d in July (Chart 4). We expect US LNG exports, in particular, to resume growth as the world recovers from the COVID-19 pandemic (Chart 5). This strong demand and exports, coupled with slightly lower supply from the Lower 48 states – estimated at ~ 98 Bcf/d by the EIA for July (Chart 6) – pushed prices up by 18% from June to July, "the largest month-on-month percentage change for June to July since 2012, when the price increased 20.3%" according to the EIA. Chart 4US Natgas Exports Remain Strong
US Natgas Exports Remain Strong
US Natgas Exports Remain Strong
Chart 5US LNG Exports Will Resume Growth
NatGas: Winter Is Coming
NatGas: Winter Is Coming
Chart 6US Lower 48 Natgas Production Recovering
US Lower 48 Natgas Production Recovering
US Lower 48 Natgas Production Recovering
Elsewhere in the Americas, Brazil has been a strong bid for US LNG – accounting for 32.3 Bcf of demand in June – as hydroelectric generation flags due to the prolonged drought in the country. In Asia, demand for LNG remains strong, with the four top consumers – China, Japan, South Korea, and India – taking in 155 Bcf in June, according to the EIA. Gas Infrastructure Ex-US Remains Challenged A combination of extreme cold weather in Northeast Asia, and a lack of gas storage infrastructure in Asia generally, along with shipping constraints and supply issues at LNG export facilities, led to the Asian natural gas price spike in mid-January.2 Very cold weather in Northeast Asia, drove up LNG demand during the winter months. In China, LNG imports for the month of January rose by ~ 53% y-o-y (Chart 7).3 The increase in imports from Asia coincided with issues at major export plants in Australia, Norway and Qatar during that period. Chart 7China's US LNG Exports Surged Last Winter, And Remain Stout Over The Summer
NatGas: Winter Is Coming
NatGas: Winter Is Coming
Substantially higher JKM (Japan-Korea Marker) prices incentivized US exporters to divert LNG cargoes from Europe to Asia last winter. The longer roundtrip times to deliver LNG from the US to Asia – instead of Europe – resulted in a reduction of shipping capacity, which ended up compounding market tightness in Europe. Europe dealt with the switch by drawing ~ 18 bcm more from their storage vs. the previous year, across the November to January period. Countries in Asia - most notably Japan – however, do not have robust natural gas storage facilities, further contributing to price volatility, especially in extreme weather events. These storage constraints remain in place going into the coming winter. In addition, there is a high probability the global weather pattern responsible for the cold spells around the globe that triggered price spikes in key markets globally – i.e., a second La Niña event – will return. A Second-Year La Niña Event The price spikes and logistical challenges of last winter were the result of atmospheric circulation anomalies that were bolstered by a La Niña event that began in mid-2020.4 The La Niña is characterized by colder sea-surface temperatures that develops over the Pacific equator, which displaces atmospheric and wind circulation and leads to colder temperatures in the Northern Hemisphere (Map 1). Map 1La Niña Raises The Odds Of Colder Temps
NatGas: Winter Is Coming
NatGas: Winter Is Coming
The IEA notes last winter started off without any exceptional deviations from an average early winter, but as the new year opened "natural gas markets experienced severe supply-demand tensions in the opening weeks of 2021, with extremely cold temperature episodes sending spot prices to record levels."5 In its most recent ENSO update, the US Climate Prediction Center raised the odds of another La Niña event for this winter to 70% this month. If similar conditions to those of the 2020-21 winter emerge, US and European inventories could be stretched even thinner than last year, as space-heating demand competes with industrial and commercial demand resulting from the economic recovery. Global Natgas Supplies Will Stay Tight JKM prices and TTF (Dutch Title Transfer Facility) prices are likely to remain elevated going into winter, as seen in the Chart of the Week. Fundamentals have kept markets tight so far. Uncertain Russian supply to Europe will raise the price of the European gas index (TTF). This, along with strong Asian demand, particularly from China, will keep JKM prices high (Chart 8). The global economic recovery is the main short-term driver of higher natgas demand, with China leading the way. For the longer-term, natural gas is considered as the ideal transition fuel to green energy, as it emits less carbon than other fossil fuels. For this reason, demand is expected to grow by 3.4% per annum until 2035, and reach peak consumption later than other fossil fuels, according to McKinsey.6 Chart 8BCAs Brent Forecast Points To Higher JKM Prices
BCAs Brent Forecast Points To Higher JKM Prices
BCAs Brent Forecast Points To Higher JKM Prices
Spillovers from the European natural gas market impact Asian markets, as was demonstrated last winter. Russian supply to Europe – where inventories are at their lowest level in a decade – has dropped over the last few months. This could either be the result of Russia's attempts to support its case for finishing Nord Stream 2 and getting it running as soon as possible, or because it is physically unable to supply natural gas.7 A fire at a condensate plant in Siberia at the beginning of August supports the latter conjecture. The reduced supply from Russia, comes at a time when EU carbon permit prices have been consistently breaking records, making the cost of natural gas competitive compared to more heavy carbon emitting fossil fuels – e.g., coal and oil – despite record breaking prices. With Europe beginning the winter season with significantly lower stock levels vs. previous years, TTF prices will remain volatile. This, and strong demand from China, will support JKM prices. Investment Implications Natural gas prices are elevated, with spot NYMEX futures trading ~ $1.30/MMBtu above last winter's highs – currently ~ $4.60/MMBtu. Our analysis indicates prices are justifiably high, and could – with the slightest unexpected news – move sharply higher. Because natgas is, at the end of the day, a weather market, we favor low-cost/low-risk exposures. In the current market, we recommend going long 1Q22 NYMEX $5.00/MMBtu natgas calls vs short NYMEX $5.50/MMBtu natgas calls expecting even higher prices. This is the trade we recommended on 8 April 2021, at a lower level, which was stopped out on 12 August 2021 with a gain of 188%. Robert P. Ryan Chief Commodity & Energy Strategist rryan@bcaresearch.com Ashwin Shyam Research Associate Commodity & Energy Strategy ashwin.shyam@bcaresearch.com Commodities Round-Up Energy: Bullish Earlier this week, Saudi Aramco lowered its official selling price (OSP) by more than was expected – lowering its premium to the regional benchmark to $1.30/bbl from $1.70/bbl – in what media reports based on interviews with oil traders suggest is an attempt to win back customers electing not to take volumes under long-term contracts. This is a marginal adjustment by Aramco, but still significant, as it shows the company will continue to defend its market share. Pricing to Northwest Europe and the US markets is unchanged. Aramco's majority shareholder, the Kingdom of Saudi Arabia (KSA), is the putative leader of OPEC 2.0 (aka, OPEC+) along with Russia. The producer coalition is in the process of returning 400k b/d to the market every month until it has restored the 5.8mm b/d of production it took off the market to support prices during the COVID-19 pandemic. We expect Brent crude oil prices to average $70/bbl in 2H21, $73/bbl in 2022 and $80/bbl in 2023. Base Metals: Bullish Political uncertainty in Guinea caused aluminum prices to rise to more than a 10-year high this week (Chart 9). A coup in the world’s second largest exporter of bauxite – the main ore source for aluminum – began on Sunday, rattling aluminum markets. While iron ore prices rebounded primarily on the record value of Chinese imports in August, the coup in Guinea – which has the highest level of iron ore reserves – could have also raised questions about supply certainty. This will contribute to iron-ore price volatility. However, we do not believe the coup will impact the supply of commodities as much as markets are factoring, as coup leaders in commodity-exporting countries typically want to keep their source of income intact and functioning. Precious Metals: Bullish Gold settled at a one-month high last Friday, when the US Bureau of Labor Statistics released the August jobs report. The rise in payrolls data was well below analysts’ estimates, and was the lowest gain in seven months. The yellow metal rose on this news as the weak employment data eased fears about Fed tapering, and refocused markets on COVID-19 and the delta variant. Since then, however, the yellow metal has not been able to consolidate gains. After falling to a more than one-month low on Friday, the US dollar rose on Tuesday, weighing on gold prices (Chart 10). Chart 9
Aluminum Prices Recovering
Aluminum Prices Recovering
Chart 10
Weaker USD Supports Gold
Weaker USD Supports Gold
Footnotes 1 Please see the US Climate Prediction Center's ENSO: Recent Evolution, Current Status and Predictions report published on September 6, 2021. 2 Please see Asia LNG Price Spike: Perfect Storm or Structural Failure? Published by Oxford Institute for Energy Studies. 3 Since China LNG import data were reported as a combined January and February value in 2020, we halved the combined value to get the January 2020 amount. 4 Please see The 2020/21 Extremely Cold Winter in China Influenced by the Synergistic Effect of La Niña and Warm Arctic by Zheng, F., and Coauthors (2021), published in Advances in Atmospheric Sciences. 5 Please see the IEA's Gas Market Report, Q2-2021 published in April 2021. 6 Please see Global gas outlook to 2050 | McKinsey on February 26, 2021. 7 Please see ICIS Analyst View: Gazprom’s inability to supply or unwillingness to deliver? published on August 13, 2021. Investment Views and Themes Recommendations Strategic Recommendations Tactical Trades Commodity Prices and Plays Reference Table Trades Closed in 2021 Summary of Closed Trades
BCA Research's China Investment Strategy service concludes that small and medium caps will likely continue to outperform large-cap stocks this year. Chinese small and medium-cap (SMID-cap) stocks have outperformed large-caps since February and the recent…
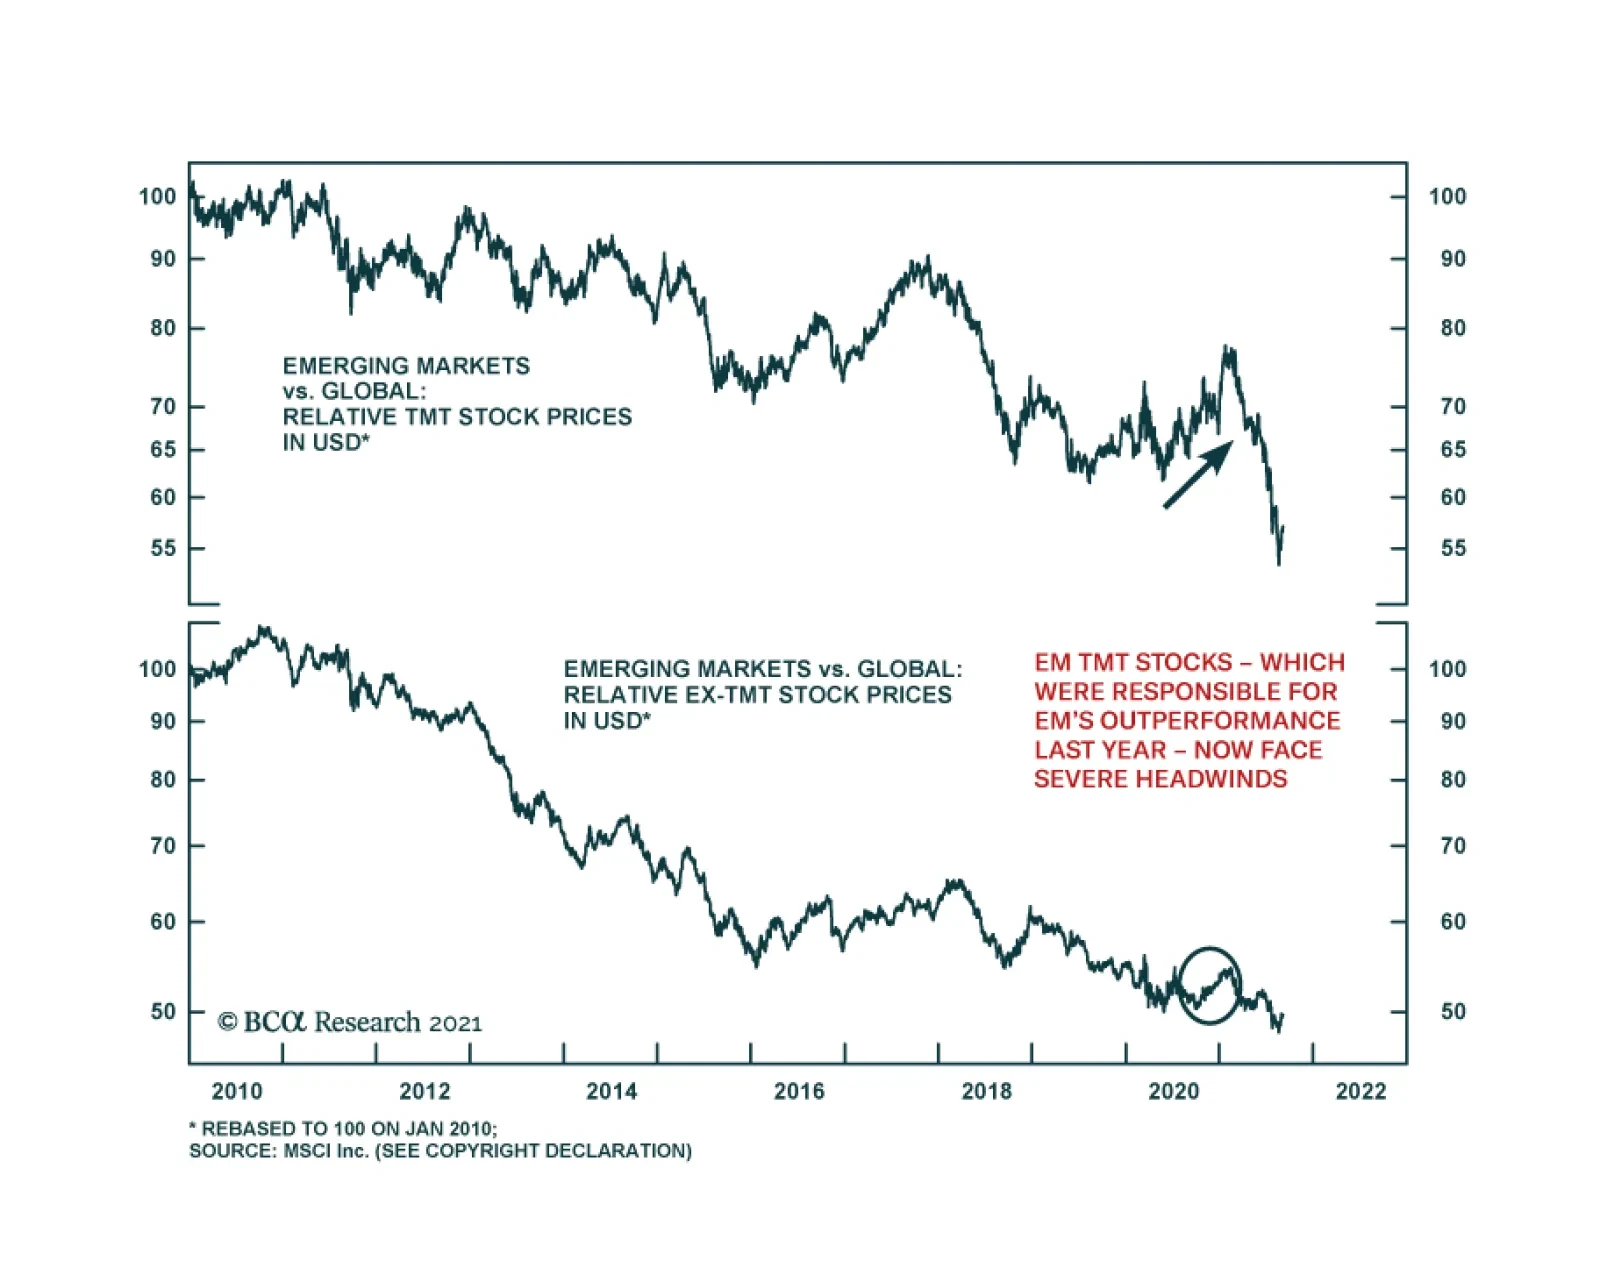
Feature Chart 1Chinese Offshore Stocks Tumbled Amid Regulatory Crackdowns
Chinese Offshore Stocks Tumbled Amid Regulatory Crackdowns
Chinese Offshore Stocks Tumbled Amid Regulatory Crackdowns
Relative to the global equity index, onshore and offshore Chinese stocks have fallen by 18% and 32%, respectively, since their peaks in mid-February (Chart 1). The panic sell-off in the offshore market, which saw greater losses due to its high concentration in internet stocks, appears to be overdone and may technically rebound in the near term. However, any short-term bounce in Chinese stocks from oversold levels will likely be short-lived (Chart 2). The crackdown on new economy companies reflects socio-political and economic shifts in China, which raises the odds that the restrictions will continue with further actions focused on social welfare and healthcare. August’s official PMIs and economic data indicate a broad-based softening in China’s domestic demand and production. However, compared with 2018/19 when the US-China trade war exacerbated the deterioration in an already slowing economy, the economy now remains well supported by strong exports. Moreover, the magnitude of the slowdown has not exceeded policymakers’ pain thresholds (Chart 3). Chart 2Tactical Bounce Was Short-Lived In Previous Downturns
Tactical Bounce Was Short-Lived In Previous Downturns
Tactical Bounce Was Short-Lived In Previous Downturns
Chart 3China's Economic Recovery Losing Steam, But From An Elevated Level
China's Economic Recovery Losing Steam, But From An Elevated Level
China's Economic Recovery Losing Steam, But From An Elevated Level
In 2018/19, stimulus was measured and the authorities did not meaningfully relax limits on bank lending standards and shadow banking. Furthermore, China recently reiterated its cross-cycle macro policy setting, which means that policymakers will not use significant stimulus to achieve high and short-term economic growth. Given financial stability measures that aim to contain risks associated with the housing market and hidden local government debt, any monetary and fiscal easing will likely help to stabilize credit growth instead of substantially boosting it this year. For the time being, China’s financial assets continue to face downside risks stemming from a confluence of a weakening business cycle and ongoing regulatory tightening. Thus, we recommend investors maintain an underweight allocation to Chinese equities within a global equity portfolio. Qingyun Xu, CFA Associate Editor qingyunx@bcaresearch.com A Shining Moment For Chinese Small And Medium Caps Small and medium-cap (SMID-cap) stocks have outperformed large-caps since February and the recent regulatory restrictions have intensified the situation. The CSI500 index, which comprises 500 SMID-cap companies, has outperformed the large-cap CSI300 by 34% since mid-February (Chart 4, top panel). Uncertainties surrounding the pandemic and corporate earnings growth have fueled extreme dislocations between large-cap and SMID-cap stocks last year. Large-cap stocks were the main contributors to China’s stock rallies in the second half of last year, while the valuation premia in small cap stocks was compressed to near decade lows (Chart 4, bottom panel). Chart 4A Low Valuation Premia And More Policy Support May Further Lift Prices Of SMID-Caps
A Low Valuation Premia And More Policy Support May Further Lift Prices Of SMID-Caps
A Low Valuation Premia And More Policy Support May Further Lift Prices Of SMID-Caps
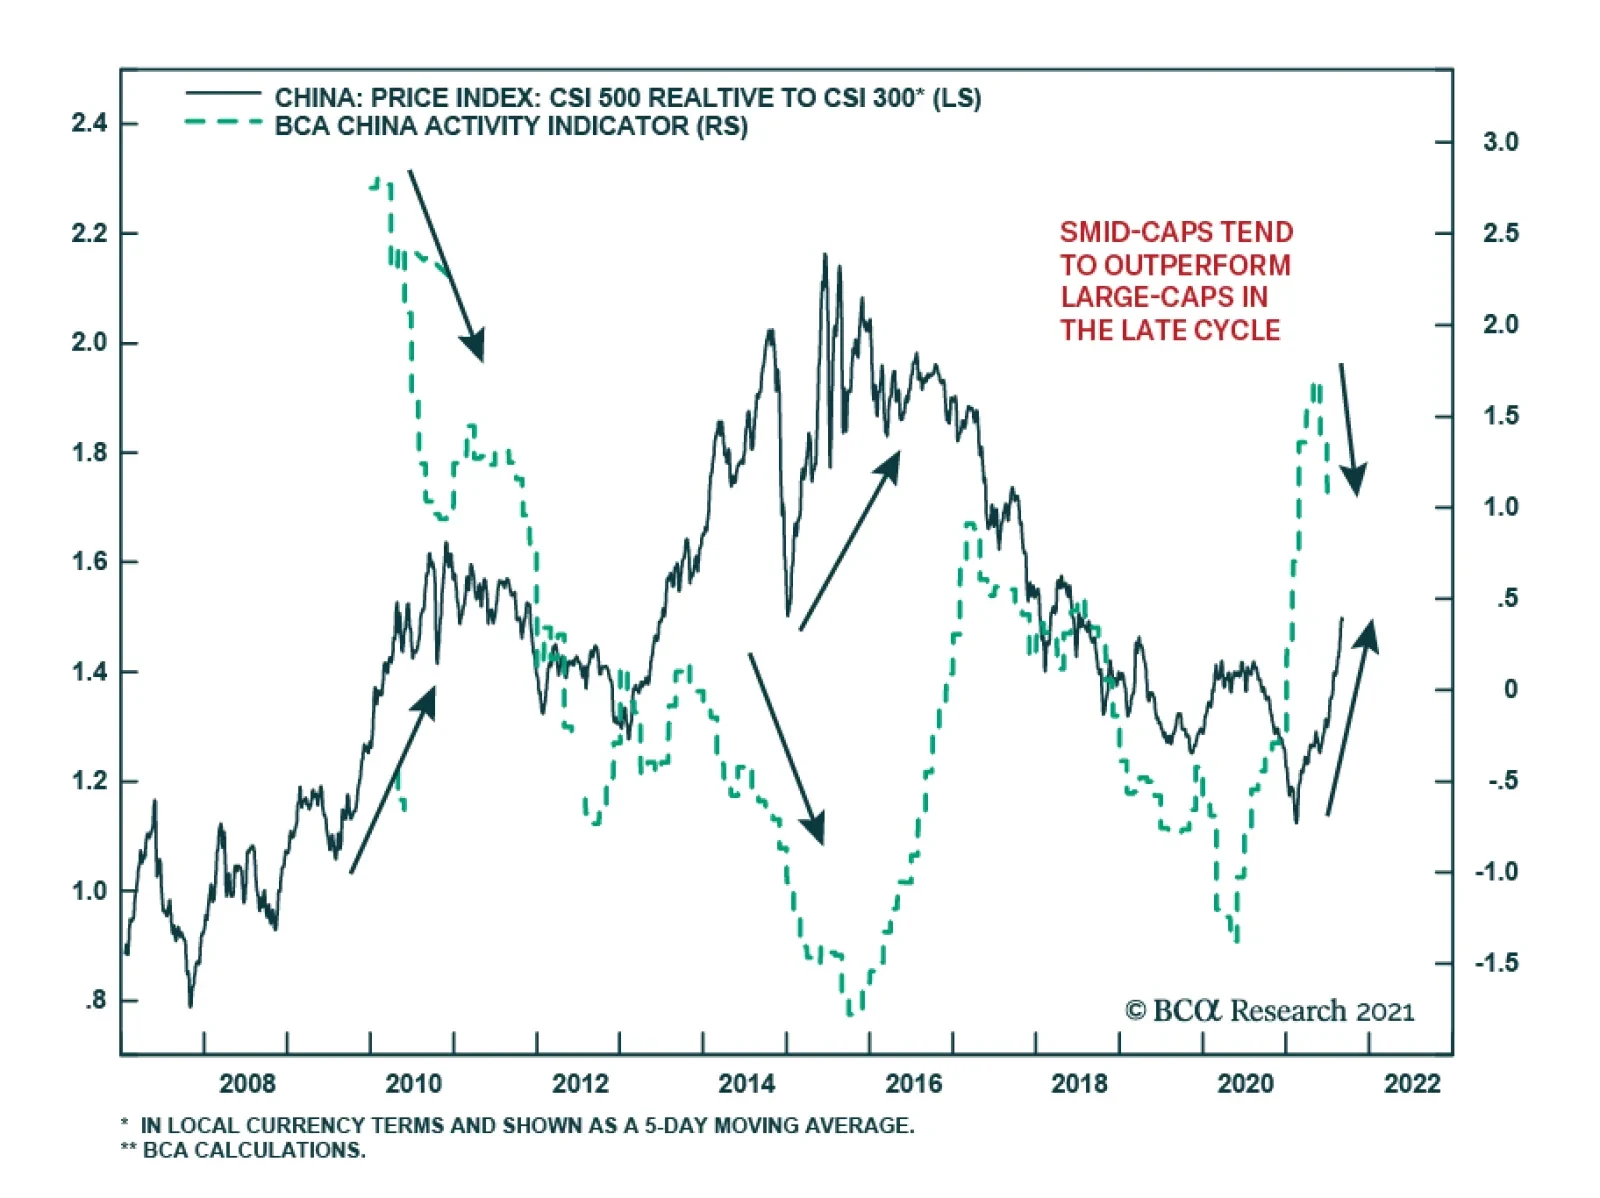
Chart 5SMID-Caps Tend To Outperform Large-Caps In Late Business Cycle
SMID-Caps Tend To Outperform Large-Caps In Late Business Cycle
SMID-Caps Tend To Outperform Large-Caps In Late Business Cycle
Historically, SMID-caps tend to outperform large-caps in the late cycle of an economic recovery (Chart 5). The spate of regulatory changes aimed at monopolistic behaviors in various sectors has curbed investors’ appetite for the industry leaders. In addition, the government’s increasing efforts to support small and medium corporates (SMEs) will help to shore up confidence in those companies. Therefore, small and medium caps will likely continue to outperform large-cap stocks this year. Fiscal Support: How Much Room In 2H? The July Politburo meeting pledged more fiscal support for the economy later in 2021 and into 2022. We expect local government bond (LGB) issuance to accelerate: a 4.47 trillion RMB new local government bond issuance quota was approved for 2021, including 820 billion in general bonds and 3.65 trillion in special purpose bonds (SPBs). By end-August, 2.37 trillion new local government bonds had been issued, which was only 53% of the entire year’s goal. However, there are some constraints that will likely reduce the reflationary effects on the economy. First, the quota for LGB issuance approved by the National People’s Congress is 16% lower than last year, but the amount of LGBs maturing this year is 30% higher. Therefore, even though this year’s gross LGB issuance has kept pace with that of last year, more than half of the LGBs issued from January to August was used for debt repayment (Chart 6). The move by local governments to use a large portion of their bond issuance quota to pay off existing debt resembles the situation in 2018 when a financial de-risking campaign encouraged local governments to reduce the stockpile of their leverage. As noted in last week’s report, infrastructure investment and the economy did not rebound in 2H2018, even though LGB issuance picked up (Chart 7). Chart 6More Than Half Of LGBs Issued This Year Has Been Used For Debt Repayment
Chinese Small And Medium Caps Are Finding Their Shining Moment
Chinese Small And Medium Caps Are Finding Their Shining Moment
Chart 7Improvement In Infrastructure Investment Was Short-Lived In 2019
Improvement In Infrastructure Investment Was Short-Lived In 2019
Improvement In Infrastructure Investment Was Short-Lived In 2019
Even if we assume that local governments will use all of their remaining bond quota by year end, the gross monthly average in local government bond issuance will be around 580 billion, only slightly higher than in 2H 2020. Secondly, infrastructure investment is discouraged by stringent regulations to approve projects (including project assessment and debt repayment ability) and the accountability of local officials for project failures. Approvals for infrastructure projects remain at the lowest level since March last year (Chart 8). Finally, SPBs made up only about 15% of overall infrastructure spending in the past three years, while the majority came from public-private partnerships (PPP) financing, revenues from government-managed funds, government budgets and bank loans. Falling proceeds from land transfers have dragged down government-managed funds (Chart 9). In addition, government expenditures show no signs of a material increase (Chart 9, bottom panel). Chart 8Infrastructure Investment Will Remain Subdued
Infrastructure Investment Will Remain Subdued
Infrastructure Investment Will Remain Subdued
Chart 9Government Expenditures Remain Muted
Government Expenditures Remain Muted
Government Expenditures Remain Muted
As discussed in previous reports, local government bonds issuance only accounts for 12% of total social financing. As such, without a sizeable acceleration in bank loans, enhanced LGB issuance would not be enough to prompt a substantial increase in infrastructure investment growth. Our argument is underscored by the structural downshift in infrastructure investment since 2017 (Chart 7, top panel). Therefore, additional local government bond issuance this year will help to stabilize but not boost credit growth. August PMIs Confirm Slowing Economic Activity China's official PMIs eased further in August. The non-manufacturing index fell to contractionary territory of 47.5, below the expectation of a more muted 1.3-point decline to 52.0. Similarly, the manufacturing PMI eased by 0.3 points to 50.1, which is a hair above the 50 boom-bust line. Together, weakness in both sectors pushed down the composite index to 48.9 (Chart 10). Stringent restrictions designed to halt rising rates in COVID-19 infections explain much of the deterioration in China’s service-sector activity. The sector will likely rebound in September with the easing in infection levels (Chart 11). Chart 10PMIs Show Slowing Economic Activity
PMIs Show Slowing Economic Activity
PMIs Show Slowing Economic Activity
Chart 11Lingering COVID Effects Curb Service-Sector Recovery In 2H21
Lingering COVID Effects Curb Service-Sector Recovery In 2H21
Lingering COVID Effects Curb Service-Sector Recovery In 2H21
Meanwhile, the construction PMI surprisedly rebounded sharply in August (Chart 10, bottom panel). However, investors should be cautious not to read too much into the idiosyncratic month-on-month moves suggested by the construction PMI. Instead, construction activity has moderated significantly and is set to slow further, hinting at plunged excavator sales and real estate investment in construction (Chart 12). Chart 12Construction Activity Is Unlikely To Pick Up Meaningfully This Year
Construction Activity Is Unlikely To Pick Up Meaningfully This Year
Construction Activity Is Unlikely To Pick Up Meaningfully This Year
It is clear that China’s economy is losing momentum, but greater economic weakness will be needed for policymakers to stimulate meaningfully. Export Sector Remains A Bright Spot China’s exports remain robust. Export growth picked up in August from July on a year-over-year basis. Although the improvement in August reflects a base effect, exports in level reached a new high (Chart 13). Both skyrocketed exports container freight index and strong Korean exports suggest that global demand for Chinese manufacturing goods remains resilient (Chart 14). Even though manufacturing PMIs from developed markets have rolled over, they remain elevated and should continue to support China’s exports (Chart 15). Chart 13Chinese August Exports In Level Reached A New High
Chinese Small And Medium Caps Are Finding Their Shining Moment
Chinese Small And Medium Caps Are Finding Their Shining Moment
Chart 14Exports Will Remain Robust In The Rest Of The Year...
Exports Will Remain Robust In The Rest Of The Year...
Exports Will Remain Robust In The Rest Of The Year...
In contrast to resilient exports, China’s official PMI export new orders subindex has declined for five consecutive months. Even though falling PMI new export orders subindex heralds a slowing in exports growth, a reading of below the 50 boom-bust threshold in the former does not suggest a contraction in the growth rate of the latter. Furthermore, the month-over-month nature of PMI new export orders subindex tends to overstate the volatility in exports. The divergence between the PMI new export orders subindex and real export growth also occurred in 2018/19 during the height of the US-China trade war when export orders were volatile (Chart 16). Chart 15...And Will Continue To Benefit From Strong Global Demand
...And Will Continue To Benefit From Strong Global Demand
...And Will Continue To Benefit From Strong Global Demand
Chart 16A Divergence Between PMI New Export Orders And Export Growth
A Divergence Between PMI New Export Orders And Export Growth
A Divergence Between PMI New Export Orders And Export Growth
Regulatory Tightening In Real Estate Sector Stringent regulations in housing since the beginning of the year have started to cool the sector (Chart 17). However, home prices inflation in tier-one cities is still elevated (Chart 18). Thus, we expect the controls on housing and among property developers will remain in place for the next 6 to 12 months. Chart 17Housing Sector Is Cooling...
Housing Sector Is Cooling...
Housing Sector Is Cooling...
Chart 18...But Housing Prices In First-Tier Cities Keep Rising At A Faster Rate
...But Housing Prices In First-Tier Cities Keep Rising At A Faster Rate
...But Housing Prices In First-Tier Cities Keep Rising At A Faster Rate
Industrial Profits: Rising Prices, Falling Production China’s industrial profit growth remained solid in July despite the waning low base effect. Manufacturing producer prices continued to rise, offsetting weaker production growth (Chart 19). In addition, a low interest-rate environment helped to lift profits in the manufacturing sector by reducing debt servicing costs. While we expect weakening domestic demand and peaking producer prices to weigh on corporate profits in the rest of this year, profit growth is rolling over from a lofty height and will not likely drop sharply in the coming months (Chart 20). In addition, producer prices will likely remain at a historically high level in the next six months given robust global demand for raw materials and persistent global supply shortages. Chart 19Rising Prices And Low Interest Rates Helped To Offset Falling Industrial Production
Rising Prices And Low Interest Rates Helped To Offset Falling Industrial Production
Rising Prices And Low Interest Rates Helped To Offset Falling Industrial Production
Chart 20Peaking Producer Prices Will Weigh On Corporate Profits
Peaking Producer Prices Will Weigh On Corporate Profits
Peaking Producer Prices Will Weigh On Corporate Profits
Meanwhile, there is a large gap between the prices for producer goods and consumer goods, suggesting that manufacturers in mid-to-downstream industries have not been able to fully pass on rising input costs to domestic consumers (Chart 21). Profit growth continues to be disproportionally stronger in the upstream industrial producers than in the downstream industries, while the profit margin in the manufacturing sector remains much more muted (Chart 22). Chart 21Inflation Passthrough From Manufacturers To Domestic Consumers Remains Limited
Inflation Passthrough From Manufacturers To Domestic Consumers Remains Limited
Inflation Passthrough From Manufacturers To Domestic Consumers Remains Limited
Chart 22Profit Growth In Upstream Industries Still Outpaces Manufacturing Sector
Profit Growth In Upstream Industries Still Outpaces Manufacturing Sector
Profit Growth In Upstream Industries Still Outpaces Manufacturing Sector
Table 1
Chinese Small And Medium Caps Are Finding Their Shining Moment
Chinese Small And Medium Caps Are Finding Their Shining Moment
Table 2
Chinese Small And Medium Caps Are Finding Their Shining Moment
Chinese Small And Medium Caps Are Finding Their Shining Moment
Footnotes Market/Sector Recommendations Cyclical Investment Stance