Geopolitics
One clear way for President Trump to achieve a policy victory and a boost to the economy would be to agree to a trade deal with China. Just as he raised the tariffs unilaterally, he can roll them back unilaterally to encourage the financial markets and CEO…
President Trump is a uniquely commercial president. He did not become president through experience in military or government, but because he was a bold businessman who claimed he could negotiate better deals for the United States. So he is even more…

Highlights China’s trade strategy toward the U.S. is not greatly affected by the early U.S. Democratic Party primary election. The sea change in American policy toward China began before Donald Trump and is grounded in U.S. grand strategy. Yet Trump is staging a tactical retreat in his trade war and China is reciprocating, suggesting that Beijing would rather avoid a “lame duck” Trump on the warpath. Beijing will not implement structural changes that would vindicate Trump’s negotiating strategy and set a precedent that is harmful to China’s national interests in the long run. Feature A U.S.-China trade ceasefire is in the works, based on the outcome of the latest high-level talks in Washington. President Trump, paying a surprise visit to the top Chinese negotiator, Vice Premier Liu He, agreed to pause the October 15 tariff hike in exchange for assurances that China would buy $40-$50 billion worth of agricultural goods to ease the economic pressure on Trump’s political base. Trump is now confirmed to attend the Asia Pacific Economic Cooperation summit in Santiago, Chile on November 16-17, where he hopes to cement this “phase one deal” with Chinese President Xi Jinping. Chart 1Global Policy Uncertainty To Fall
Global Policy Uncertainty To Fall
Global Policy Uncertainty To Fall
Our market-based GeoRisk Indicator for Taiwan island – which calculates Taiwanese political risk based on any excessive deviation of the Taiwanese dollar from economic fundamentals – is a good proxy for Sino-American trade tensions due to Taiwan’s high level of exposure to China and the United States. At the moment it is signaling a sharp drop in tensions. We expect global uncertainty to follow over the coming month as Trump and Xi agree to some kind of ceasefire (Chart 1). Our Taiwan risk measure tracks closely with the Global Economic Policy Uncertainty Index, which measures risk via the word count of key terms in influential global newspapers, because Taiwan is highly exposed to the world economy and trade. Taiwan is also uniquely vulnerable to the biggest source of global policy uncertainty today: the Sino-American trade war. Not only are U.S.-China relations slightly thawing, but also the risk of the U.K. leaving the EU without a withdrawal agreement has collapsed. This will reinforce Europe’s underlying political stability despite the manufacturing recession and help create a drop in global uncertainty (Chart 2). Chart 2American Policy Uncertainty To Buck The Trend
American Policy Uncertainty To Buck The Trend
American Policy Uncertainty To Buck The Trend
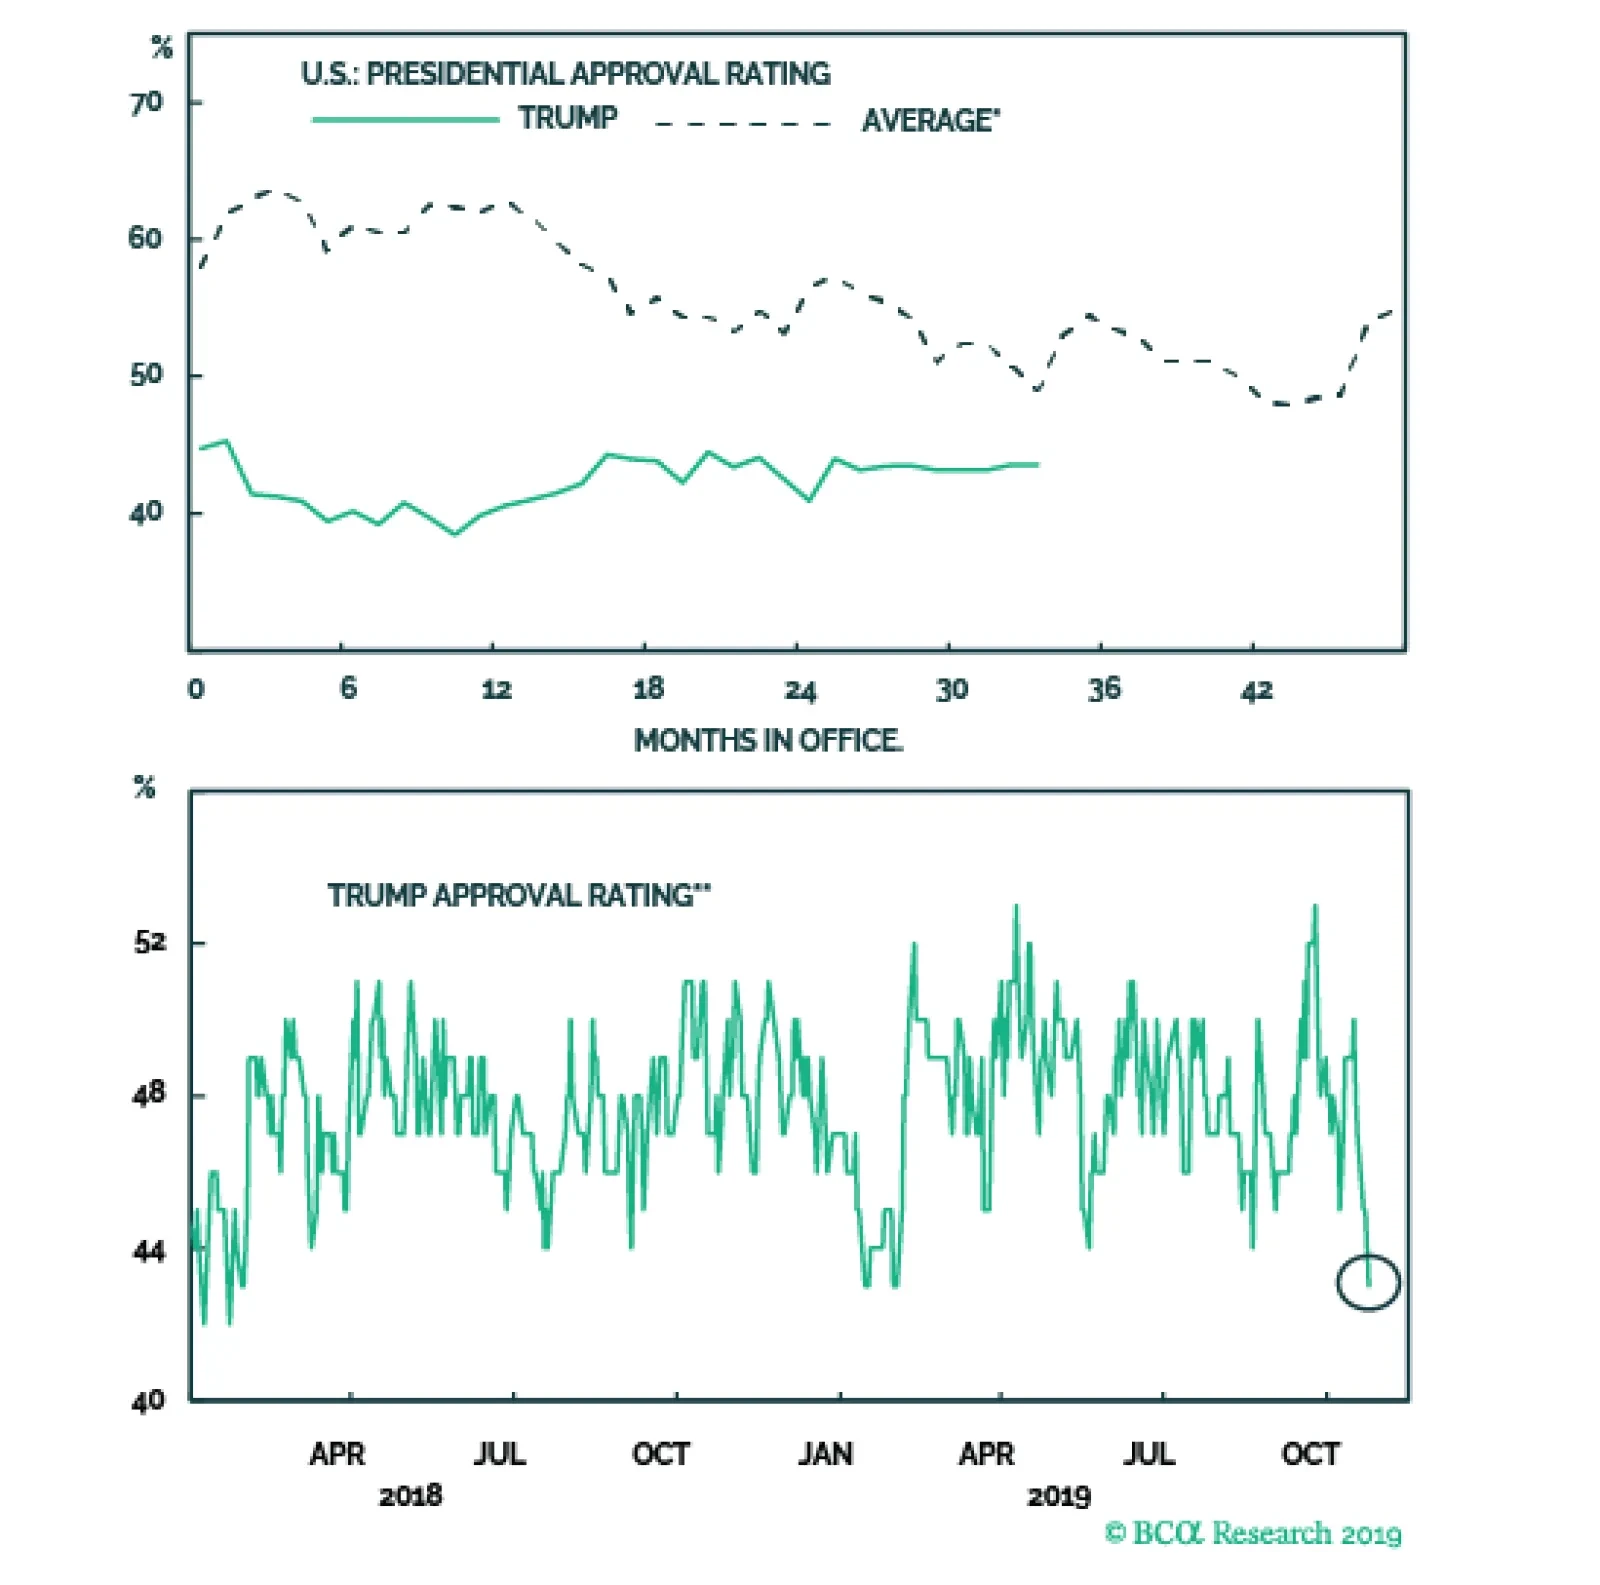
Uncertainty will remain elevated beyond the fourth quarter, however, for two main reasons. First, U.S. uncertainty will rise, not fall, as a result of the impending 2020 election. Second, the trade ceasefire is highly unlikely to resolve the slate of disagreements and underlying strategic distrust plaguing U.S.-China relations. This will cap the rebound we expect in global business sentiment. How can we be so sure that the U.S. and China will not strike a historic deal? We answer this question in this report, with particular reference to an important corollary question that has emerged in numerous client meetings: wouldn’t China rather deal with the “transactional” Trump than an “ideological” President Elizabeth Warren? Trump Is Not A “Lame Duck” Yet, Hence The Ceasefire President Trump is a uniquely commercial president. He did not become president through experience in military or government, but because he was a bold businessman who claimed he could negotiate better deals for the United States, including on immigration and trade. So he is even more vulnerable to an economic downturn than the average U.S. president. Industrial production, manufacturing, and core capital goods new orders are contracting, and sentiment is souring among both business leaders and average consumers (Chart 3). Trump faces a distinct risk that the manufacturing slowdown and psychological effects will morph into a general slowdown. Even if not outrightly recessionary, a generalized slowdown in the U.S. economy could easily lead to rising unemployment during the election year, which would all but ensure Trump’s loss of the White House. The degree of correlation between presidential approval and the unemployment rate fluctuates over time, but our survey of post-World War II presidents shows that the unemployment rate is the best indicator of the direction the approval rating will ultimately go by the end of the term in office. While Trump’s approval is highly correlated with unemployment, it is also very low – resembling President Obama’s at this point in his first term. Yet that was in the aftermath of the Great Recession, and Trump’s approval is declining as a result of the impeachment inquiry into his alleged attempt to convince Ukraine to interfere in the 2020 election in his favor. And his approval is low despite an incredibly low rate of unemployment, at 3.5%, that can hardly get better (Chart 4). Chart 3Trump Needs A Sentiment Boost For 2020
Trump Needs A Sentiment Boost For 2020
Trump Needs A Sentiment Boost For 2020
Chart 4Rising Unemployment Would Doom Trump 2020
Rising Unemployment Would Doom Trump 2020
Rising Unemployment Would Doom Trump 2020
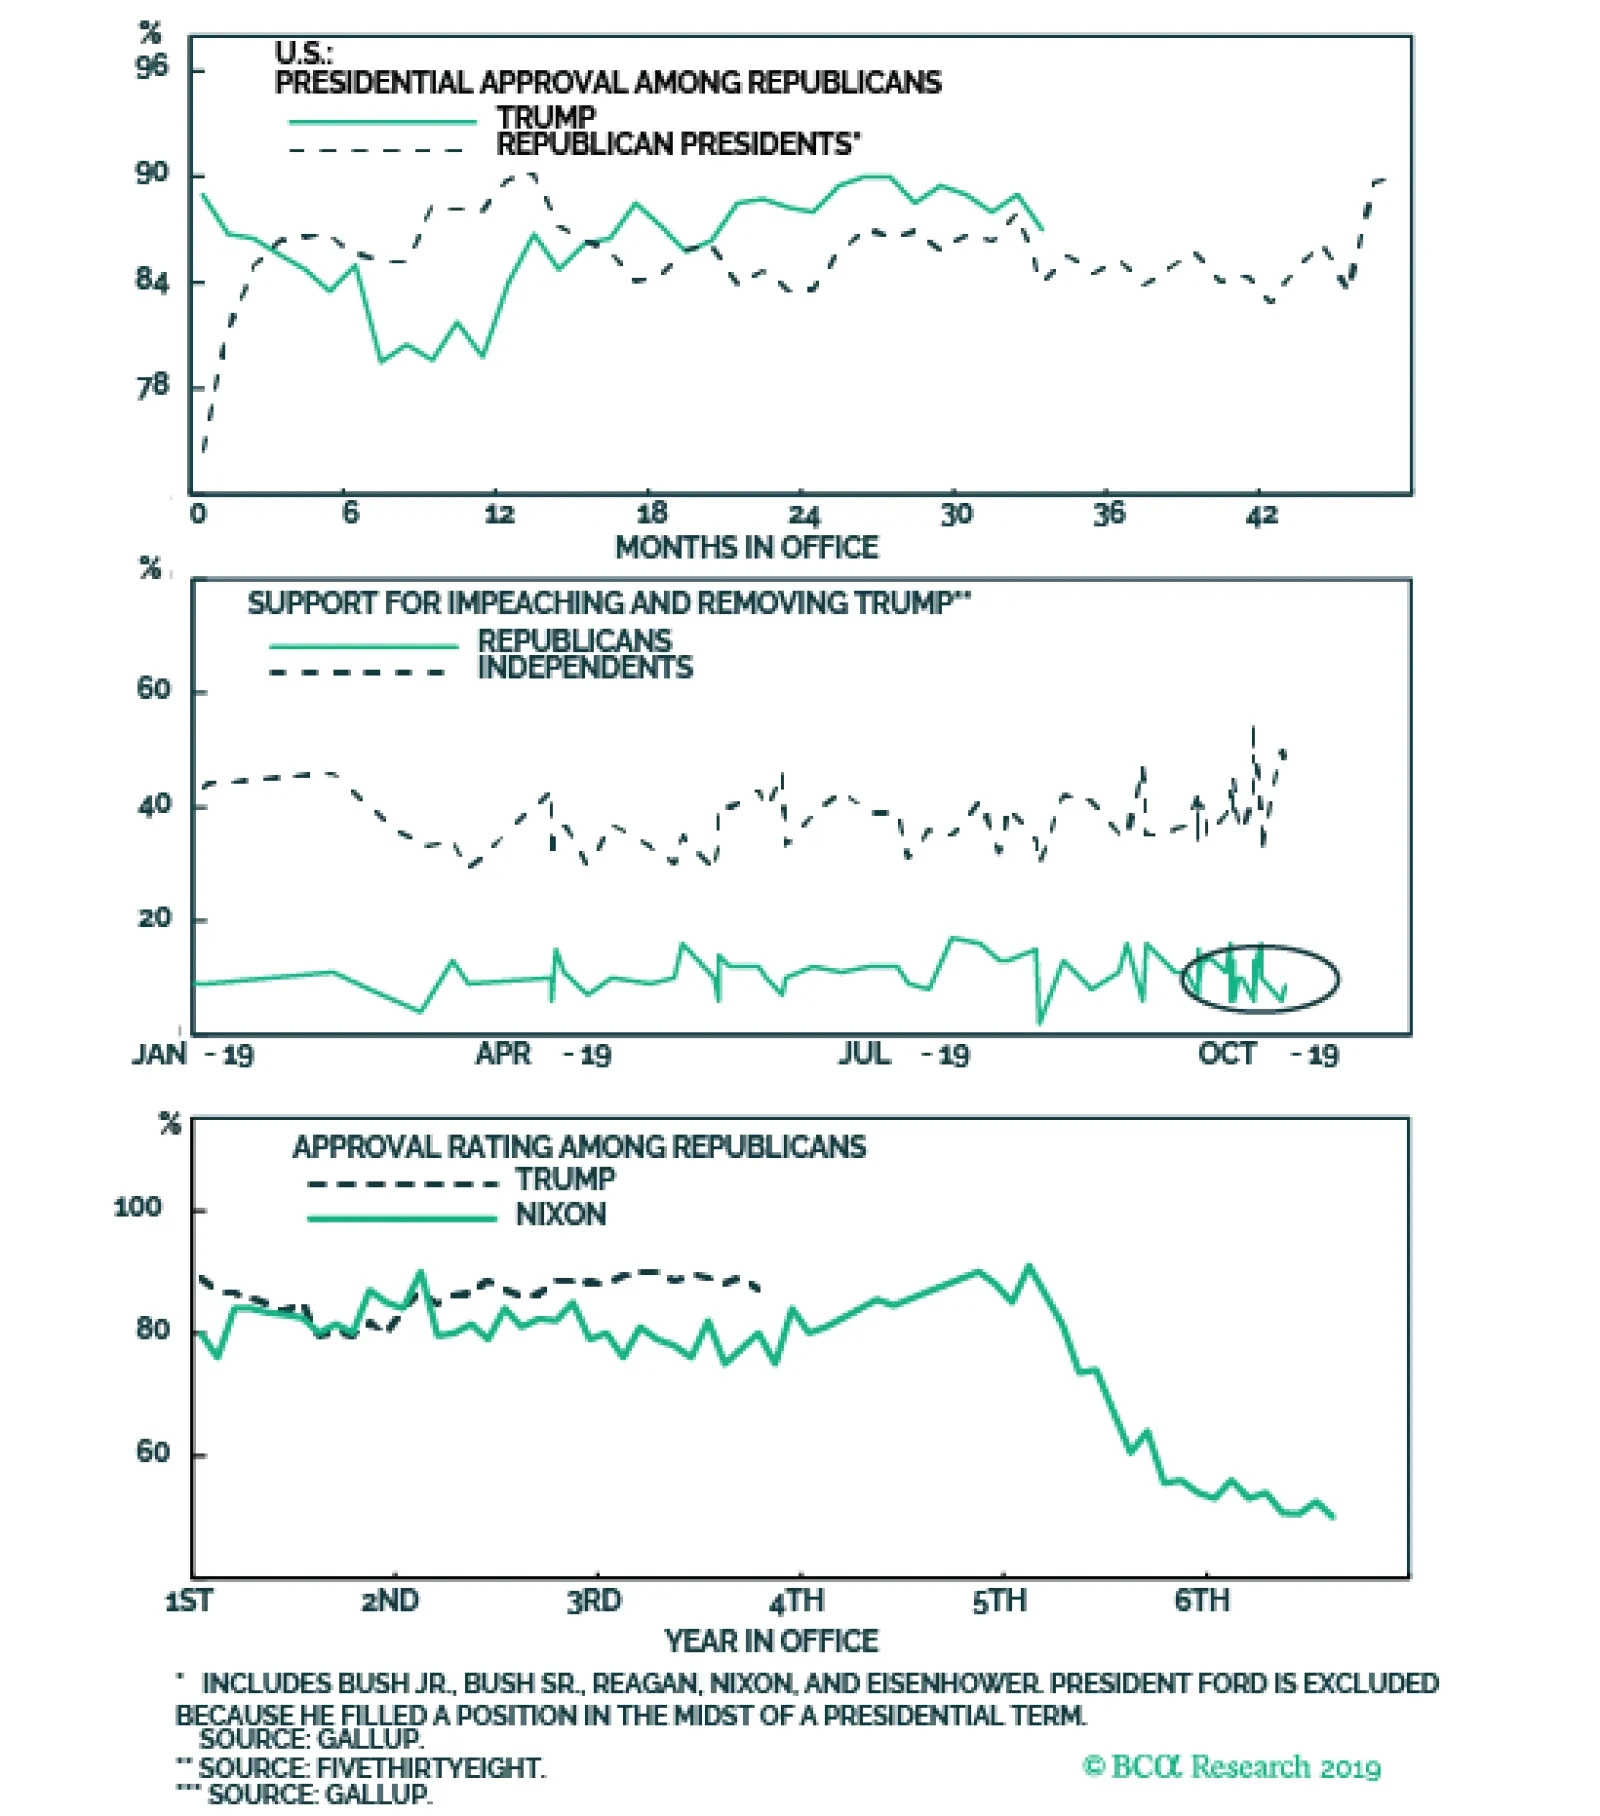
In short, Trump has very little wiggle room. To be reelected he must not only keep unemployment from rising much, but also achieve some other policy wins in order to draw closer to the average approval rate among post-World War II presidents (top panel, Chart 5). Even the Republican-friendly pollster Rasmussen shows that Trump’s general approval is dangerously eroding (bottom panel, Chart 5). One way Trump can achieve a political and economic victory would be to agree to a trade deal with China.
Chart 5
One clear way to achieve a policy victory and a boost to the economy would be to agree to a trade deal with China. Passing the U.S.-Mexico-Canada Agreement through Congress is out of his control. Policy toward China, by contrast, is entirely within his control. Just as he raised the tariffs unilaterally, so he can roll them back unilaterally to encourage the financial markets and CEO confidence – as long as talks are making progress. The downside of this argument is that if Trump becomes a “lame duck,” with a falling economy and/or approval rating virtually ensuring that he cannot get reelected, he is no longer constrained by financial markets or the economy. He would have an incentive to initiate “Cold War 2.0” with China right here and now – or some other foreign conflict – and encourage Americans to rally around the flag amid a historic confrontation with a foreign enemy. This is a huge risk to the 2020 outlook, but it runs afoul of the economic constraint, so we expect Trump to try the “Art of the Deal” one last time. What about impeachment? When the House of Representatives brings formal impeachment articles against Trump, the Senate will hold the trial. Republicans have a 53-47 majority in the Senate, requiring 20 to defect against the president to generate the 67 votes needed to make him the first president in U.S. history to be removed from office in this way. A total of 16 senators hail from states that Trump won by less than 10% in the 2016 election – so 20 defectors is a strong political constraint.
Chart 6
Unless, of course, grassroots Republican support for Trump collapses. Right now it is falling but in line with the average (top panel, Chart 6). Republicans are not warming to the idea of impeachment and removal from office (middle panel, Chart 6). We will reassess the risk of removal if Trump’s intra-party approval heads further south and begins to look like Richard Nixon’s (bottom panel, Chart 6). Bear in mind that the election is one year away – it is easier for Republicans to kick the decision over to voters than to remove one of their own from the Oval Office. A scandal big enough to prompt an exodus of Republican support will doom any chances of Republicans retaining the White House through Vice President Mike Pence or other candidates. Bottom Line: Trump’s approval rating is in dangerously low territory but he is not yet a “lame duck” freed from the shackles of political and economic constraints. He still has a shot at extending the business cycle and saving his election campaign. This is driving him to retreat from tariffs and pursue a trade ceasefire with China. The result should be a decline in global policy uncertainty in Q4. However, this decline will not last long, as American uncertainty will skyrocket during the election year and U.S.-China tensions will reemerge once the economic constraint has been reduced. China Will Accept A Ceasefire In a special report in these pages in August, we raised a critical question: if Trump is forced to retreat from his trade war, will President Xi Jinping reciprocate? Or will he refuse to bargain, leaving Trump overextended to suffer the negative economic repercussions of the trade war without the political benefit of striking a new deal? We now have our answer, at least for the near term. China resumed negotiations in October and has confirmed that progress was made. Beijing is continuing to offer some accommodation of U.S. demands in both domestic and foreign policy (e.g. financial sector opening, enforcement of sanctions on Iran). In Hong Kong SAR, not only has Beijing avoided a violent intervention and suppression of civilian protesters, but there are rumors that Chief Executive Carrie Lam is on the way out by March (which we find highly plausible). There are still plenty of risks across the broad range of U.S.-China disputes, but from the past month’s developments we can infer that President Xi is not going on the offensive in order to destroy Trump’s latest “deal-making” bid. How far will Xi go to accommodate Trump? Not so far as to implement major structural concessions. And this will limit the positive impact of the deal. Xi does not face an electoral constraint, or the loss of office (having removed term limits), nor does he face a domestic political constraint on a 12-month time frame (the twentieth national party congress is not until 2022). Economically China is much more vulnerable – this is a valid constraint. But tariffs do not force Beijing to make major structural concessions and implement them rapidly, certainly not on Trump’s time frame. The economy is slowing but not plummeting (Chart 7). China does not face conditions like 2015-16 and policymakers have decided it is best to save ammunition in case they need to use “bazooka” stimulus later. Chart 7China's Economy Holding Up
China's Economy Holding Up
China's Economy Holding Up
Chart 8China Not Reflating Property Bubble (Yet)
China Not Reflating Property Bubble (Yet)
China Not Reflating Property Bubble (Yet)
The fact that Beijing has maintained restrictions on the property sector and not allowed reflation to fuel the property bubble (Chart 8) underscores the current policy disposition: some parts of the economy need to be shored up but there is no need to panic. When it comes to tariffs, China ultimately has the option of depreciating the currency to offset the impact. The fact that the CNY-USD exchange rate has not fallen as far as the headline tariff numbers suggest it should fall indicates that Beijing is still maintaining a negotiation rather than letting the currency absorb the full impact (Chart 9). Chart 9China Can Depreciate To Offset Tariffs
China Can Depreciate To Offset Tariffs
China Can Depreciate To Offset Tariffs
Since China is still capable of “irrigation-style” fiscal stimulus, the economic constraint can be mitigated further. Beijing can continue to fight if Trump returns to the offensive. Hence we do not expect major new trade concessions beyond what is already on the table – and many of the current offerings consist of promises more so than concrete actions (Table 1).
Chart
Chart 10Beijing Throws Trump A Bone
Beijing Throws Trump A Bone
Beijing Throws Trump A Bone
We do expect China to try to avoid the worst-case scenario, since it would be destabilizing for China’s medium and long-term economy and single-party rule. Stimulus will increase as necessary to ensure that growth rebounds as Beijing seeks to improve the job market and manufacturing sector. And this also supports the logic for agreeing to a ceasefire with Trump. That China is reciprocating is apparent from the U.S.’s rebounding market share in China’s agricultural imports (Chart 10). The relevant constraint for China is that Trump could be rendered a “lame duck” and go ballistic on China, activating the full slate of threats – from high-tech export controls, to banking sanctions, to capital controls. The U.S. is still the more powerful nation in absolute terms, with enormous financial, economic, military, and technological leverage over China. Beijing also sees the danger in deliberately thwarting Trump only to have him somehow win reelection. He would then have a renewed passion for punitive measures, yet he would lack the first term’s electoral constraints. Hence there is a clear basis for President Xi to accept Trump’s tactical trade retreat. Bottom Line: President Xi does not face an imminent domestic political constraint, which gives him greater leverage than President Trump. Nevertheless he does face short term economic pressures, and enough of a geopolitical and economic constraint from a full-blown escalation of tensions to accept Trump’s offer of a ceasefire. Wouldn’t China Rather Deal With Trump Than Warren? What about the upside risk? What are the chances that Xi offers additional concessions – structural concessions – in order to achieve a groundbreaking deal with the American president? A grand compromise will not occur. Republicans and Communist Party leaders have a history of such deals, which pave the way for a new multi-year stint of deepening bilateral economic engagement. We have a high conviction view that such a grand compromise will not occur. But could the U.S. 2020 election change China’s calculus? In particular, wouldn’t China prefer to deal with Trump than Senator Elizabeth Warren? More and more investors are asking this last question as the early U.S. Democratic Party primary election heats up. Warren is a democratic progressive who aims to revolutionize U.S. trade policy to promote human rights, organized labor, and strict environmental standards. She is seen as more “ideological,” whereas Trump is more “transactional” – i.e. willing to make business tradeoffs while staying away from sensitive issues affecting China’s internal affairs. Moreover Trump is a known quantity, whereas Warren would represent an unknown – a progressive populist as president and another revolution in U.S. policy, reducing predictability for Beijing. Our assessment is that the U.S. election process is too early and too uncertain to serve as a driver of Beijing’s trade negotiating strategy over the fourth quarter. Moreover there is not a clear basis for China to favor Trump to Warren. Chart 11Trade Dispute Precedes Trump
Trade Dispute Precedes Trump
Trade Dispute Precedes Trump
There are three major trends to bear in mind: The sea change in U.S. policy toward China began under the Obama administration. President Obama entered office by slapping tire tariffs on Beijing. He endorsed Congress’s “Buy American” provisions in the fiscal stimulus package to fight the Great Recession. Under his administration, the U.S. effectively capped steel imports from China (Chart 11). The Obama administration orchestrated the “Pivot to Asia,” a diplomatic and military initiative to rebalance U.S. strategic commitment to focus on China and the western Pacific more than the Middle East. This included the Trans-Pacific Partnership (TPP), an advanced trade deal that deliberately excluded China. It eventually also included a robust reassertion of U.S. maritime supremacy via bulked up Freedom of Navigation Operations (FONOPs) in the South China Sea, a critical global sea lane where Beijing had become increasingly assertive (Diagram 1).
Chart
Chart 12U.S.-China THAAD Dispute Under Obama
U.S.-China THAAD Dispute Under Obama
U.S.-China THAAD Dispute Under Obama
The Obama administration’s attempt to install the Terminal High Altitude Area Defense (THAAD) missile defense system in South Korea caused a strategic showdown with China, emblematized by Chinese sanctions against the Korean economy (Chart 12). Obama’s one major policy handover to President Trump was to focus attention on North Korea’s advancing nuclear weaponization and missile capabilities – another source of friction with China. There can be little doubt that if the Democrats win the 2020 election, they will return to some or all of these policies. But this says more about U.S. national policy than it does about which political party China should favor in 2020, because … 2. The Trump administration is unpredictable and disruptive to both the global status quo and China’s economy. President Trump’s significance is that he shifted the Republican Party from its traditional pro-corporate, pro-free trade, pro-China orientation to a more populist, protectionist, and China-bashing approach. He stole the thunder of protectionist Democrats in the manufacturing heartland. He continued the pivot to Asia, albeit by another name (a “free and open Indo-Pacific”). This approach emphasized coercive unilateral “hard power” rather than multilateral “soft power” and resulted in a negative impact on China’s economy. This change, while it has pros and cons, demonstrates that a harder line on China has policy consensus across administrations. Few doubt that this is the new bipartisan consensus in Washington. Trump has executed this policy shift in a way that is fundamentally unsettling and unpredictable for China: sweeping unilateral tariffs against China on national security grounds (Chart 13); sanctions on tech companies critical for China’s economic future (Chart 14); and tightening relations with Taiwan. This policy eschews traditional diplomacy, which is where China thrives, and it unsettles global supply chains, where China once enjoyed centrality. To some extent Trump is even prisoner to his own logic: as he softens policy to get a trade ceasefire, he faces challenges from Congress on everything from tech export controls to Hong Kong human rights to Chinese corporate listings on U.S. stock exchanges. The Democrats will accuse him of caving to China if he agrees to a deal. Still, if China were to grant Trump deep trade concessions, it would effectively vindicate Trump’s approach. Future American presidents could always threaten across-the-board tariffs whenever they want to extract rapid structural changes from China’s policymakers. This is an intolerable precedent to set. A hard line on China has policy consensus across U.S. administrations. Chart 13Trump's Trade Policy Highly Disruptive
Trump's Trade Policy Highly Disruptive
Trump's Trade Policy Highly Disruptive
Chart 14China's Tech Sector Under Threat
China's Tech Sector Under Threat
China's Tech Sector Under Threat
3. China cannot predict the outcome of U.S. primary or general elections. No one knows who will win the Democratic Party’s primary election. Joe Biden is the frontrunner and has clear advantages in terms of electability versus Trump. But Elizabeth Warren is gaining on him and her chief progressive rival, Senator Bernie Sanders of Vermont, is likely to continue flagging in the polls and feeding her rise due to his ill health. It is highly unlikely that Xi Jinping will make decisions regarding a ceasefire with Trump, as early as next month, based on up-and-down developments in a primary election that has not technically even begun (the first vote is in February). Once Biden or Warren have clinched the nomination, it is not clear who will win in November 2020. President Trump narrowly seized the electoral college in 2016 and the risks to his reelection are extreme, as outlined above. Yet he is the incumbent and BCA Research does not expect a recession next year, which should create a baseline case of reelection. Meanwhile Biden’s debate performances and polling are lackluster, despite being the establishment pick and front runner. Warren’s far-left ideology is a liability, although she is at least capable of beating Trump. Chinese policymakers will assess the developments, but Beijing will conduct strategy to be prepared for any outcome. Summing up the above, all that China knows for certain is that Trump is the current standard-bearer of a broader sea change in the Republican Party and Washington. The new consensus is broadly antagonistic toward China’s growing global influence. Hence China is preparing for “protracted struggle” regardless of whether Trump or a Democrat sits in the Oval Office after 2020. The logical conclusion is to continue negotiating with Trump, and offer some concessions to maintain credibility, but not to capitulate to his gunboat diplomacy. Finally, there are a two key arguments that work against the argument that China prefers Warren to Trump: Democrats will need time to build a multilateral anti-China coalition: Trump’s greatest mistake in the trade war is arguably his failure to form a “coalition of the willing” among western nations to take on China’s mercantilist trade practices together. Chart 15Trump Missed Chance To Build Grand Coalition
Trump Missed Chance To Build Grand Coalition
Trump Missed Chance To Build Grand Coalition
Such a coalition would have represented a much greater economic constraint for Chinese leaders (Chart 15), making structural concessions more likely. A future Democratic president would have better luck in galvanizing such a coalition. Thus, by favoring Trump, Beijing could perpetuate the division between “America First” and “the liberal Western order.” Yet western nations will still be reluctant to confront China and it will take years of diplomacy to build such a concerted effort. These are years in which China can improve its economic self-sufficiency and use diplomacy to undermine western cohesion. By contrast, a second-term Trump could pursue punitive measures immediately (beyond tariffs) and could also pursue more western alignment, for instance on tech sanctions. A Chinese policy focused on overall stability would not clearly prefer the latter. As for a Warren presidency, her trade policy has more in common with Trump’s than with Biden’s or the status quo. It is not at all clear that she would be able to unify the West against China on the issue of trade. Hence there is no clear advantage to China of preferring Trump. Biden is probably a greater threat to China on this front, since he would “renegotiate” (i.e. rejoin) the Trans-Pacific Partnership, and court the Europeans, while likely maintaining Obama’s line on China. Yet Biden is viewed as the most pro-China candidate of all. In short, trade policy is a wash from China’s point of view. The U.S. has already taken a more protectionist turn. From China’s view, the U.S. as a whole has taken a protectionist turn. Democrats will not prioritize China: Trump will be unshackled from concerns about bear markets and recessions if he is reelected to a second term due to the two-term limit. Warren would enter as a first-term president and would therefore face the reelection constraint that has hindered Trump’s own trade policy. If Trump loses, Warren faces an implicit threat should she clash with China. Chart 16Market Sees Warren As Health Care Risk
Market Sees Warren As Health Care Risk
Market Sees Warren As Health Care Risk
Warren will also, like President Obama, spend the majority of her first term engrossed in an ambitious domestic policy agenda. Her policy priority is a universal single-payer health care system, which is a much more dramatic undertaking than Biden’s proposal of restoring and enhancing Obamacare, which is why health sector equities are sensitive to Warren’s election chances (Chart 16). Obama did not devote his full attention to Iran and China until his second term, and it is normal for the second term to be the “foreign policy term” due to the absence of electoral constraints. Several of Warren’s policy priorities would also be more favorable to China. In particular, Warren’s desire to impose tougher restrictions on U.S. financials, energy companies, and tech companies is broadly beneficial to China’s efforts to create globally competitive champions. At the same time, Trump is more likely to continue the buildup in U.S. military spending, which, combined with the unlikelihood that Trump will ultimately abandon U.S. allies in Asia, poses a strategic threat for China (Chart 17). China cannot calculate its trade negotiations according to the ups and downs of volatile U.S. politics. Instead it has an incentive to play both sides: to give Trump promises while hesitating to implement them, so as not to render him a dangerous “lame duck” (Chart 18) but also not to gift-wrap the election for him. Chart 17Trump's Military Buildup
Trump's Military Buildup
Trump's Military Buildup
Chart 18
The one thing that can be expected over the next two years is that China will try to maintain economic stability to attract Europe and Asia deeper into its orbit. This means incrementally more stimulus, as mentioned above. China cannot allow itself to risk debt-deflation while encouraging other economies to become less reliant on Chinese demand. Bottom Line: China cannot predict the future. Its best play is to try to undermine the emerging U.S. policy consensus to be tough on China. This means agreeing to a ceasefire to pacify Trump without giving him major structural concessions that improve his chances of reelection. If he loses, future presidents will be afraid of tackling China aggressively. If he wins, yes, China can try to exploit his “America First” policy to keep the U.S. divided within itself and with the rest of the West. If a Democrat wins, China will have set a precedent that gunboat diplomacy fails. It can try to bind the Democrat to the Trump ceasefire terms. If the Democrats tear up the deal then China will have a basis to begin negotiations as an aggrieved party. Investment Conclusions The problem for President Trump is that a weak, short-term ceasefire – in which China does not verifiably implement structural concessions and the threat of “tech war” continues to loom – will not have as positive of an impact on global and American economic sentiment as Trump hopes. Moreover it could collapse under the weight of Sino-American strategic distrust in areas outside trade. Thus while we expect global policy uncertainty to drop off – as we outlined at the beginning of this report – we expect the reduction to be moderate rather than dramatic and not to last all the way to the U.S. election. Our colleagues Bob Ryan and Hugo Belanger have demonstrated that a rise in global policy uncertainty is correlated with a rise in the trade weighted dollar (Chart 19). If uncertainty falls, it will help the dollar ease, which improves global financial conditions and cultivates a rebound in global growth and trade. Chart 19Policy Uncertainty Boosts The Dollar
Policy Uncertainty Boosts The Dollar
Policy Uncertainty Boosts The Dollar
Chart 20Falling Uncertainty Hurts US Outperformance
Falling Uncertainty Hurts US Outperformance
Falling Uncertainty Hurts US Outperformance
This is corroborated by the U.S. trade policy uncertainty index, which reinforces not only the point about the dollar but also the implication that global equities can begin to outperform U.S. equities (Chart 20). With trade sentiment recovering, and U.S. domestic political risk rising due to the election, there is a basis for equity rotation. This assumes that China’s growth does incrementally improve, as we expect. Matt Gertken Geopolitical Strategist mattg@bcaresearch.com
Highlights The U.S. and China are moving toward formalizing a trade ceasefire that reduces geopolitical risk in the near term. The risk of a no-deal Brexit is finished – removing a major downside to European assets. Spanish elections reinforce our narrative of general European political stability. Go long 10-year Italian BTPs / short 10-year Spanish bonos for a trade. Geopolitical risks will remain elevated in Turkey, rise in Russia, but remain subdued in Brazil. A post-mortem of Canada’s election suggests upside to fiscal spending but further downside to energy sector investment over the short to medium term. Feature After a brief spike in trade war-related geopolitical risk just prior to the resumption of U.S.-China negotiations, President Trump staged a tactical retreat in the trade war. Chart 1Proxy For Trade War Shows Falling Risk
Proxy For Trade War Shows Falling Risk
Proxy For Trade War Shows Falling Risk
Negotiating in Washington, President Trump personally visited the top Chinese negotiator Liu He and the two sides announced an informal “phase one deal” to reverse the summer’s escalation in tensions: China will buy $40-$50 billion in U.S. agricultural goods while the U.S. will delay the October 15 tariff hike. More difficult issues – forced tech transfer, intellectual property theft, industrial subsidies – were punted to later. The RMB is up 0.7% and our own measures of trade war-related risk have dropped off sharply (Chart 1). We think these indicators will be confirmed and Trump’s retreat will continue – as long as he has a chance to save the 2020 economic outlook and his reelection campaign. Odds are low that Trump will be removed from office by a Republican-controlled senate – the looming election provides the republic with an obvious recourse for Trump’s alleged misdeeds. However, Trump’s approval rating is headed south. While it is around the same level as President Obama’s at this point in his first term, Obama’s started a steep and steady rise around now and ended above 50% for the election, a level that is difficult to foresee for Trump (Chart 2). So Trump desperately needs an economic boost and a policy victory to push up his numbers. Short of passing the USMCA, which is in the hands of the House Democrats, a deal with China is the only way to get a major economic and political win at the same time. Hence the odds of Presidents Trump and Xi actually signing some kind of agreement are the highest they have been since April (when we had them pegged at 50/50). Trump will have to delay the December 15 tariff hike and probably roll back some of the tariffs over next year as continuing talks “make progress,” though we doubt he will remove restrictions on tech companies like Huawei. Still, we strongly believe that what is coming is a détente rather than the conclusion of the Sino-American rivalry crowned with a Bilateral Trade Agreement. Strategic tensions are rising on a secular basis between the two countries. These tensions could still nix Trump’s flagrantly short-term deal-making, and they virtually ensure that some form of trade war will resume in 2021 or 2022, if indeed a ceasefire is maintained in 2020. Both sides are willing to reduce immediate economic pain but neither side wants to lose face politically. Trump will not forge a “grand compromise.” Our highest conviction view all along has been – and remains – that Trump will not forge a “grand compromise” ushering in a new period of U.S.-China economic reengagement in the medium or long term. China’s compliance, its implementation of structural changes, will be slow or lacking and difficult to verify at least until the 2020 verdict is in. This means policy uncertainty will linger and business confidence and capex intentions will only improve on the margin, not skyrocket upward (Chart 3). Chart 2Trump Needs A Policy Win And Economic Boost
How Much To Buy An American President? – GeoRisk Update: October 25, 2019
How Much To Buy An American President? – GeoRisk Update: October 25, 2019
Chart 3Sentiment Will Improve ... Somewhat
Sentiment Will Improve ... Somewhat
Sentiment Will Improve ... Somewhat
The problem for bullish investors is that even if global trade uncertainty falls, and the dollar’s strength eases, fear will shift from geopolitics to politics, and from international equities to American equities (Chart 4). Trump, hit by impeachment and an explosive reaction to his Syria policy, is entering into dangerous territory for the 2020 race. Trump’s domestic weakness threatens imminent equity volatility for two reasons. Chart 4American Outperformance Falls With Trade Tensions
bca.gps_wr_2019_10_25_c4
bca.gps_wr_2019_10_25_c4
Chart 5Democratic Win In 2020 Is Market-Negative
Democratic Win In 2020 Is Market-Negative
Democratic Win In 2020 Is Market-Negative
First, if Trump’s approval rating falls below today’s 42%, investors will begin pricing a Democratic victory in 2020, i.e. higher domestic policy uncertainty, higher taxes, and the re-regulation of the American economy (Chart 5). This re-rating may be temporarily delayed or mitigated by the fact that former Vice President Joe Biden is still leading the Democratic Party’s primary election race. Biden is a known quantity whose policies would simply restore the Obama-era status quo, which is only marginally market-negative. Contrary to our expectations Biden's polling has not broken down due to accusations of foul play in Ukraine and China. Nevertheless, Senator Elizabeth Warren will gradually suck votes away from fellow progressive Senator Bernie Sanders and in doing so remain neck-and-neck with Biden (Chart 6). When and if she pulls ahead of Biden, markets face a much greater negative catalyst. (Yes, she is also capable of beating Trump, especially if his polling remains as weak as it is.) Chart 6Warren Will Rise To Front-Runner Status With Biden
How Much To Buy An American President? – GeoRisk Update: October 25, 2019
How Much To Buy An American President? – GeoRisk Update: October 25, 2019
Second, if Trump becomes a “lame duck” he will eventually reverse the trade retreat above and turn into a loose cannon in his final months in office. Right now we see a decline in geopolitical risk, but if the economy fails to rebound or the China ceasefire offers little support, then Trump will at some point conclude that his only chance at reelection is to double down on his confrontation with America’s enemies and run as a “war president.” A cold war crisis with China, or a military confrontation with Iran (or North Korea, Venezuela, or some unexpected target) could occur. But since September we have been confirmed in believing that Trump is trying to be the dealmaker one last time before any shift to the war president. Bottom Line: The “phase one” trade deal is really just a short-term ceasefire. Assuming it is signed by Trump and Xi, it suggests no increase in tariffs and some tariff rollback next year. However, as recessionary fears fade, and if Trump’s reelection chances stabilize, U.S.-China tensions on a range of issues will revive – and there is no getting around the longer-term conflict between the two powers. For this and other reasons, we remain strategically short RMB-USD, as the flimsy ceasefire will only briefly see RMB appreciation. BoJo's Brexit Bluff Is Finished Our U.K. indicator captured a sharp decline in political risk in the past two weeks and our continental European indicators mirrored this move (Chart 7). The risk that the U.K. would fall out of the EU without a withdrawal agreement has collapsed even further than in September, when parliament rejected Prime Minister Boris Johnson’s no-deal gambit and we went long GBP-USD. We have since added a long GBP-JPY trade. Chart 7Collapse In No-Deal Risk Will Echo Across Europe
Collapse In No-Deal Risk Will Echo Across Europe
Collapse In No-Deal Risk Will Echo Across Europe
Chart 8Unlikely To See Another Tory/Brexit Rally Like This
Unlikely To See Another Tory/Brexit Rally Like This
Unlikely To See Another Tory/Brexit Rally Like This
The risk of “no deal” is the only reason to care about Brexit from a macro point of view, as the difference between “soft Brexit” and “no Brexit” is not globally relevant. What matters is the threat of a supply-side shock to Europe when it is already on the verge of recession. With this risk removed, sentiment can begin to recover (and Trump’s trade retreat also confirms our base case that he will not impose tariffs on European cars on November 14). Since Brexit was the only major remaining European political risk, European policy uncertainty will continue to fall. The Halloween deadline was averted because the EU, on the brink of recession, offered a surprising concession to Johnson, enabling him to agree to a deal and put it up for a vote in parliament. The deal consists of keeping Northern Ireland in the European Customs Union but not the whole of the U.K., effectively drawing a new soft border at the Irish Sea. The bill passed the second reading but parliament paused before finalizing it, rejecting Johnson’s rapid three-day time table. The takeaway is that even if an impending election returns Johnson to power, he will seek to pass his deal rather than pull the U.K. out without a deal. This further lowers the odds of a no-deal Brexit as it illuminates Johnson's preferences, which are normally hidden from objective analysis. True, there is a chance that the no-deal option will reemerge if Johnson’s deal totally collapses due to parliamentary amendments, or if the U.K. and EU have failed to agree to a future relationship by the end of the transition period on December 31, 2020 (which can be extended until the end of 2022). However, the chance is well below the 30% which we deemed as the peak risk of no-deal back in August. Johnson created the most credible threat of a no-deal exit that we are likely to see in our lifetimes – a government with authority over foreign policy determined to execute the outcome of a popular referendum – and yet parliament stopped it dead in its tracks. Johnson does not want a no-deal recession and his successors will not want one either. After all, the support for Brexit and for the Tories has generally declined since the referendum, and the Tories are making a comeback on the prospect of an orderly Brexit (Chart 8). All eyes will now turn toward the impending election. Opinion polls still show that Johnson is likely to be returned to power (Chart 9). The Tories have a prospect of engrossing the pro-Brexit vote while the anti-Brexit opposition stands divided. No-deal risk only reemerges if the Conservatives are returned to power with another weak coalition that paralyzes parliament. Chart 9Tory Comeback As BoJo Gets A Deal
Tory Comeback As BoJo Gets A Deal
Tory Comeback As BoJo Gets A Deal
Chart 10Brexit Means Greater Fiscal Policy
Brexit Means Greater Fiscal Policy
Brexit Means Greater Fiscal Policy
Whatever the election result, we maintain our long-held position that Brexit portends greater fiscal largesse (Chart 10). The agitated swath of England that drove the referendum result will not be assuaged by leaving the European Union – the rewards of Brexit are not material but philosophical, so material grievances will return. Voter frustration will rotate from the EU to domestic political elites. Voters will demand more government support for social concerns. Johnson’s own government confirms this point through its budget proposals. A Labour-led government would oversee an even more dramatic fiscal shift. Our GeoRisk indicator will fall on Brexit improvements but the question of the election and next government will ensure it does not fall too far. Our long GBP trades are tactical and we expect volatility to remain elevated. But the greatest risk, of no deal, is finished, so it does make sense for investors with a long time horizon to go strategically long the pound. The greatest risk, of a no deal Brexit, is finished. Bottom Line: Brexit posed a risk to the global economy only insofar as it proved disorderly. A withdrawal agreement by definition smooths the process. Continental Europe will not suffer a further shock to net exports. The Brexit contribution to global policy uncertainty will abate. The pound will rise against the euro and yen and even against the dollar as long as Trump’s trade retreat continues. Spain: Further Evidence Of European Stability We have long argued that the majority of Catalans do not want independence, but rather a renegotiation of the region's relationship with Spain (Chart 11). This month’s protests in Barcelona following the Catalan independence leaders’ sentencing are at the lower historical range in terms of size – protest participation peaked in 2015 along with support for independence (Table 1). Table 1October Catalan Protests Unimpressive
How Much To Buy An American President? – GeoRisk Update: October 25, 2019
How Much To Buy An American President? – GeoRisk Update: October 25, 2019
Our Spanish risk indicator is showing a decline in political risk (Chart 12). However, we believe that this fall is slightly overstated. While the Catalan independence movement is losing its momentum, the ongoing protests are having an impact on seat projections for the upcoming election. Chart 11Catalonians Not Demanding Independence
Catalonians Not Demanding Independence
Catalonians Not Demanding Independence
Chart 12Right-Wing Win Could Surprise Market, But No Worries
Right-Wing Win Could Surprise Market, But No Worries
Right-Wing Win Could Surprise Market, But No Worries
Since the April election, the right-wing bloc of the People’s Party, Ciudadanos, and Vox has been gaining in the seat projections at the expense of the Socialist Party and Podemos. Over the course of the protests, the left-wing parties’ lead over the right-wing parties has narrowed from seven seats to one (Chart 13). If this momentum continues, a change of government from left-wing to right-wing becomes likely. However, a right-wing government is not a market-negative outcome, and any increase in risk on this sort of election surprise would be short-lived. The People’s Party has moderated its message and focused on the economy. Besides pledging to limit the personal tax rate to 40% and corporate tax rate to 20%, the People’s Party platform supports innovation, R&D spending, and startups. The party is promising tax breaks and easier immigration rules to firms and employees pursuing these objectives. Chart 13Spanish Right-Wing Parties Narrow Gap With Left
How Much To Buy An American President? – GeoRisk Update: October 25, 2019
How Much To Buy An American President? – GeoRisk Update: October 25, 2019
Another outcome of the election would be a governing deal between PSOE and Podemos, along with case-by-case support from Ciudadanos. After a shift to the right lost Ciudadanos 5% in support since the April election, leader Albert Rivera announced in early October that he would be lifting the “veto” on working with the Socialist Party. If the right-wing parties fall short of a majority, then Rivera would be open to talks with Socialist leader Pedro Sanchez. A governing deal between PSOE, Podemos, and Ciudadanos would have 175 seats, as of the latest projections, which is just one seat short of a majority. As we go to press, this is the only outcome that would end Spain’s current political gridlock, and would therefore be the most market-positive outcome. Bottom Line: Despite having a fourth election in as many years, Spanish political risk is contained. This is reinforced by a relatively politically stable backdrop in continental Europe, and marginally positive developments in the U.K. and on the trade front. We remain long European versus U.S. technology, and long EU versus Chinese equities. We will also be looking to go long EUR/USD when and if the global hard data turn. Following our European Investment Strategy, we recommend going long 10-year Italian BTPs / short 10-year Spanish bonos for a trade. Turkey, Brazil, And Russia Chart 14Turkish Risk Will Rise Despite 'Ceasefire'
Turkish Risk Will Rise Despite 'Ceasefire'
Turkish Risk Will Rise Despite 'Ceasefire'
Turkey’s political risk skyrocketed upward after we issued our warning in September (Chart 14). We maintain that the Trump-Erdogan personal relationship is not a basis for optimism regarding Turkey’s evading U.S. sanctions. Both chambers of the U.S. Congress are preparing a more stringent set of sanctions, focusing on the Turkish military, in the wake of Trump’s decision to withdraw U.S. forces from northeast Syria. At a time when Trump needs allies in the senate to defend him against eventual impeachment articles, he is not likely to veto and risk an override. Moreover, Turkey’s military incursion into Syria, which may wax and wane, stems from economic and political weakness at home and will eventually exacerbate that weakness by fueling the growing opposition to Erdogan’s administration and requiring more unorthodox monetary and fiscal accommodation. It reinforces our bearish outlook on Turkish lira and assets. Chart 15Brazilian Risk Will Not Re-Test 2018 Highs
Brazilian Risk Will Not Re-Test 2018 Highs
Brazilian Risk Will Not Re-Test 2018 Highs
Brazil’s political risk has rebounded (Chart 15). The Senate has virtually passed the pension reform bill, as expected, which raises the official retirement age for men and women to 65 and 63 respectively. This will generate upwards of 800 billion Brazilian real in savings to improve the public debt profile. Of course, the country will still run primary deficits and thus the public debt-to-GDP ratio will still rise. Now the question shifts to President Jair Bolsonaro and his governing coalition. Bolsonaro’s approval rating has ticked up as we expected (Chart 16). If this continues then it is bullish for Brazil because it suggests that he will be able to keep his coalition together. But investors should not get ahead of themselves. Bolsonaro is not an inherently pro-market leader, there is no guarantee that he will remain disciplined in pursuing pro-productivity reforms, and there is a substantial risk that his coalition will fray without pension reform as a shared goal (at least until markets riot and push the coalition back together). Therefore we expect political risk to abate only temporarily, if at all, before new trouble emerges. Furthermore, if reform momentum wanes next year, then Brazil’s reform story as a whole will falter, since electoral considerations emerge in 2021-22. Hence it will be important to verify that policymakers make progress on reforms to tax and trade policy early next year. Our Russian geopolitical risk indicator is also lifting off of its bottom (see Appendix). This makes sense given Russia’s expanding strategic role (particularly in the Middle East), its domestic political troubles, and the risks of the U.S. election. The latter is especially significant given the risk (not our base case, however) that a Democratic administration could take a significantly more aggressive posture toward Russia. Political risk in Turkey and Russia will continue to rise. Bottom Line: Political risk in Turkey and Russia will continue to rise. Russia is a candidate for a “black swan” event, given the eerie quiet that has prevailed as Putin devotes his fourth term to reducing domestic political instability. Brazil, on the other hand, has a 12-month window in which reform momentum can be reinforced, reducing whatever spike in risk occurs in the aftermath of the ruling coalition’s completion of pension reform. Canada: Election Post-Mortem Prime Minister Justin Trudeau returned to power at the head of a minority government in Canada’s federal election (Chart 17). The New Democratic Party (NDP) lost 15 seats from the last election, but will have a greater role in parliament as the Liberals will need its support to pass key agenda items (and a formal governing coalition is possible). The NDP’s result would have been even worse if not for its last-minute surge in the polls after the election debates and Trudeau’s “blackface” scandal. Chart 17Liberals Need The New Democrats Now
How Much To Buy An American President? – GeoRisk Update: October 25, 2019
How Much To Buy An American President? – GeoRisk Update: October 25, 2019
The Conservative Party won the popular vote but only 121 seats in parliament, leaving the western provinces of Alberta and Saskatchewan aggrieved. The Bloc Québécois, the Quebec nationalist party, gained 22 seats to become the third-largest party in the House. Energy investment faces headwinds in the near-term. The Liberal Party will face resistance from the Left over the Trans Mountain pipeline. Trudeau will not necessarily have to sacrifice the pipeline to appease the NDP. He may be able to work with Conservatives to advance the pipeline while working with the NDP on the rest of his agenda. But on the whole the election result is the worst-case scenario for the oil sector and political questions will have to be resolved before Canada can take advantage of its position as a heavy crude producer near the U.S. Gulf refineries in an era in which Venezuela is collapsing and Saudi Arabia is exposed to geopolitical risk and attacks. More broadly, the Liberals will continue to endorse a more expansive fiscal policy than expected, given Canada’s low budget deficits and the need to prevent minor parties from eating away at the Liberal Party’s seat count in future. Bottom Line: The Liberal Party failed to maintain its single-party majority. Trudeau’s reliance on left-wing parties in parliament may prove market-negative for the Canadian energy sector, though that is not a forgone conclusion. Over the longer term the sector has a brighter future. Matt Gertken Geopolitical Strategist mattg@bcaresearch.com Ekaterina Shtrevensky Research Analyst ekaterinas@bcaresearch.com Appendix GeoRisk Indicator
TRADE WAR GEOPOLITICAL RISK INDICATOR
TRADE WAR GEOPOLITICAL RISK INDICATOR
U.K.: GeoRisk Indicator
U.K.: GEOPOLITICAL RISK INDICATOR
U.K.: GEOPOLITICAL RISK INDICATOR
France: GeoRisk Indicator
FRANCE: GEOPOLITICAL RISK INDICATOR
FRANCE: GEOPOLITICAL RISK INDICATOR
Germany: GeoRisk Indicator
GERMANY: GEOPOLITICAL RISK INDICATOR
GERMANY: GEOPOLITICAL RISK INDICATOR
Spain: GeoRisk Indicator
SPAIN: GEOPOLITICAL RISK INDICATOR
SPAIN: GEOPOLITICAL RISK INDICATOR
Italy: GeoRisk Indicator
ITALY: GEOPOLITICAL RISK INDICATOR
ITALY: GEOPOLITICAL RISK INDICATOR
Canada: GeoRisk Indicator
CANADA: GEOPOLITICAL RISK INDICATOR
CANADA: GEOPOLITICAL RISK INDICATOR
Russia: GeoRisk Indicator
RUSSIA: GEOPOLITICAL RISK INDICATOR
RUSSIA: GEOPOLITICAL RISK INDICATOR
Turkey: GeoRisk Indicator
TURKEY: GEOPOLITICAL RISK INDICATOR
TURKEY: GEOPOLITICAL RISK INDICATOR
Brazil: GeoRisk Indicator
BRAZIL: GEOPOLITICAL RISK INDICATOR
BRAZIL: GEOPOLITICAL RISK INDICATOR
Taiwan: GeoRisk Indicator
TAIWAN: GEOPOLITICAL RISK INDICATOR
TAIWAN: GEOPOLITICAL RISK INDICATOR
Korea: GeoRisk Indicator
KOREA: GEOPOLITICAL RISK INDICATOR
KOREA: GEOPOLITICAL RISK INDICATOR
What's On The Geopolitical Radar?
How Much To Buy An American President? – GeoRisk Update: October 25, 2019
How Much To Buy An American President? – GeoRisk Update: October 25, 2019
Section III: Geopolitical Calendar
Highlights Shifting Trends: The factors that have driven bond yields lower throughout 2019 – slowing growth, rising uncertainty, demand for safe assets and dovish monetary policy expectations – have all started to turn in a more bond-bearish direction. Duration & Country Allocation Strategy: Maintain a moderate below-benchmark stance on aggregate bond portfolio duration. Favor lower-beta countries with central banks that are more likely to stay relatively dovish as global yields drift higher, like core Europe, Australia and Japan. Credit Allocation Strategy: Stay overweight corporate bonds versus government debt in the U.S. and Europe, both for investment grade and high-yield. Maintain just a neutral stance on EM USD-denominated spread product, but look to upgrade if global growth improves further and the USD begins to weaken. Feature Chart of the WeekBond Yields Sniffing A Turn In Global Growth?
Bond Yields Sniffing A Turn In Global Growth?
Bond Yields Sniffing A Turn In Global Growth?
It has been fifty days (and counting) since the 2019 low for the benchmark 10-year U.S. Treasury yield was reached on September 3. The year-to-date low for the benchmark 10-year German bund yield was seen six days before that on August 28. Yields have risen by a healthy amount since those dates, up +34bps and +37bps for the 10yr Treasury and Bund, respectively. This has occurred despite the significant degree of bond-bullish pessimism on global growth and inflation that can be found in financial media reporting and investor surveys. The fact that yields are now steadily moving away from the lows suggests that the 2019 narrative for financial markets – slowing global growth, triggered by political uncertainty and the lagged impact of previous Fed monetary tightening and China credit tightening, forcing central banks to turn increasingly more dovish – is no longer correct. If that is true, yields have more near-term upside as overbought government bond markets begin to “sniff out” a bottoming out of global growth momentum (Chart of the Week). In this Weekly Report, we take a look at the changing state of the factors that fueled the sharp decline in bond yields in 2019. We follow that up with a review of all our current recommended investment positions on duration, country allocation and spread product allocations in light of recent developments. We conclude that maintaining a below-benchmark duration exposure, while favoring lower-beta countries in sovereign debt and overweighting corporate debt in the U.S. and Europe, is the most appropriate fixed income strategy for the next 6-12 months. The timing of the bottoming of yields in the major developed markets (DM) should not be surprising, given the more bond-bearish turn of reliable leading directional yield indicators. Yields Are Rising At The Right Time, For The Right Reasons Chart 2Bond-Bullish Growth & Inflation Factors Are Turning
Bond-Bullish Growth & Inflation Factors Are Turning
Bond-Bullish Growth & Inflation Factors Are Turning
The timing of the bottoming of yields in the major developed markets (DM) should not be surprising, given the more bond-bearish turn of reliable leading directional yield indicators. The diffusion index of our global leading economic indicator (LEI), which leads the real (ex-inflation expectations) component of DM bond yields by twelve months, is at an elevated level (Chart 2). At the same time, the slowing of the annual rate of growth in the trade-weighted U.S. dollar, which leads 10-year DM CPI swap rates by around six months, is signaling that bond yields have room to increase from the inflation expectations side. Finally, the rising trend of positive data surprises for the major DM countries is also pointing to higher yields. Breaking it down at the country level, the pickup in DM 10-year bond yields since the 2019 lows has been widespread (Charts 3 & 4). The range of yield increases is as low as +16bps in Japan, where the Bank of Japan (BoJ) is pursuing a yield target, to +46bps in Canada where the economy and inflation are both accelerating. Chart 3Pricing Out Some Expected Rate Cuts …
Pricing Out Some Expected Rate Cuts ...
Pricing Out Some Expected Rate Cuts ...
Chart 4… Across All Developed Markets
... Across All Developed Markets
... Across All Developed Markets
The increase in yields has also occurred alongside reduced expectations for easier monetary policy. Our 12-month discounters, which measure the expected change in short-term interest rates priced into Overnight Index Swap (OIS) curves, show that markets have partially priced out some (but not all) expected rate cuts in all major DM countries. The Three Things That Have Changed For Global Bond Markets So what has changed to trigger a reduction in rate cut expectations and an increase in global yields? The bond-bullish narrative that we refer to in the title of this report can be broken down into the following three elements, which have all turned recently: Slowing global growth (now potentially bottoming) Chart 5Global Growth Bottoming Out
Global Growth Bottoming Out
Global Growth Bottoming Out
Current global growth is still trending lower, when looking at measures like manufacturing PMIs or sentiment surveys like the global ZEW index. Forward-looking measures like our global LEI, however, have been moving higher in recent months, suggesting that a bottom in the PMIs may soon unfold (Chart 5). We investigated that improvement in our global LEI in a recent report and concluded that the move higher was focused almost exclusively within the emerging market (EM) sub-components that are most sensitive to improving global growth.1 This fits with the improvement shown in the OECD LEI for China, a bottoming of the annual growth rate of world exports, and the general acceleration of global equity markets – the classic leading economic indicator. Rising political uncertainty (now potentially fading) The U.S.-China trade war (including the implications for the upcoming 2020 U.S. presidential election) and the U.K. Brexit saga have been the main sources of bond-bullish political uncertainty over the past several months. Yet recent developments have helped reduce the odds of the most negative tail risk outcomes, providing a bit of a boost to global bond yields. The U.S. and China have agreed (in principle) to a “phase one” trade deal that, at a minimum, lowers the chances of a further escalation of the trade dispute through higher tariffs. Meanwhile, the momentum has shifted towards a potential final Brexit agreement between the U.K. and European Union that can avoid an ugly no-deal outcome. Our colleagues at BCA Research Geopolitical Strategy believe that developments are likely to continue moving away from the worst-case scenarios, given the constraints faced by policymakers.2 U.S. President Donald Trump is now in full campaign mode for the 2020 elections and needs a deal (of any kind) to deflect criticism that his trade battle with China is dragging the U.S. economy into recession. Already, there has been a sharp decline in income growth for workers in swing states that could vote for either party’s candidate in next year’s election (Chart 6). Trump cannot afford to lose voters in those states, many of which are in the U.S. industrial heartland (i.e. Ohio, Michigan) that helped put him in the White House. In other words, he is highly incentivized to turn down the heat on the trade war or else face a potential loss next November. While these political uncertainties have not been fully resolved by these latest developments, the shift in momentum away from worst-case scenarios has likely been enough to reduce the safe-haven bid for DM government bonds, helping push yields higher. Meanwhile, China is facing a slowing economy and rising unemployment, but with reduced means to fight the downtrend given high private sector debt that has impaired the typical response between easier monetary conditions and economic activity (Chart 7). While the Chinese government does not want to be seen as caving in to U.S. pressure on trade policy, its desire to maintain social stability by preventing a further rise in unemployment from the trade war provides a powerful incentive to try and ratchet down tensions with the U.S. Chart 6Political Reasons For Trump To Retreat On Trade
Political Reasons For Trump To Retreat On Trade
Political Reasons For Trump To Retreat On Trade
In the U.K., a no-deal Brexit is an economically painful and politically unpopular outcome that would severely damage the re-election chances of Prime Minister Boris Johnson and his Conservative party. Thus, even a hard-line Brexiteer like Johnson must respond to the political constraints forcing him to try and get a Brexit deal done (Chart 8). Chart 7Economic Reasons For China To Retreat On Trade
Economic Reasons For China To Retreat On Trade
Economic Reasons For China To Retreat On Trade
Chart 8Political Reasons To Retreat On A No-Deal Brexit
Political Reasons To Retreat On A No-Deal Brexit
Political Reasons To Retreat On A No-Deal Brexit
While these political uncertainties have not been fully resolved by these latest developments, the shift in momentum away from worst-case scenarios has likely been enough to reduce the safe-haven bid for DM government bonds, helping push yields higher. Bull-flattening pressure on yield curves (now turning into moderate bear-steepening) The final leg down in bond yields in August had a technical aspect to it, fueled by the demand for duration and convexity from asset-liability managers like European pension funds and insurance companies. Falling yields act to raise the value of liabilities for that group of investors, forcing them to rapidly increase the duration of their assets to match the duration of their liabilities (the technique used to limit the gap between the value of assets and liabilities). That duration increase is carried out by buying government bonds with longer maturities (and higher convexity), but also through the use of interest rate derivatives like long maturity swaps and swaptions. The end result is a bull flattening of yield curves (both for government bonds and swaps) and a rise in swaption volatility (i.e. the price of swaptions). Those dynamics were clearly in play in August after the shocking imposition of fresh U.S. tariffs on Chinese imports early in the month. Bond and swaption volatilities spiked, and bond/swap yield curves bull-flattened, in both Europe and the U.S. (Chart 9). That effect only lasted a few weeks, however, and volatilities have since declined and curves have steepened. This suggests that the “convexity-buying” effect has run its course and is now starting to work in the opposite direction, with asset-liability managers looking to reduce the duration of their assets as higher yields lower the value of their liabilities. This is putting some upward pressure on longer-maturity global bond yields. Chart 9Signs Of Reduced Convexity-Related Bond Buying
Signs Of Reduced Convexity-Related Bond Buying
Signs Of Reduced Convexity-Related Bond Buying
Chart 10Bull-Flattening Yield Curve Pressures Easing Up A Bit
Bull-Flattening Yield Curve Pressures Easing Up A Bit
Bull-Flattening Yield Curve Pressures Easing Up A Bit
Chart 11Fed & ECB Actions Should Help Steepen Up Curves
Fed & ECB Actions Should Help Steepen Up Curves
Fed & ECB Actions Should Help Steepen Up Curves
The steepening seen so far must be put in context, however, as yield curves remain very flat across the DM world (Chart 10). Term premia on longer-term bonds remain very depressed, although those should start to increase as global growth stabilizes and the massive safe-haven demand for global government debt begins to dissipate. Some pickup in inflation expectations would also help impart additional bear-steepening momentum to yield curves – a more likely result now that the Fed and ECB have both cut interest rates and, more importantly, will start provide additional monetary easing by expanding their balance sheets (Chart 11). Bottom Line: The factors that have driven bond yields lower throughout 2019 – slowing growth, rising uncertainty, demand for safe assets and dovish monetary policy expectations – have all started to turn in a more bond-bearish direction. Reviewing Our Recommended Bond Allocations In light of these shifting global trends described above, the fixed income investment implications are fairly straightforward: Yields are rising around the world, suggesting that the current move is a shift higher driven by non-country-specific factors like more stable future global growth prospects. Duration: A moderate below-benchmark overall duration stance is warranted for global fixed income portfolios, with yields likely to continue drifting higher over at least the next six months. A big surge in yields is unlikely, as central banks will need to see decisive evidence that global growth is not only bottoming, but accelerating, before shifting away from the current dovish bias. Given the reporting lags in the economic data, such evidence is unlikely to appear until the first quarter of 2020 at the earliest. Yet given how flat yield curves are across the DM government bond markets, the trajectory of forward rates is quite stable relative to spot yield levels, making it much easier to beat the forwards by positioning for even a modest yield increase. Country Allocation: Yields are rising around the world, suggesting that the current move is a shift higher driven by non-country-specific factors like more stable future global growth prospects. In that case, using yield betas to the “global” bond yield is a good way to consider country allocation decisions within a fixed income portfolio. We looked at those yield betas in an August report, using Bloomberg Barclays government bond index data for the 7-10 year maturity buckets of individual countries and the Global Treasury aggregate (Chart 12).3 The rolling 3-year betas were highest in the U.S. and Canada, making them good countries to underweight within a global government bond portfolio in a rising yield environment. The yield betas were lowest in Japan, Germany and Australia, making them good overweight candidates. The U.K. was a unique case of having a relatively high historical yield beta prior to the 2016 Brexit referendum and a lower yield beta since then - making the U.K. allocation highly conditional on the resolution of the Brexit uncertainty. Spread Product Allocation: The backdrop described in this report, where global growth is bottoming out but where central banks maintain a dovish bias, is a perfect sweet spot for global spread product like corporate bonds and Peripheral European government debt. Thus, an overweight stance on overall global spread product versus governments is warranted. The backdrop described in this report, where global growth is bottoming out but where central banks maintain a dovish bias, is a perfect sweet spot for global spread product like corporate bonds and Peripheral European government debt. With regards to our current strategic fixed income recommendations and model bond portfolio allocations, we already have much of the positioning described above in place. We are below-benchmark on overall duration, underweight higher-beta U.S. Treasuries; overweight government bonds in lower-beta Germany, France, Japan and Australia (Chart 13); overweight investment grade corporate bonds in the U.S., euro area and U.K.; and overweight high-yield corporate bonds in the U.S. and euro area. Chart 12Favor Lower-Beta Government Bond Markets
Favor Lower-Beta Government Bond Markets
Favor Lower-Beta Government Bond Markets
There are areas where our positioning could change, however. Chart 13Lower-Beta Laggards Should Start To Outperform
Lower-Beta Laggards Should Start To Outperform
Lower-Beta Laggards Should Start To Outperform
In terms of government bonds, we are currently overweight the U.K. and neutral Canada. A final Brexit deal would justify a downgrade of Gilts to at least neutral, if not underweight, as the Bank of England has signaled that rate hikes would be justified if the Brexit uncertainty was resolved. A downgrade of higher-beta Canadian government debt to underweight could also be justified, although the Bank of Canada is not signaling that a change in monetary policy (in either direction) is warranted. For now, we will hold off on any change to our U.K. stance, as it is now likely that there will be another extension of the Brexit deadline beyond October 31. As for Canada, we remain neutral for now but will revisit that stance in an upcoming Weekly Report. With regards to spread product, we are only neutral EM USD-denominated sovereign and corporate debt, as well as Spanish sovereign bonds; and underweight Italian government debt. An EM upgrade to overweight would require two things that are not yet in place: a weaker U.S. dollar and accelerating Chinese economic growth. Chart 14Stay Overweight Corporates In The U.S. & Europe
Stay Overweight Corporates In The U.S. & Europe
Stay Overweight Corporates In The U.S. & Europe
As for Peripheral governments, we have preferred to be overweight European corporate debt relative to sovereign bonds in Italy and Spain. The recent powerful rally in the Periphery, however, has driven the spreads over German bunds in those countries down to levels in line with corporate credit spreads (Chart 14). We will maintain these allocations for now, but will investigate the relative value proposition between euro area Peripheral sovereigns and corporates in an upcoming report. Bottom Line: Maintain a moderate below-benchmark stance on aggregate bond portfolio duration. Favor lower-beta countries with central banks that are more likely to stay relatively dovish as global yields drift higher, like core Europe, Australia and Japan. Stay overweight corporate bonds versus government debt in the U.S. and Europe, both for investment grade and high-yield. Maintain just a neutral stance on EM USD-denominated spread product, but look to upgrade if global growth improves further and the USD begins to weaken. Robert Robis, CFA Chief Fixed Income Strategist rrobis@bcaresearch.com Footnotes 1 Please see BCA Research Global Fixed Income Strategy Weekly Report, “What Is Driving The Improvement In The BCA Global Leading Economic Indicator?”, dated October 2, 2019, available at gfis.bcaresearch.com. 2 Please see BCA Research Geopolitical Strategy Weekly Report, “Five Constraints For The Fourth Quarter”, dated October 11, 2019, available at gps.bcaresearch.com. 3 Please see BCA Research U.S. Bond Strategy/Global Fixed Income Strategy Weekly Report, “Where’s The Positive Carry In Bond Markets?", dated August 20, 2019, available at usbs.bcaresearch.com and gfis.bcaresearch.com. Recommendations The GFIS Recommended Portfolio Vs. The Custom Benchmark Index
Cracks Are Forming In The Bond-Bullish Narrative
Cracks Are Forming In The Bond-Bullish Narrative
Duration Regional Allocation Spread Product Tactical Trades Yields & Returns Global Bond Yields Historical Returns
If Turkey is the loser, who is the winner? First, Trump, who benefits from fulfilling a campaign pledge to reduce U.S. involvement in foreign wars – a stance that will ultimately be rewarded (or at least not punished) by a war-weary public. Second, Iran…
Despite the many hurdles that remain, prospects of a détente in the 18 month-long trade war are significantly rising. As a self-professed “master negotiator,” President Trump has put his credibility on the line by describing the negotiations as a “love fest,”…
Highlights The investors we met last week were ready to hear some good news: The constructive story we told across three days of client meetings is more sanguine than the consensus view, but clients were open to considering it. Global economic weakness and the elevated risk of a U.S. recession were primary concerns, … : As our Global Investment Strategy colleagues have suggested, it will take some time for investors to be convinced that global manufacturing really has seen the bottom and that the U.S. isn’t flirting with a recession. … followed by trade tensions and corporate indebtedness, … : Our small sample suggests that investors may have become de-sensitized to the daily ebb and flow of the U.S.-China conflict, though we continue to believe it looms large in the minds of corporate managements. … but nothing matches the anxiety provoked by Elizabeth Warren’s ascent: Every client asked about the potential consequences of a Warren White House. Feature We spent most of last week meeting with a subset of wealth management and family office clients. They are more focused on absolute returns than relative returns, but their primary concerns are nearly identical to their relative-return peers’. Our meetings touched on a broad constellation of questions about the fate of the expansion, the equity bull market, global growth and the U.S.-China trade negotiations. Clients also asked about the credit outlook and if inflation should be on their radar, but the topic that they raised with the most fervor, in every single one of our meetings, was the prospect of a Warren or Sanders presidency. Q: What is the bond market telling us? We think of the bond market as having two distinct components, rates (Treasuries) and credit (spread product). We have gotten used to regular retracements in the 10-year Treasury yield since it bottomed in July 2016, but watching it melt from 3.25% last November to 1.5% this August has challenged our constructive take on the U.S. economy. Falling yields are not necessarily signaling imminent economic trouble, however, so we continue to hold the view that a recession won’t occur before late 2021 or early 2022. We see this year’s falling Treasury yields as a coincident reflection of decelerating growth, not a harbinger of a recession. On a purely domestic basis, the principal driver of the decline in yields has been the shift in monetary policy expectations. The Fed’s dovish pivot did not occur in a vacuum, of course. Clear signs of decelerating growth set the stage for easier policy, both here and abroad. Whether or not the Fed was always calling the tune, all three step-function declines in 12-month forward fed funds rate expectations occurred as it was guiding markets to expect easier policy: ahead of the March FOMC meeting, when Fed speakers began warning of the danger of inflation expectations becoming unanchored on the downside; in May, when they were busily preparing the ground for a rate cut; and after the July meeting raised the prospect that the July cut would not be a one-off event (Chart 1). Chart 1The Fed's Dovish Pivot, ...
The Fed's Dovish Pivot, ...
The Fed's Dovish Pivot, ...
Sovereign rates are not entirely determined domestically, and much of the softness in Treasury yields reflects the softness in yields in the rest of the world. So far this year, 10-year sovereign yields have moved in lockstep on either side of the Atlantic (Chart 2), preserving no-arbitrage conditions in currency-hedged Treasuries, gilts and bunds. Crude prices are another global variable, and their decline has weighed on inflation break-even rates (Chart 3), dampening the inflation compensation demanded by Treasury buyers. From a rates perspective, we think the bond market is telling us that global growth has slowed, central banks have taken monetary accommodation up a notch, and oil prices have slid. That’s not exactly an ideal growth backdrop, but it hardly spells the end of the expansion. Chart 2... And European Sovereigns' Gravitational Pull Have Dragged Treasury Yields Lower
... And European Sovereigns' Gravitational Pull Have Dragged Treasury Yields Lower
... And European Sovereigns' Gravitational Pull Have Dragged Treasury Yields Lower
The credit market concurs. It doesn’t betray a whit of concern that the expansion is in trouble. Spreads quickly unwound last year’s fourth-quarter spike, and have since hung around their post-crisis lows (Chart 4). Non-financial corporations have become more indebted throughout the expansion, but servicing the debt is not at all onerous with yields at rock-bottom levels (Chart 5). Our U.S. Bond Strategy service’s proprietary corporate health monitor is signaling that corporate balance sheets have weakened (Chart 6, third panel), but the other elements required for a meaningful widening of spreads – a completed monetary tightening cycle1 (Chart 6, second panel), and a tightening of lending standards (Chart 6, bottom panel) – are not yet in place. Chart 3Falling Oil Prices Have Smothered Inflation Worries
Falling Oil Prices Have Smothered Inflation Worries
Falling Oil Prices Have Smothered Inflation Worries
Chart 4Spreads Are Tight, ...
Spreads Are Tight, ...
Spreads Are Tight, ...
Chart 5... And Debt Service Is Easy
... And Debt Service Is Easy
... And Debt Service Is Easy
Q: Isn’t it time to reduce credit exposures? Tight spreads may be a contrarian warning sign. Though it is sensible to shift some of a company’s financing burden to debt when it is so much cheaper than equity, combining a larger debt burden with degraded covenant protections is a concern. Low interest rates will keep debt service costs from chafing, and help keep defaults in check for now, but the bond market is increasingly vulnerable. Chart 6Spread Widening Conditions Aren't Yet In Place
Spread Widening Conditions Aren't Yet In Place
Spread Widening Conditions Aren't Yet In Place
Chart 7Income Investors Need Not Apply
Income Investors Need Not Apply
Income Investors Need Not Apply
Despite that vulnerability, when the next default cycle arrives, it will not have anywhere near the impact of the housing bust because it will deal no more than a glancing blow to the banks. Single-family homes collateralize the American banking system; corporate bonds are held by a diffuse assortment of unlevered players. It stinks for any unlevered investor when it loses money, but it doesn’t cause much of a ripple in the overall economy. Today’s buildup in corporate borrowing is not analogous to 2006-7’s residential mortgage Superfund site, and suggestions to the contrary are ill-founded. Elevated corporate leverage is a vulnerability, but it is not enough for an investor to identify a vulnerability; s/he also has to identify the catalyst that will cause it to snap. Nonfinancial corporate debt levels are a fissure that has been made longer by debauched covenants. Markets won’t suffer until the fissure lengthens and widens enough to turn into a crack that no investor can ignore. It is our view that easy monetary conditions will keep the fissure out of sight and out of mind for several months at least. Defaults only occur when a borrower is unable to refinance its maturing obligations. As long as there is at least one lender willing to extend new credit at manageable terms, the borrower won’t go bust. The current monetary policy backdrop, featuring zero/negative interest rate policy in much of the major economies, all but ensures a steady supply of willing lenders. Life insurers, pension funds and endowments with a need for income to offset fixed liabilities have been forced out the risk curve to source income sufficient to meet them (Chart 7). The net result has been to provide even wobbly credits offering an incremental 50 or 75 basis points with a line of would-be lenders out the door and around the corner. The global manufacturing sector has already succumbed to recession, but stout performance in the service sector has allowed developed economies to keep expanding. The weakest credits will not find lifelines, but plenty of dubious ones will. The current ultra-loose monetary policy environment is simply not a backdrop in which defaults pick up in earnest. Until central banks get a little less prodigal, the marginal lender won’t become more selective, the plates will keep spinning, and spread product will continue to generate excess returns over cash and Treasuries. Q: Things look worse outside the U.S. What’s your global growth outlook? Chart 8Manufacturing May Be Bottoming, ...
Manufacturing May Be Bottoming, ...
Manufacturing May Be Bottoming, ...
The global manufacturing sector is in recession, but the overall global economy is not (Chart 8). A manufacturing recession does not necessarily lead to a full-blown recession, and the ongoing expansion in developed economies’ much larger service sector provides a formidable bulwark against manufacturing’s struggles (Chart 9). While it is too early to conclude if or when global activity will accelerate, our global leading economic indicator, and the diffusion index that leads it, suggest that it is in the process of bottoming (Chart 10). Chart 9... And Services May Have Stopped Decelerating ...
... And Services May Have Stopped Decelerating ...
... And Services May Have Stopped Decelerating ...
Chart 10... If Leading Indicators Have Found A Footing
... If Leading Indicators Have Found A Footing
... If Leading Indicators Have Found A Footing
Chart 11From Headwind To Tailwind
From Headwind To Tailwind
From Headwind To Tailwind
Our China Investment Strategy team sees scope for Chinese growth to gather some steam in the first quarter of 2020, when local governments will be freed from the budget constraints imposed by Beijing through the end of this year. In the meantime, September money and credit growth topped expectations, and policymakers have been undertaking modest stimulus measures like trimming bank reserve requirement ratios. Changes in Chinese credit growth lead changes in global growth (Chart 11), via China’s credit-reliant import channel. Its imports are Europe’s, Japan’s, Asian EMs’, and Australia’s, Brazil’s and Chile’s exports. As their exports rise, so too does their aggregate demand, giving rise to a self-reinforcing virtuous circle. Q: What would President Warren mean for markets? Investors’ concerns about a Warren presidency are surely justified; Senator Warren has openly, and often gleefully, expressed hostility for banks, defense contractors, drug companies, oil companies engaged in fracking, and big tech. That’s quite a list, and it accounts for a considerable share of S&P 500 market capitalization. It is fair to say that a Warren administration would be unfriendly to equity investors, but there are several points to keep in mind before liquidating one’s portfolio and fleeing the country. It’s too early to award her the Democratic nomination. In October 2007, the smart money was certain that Hillary Clinton had already locked up a berth in the finals against the eventual Republican nominee. Very few Americans could have named the freshman senator from Illinois, known for little more than a well-received speech at the 2004 convention, but he became President Obama. A lot could still happen between now and the Iowa caucuses on February 3rd. Unseating an incumbent president is a tall order. As long as the economy does not enter a recession between now and next November, and the administration can achieve a policy victory without suffering a high-profile policy failure, our Geopolitical Strategy colleagues argue that Trump should be the presumed winner of the 2020 election. Their presumption applies no matter who captures the Democratic nomination, even as the U.S. electorate is shifting to the left over time (Chart 12). Transforming Washington is easier said than done. The framers designed the federal government to be fairly resistant to sweeping change. The Electoral College tamps down popular passions in the presidential election, and Congress and the courts limit the power of the executive branch. Administrations with majorities in the House and Senate routinely find themselves with less freedom than they would like, especially after they exhaust political capital achieving one major legislative initiative (as with the Obama Administration and the Affordable Care Act). Even if the Democrats ride President Warren’s coattails to control over Capitol Hill next November, legislators from conservative or swing districts and states will balk at her entire suite of proposals. Chart 12Democratic Voters Are Leaning More Left
Questions From The Road
Questions From The Road
Investment Implications Our sunnier view of the global economic outlook translates into more constructive equity allocations across global regions and blocs. The BCA house view recommends equal weight allocations to Emerging Markets and the Eurozone within global equity portfolios across tactical (0-3-month) and cyclical (3-12-month) timeframes. We expect to upgrade EM and Eurozone equities to overweight, and downgrade U.S. equities from overweight, across those timeframes once global growth begins to accelerate. We would also favor higher-beta currencies versus the dollar, and limit or avoid exposure to lower-beta currencies like the yen or the Swiss franc, if the data are poised to validate our base-case growth scenario. BCA’s recommendations have become especially data dependent because global investors seem to be firmly ensconced in “show-me” mode. It has been our sense as a firm, supported by the impression we got from last week’s meetings, that investors are reluctant to give growth prospects, and risk assets, the benefit of the doubt. Ground down by trade-related tweets, and skeptical that the latest wave of extraordinary monetary policy measures will have a perceptible impact on growth or inflation, they want to see definitive evidence of a turn before they’ll adjust their portfolio positioning to accommodate it. The wariness is also a reflection of the conflicting signals issued late in the business cycle and the elevated levels of geopolitical uncertainty. If the global economy turns as we think it soon will, global investors should be prepared to add cyclical exposures to their portfolios, even if Elizabeth Warren solidifies her current status as the front-runner for the Democratic nomination. That sense of wariness keeps us recommending benchmark duration exposure in fixed income portfolios over the 0-to-3-month tactical timeframe, though we have little appetite for interest-rate exposure looking out beyond the near term, and are below-benchmark duration over the 3-to-12-month cyclical and greater-than-12-month strategic timeframes. We still like spread product over the full 12-month horizon, as we expect stronger growth will make viable U.S. corporations better credits and that ZIRP/NIRP will continue to protect some of the rest. We endorse the house view that relative U.S. equity returns may slow, but global growth should give a boost to absolute equity returns, and we continue to recommend that investors remain at least equal weight equities in balanced portfolios. Doug Peta, CFA Chief U.S. Investment Strategist dougp@bcaresearch.com Footnotes 1 We are in accord with Chair Powell’s stated view that the rate cuts are mid-cycle cuts, not the beginning of a new easing cycle.
Highlights The interim “phase 1” trade agreement reached last week represents a significant step forward towards reaching a détente in the China-U.S. trade war. Regardless of what happens next in the Brexit negotiations, a hard exit will be avoided. Stay long the pound. U.S. earnings growth is likely to be flat in the third quarter, in contrast to bottom-up expectations of a year-over-year decline. Earnings growth should pick up as global growth reaccelerates by year end. Stronger global growth will put downward pressure on the U.S. dollar. Remain overweight global equities relative to bonds over a 12-month horizon. Cyclical stocks should start to outperform defensives. Financials will finally have their day in the sun. Favorable Tradewinds In our Fourth Quarter Strategy Outlook published two weeks ago, we argued that global equities had entered a “show me” phase, meaning that tangible evidence of a de-escalation in the trade war and a recovery in global growth would be necessary for stock indices to move higher.1 We received some positive news on the trade front last Friday. In exchange for suspending the planned October 15th hike in tariffs from 25% to 30% on $250 billion of Chinese imports, China agreed to purchase $40-$50 billion of U.S. agricultural products per year, improve market access for U.S. financial services companies, and enhance the transparency of currency management. Admittedly, there is still much to be done. The text of the agreement has yet to be finalized. Both sides are aiming to conclude the deal by the time of the APEC summit in Santiago, Chile on November 16-17. Considering that a number of key issues remain unresolved, including what sort of enforcement and resolution mechanisms will be included in the deal, further delays or even a breakdown in the talks are possible. The interim deal agreed upon last week also punts the thorny issue of how to handle intellectual property protections to a “phase 2” of the negotiations slated to begin soon after “phase 1” is wrapped up. According to the independent and bipartisan U.S. Commission on the Theft of American Intellectual Property, U.S. producers lose between $225 and $600 billion annually from IP theft.2 China has often been considered among the worst offenders. Given the importance of the IP issue, meaningful progress will be necessary to ensure that tariffs of 15% on about $160 billion of Chinese imports are not introduced on December 15th. Trump Wants A Deal Despite the many hurdles that remain, last week’s developments significantly raise the prospects of a détente in the 18 month-long trade war. As a self-professed “master negotiator,” President Trump has put his credibility on the line by describing the negotiations as a “love fest,” calling the trade pact “the greatest and biggest deal ever made for our Great Patriot Farmers,” and saying that he has “little doubt” that a final agreement will be reached. Just as he did with NAFTA’s successor USMCA – a deal that is substantively similar to the one it replaced – Trump is likely to shift into marketing mode, trumpeting the “tremendous” new deal that he has negotiated on behalf of the American people. From a political point of view, this makes perfect sense. Rightly or wrongly, President Trump gets better marks from voters on his handling of the economy than anything else (Chart 1). A protracted trade war would undermine the U.S. economy, thereby hurting Trump’s re-election prospects. Chart 1Trump Gets Reasonably High Marks On His Handling Of The Economy, But Not Much Else
Kumbaya
Kumbaya
Chart 2Chinese Business Are Not Paying The Bulk Of The Tariffs
Kumbaya
Kumbaya
Notwithstanding his claims to the contrary, the evidence firmly suggests that U.S. consumers, rather than Chinese businesses, are paying the bulk of the tariffs. Chart 2 shows that U.S. import prices from China have barely declined, even as tariff rates on Chinese imports have risen. To the extent that the latest rounds of tariffs are focused on Chinese goods for which there is little U.S. or third-country competition, the ability of Chinese producers to pass on the cost of the tariffs will only increase. If all the tariff hikes that have been announced were implemented, the effective tariff rate on Chinese imports would rise from around 15% as of late August to as high as 25% in December (Chart 3). Such a tariff rate would reduce U.S. household disposable incomes by over $100 billion, wiping out most of the gains from the 2017 tax cuts. Trump can’t let the trade war reach this point. Chart 3Successive Rounds Of Tariffs Have Started To Add Up
Successive Rounds Of Tariffs Have Started To Add Up
Successive Rounds Of Tariffs Have Started To Add Up
Will China Play Hardball? One risk to a favorable resolution to the trade war is that China will increasingly see Trump as desperate to make a deal. This could lead the Chinese to take a hardline stance in the negotiations. While this risk cannot be dismissed, we would downplay it for three reasons: First, even though China’s exporters have been able to maintain some degree of pricing power during the trade war, trade volumes have still suffered, with exports to the U.S. down nearly 22% year-over-year in September. Second, as the crippling sanctions against ZTE have demonstrated, China remains highly dependent on U.S. technologies. This gives Trump a lot of leverage in the trade negotiations. Chart 4Who Will Win The 2020 Democratic Nomination?
Kumbaya
Kumbaya
Third, as Trump himself likes to say, China will find it easier to negotiate with him in his first term in office than in his second. Hoping that Trump would lose his re-election bid might have made sense for China a few months ago when Joe Biden was riding high in the polls; but now that Elizabeth Warren has emerged as the favorite to secure the Democratic nomination, that hope has been dashed (Chart 4). As we noted several weeks ago, China is likely to find Warren no less vexing on trade matters than Trump.3 All this suggests that China, just like Trump, will look for ways to cool trade tensions over the coming weeks. Brexit Breakthrough? As we go to press, the prospects for a Brexit deal have brightened. Although the details have yet to be released, the proposed deal would effectively put Northern Ireland in a veritable quantum superposition where it is both in the European common market and in the U.K. at the same time. This feat will be achieved by keeping Northern Ireland within the U.K. political jurisdiction but still aligned with EU regulatory standards. Negotiations could still go awry. Despite Prime Minister Boris Johnson’s assurance that he secured “a great new deal,” the Conservative’s coalition partner, the Northern Irish Democratic Unionist Party, is still withholding its support for the accord. Labour leader Jeremy Corbyn has also rejected the deal, saying that it is even worse than Theresa May’s originally proposed pact. Regardless of what transpires over the coming days, we continue to think that a hard Brexit will be avoided. Throughout the entire Brexit ordeal, we have argued that there was insufficient political support within the British ruling class for a no-deal Brexit. That conviction has only grown as polling data has revealed that an increased share of voters would choose to stay in the EU if another referendum were held (Chart 5). We have been long the pound versus the euro since August 3, 2017. The trade has gained 6.6% over this period. Investors should stick with this position. Based on real interest rate differentials, GBP/EUR should be trading near 1.30 rather than the current level of 1.16 (Chart 6). We expect the cross to move towards its fair value as hard Brexit risks diminish further. Chart 5Brexit Angst: A Case Of Bremorse
Brexit Angst: A Case Of Bremorse
Brexit Angst: A Case Of Bremorse
Chart 6Substantial Upside In The Pound
Substantial Upside In The Pound
Substantial Upside In The Pound
Global Growth Prospects Improving Chart 7Growth Slowdown Has Been More Pronounced In The Soft Data
Growth Slowdown Has Been More Pronounced In The Soft Data
Growth Slowdown Has Been More Pronounced In The Soft Data
Chart 8Manufacturing Output Rebounds Amid The ISM Slump
Manufacturing Output Rebounds Amid The ISM Slump
Manufacturing Output Rebounds Amid The ISM Slump
A détente in the trade war and a resolution to the Brexit saga should help support global growth. The weakness in the economic data has been much more pronounced in so-called “soft” measures such as business surveys than in “hard” measures such as industrial production (Chart 7). Notably, U.S. manufacturing output has stabilized over the past three months, even as the ISM manufacturing index has swooned (Chart 8). As sentiment rebounds, the soft data should improve. Global financial conditions have eased significantly over the past five months, thanks in large part to the dovish pivot by most central banks (Chart 9). The net number of central banks cutting rates generally leads the global manufacturing PMI by 6-to-9 months (Chart 10). In addition, the Fed’s decision to start buying Treasurys again will increase dollar liquidity, thus further contributing to looser financial conditions. Chart 9Easier Financial Conditions Will Boost Global Growth
Easier Financial Conditions Will Boost Global Growth
Easier Financial Conditions Will Boost Global Growth
Chart 10The Effects Of Easing Monetary Policy Should Soon Trickle Down To The Economy
The Effects Of Easing Monetary Policy Should Soon Trickle Down To The Economy
The Effects Of Easing Monetary Policy Should Soon Trickle Down To The Economy
Stepped-up Chinese stimulus should also help jumpstart global growth. Chinese money and credit growth both came in above expectations in September. The PBoC has been cutting reserve requirements, which has helped bring down interbank rates. Further cuts to the medium-term lending facility are likely over the remainder of this year. Changes in Chinese credit growth lead global growth by about nine months (Chart 11). Chart 11Chinese Credit Should Support The Recovery In Global Growth
Chinese Credit Should Support The Recovery In Global Growth
Chinese Credit Should Support The Recovery In Global Growth
Stay Overweight Global Equities While the road to finalizing a “phase 1” trade deal in time for the APEC summit is likely to be a bumpy one, we continue to reiterate our recommendation that investors overweight global stocks relative to bonds over a 12-month horizon. We expect to upgrade EM and European equities over the coming weeks once we see a bit more evidence that global growth is bottoming out. Ultimately, the trajectory of stocks will hinge on what happens to earnings. The U.S. earnings season began this week. As of last week, analysts expected S&P 500 EPS to decline by 4.6% in Q3 relative to the same quarter last year according to data compiled by FactSet. Keep in mind, however, that EPS growth has beaten estimates by around four percentage points since 2015 (Chart 12). Thus, a reasonable bet is that U.S. earnings will be flat this quarter, clearing a low bar of expectations. Chart 12Actual EPS Has Generally Beaten Estimates
Kumbaya
Kumbaya
Chart 13Earnings And Nominal GDP Growth Tend To Move In Lock-Step
Earnings And Nominal GDP Growth Tend To Move In Lock-Step
Earnings And Nominal GDP Growth Tend To Move In Lock-Step
The fact that 83% of the 63 S&P 500 companies that have reported earnings thus far have beaten estimates – better than the historic average of 64% – supports the view that current Q3 estimates are too dour. Looking out, earning growth should pick up as nominal GDP growth accelerates (Chart 13). European and EM equities generally outperform the global benchmark when global growth is speeding up (Chart 14). This is due to the more cyclical nature of their stock markets. In addition, as a countercyclical currency, the dollar tends to weaken in a faster growth environment. A weaker dollar disproportionately benefits cyclical stocks (Chart 15). Chart 14EM And Euro Area Equities Usually Outperform When Global Growth Improves
EM And Euro Area Equities Usually Outperform When Global Growth Improves
EM And Euro Area Equities Usually Outperform When Global Growth Improves
Chart 15Cyclical Stocks Will Outperform If The Dollar Weakens
Cyclical Stocks Will Outperform If The Dollar Weakens
Cyclical Stocks Will Outperform If The Dollar Weakens
We would include financials in our definition of cyclical sectors. As global growth improves, long-term bond yields will increase at the margin. Since central banks are in no hurry to raise rates, yield curves will steepen. This will boost bank profits and share prices (Chart 16). Cyclical stocks are currently quite cheap compared to defensives (Chart 17). Likewise, non-U.S. equities are quite inexpensive compared to their U.S. peers, even if one adjusts for differences in sector composition across regions. While U.S. stocks trade at 17.5-times forward earnings, international stocks trade at a more attractive forward PE ratio of 13.7. The combination of higher earnings yields and lower interest rates abroad implies that the equity risk premium is roughly two percentage points higher outside the United States (Chart 18). Chart 16Steeper Yield Curves Will Benefit Financials
Steeper Yield Curves Will Benefit Financials
Steeper Yield Curves Will Benefit Financials
Chart 17Cyclical Stocks Are More Attractive Than Defensives
Cyclical Stocks Are More Attractive Than Defensives
Cyclical Stocks Are More Attractive Than Defensives
Chart 18The Equity Risk Premium Is Quite High, Especially Outside The U.S.
The Equity Risk Premium Is Quite High, Especially Outside The U.S.
The Equity Risk Premium Is Quite High, Especially Outside The U.S.
We expect to upgrade EM and European equities over the coming weeks once we see a bit more evidence that global growth is bottoming out. Peter Berezin, Chief Global Strategist Global Investment Strategy peterb@bcaresearch.com Footnotes 1Please see Global Investment Strategy, “Fourth Quarter 2019 Strategy Outlook: A ‘Show Me’ Market,” dated October 4, 2019. 2 “Update to IP Commission Report: The Report of the Commission on the Theft of American Intellectual Property,” The National Bureau of Asian Research, 2017. 3Please see Global Investment Strategy Weekly Report, “Elizabeth Warren And The Markets,” dated September 13, 2019. Strategy & Market Trends MacroQuant Model And Current Subjective Scores
Kumbaya
Kumbaya
Strategic Recommendations Closed Trades
Highlights There is a tentative decline in geopolitical risk: An orderly Brexit or no Brexit is the likely final outcome and the U.S.-China talks are coming together. The outstanding geopolitical risks still warrant caution on global equities in the near term. Internal and external instability in Saudi Arabia, any American persistence with maximum pressure sanctions on Iran, and domestic instability in Iraq pose a risk to global oil supply. Go long spot crude oil and GBP/JPY. Feature Chart 1A Tentative Decline In Geopolitical Risk
A Tentative Decline In Geopolitical Risk
A Tentative Decline In Geopolitical Risk
Our views on Brexit and the U.S.-China trade talks are coming together, resulting in a tentative decline in geopolitical risk (Chart 1). The British parliament still needs to ratify Boris Johnson’s exit agreement, painstakingly negotiated with the EU in a surprise summit this week. He may not have the votes. If he fails then he will have a basis to seek an extension to the Brexit deadline on October 31. But it is clear that the EU is willing to allow compromises to prevent a no-deal exit shock from exacerbating the slowdown in the European economy. An orderly Brexit is the final outcome (or no Brexit at all if an election and new referendum should say so). We are removing the $1.30 target on our long GBP/USD call in light of these developments and going long GBP/JPY. Similarly, while uncertainty lingers over U.S.-China relations, it is clear that President Trump is sensitive to the impact of the manufacturing recession and the risk of an overall recession on his reelection prospects. He is therefore pursuing a ceasefire and delaying tariffs. China is minimally reciprocating to forestall a collapse in relations. The December 15 tariff hike will be delayed and, if a ceasefire fails to improve the economic outlook, we expect Trump to engage in some tariff rollback on the pretext that talks are “making progress.” However, we do not expect a bilateral trade agreement or total tariff rollback. And other factors (like political risks in Greater China) could still derail the process. The outstanding geopolitical risks still warrant caution on global equities in the near term. These risks include a collapse in the U.S.-China talks (e.g. due to Hong Kong, Taiwan, or the tech race), and the ascent of Elizabeth Warren as the front runner in the Democratic Party’s early primary election. There is also the risk of another oil price shock emanating from the Middle East, which we discuss in this report. The Aftermath Of Abqaiq It has been a geopolitically eventful summer in the Middle East (Diagram 1). While there were plenty of warning shots, the September 14 drone and missile strikes on Saudi Aramco infrastructure was the big bang – wiping out 5.7 mm b/d of crude oil supplies overnight (Chart 2). The attacks were significant not only in terms of their impact on global oil markets, but also because they exposed the U.S.’s and Saudi Arabia’s reluctance to engage in a full-scale military confrontation with Iran. It is too early to call peak tensions in the Persian Gulf. Diagram 1Timeline: Summer Fireworks In The Persian Gulf
Around The Middle East
Around The Middle East
Chart 2Closing Hormuz Would Be The Biggest Oil Shock Ever
Around The Middle East
Around The Middle East
It is too early to call peak tensions in the Persian Gulf. The October 11 strike on an Iranian-owned oil tanker in the Red Sea and the reported U.S. cyber-attacks against Iranian news outlets may well mark the “limited retaliation” that we expected. Nevertheless, last month’s events uncovered vulnerabilities that suggest that even if the U.S. and its Gulf allies back off, geopolitical risk will remain elevated. Chart 3Saudis Are Profligate Defense Spenders
Around The Middle East
Around The Middle East
The most obvious outcome of the September 14 attack is the realization of just how vulnerable Saudi Arabia is to attacks by its regional enemies. Despite being the third most profligate defense spender in the world – and the first relative to GDP (Chart 3) – Saudi Arabia was unable to protect its critical infrastructure. For that, Crown Prince Mohamed bin Salman (MBS) will surely face domestic pressure. After five years, Saudi Arabia has little to show from its war in Yemen, other than a humanitarian crisis that has hurt its international standing. Instead, the operation has been a burden on the kingdom’s finances and a nuisance to security in the southwestern provinces of Najran, Jizan and Asir, where the Iran-allied Houthis have conducted regular attacks on oil infrastructure and airports. Some domestic disquiet will be defused if the Yemen war is downgraded or resolved. Saudi Arabia recently accepted the olive branch extended by the Houthis and is reportedly in talks to deescalate. But this will not fully eliminate domestic uncertainty. After all, MBS’s other initiatives – in Syria, in Iraq, in lobbying the U.S. – are also in jeopardy. The conspiracy theory surrounding the September 29 murder of General Abdulaziz al-Faghem, King Salman’s longstanding personal bodyguard, is case in point. Rumor has it that the king was enraged upon hearing of the Houthi movement’s September 28 capture of three Saudi military brigades, and decided to revoke the Crown Prince’s title, instead appointing the youngest Sudairi brother, Prince Ahmed bin Abdulaziz, in his place.1 The ploy was allegedly uncovered, resulting in General al-Faghem’s murder.2 This is entirely speculation and we find the idea of MBS’s removal to be highly doubtful. The King’s and Crown Prince’s joint appearance during President Vladimir Putin’s visit to the kingdom earlier this week should dispel speculation about a brewing palace coup. Nevertheless, the murder itself is extremely concerning and reinforces independent reasons for concerns about internal stability. Chart 4Impatient Diversification Threatens Domestic Stability
Impatient Diversification Threatens Domestic Stability
Impatient Diversification Threatens Domestic Stability
The pursuit of the Saudi reform agenda, “Vision 2030,” is premised first and foremost on the consolidation of power in the hands of MBS and his faction. The appointment of King Salman’s son, Prince Abdulaziz, as energy minister was motivated by a desire to expedite the initial public offering of state oil giant Saudi Aramco, which could begin as early as November. This was preceded by the appointment of Yasir Al-Rumayyan, head of the sovereign wealth fund and a close ally of MBS, as chairman of Aramco. Moreover, wealthy Saudis – some of whom were detained at the Ritz Carlton in November 2017 – are reportedly being strong-armed into buying stakes in the pending IPO. While weaning Saudi Arabia’s economy off of crude oil is the best course of action for long-term stability (Chart 4), the transition will threaten domestic stability. Meanwhile the conflict with Iran is far from settled. Bottom Line: The September 14 drone strikes on key Saudi oil infrastructure revealed both Saudi Arabia’s and the U.S.’s unwillingness to engage in military action against and a full confrontation with Iran. This will raise concerns regarding the kingdom’s ability to defend itself. Moreover, Saudi Arabia remains vulnerable to domestic pressure as MBS strives to maintain his consolidation of power in recent years and pursues Vision 2030. Internal or external instability in Saudi Arabia poses a risk to global oil supply. Iran’s Resistance Economy Can Handle Trump’s Maximum Pressure Chart 5Iran's Economy Is Feeling The Bite
Iran's Economy Is Feeling The Bite
Iran's Economy Is Feeling The Bite
On the other side of the Persian Gulf, the Iranians are displaying a higher pain threshold than their enemies. The economy is suffering under the U.S.’s crippling sanctions, with exports at the lowest level since 2003 (Chart 5). The IMF expects Iran’s economy to contract by 9.5% this year, with annual inflation forecast at 35.7%. Oil exports, the lifeblood of its economy, are down 89% YoY. Nevertheless, Iran is well-versed in the game of chicken, it is methodically displaying its ability to create havoc across the region, and it has not waivered in its stance that President Trump must ease sanctions and rejoin the 2015 nuclear deal if it is to engage in bilateral talks. All the while, Iran continues to reduce its nuclear commitments. On September 5, Rouhani indicated plans to completely abandon research and development commitments under the Joint Comprehensive Plan of Action (JCPOA) and to begin working on more advanced uranium enrichment centrifuges which was capped at 3.7% under the JCPOA (Table 1). We also expect Iran to follow-through on its threat of withdrawing from the Nuclear Non-Proliferation Treaty (NPT) if Trump maintains sanctions. Table 1Iran Is Walking Away From 2015 Nuclear Deal
Around The Middle East
Around The Middle East
The same resolve cannot be shown on the part of the United States or Saudi Arabia. Chart 6Americans Do Not Support War With Iran
Around The Middle East
Around The Middle East
President Trump is constrained by the risk of an Iran-induced oil price shock ahead of the 2020 election. He is therefore eager to deescalate tensions with Iran. He is abandoning the field in Syria (on which more below), opting to add a symbolic 1,800 troops into Saudi Arabia for deterrent effect instead. This defensive posture is being undertaken within the context of American public opinion, which opposes war with Iran or additional military adventures in the Middle East (Chart 6). This signifies the U.S.’s strategic deleveraging from the Middle East in order to shift its focus to Asia Pacific, where America has a greater priority in managing the rise of China. At the same time, negotiations between the Saudis and Yemeni Houthis suggest a lack of Saudi appetite for all-out conflict with Iran, clearing the way for a diplomatic solution. As Rouhani stated “ending the war in Yemen will pave the ground for de-escalation in the region,” specifically between Saudi Arabia and Iran. The Saudis have amply signaled in the wake of the Abqaiq attack that they wish to avoid a direct confrontation, particularly given the Trump administration’s apparent unwillingness (under electoral constraint) to continue providing a “blank check” for MBS to conduct an aggressive foreign policy. Already the United Arab Emirates – a key player in the Saudi-led coalition against Yemen – has distanced itself from Riyadh and sought to ease tensions with Iran. It recently reduced its commitment to the Yemen war and engaged in high-level meetings with Iran. The UAE’s national security adviser, Tahnoun bin Zayed, visited Tehran on a secret mission, the latest in a series of backchannel efforts to mediate between Saudi Arabia and Iran. Other reported efforts at diplomacy include visits by Iraqi and Pakistani officials. The remaining uncertainty is whether Trump will quietly ease sanctions on Iran, and whether Iran will quit while it is ahead. If Trump maintains maximum pressure, Iran may need to stage further attacks and oil disruptions to threaten Trump’s economy and encourage sanction relief. Otherwise, Iran, smelling American and Saudi fear, could overstep its bounds and commit a provocation that requires a larger American response, thus re-escalating tensions. While Trump’s economic and electoral constraint suggests that he will ease sanctions underhandedly, Iran’s risk appetite is apparently very high: Abqaiq could have gone terribly wrong. It also has an opportunity to flex its muscles and demonstrate American inconstancy to the region. This could lead to miscalculation and a more significant oil price shock than already seen. Bottom Line: Iran has remained steadfast in its position while the United States, Saudi Arabia, and their allies appear to be capitulating. They have more to lose than gain from all-out conflict. But Iran’s decision-making is opaque and any American persistence with maximum pressure sanctions will motivate additional provocations, escalation, and oil supply disruption. Making Russia Great Again? Recent events in Turkey and Syria do not come as a surprise. We have long highlighted a deeper Turkish intervention into Syria as a regional “black swan” event. In August we warned clients that the Trump-Erdogan personal relationship would not save Turkey from impending U.S. sanctions. In September we warned that Turkish geopolitical risk premia had collapsed, as measured by our market-based GeoRisk indicator, and that this collapse was certain to reverse in a major way, sending the lira falling. As we go to press the Turks have declared a ceasefire to avoid sanctions but nothing is certain. Putin has pounced on the opportunity to capitalize on the U.S. retreat. If Turkey is the loser, who is the winner? First, Trump, who benefits from fulfilling a campaign pledge to reduce U.S. involvement in foreign wars – a stance that will ultimately be rewarded (or at least not punished) by a war-weary public. Second, Iran and Russia, Syria’s major allies, who have invested greatly in maintaining the regime of Bashar al-Assad throughout the civil war and now face American withdrawal and heightened U.S. tensions with its allies and partners in the region as a result. Iran benefits through the ability to increase its strategic arc, the so-called “Shia Crescent,” to the Mediterranean Sea. Russia benefits through solidifying its reclaimed status as a major player in the Middle East – an indication of global multipolarity. President Vladimir Putin has pounced on the opportunity to capitalize on the U.S. retreat with official visits to both Saudi Arabia and the UAE this week. He made promises of both stronger economic ties and the ability to broker regional power. On the economic front, the Russian Direct Investment Fund (RDIF) selected Saudi Arabia as the venue for its first foreign office, signaling its interest in the region. It has already approved 25 joint projects with investment valued at more than $2.5 billion. There are also talks of RDIF-Aramco projects in the oil services sector worth over $1 billion and oil and gas conversion projects worth more than $2 billion. Moreover, RDIF signed multiple deals worth $1.4 billion with UAE partners. Chart 7Russia Has Been Complying With OPEC 2.0 Cuts
Russia Has Been Complying With OPEC 2.0 Cuts
Russia Has Been Complying With OPEC 2.0 Cuts
Most importantly, the Saudis and Russians share the same objective of supporting global oil prices and have been jointly managing OPEC 2.0 supply since 2017 (Chart 7). Russia’s approach to the region focuses on enhancing its all-around strategic influence. Chart 8Erdogan Is Playing Into Turkish Concerns About Syrian Refugees
Around The Middle East
Around The Middle East
Although Russia’s allies include Iran and Syria – Saudi Arabia’s rivals – it has presented itself as a pragmatic partner to other powers, including Turkey and even the Saudis and Gulf states. As such, the Kremlin has leverage on both sides of the regional divide, giving it the potential to serve as a power broker. However, any Saudi purchase of the Russian S-400 defense system, long under negotiation, would unsettle the United States. Turkey is threatened with American sanctions for its purchase of the same system.3 The U.S. may be willing to tolerate some increased Russian influence in the Middle East, but a defense agreement may be its red line. The Trump administration still wields the stick of economic sanctions. Growing Russian influence extends beyond the Gulf states. The U.S.’s withdrawal from northeast Syria last week and the Turkish invasion is a gift to the Russians. They are now the only major power from outside the Middle East engaged in Syria. They have embraced this position, positioning themselves as peace brokers between the Syrian regime, with whom they are allied, and Turkey, as well as the Turkish arch-enemy, the Kurds, who now lack American support and must turn to Syria and Russia for some kind of arrangement to protect themselves. Russia has therefore cemented its return as a strategic player in the region, after its initial intervention in Syria in 2015. Turkey’s incursion into Syria is an attempt by President Erdogan to confront the battle-hardened Syrian Kurds and prevent a Kurdish-controlled continuous border with Syria, and to distract from his weakened domestic position. He is striving to garner support by playing to broad Turkish concerns about Syrian refugees in Turkey (Chart 8). The intervention will seek to create a space for refugees to be placed on the Syrian side of the border. However given that there is little domestic popular support for a military intervention, he runs the risk of further alienating voters, who are already losing patience with his ruling Justice and Development Party (AKP). So far, the incursion has the official support of all Turkey’s political parties except the Kurdish Peoples’ Democratic Party (HDP). However this will change as the intervention entails western economic sanctions, a drawn-out military conflict, and limited concrete benefits other than the removal of refugees. Chart 9Turkey's Already Vulnerable Economy Will Take A Hit
Turkey's Already Vulnerable Economy Will Take A Hit
Turkey's Already Vulnerable Economy Will Take A Hit
The already vulnerable economy is likely to take a hit (Chart 9). Markets have reacted to the penalties imposed by the U.S. so far with a sigh of relief as they are not as damaging as they could have been – i.e. Turkish banks were spared.4 However, this is just the opening salvo and more sanctions are on the way – Congress is moving to impose sanctions of its own, which Trump is unlikely to veto. Moreover, the European Union is following suit and imposing sanctions of its own, including on military equipment. Volkswagen already announced it is postponing a final decision on whether to build a $1.1 billion plant in Turkey. This comes at a time of already existing sensitivities with the EU over Turkish oil and gas drilling activities in waters off Cyprus. EU foreign ministers are responding by drawing up a list of economic sanctions. These economic risks will likely hold back the central bank’s rate cutting cycle as the lira and financial assets will take a hit. Bottom Line: The U.S. pivot away from the Middle East is a boon for Moscow, which is pursuing increased cooperation in the Gulf and gaining influence in Syria. Russia is marketing itself as a strategic player and effective power broker. Erdogan’s incursion in Syria, while motivated by domestic weakness, will backfire on the Turkish economy. Maintain a cautious stance on Turkish currency and risk assets. Iraq Is The Fulcrum Iraq’s geographic position, wedged between Saudi Arabia and Iran, renders it the epicenter of the regional power struggle. In the wake of the Trump administration’s maximum pressure campaign on Iran we have frequently highlighted that a dramatic means of Iranian pushback, short of closing shipping in the Strait of Hormuz, is fomenting unrest in an already unstable Iraq. This would be a threat to U.S. strategy as well as to global oil supplies. Iraq is the epicenter of the regional power struggle. In this context, Iraq’s revered Shia cleric Muqtada al-Sadr’s visit to Iran on September 10, just four days ahead of the September Saudi Aramco attack, raises eyebrows. Sadr is the key player in Iraq today and over the past two years he had staked out a position of national independence for Iraq, eschewing overreliance on Iran. A rapprochement between Sadr and Iran is a negative domestic development for Iraq, which has recently been making strides to reduce Iran’s political and military grip. It would undermine Iraqi stability by increasing divisions over ideology, sect, economic patronage, and national security. There is speculation that Sadr’s trip was intended to discuss Prime Minister Adel Abdul Mahdi, who is perceived as weak and incapable of managing the various powers on Iraq’s political scene. The violent protests rocking Iraq since early September support this assessment. Protestors are motivated by discontent over unemployment, poor services, and government corruption, which are perceived to have mostly deteriorated since the start of Abdul Mahdi’s term (Chart 10). While Abdul Mahdi has announced some reforms in response to the popular discontent, including a cabinet reshuffle and promises of handouts for the poor, they have done little to quell the protests. The popular demands are only one of the existential threats facing the government. The second and potentially more serious risk is the security threat. Iraq has been failing at its attempts to formally integrate the Popular Mobilization Units (PMU) – Iran-backed paramilitary groups that were instrumental in ISIS’s defeat – into the national security forces. This is essential in order to prevent Iran from maintaining direct control of security forces within Iraq. A majority of the public agrees that the PMU should not play a role in politics (Chart 11), reflecting the underlying trend demanding Iraqi autonomy from Iran. Chart 10Rising Discontent In Iraq
Around The Middle East
Around The Middle East
Chart 11Little Support For A Political Role For The PMU
Around The Middle East
Around The Middle East
Given that the PMU is in effect an umbrella term for ~50 predominantly Shia paramilitary groups, internal divisions exist within the forces which compete for power, legitimacy, and resources. Recently, it has been purging group leaders perceived as a threat to the overall forces and the senior leadership which maintain strong links to Iran. Chart 12Iraq Is Divided Across Political Affiliation
Around The Middle East
Around The Middle East
This internal struggle also reflects the intra-Shia struggle for power among Iraq’s main political parties. On the one side there is the conservative, pro-Khamenei bloc led by former Prime Minister Nouri al-Maliki and PMU commander Hadi al-Ameri, and on the other is the reformist, nationalist leader Muqtada al-Sadr’s joined by Ammar al-Hakim. Given that most Iraqis view their country as a divided nation across political affiliation, this is a risk to domestic stability (Chart 12). Thus even if the wider risk of regional tensions abates and reduces the threat of sabotage to oil infrastructure and transportation, the current domestic situation in Iraq remains uneasy. But given that we do not see the regional tensions abating yet – due to either American maximum pressure or Iranian hubris – this dynamic translates into an active threat to oil supplies, with 3.4 mm b/d of exports concentrated in the southern city of Basra. Bottom Line: Heightened domestic instability in Iraq poses a non-negligible threat to oil supplies. This risk is compounded by Iraq’s location as a geographic buffer between regional rivals Iran and Saudi Arabia, and Iran’s interest in fomenting unrest to pressure the U.S. into relaxing sanctions. Investment Conclusions The common thread across the Middle East is a persistent threat to global oil supply in the wake of the extraordinary Abqaiq attack. First, it cannot be stated with confidence that Iran will refrain from causing additional oil disruptions, as it is convinced that President Trump’s appetite for conflict is small (and Trump is indeed constrained by fear of an oil shock). President Rouhani has an interest in removing Trump from power, which an oil shock might achieve, and the Supreme Leader may even be willing to risk a conflict with the United States as a means of increasing support for the regime and infusing a new generation with revolutionary spirit. Iran loses in a total war, but Tehran is convinced that the U.S. does not have the will to engage in total war. Second, Russia’s interest in the region is not in generating a durable peace but in filling the vacuum left by the United States and making itself a power broker. Any instability simply increases oil prices which is positive for Russia. Third, Iraq’s instability is both domestically and internationally driven. It is nearly impossible to differentiate between the two. Iranian hubris could manifest in sabotage in Iraq. Or Iraq could destabilize under the regional pressures with minimal Iranian encouragement. Either way the world’s current below-average spare oil production capacity could be hit sooner than expected if shortages result. Go long spot crude oil. On equities, with a U.S.-China ceasefire in the works, and little chance of a no-deal Brexit, we see our cyclically positive outlook reinforced, though we maintain near-term caution due to U.S. domestic politics. In terms of equity focus, we are overweight European equities in developed markets and Southeast Asian equities in emerging markets. Roukaya Ibrahim, Editor/Strategist Geopolitical Strategy RoukayaI@bcaresearch.com Footnotes 1 The Sudairi branch of the al-Saud family is made up of the seven sons of the late King Abdulaziz and Hussa al-Sudairi of the powerful Najd tribe. 2 Please see TRT World “Killing of Saudi King’s Personal Bodyguard Triggers Speculation,” October 2, 2019, available at https://www.trtworld.com. 3 In the wake of the attack on Saudi Aramco oil facilities, President Putin trolled the U.S. by recommending that Saudi Arabia follow the footsteps of Iran and Turkey in purchasing Russia’s S-300 or S-400 air defense systems. 4 The U.S. penalties include sanctions against current and former officials of the Turkish government, a hike in tariffs on imports of Turkish steel back up to 50 percent, and the halt in negotiations on a $100 billion trade deal.