Geopolitics
According to BCA Research's China Investment Strategy service, odds are rising that President Trump will become significantly more hawkish on China, which adds a significant geopolitical hurdle to the recent market rally. President Trump’s current priority…

Highlights The economic and health crises since Q1 2020 have accelerated the breakdown in the US-China relationship. Although the US is in a much weaker economic position this year than in 2019, President Trump may have fewer political constraints to an escalation in the trade war. President Xi Jinping is fueling provocations with the US, adding instability and unpredictability to the geopolitical equation. The Phase One trade deal may be collapsing. We recommend a defensive stance on Chinese risk assets and the RMB during the summer. Feature The outbreak of COVID-19 this year has sparked the worst economic contraction in China and the US in decades. Economic calamities and social unrest should have tied the hands of leaders in both countries. However, as our Geopolitical Strategist Matt Gertken reminds us, this is an atypical election year in the US and some constraints that previously deterred both sides from taking aggressive actions may be diminishing.1 We agree that the economic and health crises have likely accelerated the possibility of a breakdown in the relationship between the US and China. The risk will likely reach a new height in the summer, when pressure on Trump’s election campaign intensifies leading up to the vote in November. While there is a growing bipartisan hawkish view on China in Washington, China is also playing a part in fanning the flames. The USD/CNY exchange rate will be extremely volatile during this episode of heightened geopolitical turbulence. We continue to hold a long USD-CNH position, with the expectation that the RMB will likely weaken further in the summer. Trump Facing Fewer Constraints Whether Trump’s chances of reelection increase through a strong recovery in the US stock market and economy, or decrease through an economic recession and/or weak public support, either scenario could remove constraints preventing Trump from confronting China. Trump’s current priority may be to secure a recovery in the equity market and improve his polling, which will require economic improvement. Ironically, the US stock market has been on fire despite the battered real economy. The S&P 500 Index has gone up by 44% since its trough on March 23, nearly erasing its losses for the year. The higher the market rises, the more Trump may believe that the market can sustain a shock even if he resorts to imposing tariffs on Chinese export goods - particularly if his approval rating does not rise along with the market. The market’s reaction in 2018 and 2019 provides a good example of how the US financial markets shrugged off any negative impact from a trade war between the US and China (Chart 1). If the pandemic prevents the US economy from fully reopening and/or recovering in the summer, then an equity market correction could send a negative signal about Trump’s reelection prospects. In this case, Trump may not be as enslaved by financial constraints as he would have been if the economy was in an expansionary state. A falling approval rating, coupled with domestic social unrest, would make Trump a “lame duck” President (Chart 2). Therefore, he may try to divert attention away from the economy and adopt an aggressive foreign and trade policy. China is already perceived negatively by a majority of American voters and certain political communities, thus there could be a political upside for Trump to escalate his confrontation with China. Chart 1US Stocks Kept Reaching New Highs In 2019 Despite An Ongoing Trade War
US Stocks Kept Reaching New Highs In 2019 Despite An Ongoing Trade War
US Stocks Kept Reaching New Highs In 2019 Despite An Ongoing Trade War
Chart 2Trump’s Polling Drops Below Average
Watch Out For A Second Wave (Of US-China Frictions)
Watch Out For A Second Wave (Of US-China Frictions)
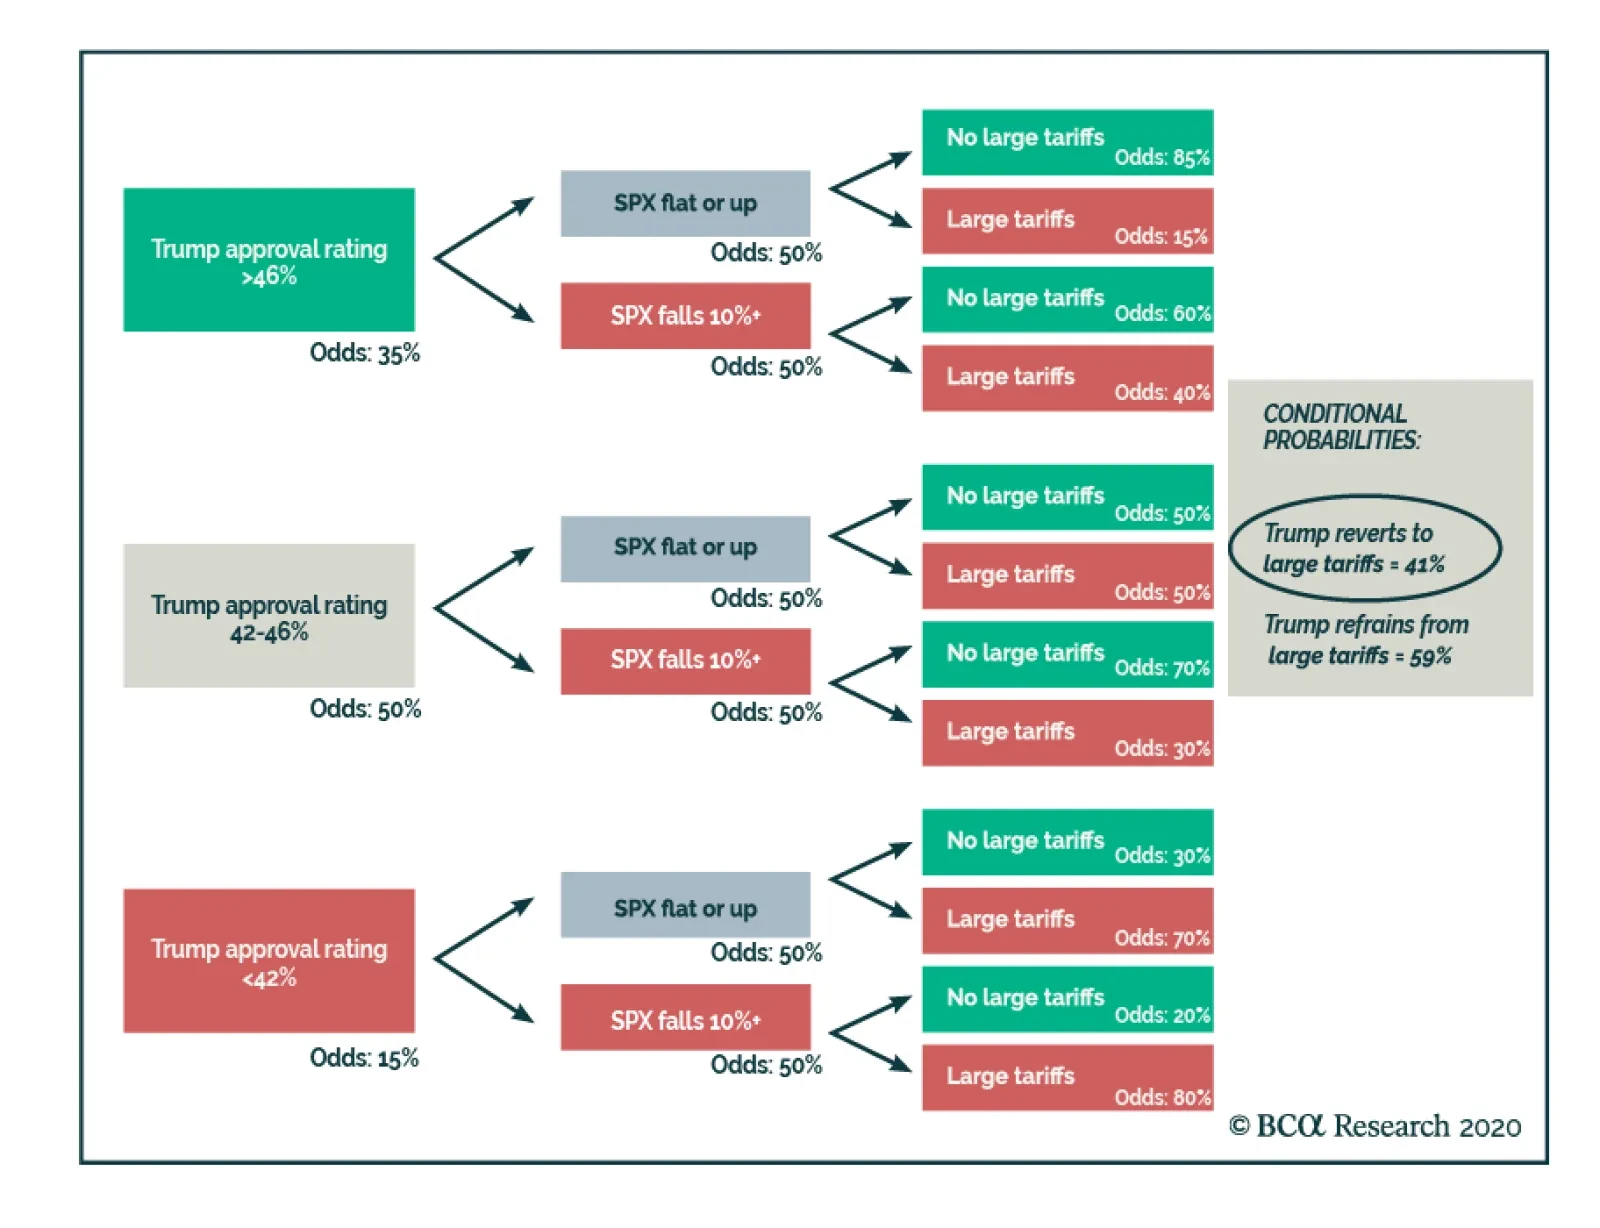
All bets are off if Trump’s approval rating continues to trend downwards, regardless of whether the US equity market continues to rally and/or if the US economy is mired in recession. Our Geopolitical Strategy illustrates the scenarios as follows (Diagram 1). If Trump’s approval rating is high and the market is up, then Trump is “winning” and the only risk of a tariff hike would come from overconfidence or Chinese provocation. If his approval is up but the market falls, then he may become more inclined to use tariffs. If his approval rating is low but the market is up, then he has ammunition to get tougher on China. If his approval and the market are collapsing, then he is a “lame duck president” and all bets are off. Combined, these scenarios imply there is a 59% probability that Trump refrains from large tariffs, and a 41% chance that he reverts to large tariffs. Diagram 1Odds President Trump Will Hike Tariffs On China Before US Election
Watch Out For A Second Wave (Of US-China Frictions)
Watch Out For A Second Wave (Of US-China Frictions)
Bottom Line: All bets are off if Trump’s approval rating continues to trend downwards, regardless of whether the US equity market continues to rally and/or if the US economy is mired in recession. Both scenarios would remove financial and economic constraints that Trump faced in 2019. If Trump's polling is weak, he may spend financial ammunition to shore up his “America First” credentials. Adding China To The Geopolitical Instability Equation China itself may be an independent source of geopolitical instability and unpredictability. While President Xi Jinping does not have any electoral constraints, he needs to restore the confidence of Chinese people in the wake of the worst public health crisis and economic performance in decades. Like Trump, the pandemic gives President Xi an incentive to distract his populace from domestic crises by adopting hawkish foreign policies. This hawkish approach was demonstrated when a new Hong Kong SAR national security law was proposed and approved at this year’s National People’s Congress (NPC). The new law would give Beijing greater direct control over Hong Kong, in contravention of its promise of 50 years of substantial autonomy enshrined in the Sino-British Joint Declaration of 1984. China’s foreign policy tone recently shifted to a more combative one. This “wolf warrior diplomacy" has gained popularity among Chinese diplomats.2 During a news conference at this year’s NPC, China’s Foreign Minister Wang Yi defended the “wolf warrior diplomacy” by stating that the country will stand firm in defending its national interest and combating “smears.” Chart 3Chinese Imports Of American Goods Are Falling Far Short Of The Target Set By The Trade Deal
Chinese Imports Of American Goods Are Falling Far Short Of The Target Set By The Trade Deal
Chinese Imports Of American Goods Are Falling Far Short Of The Target Set By The Trade Deal
The response from the Trump administration has been lukewarm. While Secretary of State Mike Pompeo will strip Hong Kong of its autonomous status, President Trump is taking limited sanctions on mainland China and eschewing more drastic punitive measures. China may see the timid response as a sign that Trump is reluctant to take action on China and tip the bilateral relationship into an outright confrontation. This perception is, in itself, a risk that may lead to more provocation on both sides. Lastly, the Phase One trade deal is tenuous. US Trade Representative Robert Lighthizer last week stated that "China has done a pretty good job" at meeting its trade-deal quotas,3 but we have long argued China was never going to honor the commitment to its full extent.4 The latest data shows that Chinese purchases of American exports in the first four months of 2020, from manufacturing goods to agricultural produce and energy, have fallen far short of the huge expansion agreed in the deal (Chart 3). The recent depreciation in the RMB may be another sign that China is abandoning the Phase One trade deal.5 Weakness in economic fundamentals and renewed tensions between the US and China may have contributed to the RMB’s recent depreciation. However, the decline was reinforced by the PBoC’s move to set the CNY/USD fixing rate to its lowest point since 2008 (Chart 4). Given that the RMB has become an anchor for emerging market currencies, a rapid drop in the RMB would lead to selloffs in emerging Asian and Latin American currencies and, in turn, would strengthen the USD (Chart 5). The Trump administration may see a swift RMB depreciation as China is deliberately violating the Phase One trade deal, which will prompt Trump to seek retaliatory actions against China. Chinese purchases of American goods in the first four months of 2020 have fallen far short of the Phase One trade agreement. Chart 4Is The PBoC Sending A Warning Signal To Trump?
Is The PBoC Sending A Warning Signal To Trump?
Is The PBoC Sending A Warning Signal To Trump?
Chart 5The RMB Has Been The Anchor Currency In EM
The RMB Has Been The Anchor Currency In EM
The RMB Has Been The Anchor Currency In EM
Bottom Line: While China is prioritizing its own economic recovery, its foreign policy stance has decisively swung to a more combative one. Additionally, the Phase One trade deal is on the verge of collapsing. Investment Conclusions The USD/CNY exchange rate will likely be extremely volatile in the next quarter amid heightened geopolitical turbulence, with more downside risks to the RMB. As such, we continue to recommend that investors hedge their RMB exposure in Chinese stocks by holding a long USD-CNH position. We remain neutral on Chinese stocks in relative terms in view of the non-trivial, near-term vulnerability of risk assets. As in 2019, investable stocks are particularly exposed to an escalation in the US-China conflict (Chart 6). Chart 6Large Divergence In Onshore Versus Offshore Stock Performance During The Trade War
Large Divergence In Onshore Versus Offshore Stock Performance During The Trade War
Large Divergence In Onshore Versus Offshore Stock Performance During The Trade War
Chart 7Stocks In Some Domestic Demand-Oriented Sectors Are Still Relatively Safe Bets
Stocks In Some Domestic Demand-Oriented Sectors Are Still Relatively Safe Bets
Stocks In Some Domestic Demand-Oriented Sectors Are Still Relatively Safe Bets
Price corrections in both China’s onshore and offshore aggregate equity markets are likely to occur during the summer. Nevertheless, cyclical plays that closely track Chinese stimulus are relatively safe bets, especially for China’s domestic investors and in absolute terms (Chart 7). Jing Sima China Strategist jings@bcaresearch.com Footnotes 1Please see Geopolitical Strategy Weekly Report "Spheres Of Influence (GeoRisk Update)," dated May 29, 2020, available at gps.bcaresearch.com 2South China Morning Post, “Chinese Foreign Minister Wang Yi defends ‘wolf warrior’ diplomats for standing up to ‘smears’”, May 24, 2020 3Bloomberg, “Lighthizer Says He Feels ‘Very Good’ About Phase One China Deal”, June 4, 2020 4Please see China Investment Strategy Weekly Report "Managing Expectations," dated January 22, 2020, available at cis.bcaresearch.com 5The Phase One trade deal prohibits both the US and China from manipulating exchange rates to devalue their currencies for competitive purposes. Cyclical Investment Stance Equity Sector Recommendations
Dear client, Along with an abbreviated report this week we are sending you this Geopolitical Strategy service report written by my colleague Matt Gertken, BCA’s Geopolitical Strategist. Matt argues that US social unrest is structural and therefore can still cause volatility, while the market’s recognition that Trump is an underdog is also a risk. I hope you will find this report both interesting and informative. Kind Regards, Anastasios Portfolio Strategy While we remain constructive on the prospects in the broad equity market over the coming 9-12 month time horizon, a flare up in geopolitical risks and uncertainty around the upcoming election could serve as catalysts for a much needed breather in equities. Recent Changes Last week our rolling stop was triggered and we downgraded the S&P biotech index to neutral and booked gains of 5% since inception.1 Table 1
Don't Turn A Blind Eye To Geopolitical Risks
Don't Turn A Blind Eye To Geopolitical Risks
The SPX catapulted to fresh recovery highs last week, on the back of optimism surrounding the successful reopening of the economy along with the ongoing support of easy fiscal and monetary policies. Sentiment is not as extended as in February or during previous SPX tops in the past few years, as we highlighted in recent research.2 However, greed is slowly showing up on our radar screens as investors that have missed out on the rally are chasing performance. Additionally, the market action has an element of a short squeeze. Equity market internals signal that there is likely a bit more gas left in the tank, despite the roughly 1000 point rise since the March 23 lows. While the S&P transports index has neither made new all-time highs nor outperformed the SPX year-to-date, one economically hypersensitive sub-group, trucking, has been revving its engines. The S&P 1500 trucking index has stealthily joined the “new all-time highs” club. The highly fragmented trucking industry has an excellent track record in leading the S&P 500 and the current message is that the path of least resistance remains higher for the SPX (Chart 1). As large parts of the economy are reopening, this index seems to have priced in a full recovery and a return to normal in the back half of the year. The jury is still out on the economic recovery’s shape and the risk of a second viral wave is significant, but stocks continue to climb the proverbial "wall of worry". Chart 1Trucking As A Leading Indicator
Trucking As A Leading Indicator
Trucking As A Leading Indicator
Importantly, another extremely pro-cyclical equity market indicator, the S&P deep cyclicals/defensives share price ratio, has also led the broad equity market bottom and continues to herald additional gains for the SPX (Chart 2). Deep cyclicals include tech stocks, but even if IT were excluded, the cyclicals ex-tech/defensives ratio still troughed prior to the SPX and is gaining steam. Chart 3 shows the GICS1 sector returns since the March lows and technology is similar to the overall market’s return. The deep cyclical trio (energy, industrials and materials) have outperformed the tech sector, and bested defensives by a wide margin. Chart 2Cyclicals Are Besting Defensives
Cyclicals Are Besting Defensives
Cyclicals Are Besting Defensives
Chart 3GICS1 Sector (%) Returns Since The March Lows
Don't Turn A Blind Eye To Geopolitical Risks
Don't Turn A Blind Eye To Geopolitical Risks
Our Global Trade Activity Indicator corroborates the message that the cyclicals/defensives ratio is emitting (Chart 4). The recent breakout in the JPM EM currency index along with budding evidence of China’s economic recovery and likelihood of a stimulus package (not as large as the GFC, but bigger than the early-2016 manufacturing recession one) suggest that global growth is slated to recover in the back half of the year. Chart 4Looming Global Growth Recovery
Looming Global Growth Recovery
Looming Global Growth Recovery
Nevertheless, it is quite unnerving that the SPX has broken out to fresh recovery highs despite bleak economic fundamentals and rising political and geopolitical risks. One potential negative catalyst that could cause a healthy reset is the rise in the polls of Democratic presidential candidate Joe Biden ahead of the November elections. Chart 5 shows that over the past year, the S&P 500 has moved in lockstep with the relative odds of a Republican versus a Democrat getting elected President. But recently, a wide gap has opened warning that the SPX is vulnerable to a pullback. In truth, the online gambling community has been slow to react to the erosion of President Trump’s platform due to pandemic and recession – so his odds could fall further in the near term. At the margin, a Biden win should be negative for the stock market because his party is perceived as more hostile to businesses and the specter of higher taxes could trip up the SPX. Our Geopolitical Strategy service has highlighted this risk in recent reports, including on May 15.3 Tack on the persistently high reading in the Baker, Bloom and Davis Policy Uncertainty Index and the risk/reward tradeoff for the overall market tilts further to the downside at the current juncture (Chart 6). Chart 5Do Not Neglect (Geo)Political Risks
Don't Turn A Blind Eye To Geopolitical Risks
Don't Turn A Blind Eye To Geopolitical Risks
Chart 6High Policy Uncertainty Is A Red Flag
High Policy Uncertainty Is A Red Flag
High Policy Uncertainty Is A Red Flag
Bottom Line: While we remain constructive on the SPX over the coming 9-12 month time horizon, a flare up in geopolitical risks and uncertainty around the upcoming election could serve as catalysts for a much needed breather in equities. Anastasios Avgeriou US Equity Strategist anastasios@bcaresearch.com Geopolitical Strategy Social Unrest Can Still Cause Volatility Highlights Social unrest in the US is driven by structural and cyclical factors as well as election-year opportunism. It can still cause volatility. Unrest will weigh on consumer and business confidence – adding to already ugly fundamentals. The market has come around to our view that Trump is an underdog in the election. This is a risk to equities since a Democratic victory will bring full control of government. President Trump has low legal or political constraints to deploying the military if violence gets worse in the streets. This increases tail risks of a civilian death that amplifies the unrest. A “silent majority” of voters could give Trump a polling boost as a “law and order” candidate later this year. This could require us to upgrade his odds of reelection. The US dollar faces long-term headwinds but we are unlikely to reinitiate our long EUR-USD trade until the US election cycle is complete. Feature Chart 1Markets Skyrocket On Stimulus & Reopening
Markets Skyrocket On Stimulus & Reopening
Markets Skyrocket On Stimulus & Reopening
Economic reopening and stimulus are winning the day as investors continue to look forward to a time when growth and corporate earnings recover yet inflation and risk-free rates remain suppressed. Judging by the breakout of cyclical versus defensive stocks and risk-on versus risk-off currencies, the rally could continue and the gap between stock markets and macro fundamentals could widen further for some time (Chart 1). The market is looking through the most widespread social unrest since 1968 in the United States, which emerged due to the death in police custody of a black man, George Floyd, in Minneapolis. History suggests that over a one-year horizon, social unrest can be ignored – but in the near term it could yet provoke volatility. This risk is underrated because the market already believes that the unrest is a known quantity without material impact, yet this report shows otherwise. We see four new risks, the first three negative for the market. Chart 2US Consumer Sentiment Is Vulnerable
US Consumer Sentiment Is Vulnerable
US Consumer Sentiment Is Vulnerable
Consumer confidence and activity could worsen in the face of historic national unrest. The slight uptick in improving consumer expectations could reverse (Chart 2). President Trump’s odds of reelection could fall permanently, triggering a downgrading of long-run earnings expectations. A mistake could cause unrest to reach an unknown critical threshold that strikes fear into investors about US stability. The US debate has moved on from racism to “fascism” as Trump’s opponents criticize him for his authoritarian rhetoric and deployment of military forces to secure parts of Washington, DC. Structural factors are driving the riots which means they may smolder and additional incidents could cause them to flare up throughout summer and fall. The deployment of troops to quell civil unrest – as in any country at any time – could easily lead to bloody mistakes. The upside risk is that Republican senators will capitulate even sooner on fiscal spending measures, seeing that their corporate power base is likely to feel more concerned about the collapse of society. The House Democrats and President Trump already share an interest in larding up the spending, so it was only a matter of time till the senate caved in anyway. If the next $2 trillion arrives without the June-July hiccup that we expect, then the market could power higher (Chart 3). Chart 3Global Fiscal Stimulus Continues To Grow
Social Unrest Can Still Cause Volatility
Social Unrest Can Still Cause Volatility
In this report we show why US social unrest is structural and how it can still bring equity volatility. Also, the online betting market has caught up to our view that Trump is the underdog in the election. The prospect of full Democratic Party control could start to weigh on US equities. The upside risk to this view would be markets cheer Biden – which is unlikely for long – or if the violent protests create a “silent majority” that helps Trump win the swing states. If his polling improves in the wake of the riots – and the stock rally continues unabated – then we may upgrade his reelection odds from 35% to 50% or higher. Bottom Line: A pullback would be a buying opportunity, but a 10% correction could easily transpire given that a falling market reduces Trump’s odds greatly and could kill the market’s faith in Trump reflation policy from 2021-24. How Social Unrest Came To The United States The US was ripe for a major bout of unrest, as we have highlighted in past reports such as “Populism Blues” (2017), “Civil War Lite” (2019), and “Peak Polarization” (2020), as well as in our top five “Black Swans” report for this year. Our updated “Great Gatsby Curve” shows countries with high levels of income inequality and social immobility. The US is right in the danger zone, joined by other countries that have had unrest or political disruptions (Argentina, Chile, UK, Italy) or will soon (China) (Chart 4). African Americans suffer the worst of these ills and also have long-running grievances with the criminal justice system. Chart 4The US Is In The Danger Zone For Populism, Unrest
Social Unrest Can Still Cause Volatility
Social Unrest Can Still Cause Volatility
Unrest was an easy prediction even before the pandemic and recession, which made matters worse. The US ranks last, among developed markets, just below Greece, in our COVID-19 Unrest Index (Table 1). This index combines four factors – economic fundamentals, vulnerability to COVID-19, household grievances, and governance indicators – to rank countries according to their susceptibility to social unrest. US unemployment has soared higher than that of other countries as it has less generous automatic stabilizers. Table 1US Ranks Worst In Our COVID-19 Social Unrest Rankings
Social Unrest Can Still Cause Volatility
Social Unrest Can Still Cause Volatility
When it comes to the virus, the US is not any harder hit than most of its European peers (Chart 5). And the black community is not much harder hit than whites, although both have suffered more than their population share would imply, and more than the Hispanic community (Chart 6). Chart 5US No Different Than Western Europe On COVID-19 Deaths
Social Unrest Can Still Cause Volatility
Social Unrest Can Still Cause Volatility
Chart 6COVID-19 Least Deadly For Hispanics
Social Unrest Can Still Cause Volatility
Social Unrest Can Still Cause Volatility
However, the lockdowns have caused the unemployment rate to soar and exacted a greater toll on the least educated and lowest paid members of society. The election is enflaming the situation. President Trump’s economy has now performed little better for households than President Obama’s economy, assuming they suffer an income and wealth shock at least equal to that of 2008-09 (Chart 7). Chart 7Households Suffer Massive Income Shock
Households Suffer Massive Income Shock
Households Suffer Massive Income Shock
Given the collapsing economy, Trump is doubling down on “law and order,” taking an aggressive stance against rioting and looting and thus provoking a backlash. The media is also in a feeding frenzy as the pandemic and economic reopening narratives lose traction and yet Trump perseveres. Polarization is intensifying as a result. Trump’s rhetoric has been egregious as always. His threat to invoke the Insurrection Act of 1807 is not. President George Bush Sr invoked the act to suppress the LA riots in 1992. The act’s provisions, as well as the specific exceptions to the posse comitatus laws and norms, give the president broad discretion in matters precisely like these. The real constraint is not legal but political: any popular backlash from Trump and his advisers in trying to “dominate the battlespace” when it comes to civilians at home. Rioting and looting are also unpopular, so a larger crackdown could easily happen if more unrest takes place. Since the riots are driven by structural factors, they could still escalate, especially if another incident of police brutality occurs. Bottom Line: US unrest is driven by structural and cyclical factors and thus we are in for another “long, hot summer” like 1967. Negative surprises should be expected. The larger risks have to do with the impact on the election and sentiment. Trump’s Polling Was Dropping Even Before The Riots Trump’s approval rating has fallen to the lowest level this year and diverged from the historic average (Chart 8). This increases the risk that the market experiences volatility either in expectation of “regime change” in November or in reaction to Trump’s attempts to regain the initiative. Trump’s deviation from President Obama’s approval at this stage in 2012 is a warning sign (Chart 9). Chart 8Trump’s Polling Drops Below Average
Social Unrest Can Still Cause Volatility
Social Unrest Can Still Cause Volatility
Chart 9Trump Falls Off Obama’s Pathway To Reelection
Social Unrest Can Still Cause Volatility
Social Unrest Can Still Cause Volatility
Chart 10Trump’s Pandemic Bounce Turns Negative, Unlike Others
Social Unrest Can Still Cause Volatility
Social Unrest Can Still Cause Volatility
Trump and the Republican Party received a smaller polling bounce from the pandemic – and year-to-date the bounce is not only gone but has turned negative, comparable only to Vladimir Putin and United Russia (Chart 10). At its peak it was smaller than that of previous US presidents in crisis situations (Table 2, see Appendix). These data come from before the George Floyd incident which will make matters worse for Trump, given that initial polls suggest 35% approve and 52% disapprove of his response to it. The presumptive Democratic nominee Joe Biden is narrowly leading in all major swing states (Chart 11A). Trump has dropped off in critical swing states of Florida, Wisconsin, and Arizona (Chart 11B). Biden is closer to Trump than he should be in states like Ohio and even Texas. Chart 11ATrump Trailing Biden In Swing States
Social Unrest Can Still Cause Volatility
Social Unrest Can Still Cause Volatility
Chart 11BTrump Loses Critical Support In FL, WI, AZ
Social Unrest Can Still Cause Volatility
Social Unrest Can Still Cause Volatility
Chart 12Biden Polling Better Than Clinton Did Against Trump
Social Unrest Can Still Cause Volatility
Social Unrest Can Still Cause Volatility
Biden is tentatively outperforming Hillary Clinton’s showing in 2016 in head-to-head polls against Trump, including in swing states (Chart 12). He has not been on voters’ minds much during the crises. But he has strong support among African American voters, who primarily handed him the party’s nomination, so he may be able to exploit the unrest. Voters indicate they favor him on race relations as well as the coronavirus, though they still favor Trump on the economy. Bottom Line: Trump’s polling was deteriorating before the social unrest. It will suffer more in the near term. But there are still five months until the election. The Market Now Recognizes That Trump Is An Underdog Now, with the country’s biggest cities ablaze, the market is waking up to the fact that Trump and the Republicans have a much greater chance of entirely losing control of the government in just five months. Online gamblers have recently upgraded Biden and the Democrats substantially (Chart 13). Opinion polling has shown weakness but now it is likely to seep into the financial industry’s consciousness that US domestic political risks could still go higher. Policy uncertainty will not fall as sharply as otherwise expected during the economic reopening. Unrest typically reflects negatively on the ruling party, suggesting the status quo is unacceptable and driving voters to vote for change. This is one of the 13 keys to the presidency under the scheme of Professor Allan J. Lichtman, at American University, who has predicted every popular vote outcome since 1984. If one accepts this thesis, then at least five of the keys have now turned against Trump and the GOP. If the economy somehow continues to shrink in the third quarter, or if GDP per capita falls harder than estimated in Chart 7 above, Lichtman’s model will turn against Trump (Table 3, see Appendix). Our own argument has been that a health crisis and surge in unemployment alone are enough to undercut him given his thin margins of victory four years ago and low approval rating. The George Floyd incident reinforces this logic. Not only is voter turnout correlated with the change in unemployment over the president’s term in office, but the correlation holds in swing states and among African Americans. Here is where the devastating impact of COVID-19 among blacks may be relevant (Chart 14). Chart 13Online Bookies Now See Trump Is Underdog
Social Unrest Can Still Cause Volatility
Social Unrest Can Still Cause Volatility
Chart 14Hardship For Blacks In Swing States
Social Unrest Can Still Cause Volatility
Social Unrest Can Still Cause Volatility
Chart 15Unemployment Pushes Up Voter Turnout (For Blacks And All)
Social Unrest Can Still Cause Volatility
Social Unrest Can Still Cause Volatility
If the pandemic and unemployment did not already provide sufficient motivation, then the George Floyd incident might rally this core Democratic Party constituency to turn up at the ballot box (Chart 15). That is a threat to President Trump given that Barack Obama is not on the ballot, so black turnout is unlikely to reach 2008 or 2012 levels. Bottom Line: An increase in African American voter turnout due to unemployment and poor race relations would broaden the electoral pathway to a Democratic victory in November. A Risk To The View: The Silent Majority Could the unrest help Trump? Possibly. Once the peaceful protests turned violent, the possibility emerged that Trump could benefit. The Democrats are not in a strong position whenever they link themselves to economic lockdowns and rioting and looting. It is clear from the police killings and unrest of 2014-15 that more and more people have lost confidence in police treating blacks and whites equally (Chart 16), but they do not make up a majority. Chart 16Over Time, Voters Losing Confidence In Police Fairness
Social Unrest Can Still Cause Volatility
Social Unrest Can Still Cause Volatility
Chart 17Majority Sees Racism As Individual, Not Institutional
Social Unrest Can Still Cause Volatility
Social Unrest Can Still Cause Volatility
Moreover, two-thirds of citizens, two-thirds of Hispanics, and almost half of blacks believed at that time that racism and discrimination stem from individual actions rather than institutional factors (Chart 17). Confidence and institutional trust will fall during today’s crisis moments but the above polls suggest limits to the protest movement. Generally Americans are satisfied with the work of their local police departments (Chart 18). This includes 72% of blacks. Only about a quarter of Americans report being harassed by the police at any time, according to a Monmouth University poll. Chart 18Silent Majority? Most Americans Satisfied With Local Police
Social Unrest Can Still Cause Volatility
Social Unrest Can Still Cause Volatility
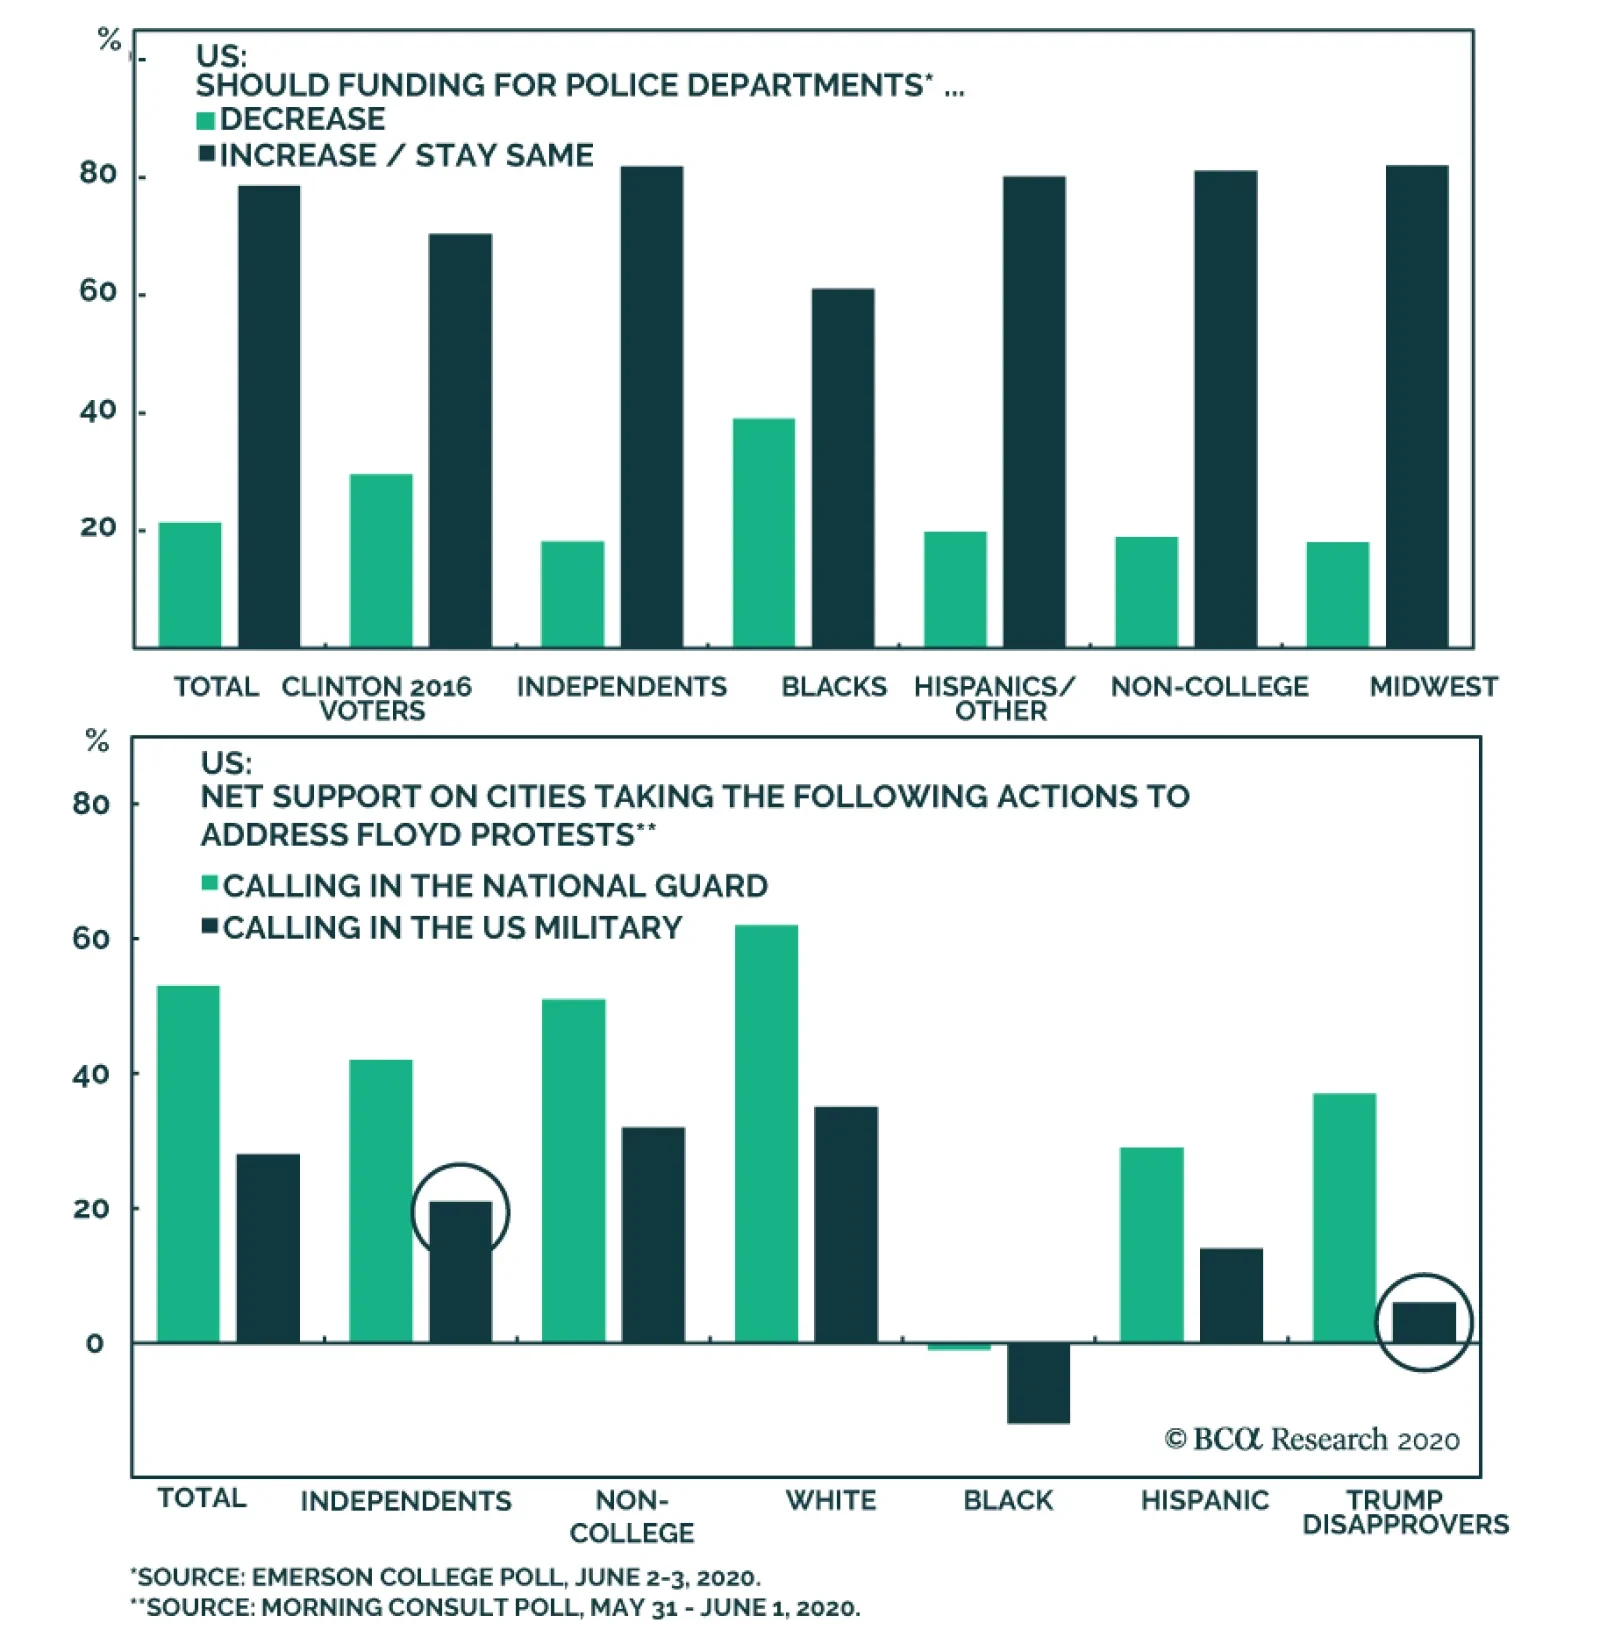
Almost 80% of people believe police funds should be increased or kept the same, versus 21% who agree with defunding the police. Only 39% of blacks support such a proposal (Chart 19). If House Democrats pass legislation characterized as taking funds away from police it will hurt them. Chart 19Silent Majority? Americans Don’t Want To Cut Police Funding
Social Unrest Can Still Cause Volatility
Social Unrest Can Still Cause Volatility
Finally, regarding the use of the military, 58% of Americans approve of the US military supplementing city police forces, while 30% oppose (Chart 20). George Bush Sr deployed troops in a similar predicament, the LA riots of 1992, albeit with an invitation from the California governor. Chart 20Silent Majority? Americans Mostly Support Military Aid To Police Amid Unrest
Social Unrest Can Still Cause Volatility
Social Unrest Can Still Cause Volatility
Legal constraints on Trump’s use of the military are low. Given that the political constraint is also low, a resurgence in violence will likely lead to a crackdown. Trump could benefit if it is managed successfully, but the risk of a bloody mistake that harms or kills civilians would also go up. Bottom Line: Trump could benefit from his pitch as the candidate of law and order if unrest continues, violence worsens, and his actions are deemed to restore order. We will upgrade Trump’s reelection odds if his polling improves and the stock market and economy continue to rebound. Investment Takeaways Historic bouts of unrest show that market volatility occurred in the wake of the 1965-69 disturbances, the 1992 LA riots, the breakdown of order in New Orleans after Hurricane Katrina in 2005, and the protests and riots against police brutality in 2014-15. Unrest did not prevent the market from rallying in all of these cases, but it did in some, and pullbacks also followed unrest periods. In every case presidential approval suffered – and in 1968, 1992, 2006, and 2014 the ruling party suffered losses in the election (Charts 21 A-D). Chart 21AThe ‘Long, Hot Summer’ Saw Inflation, Volatility
The 'Long, Hot Summer' Saw Inflation, Volatility
The 'Long, Hot Summer' Saw Inflation, Volatility
Chart 21BLA Riots Saw Unemployment, Volatility
LA Riots Saw Unemployment, Volatility
LA Riots Saw Unemployment, Volatility
Chart 21CKatrina Saw Volatility, Presidential Approval Drop
Katrina Saw Volatility, Presidential Approval Drop
Katrina Saw Volatility, Presidential Approval Drop
Chart 21DFerguson Saw Volatility Amid Falling Unemployment
Ferguson Saw Volatility Amid Falling Unemployment
Ferguson Saw Volatility Amid Falling Unemployment
Chart 22Confidence Suffers Amid Social Unrest
Social Unrest Can Still Cause Volatility
Social Unrest Can Still Cause Volatility
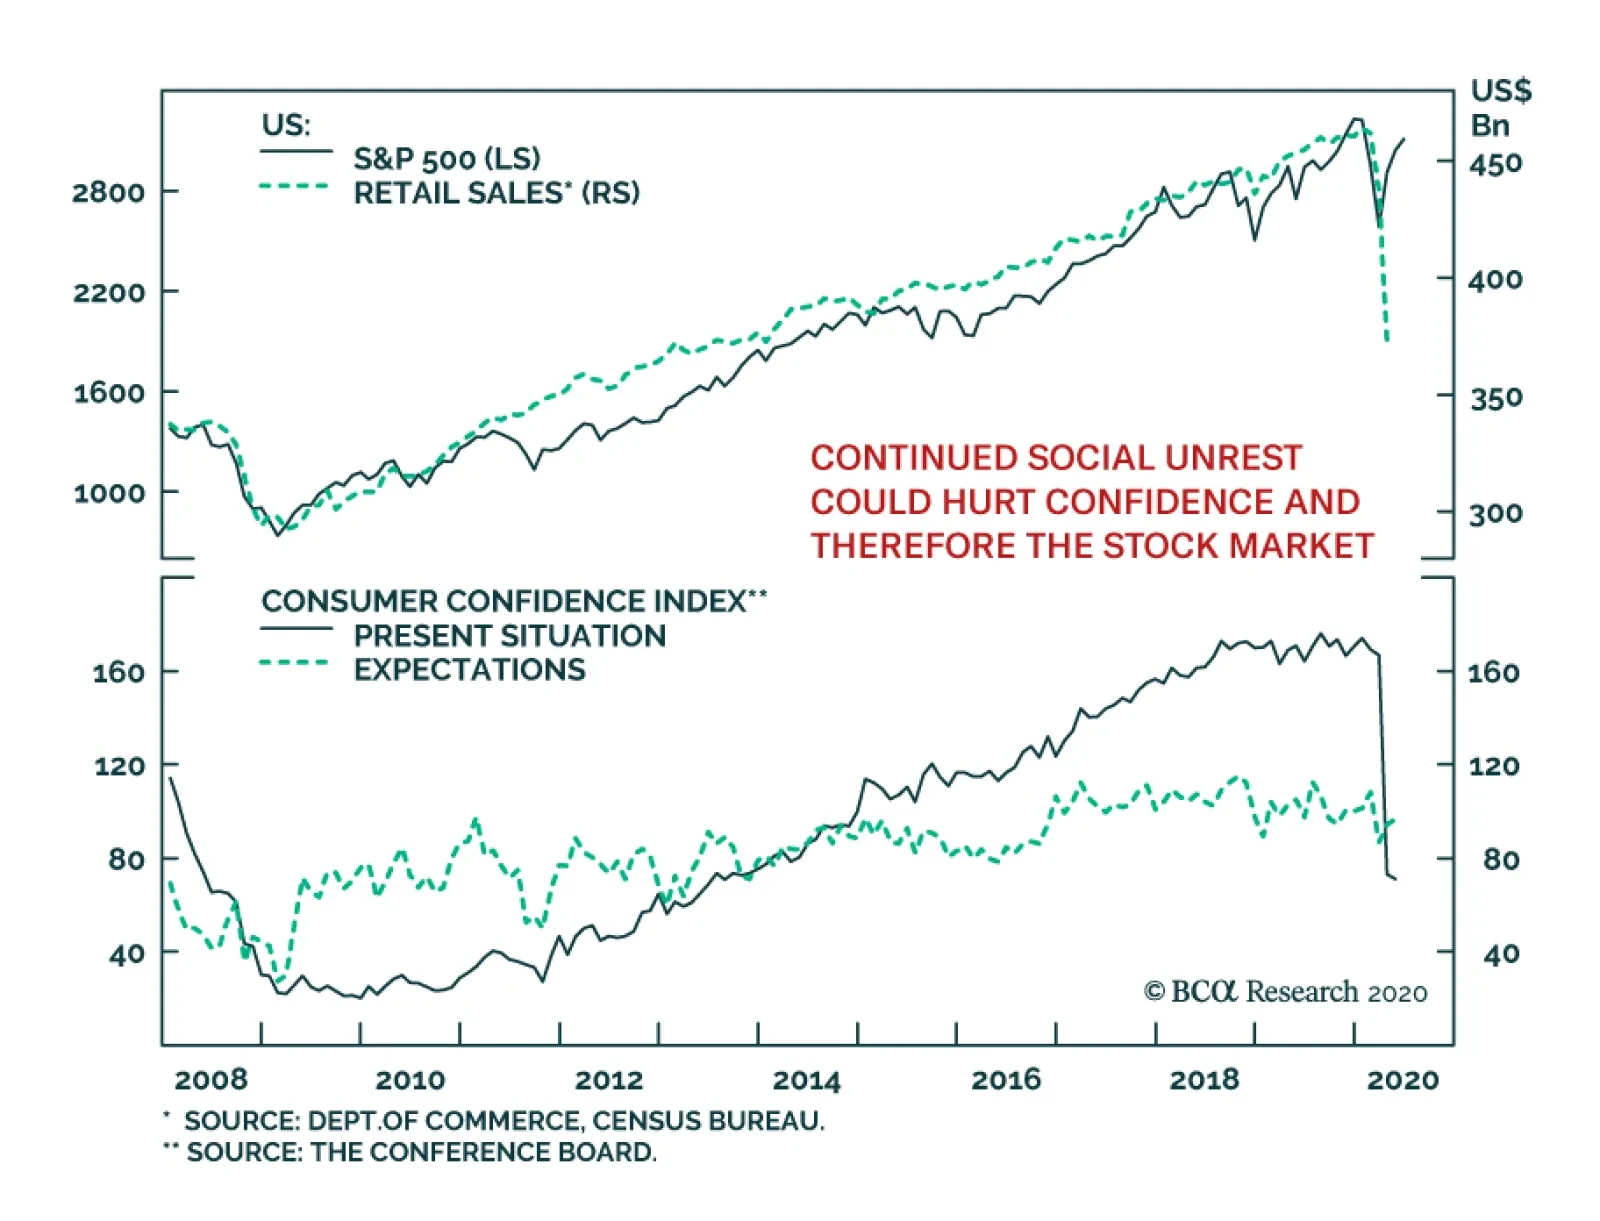
Furthermore, consumer and business confidence generally suffered in these periods (Chart 22). Trump’s reelection bid could fail to recover, which would make him a lame duck and heighten political risks dramatically. Our longstanding view that the party that wins the White House will also win the senate is reinforced by this year’s polls. The market is reacting to stimulus now but policies look to turn a lot tougher on business. The election puts a self-limiting factor into the equity rally. Either the market sells off in the short run to register the currently likely victory of Joe Biden, who will hike taxes, wages, and regulation, or the market rallies all the way till the election, increasing the chances of President Trump’s reelection, which would revolutionize the global system, especially on trade, and would require a selloff around December. The US dollar faces near-term headwinds as global growth recovers and uncertainty related to COVID-19 abates, but the near term is murky, whereas the major headwinds are over a cyclical time horizon. Our theme of “peak polarization” in the US contrasts starkly with our theme of “European integration” and implies that the euro can continue to advance. However, we are unlikely to reinitiate our long EUR-USD trade until the US election cycle is complete. The risk of a Trump victory is still substantial and we view Europe as a marginal loser in that scenario. We still expect investors to flee to the dollar in the event of any global crisis, even if it originates in the United States. Matt Gertken Vice President Geopolitical Strategist mattg@bcaresearch.com Appendix Table 2Trump’s Crisis Polling Bounce Compared To Previous Presidential Bounces
Social Unrest Can Still Cause Volatility
Social Unrest Can Still Cause Volatility
Table 3Lichtman’s 13 Keys To The Presidency Likely Turning Against Trump … Economy Critical
Social Unrest Can Still Cause Volatility
Social Unrest Can Still Cause Volatility
Footnotes 1 Please see BCA US Equity Strategy Insight Report, “Housekeeping” dated June 4, 2020, available at uses.bcaresearch.com. 2 Please see BCA US Equity Strategy Weekly Report, “There’s No Limit” dated May 26, 2020, available at uses.bcaresearch.com. 3 Please see BCA Geopolitical Strategy Weekly Report, “Michelle, Amash, Trump, Biden” dated May 15, 2020, available at gps.bcaresearch.com
BCA Research's Geopolitical Strategy service believes that there is a possibility that Trump could benefit from his pitch as the candidate of law and order if unrest continues, violence worsens, and his actions are deemed to restore order. Generally,…
BCA Research's Geopolitical Strategy service believes markets are too complacent in the face of social unrest. The market is looking through the most widespread social unrest since 1968 in the United States. History suggests that over a one-year horizon,…
Highlights Social unrest in the US is driven by structural and cyclical factors as well as election-year opportunism. It can still cause volatility. Unrest will weigh on consumer and business confidence – adding to already ugly fundamentals. The market has come around to our view that Trump is an underdog in the election. This is a risk to equities since a Democratic victory will bring full control of government. President Trump has low legal or political constraints to deploying the military if violence gets worse in the streets. This increases tail risks of a civilian death that amplifies the unrest. A “silent majority” of voters could give Trump a polling boost as a “law and order” candidate later this year. This could require us to upgrade his odds of reelection. The US dollar faces long-term headwinds but we are unlikely to reinitiate our long EUR-USD trade until the US election cycle is complete. Feature Chart 1Markets Skyrocket On Stimulus & Reopening
Markets Skyrocket On Stimulus & Reopening
Markets Skyrocket On Stimulus & Reopening
Economic reopening and stimulus are winning the day as investors continue to look forward to a time when growth and corporate earnings recover yet inflation and risk-free rates remain suppressed. Judging by the breakout of cyclical versus defensive stocks and risk-on versus risk-off currencies, the rally could continue and the gap between stock markets and macro fundamentals could widen further for some time (Chart 1). The market is looking through the most widespread social unrest since 1968 in the United States, which emerged due to the death in police custody of a black man, George Floyd, in Minneapolis. History suggests that over a one-year horizon, social unrest can be ignored – but in the near term it could yet provoke volatility. This risk is underrated because the market already believes that the unrest is a known quantity without material impact, yet this report shows otherwise. We see four new risks, the first three negative for the market. Chart 2US Consumer Sentiment Is Vulnerable
US Consumer Sentiment Is Vulnerable
US Consumer Sentiment Is Vulnerable
Consumer confidence and activity could worsen in the face of historic national unrest. The slight uptick in improving consumer expectations could reverse (Chart 2). President Trump’s odds of reelection could fall permanently, triggering a downgrading of long-run earnings expectations. A mistake could cause unrest to reach an unknown critical threshold that strikes fear into investors about US stability. The US debate has moved on from racism to “fascism” as Trump’s opponents criticize him for his authoritarian rhetoric and deployment of military forces to secure parts of Washington, DC. Structural factors are driving the riots which means they may smolder and additional incidents could cause them to flare up throughout summer and fall. The deployment of troops to quell civil unrest – as in any country at any time – could easily lead to bloody mistakes. The upside risk is that Republican senators will capitulate even sooner on fiscal spending measures, seeing that their corporate power base is likely to feel more concerned about the collapse of society. The House Democrats and President Trump already share an interest in larding up the spending, so it was only a matter of time till the senate caved in anyway. If the next $2 trillion arrives without the June-July hiccup that we expect, then the market could power higher (Chart 3). Chart 3Global Fiscal Stimulus Continues To Grow
Social Unrest Can Still Cause Volatility
Social Unrest Can Still Cause Volatility
In this report we show why US social unrest is structural and how it can still bring equity volatility. Also, the online betting market has caught up to our view that Trump is the underdog in the election. The prospect of full Democratic Party control could start to weigh on US equities. The upside risk to this view would be markets cheer Biden – which is unlikely for long – or if the violent protests create a “silent majority” that helps Trump win the swing states. If his polling improves in the wake of the riots – and the stock rally continues unabated – then we may upgrade his reelection odds from 35% to 50% or higher. Bottom Line: A pullback would be a buying opportunity, but a 10% correction could easily transpire given that a falling market reduces Trump’s odds greatly and could kill the market’s faith in Trump reflation policy from 2021-24. How Social Unrest Came To The United States The US was ripe for a major bout of unrest, as we have highlighted in past reports such as “Populism Blues” (2017), “Civil War Lite” (2019), and “Peak Polarization” (2020), as well as in our top five “Black Swans” report for this year. Our updated “Great Gatsby Curve” shows countries with high levels of income inequality and social immobility. The US is right in the danger zone, joined by other countries that have had unrest or political disruptions (Argentina, Chile, UK, Italy) or will soon (China) (Chart 4). African Americans suffer the worst of these ills and also have long-running grievances with the criminal justice system. Chart 4The US Is In The Danger Zone For Populism, Unrest
Social Unrest Can Still Cause Volatility
Social Unrest Can Still Cause Volatility
Unrest was an easy prediction even before the pandemic and recession, which made matters worse. The US ranks last, among developed markets, just below Greece, in our COVID-19 Unrest Index (Table 1). This index combines four factors – economic fundamentals, vulnerability to COVID-19, household grievances, and governance indicators – to rank countries according to their susceptibility to social unrest. US unemployment has soared higher than that of other countries as it has less generous automatic stabilizers. Table 1US Ranks Worst In Our COVID-19 Social Unrest Rankings
Social Unrest Can Still Cause Volatility
Social Unrest Can Still Cause Volatility
When it comes to the virus, the US is not any harder hit than most of its European peers (Chart 5). And the black community is not much harder hit than whites, although both have suffered more than their population share would imply, and more than the Hispanic community (Chart 6). Chart 5US No Different Than Western Europe On COVID-19 Deaths
Social Unrest Can Still Cause Volatility
Social Unrest Can Still Cause Volatility
Chart 6COVID-19 Least Deadly For Hispanics
Social Unrest Can Still Cause Volatility
Social Unrest Can Still Cause Volatility
However, the lockdowns have caused the unemployment rate to soar and exacted a greater toll on the least educated and lowest paid members of society. The election is enflaming the situation. President Trump’s economy has now performed little better for households than President Obama’s economy, assuming they suffer an income and wealth shock at least equal to that of 2008-09 (Chart 7). Chart 7Households Suffer Massive Income Shock
Households Suffer Massive Income Shock
Households Suffer Massive Income Shock
Given the collapsing economy, Trump is doubling down on “law and order,” taking an aggressive stance against rioting and looting and thus provoking a backlash. The media is also in a feeding frenzy as the pandemic and economic reopening narratives lose traction and yet Trump perseveres. Polarization is intensifying as a result. Trump’s rhetoric has been egregious as always. His threat to invoke the Insurrection Act of 1807 is not. President George Bush Sr invoked the act to suppress the LA riots in 1992. The act’s provisions, as well as the specific exceptions to the posse comitatus laws and norms, give the president broad discretion in matters precisely like these. The real constraint is not legal but political: any popular backlash from Trump and his advisers in trying to “dominate the battlespace” when it comes to civilians at home. Rioting and looting are also unpopular, so a larger crackdown could easily happen if more unrest takes place. Since the riots are driven by structural factors, they could still escalate, especially if another incident of police brutality occurs. Bottom Line: US unrest is driven by structural and cyclical factors and thus we are in for another “long, hot summer” like 1967. Negative surprises should be expected. The larger risks have to do with the impact on the election and sentiment. Trump’s Polling Was Dropping Even Before The Riots Trump’s approval rating has fallen to the lowest level this year and diverged from the historic average (Chart 8). This increases the risk that the market experiences volatility either in expectation of “regime change” in November or in reaction to Trump’s attempts to regain the initiative. Trump’s deviation from President Obama’s approval at this stage in 2012 is a warning sign (Chart 9). Chart 8Trump’s Polling Drops Below Average
Social Unrest Can Still Cause Volatility
Social Unrest Can Still Cause Volatility
Chart 9Trump Falls Off Obama’s Pathway To Reelection
Social Unrest Can Still Cause Volatility
Social Unrest Can Still Cause Volatility
Chart 10Trump’s Pandemic Bounce Turns Negative, Unlike Others
Social Unrest Can Still Cause Volatility
Social Unrest Can Still Cause Volatility
Trump and the Republican Party received a smaller polling bounce from the pandemic – and year-to-date the bounce is not only gone but has turned negative, comparable only to Vladimir Putin and United Russia (Chart 10). At its peak it was smaller than that of previous US presidents in crisis situations (Table 2, see Appendix). These data come from before the George Floyd incident which will make matters worse for Trump, given that initial polls suggest 35% approve and 52% disapprove of his response to it. The presumptive Democratic nominee Joe Biden is narrowly leading in all major swing states (Chart 11A). Trump has dropped off in critical swing states of Florida, Wisconsin, and Arizona (Chart 11B). Biden is closer to Trump than he should be in states like Ohio and even Texas. Chart 11ATrump Trailing Biden In Swing States
Social Unrest Can Still Cause Volatility
Social Unrest Can Still Cause Volatility
Chart 11BTrump Loses Critical Support In FL, WI, AZ
Social Unrest Can Still Cause Volatility
Social Unrest Can Still Cause Volatility
Chart 12Biden Polling Better Than Clinton Did Against Trump
Social Unrest Can Still Cause Volatility
Social Unrest Can Still Cause Volatility
Biden is tentatively outperforming Hillary Clinton’s showing in 2016 in head-to-head polls against Trump, including in swing states (Chart 12). He has not been on voters’ minds much during the crises. But he has strong support among African American voters, who primarily handed him the party’s nomination, so he may be able to exploit the unrest. Voters indicate they favor him on race relations as well as the coronavirus, though they still favor Trump on the economy. Bottom Line: Trump’s polling was deteriorating before the social unrest. It will suffer more in the near term. But there are still five months until the election. The Market Now Recognizes That Trump Is An Underdog Now, with the country’s biggest cities ablaze, the market is waking up to the fact that Trump and the Republicans have a much greater chance of entirely losing control of the government in just five months. Online gamblers have recently upgraded Biden and the Democrats substantially (Chart 13). Opinion polling has shown weakness but now it is likely to seep into the financial industry’s consciousness that US domestic political risks could still go higher. Policy uncertainty will not fall as sharply as otherwise expected during the economic reopening. Unrest typically reflects negatively on the ruling party, suggesting the status quo is unacceptable and driving voters to vote for change. This is one of the 13 keys to the presidency under the scheme of Professor Allan J. Lichtman, at American University, who has predicted every popular vote outcome since 1984. If one accepts this thesis, then at least five of the keys have now turned against Trump and the GOP. If the economy somehow continues to shrink in the third quarter, or if GDP per capita falls harder than estimated in Chart 7 above, Lichtman’s model will turn against Trump (Table 3, see Appendix). Our own argument has been that a health crisis and surge in unemployment alone are enough to undercut him given his thin margins of victory four years ago and low approval rating. The George Floyd incident reinforces this logic. Not only is voter turnout correlated with the change in unemployment over the president’s term in office, but the correlation holds in swing states and among African Americans. Here is where the devastating impact of COVID-19 among blacks may be relevant (Chart 14). Chart 13Online Bookies Now See Trump Is Underdog
Social Unrest Can Still Cause Volatility
Social Unrest Can Still Cause Volatility
Chart 14Hardship For Blacks In Swing States
Social Unrest Can Still Cause Volatility
Social Unrest Can Still Cause Volatility
Chart 15Unemployment Pushes Up Voter Turnout (For Blacks And All)
Social Unrest Can Still Cause Volatility
Social Unrest Can Still Cause Volatility
If the pandemic and unemployment did not already provide sufficient motivation, then the George Floyd incident might rally this core Democratic Party constituency to turn up at the ballot box (Chart 15). That is a threat to President Trump given that Barack Obama is not on the ballot, so black turnout is unlikely to reach 2008 or 2012 levels. Bottom Line: An increase in African American voter turnout due to unemployment and poor race relations would broaden the electoral pathway to a Democratic victory in November. A Risk To The View: The Silent Majority Could the unrest help Trump? Possibly. Once the peaceful protests turned violent, the possibility emerged that Trump could benefit. The Democrats are not in a strong position whenever they link themselves to economic lockdowns and rioting and looting. It is clear from the police killings and unrest of 2014-15 that more and more people have lost confidence in police treating blacks and whites equally (Chart 16), but they do not make up a majority. Chart 16Over Time, Voters Losing Confidence In Police Fairness
Social Unrest Can Still Cause Volatility
Social Unrest Can Still Cause Volatility
Chart 17Majority Sees Racism As Individual, Not Institutional
Social Unrest Can Still Cause Volatility
Social Unrest Can Still Cause Volatility
Moreover, two-thirds of citizens, two-thirds of Hispanics, and almost half of blacks believed at that time that racism and discrimination stem from individual actions rather than institutional factors (Chart 17). Confidence and institutional trust will fall during today’s crisis moments but the above polls suggest limits to the protest movement. Generally Americans are satisfied with the work of their local police departments (Chart 18). This includes 72% of blacks. Only about a quarter of Americans report being harassed by the police at any time, according to a Monmouth University poll. Chart 18Silent Majority? Most Americans Satisfied With Local Police
Social Unrest Can Still Cause Volatility
Social Unrest Can Still Cause Volatility
Almost 80% of people believe police funds should be increased or kept the same, versus 21% who agree with defunding the police. Only 39% of blacks support such a proposal (Chart 19). If House Democrats pass legislation characterized as taking funds away from police it will hurt them. Chart 19Silent Majority? Americans Don’t Want To Cut Police Funding
Social Unrest Can Still Cause Volatility
Social Unrest Can Still Cause Volatility
Finally, regarding the use of the military, 58% of Americans approve of the US military supplementing city police forces, while 30% oppose (Chart 20). George Bush Sr deployed troops in a similar predicament, the LA riots of 1992, albeit with an invitation from the California governor. Chart 20Silent Majority? Americans Mostly Support Military Aid To Police Amid Unrest
Social Unrest Can Still Cause Volatility
Social Unrest Can Still Cause Volatility
Legal constraints on Trump’s use of the military are low. Given that the political constraint is also low, a resurgence in violence will likely lead to a crackdown. Trump could benefit if it is managed successfully, but the risk of a bloody mistake that harms or kills civilians would also go up. Bottom Line: Trump could benefit from his pitch as the candidate of law and order if unrest continues, violence worsens, and his actions are deemed to restore order. We will upgrade Trump’s reelection odds if his polling improves and the stock market and economy continue to rebound. Investment Takeaways Historic bouts of unrest show that market volatility occurred in the wake of the 1965-69 disturbances, the 1992 LA riots, the breakdown of order in New Orleans after Hurricane Katrina in 2005, and the protests and riots against police brutality in 2014-15. Unrest did not prevent the market from rallying in all of these cases, but it did in some, and pullbacks also followed unrest periods. In every case presidential approval suffered – and in 1968, 1992, 2006, and 2014 the ruling party suffered losses in the election (Charts 21 A-D). Chart 21AThe ‘Long, Hot Summer’ Saw Inflation, Volatility
The 'Long, Hot Summer' Saw Inflation, Volatility
The 'Long, Hot Summer' Saw Inflation, Volatility
Chart 21BLA Riots Saw Unemployment, Volatility
LA Riots Saw Unemployment, Volatility
LA Riots Saw Unemployment, Volatility
Chart 21CKatrina Saw Volatility, Presidential Approval Drop
Katrina Saw Volatility, Presidential Approval Drop
Katrina Saw Volatility, Presidential Approval Drop
Chart 21DFerguson Saw Volatility Amid Falling Unemployment
Ferguson Saw Volatility Amid Falling Unemployment
Ferguson Saw Volatility Amid Falling Unemployment
Chart 22Confidence Suffers Amid Social Unrest
Social Unrest Can Still Cause Volatility
Social Unrest Can Still Cause Volatility
Furthermore, consumer and business confidence generally suffered in these periods (Chart 22). Trump’s reelection bid could fail to recover, which would make him a lame duck and heighten political risks dramatically. Our longstanding view that the party that wins the White House will also win the senate is reinforced by this year’s polls. The market is reacting to stimulus now but policies look to turn a lot tougher on business. The election puts a self-limiting factor into the equity rally. Either the market sells off in the short run to register the currently likely victory of Joe Biden, who will hike taxes, wages, and regulation, or the market rallies all the way till the election, increasing the chances of President Trump’s reelection, which would revolutionize the global system, especially on trade, and would require a selloff around December. The US dollar faces near-term headwinds as global growth recovers and uncertainty related to COVID-19 abates, but the near term is murky, whereas the major headwinds are over a cyclical time horizon. Our theme of “peak polarization” in the US contrasts starkly with our theme of “European integration” and implies that the euro can continue to advance. However, we are unlikely to reinitiate our long EUR-USD trade until the US election cycle is complete. The risk of a Trump victory is still substantial and we view Europe as a marginal loser in that scenario. We still expect investors to flee to the dollar in the event of any global crisis, even if it originates in the United States. Matt Gertken Vice President Geopolitical Strategist mattg@bcaresearch.com Appendix Table 2Trump’s Crisis Polling Bounce Compared To Previous Presidential Bounces
Social Unrest Can Still Cause Volatility
Social Unrest Can Still Cause Volatility
Table 3Lichtman’s 13 Keys To The Presidency Likely Turning Against Trump … Economy Critical
Social Unrest Can Still Cause Volatility
Social Unrest Can Still Cause Volatility
Highlights Our base case reflects our view that China’s strong fiscal and monetary stimulus, combined with a weaker US dollar, will provide a favorable backdrop for copper markets in 2H20. Supply factors are for the most part reflected in current copper prices. In 2H20, the speed of the demand recovery will be the determining factor for prices. Global policy uncertainty remains high. Assessing the joint effects of global monetary and fiscal stimulus, along with consumers’ willingness to spend once lockdowns are lifted will keep uncertainty at relatively high levels. A possible second wave of COVID-19 returning large economies to lockdown status looms large for copper markets, and for commodity markets generally. The combination of safe-haven demand and a continued dollar shortage for borrowers without access to US swap lines could keep the dollar well bid, suppressing foreign flows to EM economies and commodity demand at the margin. Tactically, we remain on the sidelines until the fog clears around these known and unknown unknowns. A $3/lb COMEX refined copper price is likely in 2H20, but the risks to this outlook remain high. Feature Copper prices will end the year higher vs. current levels in our base case. But uncertainty remains elevated. Copper prices will end the year higher vs. current levels in our base case. But uncertainty remains elevated. Assessing the synchronicity of EM recoveries and the joint effects of global monetary and fiscal stimulus, along with consumers’ willingness to spend once lockdowns are lifted is extremely difficult. Looming over all of these considerations: A possible second wave of COVID-19 returning large economies to lockdown status loom large. Tactically, we remain on the sidelines as the fog clears around some of these known and unknown unknowns. Importantly, our positive view rests on our expectation of a robust recovery in China’s economic activity and, to a lesser extent, in its main export destinations, which were hit later by the pandemic. A weak recovery in China would slow the rate at which the current copper supply surplus subsides. At ~ $2.50/lb, copper prices have recovered significantly since bottoming in March at $2.11/lb on the COMEX. Still, clearing the $3.30/lb double top reached in June 2018 will require either a significant increase in global demand or a sharp contraction in supply, which we do not expect. Copper markets were severely hit by the global pandemic: Prices fell 10% in January, as the case count grew in China – the largest copper-consuming market – followed by another 19% decline as the virus spread globally (Chart of the Week). The intensification of lockdowns globally pushed copper markets to a 60k MT surplus as of March – the latest data reported by the World Bureau of Metal Statistics (WBMS) – from a 20k MT deficit in 2019. Bearish sentiment moved our Tactical Composite Indicator – which captures sentiment, positioning, and momentum dynamics – to oversold territories on in March (Chart 2). Chart of the WeekCopper Prices Were Severely Hit By The Pandemic
Speed Of Demand Recovery Remains Key To Copper Prices
Speed Of Demand Recovery Remains Key To Copper Prices
Chart 2Bearish Sentiment Crushes Copper Prices
Bearish Sentiment Crushes Copper Prices
Bearish Sentiment Crushes Copper Prices
After reaching a low of $2.11/lb on March 23, COMEX copper prices surged 18% with few interruptions as the Chinese economy reopened, and global monetary and fiscal authorities supplied unprecedented economic support (Chart 3). This prompted a wave of short-covering by money managers, releasing some of the downward pressure on prices (Chart 4). Chart 3Unprecedented Fiscal Response
Speed Of Demand Recovery Remains Key To Copper Prices
Speed Of Demand Recovery Remains Key To Copper Prices
Chart 4Money Managers Neutral For Now
Money Managers Neutral For Now
Money Managers Neutral For Now
Still, hedge funds have not yet entered bullish positions on the metal. And, importantly, inventory levels are not drawing sharply. China’s Economy Bottomed, World ex-China Still Contracting Our outlook hinges primarily on our assessment of China’s policy-driven copper demand – both from domestic usage perspective, and, to a lesser extent, from copper-intensive exported goods. Since the end of the Global Financial Crisis (GFC), copper prices have mostly shadowed China’s economic cycles (Chart 5). China’s importance for copper markets now dominates that of major DM countries (Chart 5, panel 3). The influence of global supply-demand fundamentals on copper prices has declined. Prices are increasingly policy-driven with supply adjusting to demand as dictated by Chinese policymakers’ decisions on the allocation of total social financing funds in that economy. Thus, our outlook hinges primarily on our assessment of China’s policy-driven copper demand – both from domestic usage perspective, and, to a lesser extent, from copper-intensive exported goods. According to the International Copper Study Group (ICSG), around 17% of Chinese copper demand comes from exports of products containing copper.1 In “normal” times, we rely heavily on our monthly indicators to gauge economic and commodity cycles. However, the speed with which the COVID-19 pandemic evolves – and the associated fiscal and monetary responses to it – makes short-term forecasting of cyclical commodities a perilous task. Chart 5DM Consumption Pales Vs. China
DM Consumption Pales Vs. China
DM Consumption Pales Vs. China
High-frequency data suggest Chinese economic growth bottomed in March and is rapidly recovering (Chart 6). Chart 6Chinese Economy Returning To Normal
Speed Of Demand Recovery Remains Key To Copper Prices
Speed Of Demand Recovery Remains Key To Copper Prices
Meanwhile in China’s major export destinations, the number of confirmed COVID-19 cases appear to be flattening, containment measures are gradually easing, and mobility is improving (Chart 7, panel 1 and 2). Globally, the copper- and oil-to-gold ratios have stabilized, and stock prices for nine of the largest copper producers have trended up since March 23 (Chart 7, panel 3 and 4). That said, we believe it is still too early to adopt a high-conviction view about a price recovery trajectory. For one, China recently reintroduced containment measures in certain regions, as clusters of coronavirus cases were detected, highlighting the fragility of the current recovery.2 Chart 7China's Major Export Partners Could Rebound Soon
China's Major Export Partners Could Rebound Soon
China's Major Export Partners Could Rebound Soon
Chart 8Strong Domestic Demand, Weak Export Growth
Strong Domestic Demand, Weak Export Growth
Strong Domestic Demand, Weak Export Growth
Moreover, the rebound in overall Chinese demand hasn’t fully offset the collapse in its exports. As a result, the reopening of the supply side of the economy outpaced demand growth (Chart 8). Extrapolating this to its copper market: Chinese refined copper production (40% share of world output) is facing robust domestic demand but weak export demand for copper (44% and 9% of world demand), leaving its market with a supply surplus. Nonetheless, absent a severe second wave of COVID-19 cases, the infrastructure-focused stimulus and market-friendly real estate policies in the country will allow internal demand to overtake production in 2H20, despite limited external demand (more on this below). China’s Credit Growth To Drive Copper Demand Higher The key message emerging from the NPC is that policymakers are willing to do whatever it takes – including abandoning their deleveraging objectives – to reflate the economy. Markets were unimpressed by the fiscal package announced during China’s National People’s Congress (NPC) last month, which, for the first time in decades, did not contain an annual economic growth target in the Government Work Report (Table 1). Even so, the key message emerging from the NPC is that policymakers are willing to do whatever it takes – including abandoning their deleveraging objectives – to reflate the economy. Broad money and total social financing growth will accelerate relative to last year and notably exceed nominal GDP growth. Our Emerging Markets strategists expect China’s fiscal and credit impulse will reach 15.5% this year (Chart 9).3 Table 1No Economic Growth Target In The Government Work Report
Speed Of Demand Recovery Remains Key To Copper Prices
Speed Of Demand Recovery Remains Key To Copper Prices
Additionally, China pledged to stabilize employment and targeted the creation of 9 million new jobs in urban areas. This is an ambitious target amidst the massive layoffs induced by the COVID-19 pandemic this year. Chart 9Chinese Credit Growth Will Surge
Chinese Credit Growth Will Surge
Chinese Credit Growth Will Surge
Policymakers also reserved policy space to be used – without the approval of the NPC at the Politburo’s mid-year review – in the event the shock from the pandemic proves persistent.4 Past episodes of Chinese stimulus resulted in strong rallies in base metals prices. Given China now represents more than half of global copper consumption (vs. 43% in 2009 following the GFC, and 32% in 2012 following the euro area debt crisis), we expect this new round of stimulus will lead to a sharp increase in copper prices.5 By and large, refined copper prices are highly sensitive to growth in EM imports – particularly China’s – which are closely tied to income growth. The latest CPB World Trade Monitor data for March shows EM ex-China imports have been resilient suggesting the rebound in China’s economic activity might be spilling over to other EMs highly leveraged to China (Chart 10). Still, our main cyclical commodity demand indicators were declining as of April. We expect stimulus-driven EM income and investment growth will show up in our indicators in 2H20 (Chart 10). Chart 10Awaiting A Rebound In Our Cyclical Indicators
Speed Of Demand Recovery Remains Key To Copper Prices
Speed Of Demand Recovery Remains Key To Copper Prices
Stalling Primary And Secondary Supply Growth In addition to the demand implications, lockdowns also resulted in restrictions – and few complete shutdowns – in mining activities in copper-producing countries. The ICSG revised down its global mine and refined copper output by 950k MT and 1.1mm MT, respectively, for this year on the back of the COVID-19 pandemic.6 The group now expects 2020 mine supply to decline by 3% this year and refined production to remain flat y/y, for a second consecutive year. While important, these adjustments were insufficient to completely offset the large negative demand shock in 1Q and 2Q20.7 In 2H20, the supply-side outlook rests on the evolution of COVID-19 cases and associated governments’ responses in major ore and refined copper-producing countries (i.e. Chile, Peru, US, DRC, China, Russia, and Japan). So far, mining activities were mostly treated as essential and allowed to operate at reduced capacity under additional sanitary and social distancing guidelines. Confirmed cases in these countries appears to be slowing, this could allow activity to slowly return to normal (Chart 11). Chart 11Further Supply Disruptions Are Unlikely
Speed Of Demand Recovery Remains Key To Copper Prices
Speed Of Demand Recovery Remains Key To Copper Prices
Supply factors are for the most part reflected in current prices. Going forward the speed of the demand recovery will be the determining factor for copper prices. While mining and refining of copper concentrates were often classified as essential, scrap activities were not. According to the ICSG, copper scrap supplied decreased significantly as trade flows and generation, collection, and disassembling activities were disrupted by the pandemic. China’s import of scrap copper – a key input for Chinese refiners – declined 37% in 1Q20. This prompted the government to allow more scrap imports to fill the gap, but it might struggle to find suppliers. Globally, scrap makes up ~ 25% of total refined copper supply, thus, it usually plays a non-negligible role in the rebalancing of global markets. Supply factors are for the most part reflected in current prices. Going forward the speed of the demand recovery will be the determining factor for copper prices. In addition, the crisis began at an abnormally low inventory level. Thus, despite the temporary build in 1Q20, inventories are still below their 2010 to 2019 average. The rebound in demand, combined with flat supply and limited scrap availability, will move Chinese inventory down in 2H20 and offset any builds at the LMEX and COMEX warehouses, supporting copper prices this year (Chart 12). Chart 12Inventories Still Low Despite Builds In 1Q20
Inventories Still Low Despite Builds In 1Q20
Inventories Still Low Despite Builds In 1Q20
USD Depreciation Leads To EM Economic Growth Uncertainty over the duration of lockdowns globally continues to fuel safe-haven demand for USD. As the COVID-19 shock abates we expect a weaker US dollar to be more supportive to copper demand. Uncertainty over the duration of lockdowns globally continues to fuel safe-haven demand for USD (Chart 13). The shortage of USD experienced by EM debtors servicing dollar-denominated debt continues to hamper their recovery. The combination of safe-haven demand and a continued dollar shortage for borrowers without access to US swap lines is keeping the dollar well bid, suppressing foreign flows to EM economies and commodity demand at the margin (Chart 14, panel 1). Chart 13Global Financial Cycles Hurting EM Economies
Speed Of Demand Recovery Remains Key To Copper Prices
Speed Of Demand Recovery Remains Key To Copper Prices
Chart 14Uncertainty Keeps USD Well Bid
Uncertainty Keeps USD Well Bid
Uncertainty Keeps USD Well Bid
The Fed will continue to accommodate USD demand, in an ongoing attempt to reverse a tightening of global financial conditions. EM economies – the bulk of base metals demand growth – are facing dual domestic demand and global financial shocks.8 These economies have become more dependent on foreign portfolio inflows, both in debt and equity markets (Chart 14, panel 2). Thus, global financial cycles now have a significant impact on their growth. The main factors influencing these flows are risk appetite, EM exchange rates, and DM interest rates.9 We expect all factors to support inflows to emerging markets as the COVID-19 shock abates. The Fed will continue to accommodate USD demand, in an ongoing attempt to reverse a tightening of global financial conditions. A lower USD will decrease the local-currency cost of consuming commodities ex-US. Metals producers' ex-US will face higher local-currency operating costs, reducing supply growth at the margin. A depreciating USD is a necessary factor for our bullish cyclical commodities view (Chart 15). The risk to this view is a severe second wave of COVID-19 infection which would cause safe assets to spike anew. Chart 15Metals Inversely Correlated With The US Dollar
Metals Inversely Correlated With The US Dollar
Metals Inversely Correlated With The US Dollar
$3.00/lb Copper Price Likely; Geopolitical Risks Mounting Over the short term, geopolitical risks – chiefly mounting Sino-US tensions – could derail the rally in copper prices and other risk assets. For April, our copper demand model suggested prices were at equilibrium relative to underlying demand trends (Chart 16). Chart 16Copper Prices Will Rise As The USD Depreciates
Copper Prices Will Rise As The USD Depreciates
Copper Prices Will Rise As The USD Depreciates
When simulating a 10% decline in the USD and a rebound in EM import growth in 2H20, our model suggests COMEX copper prices could move 25% higher, holding everything else constant. In reality, the USD’s path and the extent of the EM import rebound are among the key known unknowns we confront in estimating a model for copper prices. We do not have a precise view on these variables, which is why we run simulations. Theory would suggest the stimulus we are seeing globally points to a lower USD and a pick-up in EM imports, however, and these factors will create a more supportive environment for metals prices. Over the short term, geopolitical risks – chiefly mounting Sino-US tensions – could derail the rally in copper prices and other risk assets. With the US election now only 5 months away, President Trump’s odds of being reelected on the back of a strong economy are fading amidst the COVID-19 pandemic. According to our Geopolitical strategists, Trump is the underdog and will need to double down on foreign and trade policies to prop-up his chances of winning. Meanwhile, China is seeking to solidify its sphere of influence.10 This is causing US-China tensions to intensify. Depending on the nature of the actions taken by the Trump administration (i.e. increasing tariffs on US imports of Chinese goods vs. cutting China’s access to foreign technology), metals prices could suffer, as was the case in 2018. With these geopolitical risks in mind, we maintain that China’s strong fiscal and monetary stimulus, combined with a falling US dollar will provide a favorable backdrop for copper markets in 2H20. Hugo Bélanger Senior Analyst Commodity & Energy Strategy HugoB@bcaresearch.com Robert P. Ryan Chief Commodity & Energy Strategist rryan@bcaresearch.com Commodities Round-Up Energy: Overweight Doubts about OPEC 2.0’s commitment to extending their deepest-ever production cuts expiring this month to July, perhaps August, took some of the steam out of crude-oil rally earlier in the week. In our modeling, we do not see the need to extend the massive voluntary cuts announced by the Kingdom of Saudi Arabia (KSA) and its Gulf allies: KSA’s cuts of ~ 4.5mm b/d vs. its April output level of 12mm b/d starting this month will take the Kingdom’s output to ~ 7.5mm b/d. The UAE and Kuwait also voluntarily added cuts of 100k and 80k b/d, respectively, to their agreed quotas. We continue to believe the current schedule of production cuts will result in a physical supply deficit in 3Q20, which will require OPEC 2.0 to begin raising production to keep prices from getting too high going into a US presidential election. We expect Brent prices to average $40/bbl this year and $68/bbl next year, with WTI trading $2 - $4/bbl below that (Chart 17).11 Base Metals: Neutral Iron ore prices breached $100/MT this week, as COVID-19-induced supply disruptions in Brazil – the largest exporter of high-grade ore – and South Africa leave the seaborne market open to Australian suppliers to meet higher Chinese demand as port inventories are rebuilt. FastMarkets MB, a sister company of BCA Research, reported May exports to China from Brazil were down 28% y/y to 21.5mm MT from just under 30mm MT the year prior. Iron ore exports from Australia are expected to exceed A$100 billion this year, according to government estimates reported by the Financial Times.12 Precious Metals: Neutral As we go to press, gold prices retreated to $1,700/oz from ~ $1,740/oz last week, exhibiting a positive correlation with the dollar. This is a result of rising risk appetite globally as economies exit lockdowns. In the US, interest rates are continuing to support gold. Going forward, the probability of negative rates is remains low, but the Fed will continue to buy more debt from the public and private sectors to push the shadow rate further down. This supports gold prices (Chart 18). Chart 17Crude Prices Will Rebound
Crude Prices Will Rebound
Crude Prices Will Rebound
Chart 18Fed Buying Supports Gold Prices
Fed Buying Supports Gold Prices
Fed Buying Supports Gold Prices
Footnotes 1 Please see “The Impact of the COVID-19 Pandemic on World Copper Supply,” published by the International Copper Study Group on May 21, 2020. 2 A resurgence of infection triggered renewed lockdowns over a region of 100 million people in May. Please see More than 100 million people in China's northeast back under lockdown to thwart potential second wave published by the National Post on May 19, 2020. 3 Please see BCA's Emerging Markets Strategy Weekly Report "EM Stocks Are At A Critical Resistance Level," published May 28, 2020. It is available at ems.bcaresearch.com. 4 Please see BCA's China Investment Strategy Weekly Report "Taking The Pulse Of The People’s Congress," published May 28, 2020. It is available at cis.bcaresearch.com. 5 There remains a risk global monetary stimulus fails to ignite strong consumer and business consumption. The unprecedented shock could raise precautionary savings and keep risk aversion elevated for an extended period. Based on the Quantity Theory of Money, money supply times velocity (the rate at which money changes hands) equals nominal GDP. Low confidence translates to a low velocity of money limiting the reach of monetary policy. This value is extremely difficult to forecast. 6 Please see “The Impact of the COVID-19 Pandemic on World Copper Supply,” published by the International Copper Study Group on May 21, 2020. 7 According to BGRIMM Lilan Consulting, China’s real demand for refined copper declined by ~22% in 1Q20. This implies a ~11% decline in global copper consumption. Please see footnote 6 for more details. 8 Global financial cycles capture how global financial conditions affect individual economies. The analysis of these cycles stressed the importance of common factors in global risk asset prices which are driven by risk appetite and US monetary policy. These factors are mainly explained by developments in advanced economies but have a drastic effect on emerging markets. Please see Iñaki Aldasoro, Stefan Avdjiev, Claudio Borio and Piti Disyatat (2020). “Global and domestic financial cycles: variations on a theme,” BIS Working Papers, No 864. 9 Please see Chapter 3 of the Global Financial Stability Report titled “Managing Volatile Portfolio Flows,” published by IMF. 10 Please see BCA's Geopolitical Strategy Weekly Report "Spheres Of Influence (GeoRisk Update)," published May 29, 2020. It is available at gps.bcaresearch.com. 11 Please see our May 21, 2020 report entitled US Politics Will Drive 2H20 Oil Prices for our latest view on oil fundamentals and prices, available at ces.bcaresearch.com. 12 Please see Australia’s iron ore miners exploit supply gap as Covid-19 hobbles rivals published by the Financial Times June 3, 2020. Investment Views and Themes Recommendations Strategic Recommendations Tactical Trades Trade Recommendation Performance In 2020 Q1
Speed Of Demand Recovery Remains Key To Copper Prices
Speed Of Demand Recovery Remains Key To Copper Prices
Commodity Prices and Plays Reference Table Trades Closed in 2020 Summary of Closed Trades
Speed Of Demand Recovery Remains Key To Copper Prices
Speed Of Demand Recovery Remains Key To Copper Prices
The SPX has broken out to fresh recovery highs defying recent rising political and geopolitical risks. The reopening of the economy is the primary driver of renewed market euphoria, along with the ongoing easy fiscal and monetary policies. Sentiment is not as extended as at the February SPX peak or previous SPX peaks in the past few years. However, greed is slowly showing up on our radar screens as investors that have missed out on the rally are chasing performance and also there is an added element of a short squeeze. One potential negative catalyst that could cause a healthy reset is the rise in the polls of Democratic presidential candidate Joe Biden ahead of the November elections. The chart shows that over the past year the S&P 500 has moved in lockstep with the relative odds of a Republican versus a Democrat getting elected President. In truth, the online gambling community has been slow to react to the erosion of President Trump’s platform due to pandemic and recession – so his odds could fall further in the near term. At the margin, a Biden win should be negative for the stock market as he is perceived as more hostile to businesses and the specter of higher taxes could trip up the SPX. Our Geopolitical Strategy has highlighted this risk in recent reports, including on May 15.1 Bottom Line: While we remain constructive on the SPX over the coming 9-12 month time horizon, a flare in geopolitical risks and uncertainty around the upcoming election could serve as catalysts for a much needed breather in equities.
Housekeeping
Housekeeping
Footnotes 1Please see BCA Geopolitical Strategy Weekly Report, “Michelle, Amash, Trump, Biden” dated May 15, 2020, available at gps.bcaresearch.com
Highlights There are no atheists in foxholes, and no Austrians ahead of this election: Republican senators and White House staffers may grumble about giveaways, but they cannot risk being painted as the Grinch who Stole Essential Services in the homestretch of the campaign. A Biden victory will mean a leftward swing: Our geopolitical strategists believe markets are underestimating the extent to which a Biden victory would lead to a less friendly backdrop for investment capital. Tensions with China are likely to escalate: China-bashing is popular with the electorate, and a desperate White House may turn up the heat to recover its standing in the polls. The battle for great-power supremacy remains unresolved. The pandemic is causing the retreat from globalization to accelerate before our eyes: Curtailing offshoring and building new redundancies into supply chains will weigh on corporate profit margins and undermine earnings growth. Feature We had the pleasure of sitting down with Matt Gertken, the leader of BCA’s Geopolitical Strategy service, for a webcast last week. The timing could not have been better, as the pandemic has thrust Washington into the spotlight and the campaign will keep it there until Election Day. This report blends the US Investment Strategy and Geopolitical Strategy teams’ takes on the broad themes we discussed and is a starting point for thinking about the 2020 election and its financial market implications. We will return to the topic throughout the summer and early fall as developments unfold. Republicans in the Senate can talk tough now, but they will have to knuckle under if they want to keep their majority (and the White House). Future Fiscal Largesse Though the scale of the CARES Act was huge, powering the United States to the head of the global class in terms of fiscal stimulus (Chart 1), both parties were discussing the next phase of COVID-19 relief before the ink on the bill was dry. Two months later, that momentum has stalled as Republicans have begun to push back against a fifth wave of spending (the CARES Act was the third). Senator Lindsey Graham (R-SC) has taken direct aim at the $600 weekly federal unemployment benefit supplement, scheduled to expire at the end of July, calling unemployment benefits in excess of pay an “aberration,” and pledging that the program will be extended “over [his] dead body.” Chart 1A Massive Amount Of Fiscal Stimulus
Elections Have Consequences
Elections Have Consequences
That benefit may be generous on a Scandinavian scale,1 but along with the direct $1,200 payments sent to nearly two-thirds of households, it is helping the economy withstand deleterious social distancing measures. Shoring up the finances of vulnerable households will help them stay current on their auto loans and rent or mortgage payments, staving off a wave of repossessions, evictions and foreclosures, and preventing a cascading chain of defaults that would intensify the economic pressure. Table 1The Battleground States Need Help
Elections Have Consequences
Elections Have Consequences
Graham’s rhetorical flourishes aside, Republicans cannot hand the Democrats an opening to cast them as Scrooge when the campaign intensifies in late summer. Trump’s 2016 victory turned on flipping Florida and Rust Belt stalwarts Pennsylvania, Ohio, Michigan and Wisconsin from the Democrats, and all those states are in play again except Ohio (Chart 2). Unemployment is elevated in the battleground Rust Belt states, and we think it must be higher than the official measure in a state as dependent on tourism as Florida (Table 1).2 Channeling the Grinch by taking unemployment benefits and essential workers away from put-upon voters in pivotal states3 is not a winning electoral strategy. Caught between an aid proposal that both Democrats and the White House want, Republican senators will ultimately have to concede. Chart 2The Midwest And Florida Are Crucial
Elections Have Consequences
Elections Have Consequences
Rounding Out The Democratic Ticket Chart 3A New Obama-Biden Ticket?
Elections Have Consequences
Elections Have Consequences
Presumptive Democratic nominee Biden is considering the pool of candidates to fill the number two spot on the ticket. Vice-presidential picks generate a lot of discussion when they’re made, but they typically have little influence on election outcomes. Among this year’s crop of contenders for the presidential nomination, only Senator Amy Klobuchar (D-MN) could fulfill the typical VP function of helping to land a swing state. Klobuchar would likely appeal to soccer moms and suburban independents capable of being swayed back to the Democrats, but her moderate sensibilities wouldn’t expand Biden’s appeal to the party’s progressive wing or inspire younger voters. Senator Elizabeth Warren (D-MA) could help attract progressives and younger voters who see Biden as the status quo, but her antipathy toward big business could turn off swing voters and she would come at the cost of a senate seat.4 Voters have an unfavorable view of Kamala Harris (D-CA) and her contentious exchanges with Biden in the early debates could make for an awkward pairing. Stacey Abrams has recently entered the picture and would be an asset if she were able to increase African-American voter turnout, but she has a thin government resume. Michelle Obama is the only choice who would make a splash and significantly boost Biden’s prospects. She is viewed way more favorably than the rest of the field (Chart 3), would solidify Biden’s connection with Barack Obama, and increase turnout among the progressive, female, and minority voters the ticket needs to tip the scales in its favor. Unfortunately for the Democrats, she has unequivocally indicated that she does not wish to run. Biden has said he’d welcome her onto the ticket in a second, and he will likely put off his choice until efforts to draft her definitively fail. Michelle Obama could shake up the race if the Democrats can convince her to join the ticket. Investors should keep an eye on the Democratic ticket. Joe Biden will turn 78 in November. He will be a one-term president if he wins, and his public appearances suggest that he’s slower on the draw than he used to be. He may rely on his second-in-command much more than the average president and she will immediately become the odds-on favorite for the 2024 nomination. If the Democrats gain control of the Senate alongside a Biden victory, as our Geopolitical Strategy service projects, financial markets may have to begin discounting a future with materially less friendly regulatory and tax policy. China Tensions Will Not Go Away Chart 4The Middle Kingdom Is Out Of Favor
Elections Have Consequences
Elections Have Consequences
Our geopolitical strategists have long flagged US-China tensions as the paramount geopolitical flashpoint. The only standalone nations with superpower potential are engaged in a long-term struggle for hegemony. The trade tensions that waxed and waned across all of 2019 were only one act of a longer-running play. Investors should not have been lulled into thinking the Phase 1 trade agreement would end the friction between the two countries. Politicians can be counted upon to give their constituents what they want, especially during election campaigns. China’s unpopularity with US voters has reached a new high in the wake of the pandemic (Chart 4), and candidates are likely to compete with one another to appear tougher on China. Between now and the election, there is a possibility that tensions could ramp up considerably. If the president finds his re-election prospects suffering from the COVID-19 outbreak and soaring unemployment, he may look to transform himself into a wartime president, boldly asserting American interests globally, and serially baiting an unpopular foe like China. Profit Margin Pressures Are Coming Except when interrupted by recessions, S&P 500 profit margins have climbed steadily higher since the early ‘90s (Chart 5). Several factors contributed to the increase in corporate profitability: the PC revolution, outsourcing, China’s entry into the WTO, the declining power of labor unions and, punctuating the rise in 2018, the 40% cut in the top marginal corporate tax rate (from 35% to 21%). If the Democrats take the White House and the Senate, we expect that corporate tax rates will swiftly rise. The top marginal rate may not go all the way back to 35%, but it has room to rise from its lowest level since before the US entered World War II (Chart 6), and any increase will represent a profit headwind. Re-configuring supply chains will reduce margins. Higher taxes will, too, if Democrats can take the White House and the Senate. Chart 5Corporate Profit Margins Are Vulnerable
Corporate Profit Margins Are Vulnerable
Corporate Profit Margins Are Vulnerable
Chart 6A Democratic Sweep Will Lead To Higher Taxes
A Democratic Sweep Will Lead To Higher Taxes
A Democratic Sweep Will Lead To Higher Taxes
Our Geopolitical Strategy service identified peak globalization as an important theme not long after it began publishing in 2012. The outbreak of the pandemic seems as if it will accelerate the retreat from globalization (Chart 7), and any reduction in outsourcing is likely to weigh on profit margins until automated inputs can supplant more expensive domestic labor. Onshoring is not the only factor likely to increase corporate costs after the pandemic, however. Companies are likely to seek to diversify their supply chains so that they are not so reliant on a single country or supplier. Building up redundancies within supply chains will make those chains more stable, but it will also increase costs. Chart 7The Pandemic Is Accelerating The Trend Away From Globalization
The Pandemic Is Accelerating The Trend Away From Globalization
The Pandemic Is Accelerating The Trend Away From Globalization
A Biden victory is not the only source of election downside. If the president wins re-election, the odds of tariff conflicts with Europe will rise significantly. Unconstrained by having to contest another election, the administration could ratchet up the pressure on Europe, prompting certain retaliation from Brussels. Our strategists see a greater chance for trade peace, ex-China, if Biden captures the White House. Investment Implications The overriding questions on investors’ minds are why the stock market and the economy have parted company so decisively and how long they can continue to diverge. Our explanation turns on policy: the Fed has intervened mightily to hold down Treasury yields and keep financial markets functioning, while Congress has thrown open the federal coffers to keep laid-off workers and suddenly teetering businesses afloat. The social distancing measures imposed to slow the spread of COVID-19 caused economic activity to crater. Monetary and fiscal policy have been deployed to build a bridge over that crater, lest capital, people and businesses disappear into it like the Union troops at Petersburg. Ever since they began to rally in late March, financial markets have focused exclusively on the bridge. The Fed has the capacity and the will to install more monetary planks should the crater prove to be wider than initially estimated. Congress’ commitment is shakier, but the election will compel Republicans to provide more funding should it become necessary to prevent a dire outcome. The virus alone will dictate how long the bridge will have to be in place and investors can only guess at the virus' future course. Given the stock market’s pattern of surging on positive preliminary data for potential treatments or vaccines and barely easing when those data are shown to hold far less promise, it appears that its expectations are skewed to the right-hand side of the distribution. There appears to be considerable room for disappointment on the public health front. The possibility that markets are giving short shrift to a robust second wave of infections, or overestimating the speed with which a vaccine can be developed and distributed, is not a reason to short equities or be underweight them in balanced portfolios, though. The rally has been too strong, and there is a subset of right-tail outcomes that could well come to pass. We continue to expect a correction, and are carrying excess cash to prepare for it, but we are maintaining a neutral tactical outlook in the event of a positive surprise. We are optimistic about equities’ prospects over a twelve-month timeframe. Our rationale is that easy monetary policy and generous fiscal spending will outlive the social distancing measures they were prescribed to treat. Low interest rates, ample liquidity and pumped-up aggregate demand form a highly supportive backdrop for equities and should help them handily outperform bonds. The difference between our outlook and the equity market’s may simply be a matter of timing; the resurgent S&P 500 seems to be skipping ahead to the twelve-month conclusion and looking through the uncertainties that will arise along the way. The bears face daunting odds if Congress approves a meaningful fifth phase of fiscal stimulus: every trillion dollars extends the dark US bar in Chart 1 by another five percentage points. TIPS will eventually be the asset of choice when the debt has to be repaid but, in the meantime, equities have undeniable appeal. Doug Peta, CFA Chief US Investment Strategist dougp@bcaresearch.com Footnotes 1 According to a new working paper, the median unemployed worker is eligible for benefit payments equivalent to 134% of his/her pre-layoff compensation. https://www.nber.org/papers/w27216 Accessed May 26, 2020. 2 Nevada, home to the Magic Kingdom for adults, has the nation’s highest unemployment rate (28.2%). 3 Most state constitutions mandate balanced budgets. In the absence of federal aid, local school, fire, police and public hospital payrolls will have to be pared in response to declining sales and income tax revenues. 4 Massachusetts’ Republican governor would get to appoint her replacement until a special election could be held.
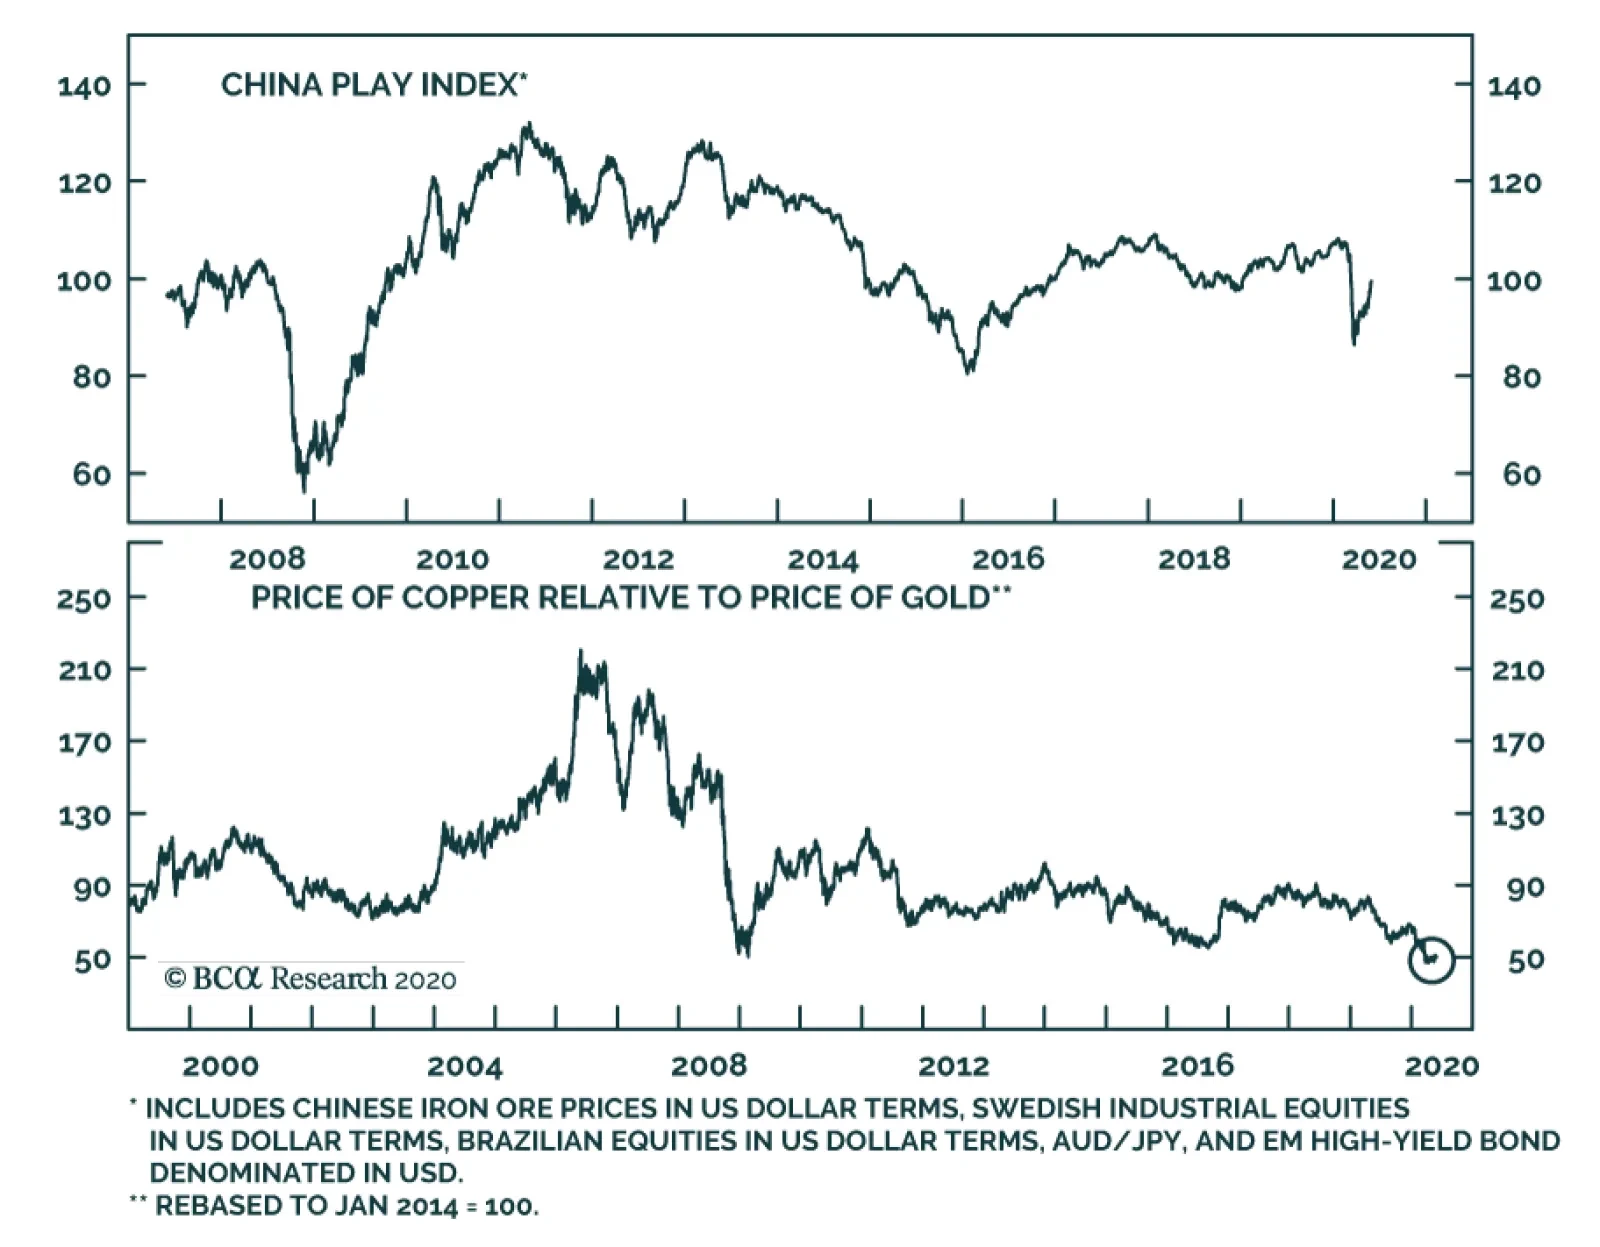
BCA Research's Geopolitical Strategy team analyzed some near-term geopolitical risks to the rally. They recommend a tactically defensive stance. The rally faces significant near-term risks because of the potential for tumultuous political and geopolitical…