Geopolitics

While the trade-war cease-fire agreed at the G20 summit between the U.S. and China boosted grain markets – particularly as China agreed to begin “substantial” purchases from the U.S. – the future of the trade relationship remains uncertain. The agreement to work out an agreement only holds for 90 days, and there’s a lot to get through. An increase in Chinese purchases of U.S. ag products could realign prices for the grains traded on the Chicago Mercantile Exchange with their global counterparts, by reversing the inefficiencies created by the 25% tariffs announced last summer, particularly re soybean trade flows. However, until concrete steps are announced, this remains nothing more than a hope at present. Then there’s the USD. We expect a stronger dollar in 1H19 to continue to weigh on ag markets, by keeping U.S. exports relatively expensive versus foreign competition. We continue to believe the market underestimates the number of rate hikes the Fed will deliver next year – our House view calling for four policy-rate increases next year is higher than the market consensus – and that positive news on the trade front will be offset by relatively tighter financial conditions in the U.S. Highlights Energy: Overweight. We continue to expect OPEC 2.0 to agree cuts of 1.0mm to 1.4mm b/d at its meeting in Vienna today and tomorrow. Our $82/bbl Brent forecast for 2019 remains in place. Base Metals: Neutral. Zinc treatment charges in Asia hit a three-year high of $170 to $190/MT in November, a one-month gain of $50/MT. Chinese smelters are keeping capacity offline in the wake of lower prices for the metal and holding out for higher treatment charges, according to Metal Bulletin. Precious Metals: Neutral. Gold’s rally to $1,240/oz is consistent with a more dovish read on Fed policy. Nonetheless, we continue to expect a December rate hike, and four more next year. Ags/Softs: Underweight. Grain markets are hopeful for a reprieve following the G20 rapprochement between presidents Trump and Xi. However, a strong USD remains a headwind for U.S. exports. Feature Throughout 2018, ag markets have been in the cross-hairs of Sino – U.S. geopolitical warfare. President Trump’s meeting with his Chinese counterpart Xi Jinping at last week’s G20 summit in Buenos Aires is nothing more than an agreement to begin negotiations. Nevertheless, ags – particularly grains – are poised to benefit from a “substantial” increase in Chinese purchases “immediately.” Although uncertainty regarding the U.S. – China trade relationship will drag on into 2019, we are likely to see at least a thaw in ag markets. Apart from trade, U.S. financial conditions will continue to impact ags. More Fed rate hikes than are currently priced in by markets, which will keep the U.S. dollar well bid relative to the currencies of other ag exporters, will weigh on these markets. Weather will remain a wildcard. The World Meteorological Organization (WMO) assigns an 80% probability to an El Niño event occurring this winter, which, in the past, has led to higher volatility in ag markets due to flooding and droughts. Overall we would not be surprised to see some upside in the short term as Chinese consumers resume purchases of American crops. However, this will be muted when markets begin reassessing Fed policy expectations, and pricing in more hikes than the two currently anticipated over the next 12 months. American Farmers Breathe A Sigh Of Relief … In our most recent assessment of ag markets, we argued that while trade policy had weighed on the ag complex, further downside in these markets was unlikely.1 So far, this narrative has played out. Soybeans, corn, and wheat prices fell 22%, 19%, and 11%, respectively between the end of May and mid-July (Chart of the Week). By Tuesday of this week, they had rebounded, gaining 12%, 13%, and 8%, respectively. Chart of the WeekBetter Days To Come?
Better Days To Come?
Better Days To Come?
Grain prices now are more in line with fundamentals. Moreover, the signing of the United States-Mexico-Canada Agreement (USMCA), which replaces NAFTA and eliminates uncertainty in agricultural trade within the North American market, was a market-positive development. The potential breakdown of North American trade was a significant risk to U.S. agriculture: Mexico is the second-largest destination for U.S agricultural exports, accounting for 13% of all U.S. exports of agricultural bulks (Chart 2). Canada makes up a smaller 2% share. Chart 2Trade Negotiations Hit American Farmers Hard
Reprieve For Grain Markets Following G20?
Reprieve For Grain Markets Following G20?
Away from the USMCA, the agreement to a trade truce between the U.S. and China at the G20 summit is a ray of hope. President Donald Trump agreed to postpone hiking rates from 10% to 25% on the second round of tariffs imposed by the U.S. on Chinese imports until March 1, in exchange for a promise by President Xi Jinping to pursue structural changes to its economy, and that China will raise its imports from the U.S. – specifically of agricultural goods. While the current truce could be an opening salvo to a more favorable trade relationship, BCA Research’s geopolitical strategists warn that this development is inconsistent with their structurally bearish view of the U.S. – China relationship. Given the obstacles still in place, they are skeptical that the truce will endure.2 While China did agree to buy “substantial” agricultural products from U.S. farmers immediately, it is still unclear whether China will remove the tariffs on imports of American grains as part of the truce.3 For now, China’s 25% tariff on its imports of U.S. soybeans, corn, and wheat is still in place. Apart from state-owned enterprises acting in response to government orders to purchase U.S. ags, Chinese traders are unlikely to fulfill this promise on their own unless the tariffs are removed. In any case, there are high odds that this will happen – in order to make room for Chinese traders to purchase the grains, as well as to show of good faith in negotiations with the U.S. … Thank You President T The current global ag landscape mirrors the disputes shadowing the world’s two largest economies. The trade rift – highlighted by the 25% tariff on China’s imports of U.S. grains and other ags – has created two parallel agriculture markets. In one market, China is scrambling to secure supplies, creating a deficit. In the other, U.S. farmers are struggling to market their produce overseas, suffering from storage shortages and in some cases left with no option but to leave their crops to rot. This dichotomy is evident in physical markets. Take soybeans, an especially vulnerable crop, given that almost 60% of U.S. exports have traditionally been consumed in China. While Brazil is facing a shortage amid insatiable Chinese demand, a record 11% of American beans are projected to be left over after accounting for exports and domestic consumption (Chart 3). This comes at a bad time as the global trend over the past few years has been an increase in land devoted to soybeans at the expense of corn. Further evidence of the impact of the tariffs are as follows: Chart 3A Soybean Glut In The U.S., Tight Supplies In Brazil
A Soybean Glut In The U.S., Tight Supplies In Brazil
A Soybean Glut In The U.S., Tight Supplies In Brazil
China’s total soybean imports technically do not qualify as having collapsed. However, the 0.5% y/y decline in volumes so far this year is in stark contrast with the average 10% y/y growth over the past four years (Chart 4). Chart 4China Has Been Shunning American Beans
Reprieve For Grain Markets Following G20?
Reprieve For Grain Markets Following G20?
Chinese consumers are clearly avoiding beans sourced in the U.S. China’s soybean imports from America over the September-to-August 2017/18 crop year are significantly lower than last year’s volumes. There is clear seasonality in China’s sourcing of soybeans, with the U.S. crop gaining a larger share in the fall and winter (Chart 5). Nevertheless, this year is a clear outlier. Previously, in October, ~ 20% of China’s soybean imports were generally from the U.S. This year, the share stands at a mere 1%. Instead, China has been relying on Brazilian-sourced beans. Chart 5Unusual Trade Flows For This Time Of Year
Reprieve For Grain Markets Following G20?
Reprieve For Grain Markets Following G20?
These factors are creating strong demand for beans from Brazil, where crushers are reportedly suffering from a lack of soybean supply and tight margins. The premium paid for Brazilian beans over CBOT prices reached a record high in September (Chart 6). Chart 6Record Premiums For Brazilian Beans In 2018
Record Premiums For Brazilian Beans In 2018
Record Premiums For Brazilian Beans In 2018
While Brazilian farmers are benefiting from the U.S. – China standoff, American farmers are suffering significant losses. U.S. soybean exports to the world are severely behind schedule for this time of the year. This is a clear consequence of weak demand from China, which has completely died down (Chart 7). Even though American farmers are searching for alternative destinations to replace China – and despite exports to countries other than China being double last year’s levels for this time of the year – they are not yet sufficient to compensate for the loss of sales there. Chart 7The Rest Of The World Does Not Compensate For Chinese Bean Purchases
Reprieve For Grain Markets Following G20?
Reprieve For Grain Markets Following G20?
A normalization of agricultural trade between China and the U.S. – if it were to emerge as a consequence of the trade truce – would go a long way toward reversing these trends. However, exogenous factors likely will keep soybean prices, in particular, under pressure: Chinese demand for soybeans – which it uses as feed for its massive pig herds – will likely take a hit due to an outbreak of African Swine Flu. Soybean inventories in China have grown significantly (Chart 8). This is a sign that buyers there had been frontloading imports in anticipation of weaker imports from the U.S. over the winter period, when Brazilian supply dies down. Chart 8Chinese Buyers Well Stocked Ahead Of The Winter
Chinese Buyers Well Stocked Ahead Of The Winter
Chinese Buyers Well Stocked Ahead Of The Winter
In addition, Brazilian farmers have raised their soybean plantings for next year. According to latest USDA estimates, Brazilian production in the 2018/19 will come in at 120.5mm MT, up from 119.8mm MT and 114.6mm MT in the previous two years, respectively. Similarly, exports from Brazil are projected to stand at 77mm MT, up from 76.2 and 63.1mm MT, in the previous two years, respectively. In its November World Agriculture Supply and Demand Estimates – published prior to the trade truce – the USDA projected U.S. exports will come down sharply from 59.0mm MT and 58.0mm MT in 2016/17 and 2017/18, respectively, to 51.7mm MT in the 2018/19. As a result, global ending stocks will swell to a record 112.1mm MT in the next crop year. Thus, even if there is a swift resolution to the trade war, soybean supplies will remain abundant, keeping a lid on prices. Even so, a resolution to the trade war likely would return the spread between Brazilian and American bean prices to their historical mean. In fact, globally the soybean market is projected to remain in a surplus again next year – the volume of which represents 4% of total production (Chart 9). As such, inventories measured in terms of stocks-to-use, are projected to continue rising, setting a new record surpassing 30% (Chart 10). Given that soybean supply is in abundance globally, a resolution in the trade war likely will not be accompanied by a significant rebound in soybean prices. Chart 9Another Global Surplus In Beans...
Another Global Surplus In Beans...
Another Global Surplus In Beans...
Chart 10... Will Push Inventories To New Record High
... Will Push Inventories To New Record High
... Will Push Inventories To New Record High
On the other hand, corn and wheat, which are less susceptible to trade disputes with China, are expected to be in deficit next year which will bring down their inventories. However, since global stocks levels are already so elevated, we don’t expect much upside on the back of these deficits. Bottom Line: It is too early to call an end to Sino - U.S. trade tensions just yet. However, an increase in Chinese purchases of U.S. ags will go a long way in reversing the inefficiencies created by the 25% tariffs announced last summer. This will move ags traded on the Chicago Mercantile Exchange more in line with their global counterparts. The Other Factors Driving Ags In addition to the trade war, which has created winners and losers out of Brazilian and American farmers, respectively, currency markets are also more favorable for the former compared with the latter. As such, U.S. financial conditions will remain an important determinant of ag prices. The Fed’s monetary policy decisions impact ags both directly – through changes in real rates – as well as indirectly, through the U.S. dollar. We expect the Fed will make decisions consistent with its mandate to contain inflation. As such, there will likely be more interest rate hikes over the coming twelve months than the market’s current expectation of two. This will affect agricultural markets as follows: Higher real rates increase borrowing costs for farmers, discouraging investment, and research and development. Tighter credit can weigh on growth. This depresses consumption and demand for goods and services in general, and to some extent agricultural commodities as well. In addition to this direct channel of impact of Fed policy on the agricultural markets, U.S. monetary policy decisions vis-à-vis the rest of the world will drive ags through its impact on the U.S. dollar. Moreover, weak global growth in 1H19 will keep a floor under the dollar. When global growth lags U.S. growth, it is usually associated with a strong dollar. These factors suggest upside potential for the dollar over the coming 6 months. This will continue as long as U.S. growth outperforms the rest of the world. Since farmers’ costs are priced in local currencies while commodities – and thus sales -- are priced in U.S. dollars, a stronger dollar vis-à-vis domestic currency raises revenues of non-U.S. farmers. This incentivizes plantings, raising supply, and in turn weighing down on prices (Chart 11). This explains the inverse relationship observed between the U.S. dollar and agricultural prices (Chart 12). Chart 11A Strong Dollar Will Incentivize Planting...
A Strong Dollar Will Incentivize Planting...
A Strong Dollar Will Incentivize Planting...
Chart 12...And Weigh Down On Prices
...And Weigh Down On Prices
...And Weigh Down On Prices
As always, weather is the wildcard in agricultural markets and can destroy and damage crops. The Australian Bureau of Agricultural and Resource Economics and Sciences (ABARES) recently lowered its wheat production forecast by 11% on the back of a drought. This will be the smallest crop in a decade. The El Niño event expected this winter will likely prolong the drought into early next year. Thus the risk of an El Niño event is especially relevant. This weather phenomenon occurs when there is an increase in sea surface temperatures in the central tropical Pacific Ocean which increases the chances of heavy rainfall and flooding in South America and drought in Africa and Asia. According to the World Meteorological Organization, there’s a 75-80% chance of a weak El Niño forming this winter. This raises the possibility of damage or destruction to crops, which could bid up agricultural prices. Bottom Line: A stronger dollar, at least into 1H19, will weigh on ags. Thus, ag markets will be hit with headwinds as the market begins to appreciate the possibility of a greater number of rate hikes than is currently priced in. This will mute the impact of positive news on the trade front. Roukaya Ibrahim, Editor/Strategist Commodity & Energy Strategy RoukayaI@bcaresearch.com Footnotes 1 Please see BCA Research’s Commodity & Energy Strategy Weekly Report titled “Policy Uncertainty Could Trump Ag Fundamentals,” dated July 26, 2018, available at ces.bcaresearch.com. 2 Please see BCA Research’s Geopolitical Strategy Weekly Report titled “Trade Truce: Narrative Vs. Structural Shift?” dated December 3, 2018, available at gps.bcaresearch.com. 3 The USDA has not changed its plan to provide the second round of its aid package to farmers in attempt to offset losses from the trade war. Investment Views and Themes Recommendations Strategic Recommendations Commodity Prices and Plays Reference Table TRADES CLOSED IN 2018
Reprieve For Grain Markets Following G20?
Reprieve For Grain Markets Following G20?
Trades Closed in Summary of Trades Closed in 2017
Reprieve For Grain Markets Following G20?
Reprieve For Grain Markets Following G20?
Highlights The Reserve Bank of Australia (RBA) may consider a rate hike in 2019 if additional tightening of labor markets leads to higher wage inflation, which would help lift core inflation back to the midpoint of the RBA’s 2-3% target band. Reflation in China could also embolden the RBA to tighten monetary policy – though the odds of a more aggressive stimulus package will decline as long as China’s overall economy remains stable and the U.S. maintains its tariff ceasefire. The Labor Party is favored to win the federal election, which is most likely to occur in May. This is a low-conviction view, as polls are tight and economic improvement will help the ruling Liberal-National Coalition. Feature 2018 has been a challenging year for global financial markets, as investors have had to deal with greater economic uncertainty, less dovish central banks and more volatile asset prices. One country that has bucked the trend to some degree is Australia. The nation has famously avoided a recession since 1991 and last saw a tightening of monetary policy in 2010. While the recession streak is unlikely to be broken in 2019, there are growing risks that the era of interest rate tranquility will soon end. In this Special Report, jointly published with our colleagues at BCA Geopolitical Strategy, we update our views on Australia for 2019 – a year when the investment backdrop has the potential to become far more interesting, and volatile, due to election year uncertainty and a potential shift to a more hawkish bias for monetary policy. The Bond Outlook: What To Watch To Turn Bearish BCA Global Fixed Income Strategy has maintained an overweight stance on Australian government bonds since the end of 2017. That high-conviction view stemmed from our expectation that the Reserve Bank of Australia (RBA) would keep policy rates on hold for longer due to sluggish economic growth and underwhelming inflation. This recommendation has performed well, with Australian government bonds returning 2.4% (currency-hedged into U.S. dollars) in 2018 year-to-date, beating the Bloomberg Barclays Global Treasury index by 190bps. The benchmark 10-year Australian government is now yielding 36bps below the equivalent 10-year U.S. Treasury yield, the tightest spread since 1980 (Chart 1). Chart 1Australian Bonds Have Outperformed
Australian Bonds Have Outperformed
Australian Bonds Have Outperformed
Looking ahead, we still have a positive opinion on Australian debt relative to its global peers over the next six months. The RBA is unlikely to make any adjustments to the Cash Rate - which remains at a highly-accommodative level of 1.5% - without seeing some signs of accelerating inflation in both the Q4 2018 and Q1 2019 CPI reports. This is especially true given the political uncertainty with another federal election due by May 18,1 which could change the outlook for fiscal policy (as we discuss later in this report) and impact the RBA’s economic projections. In our view, the RBA will only be able to seriously consider an interest rate hike, warranting a downgrade of our recommended overweight stance, if all three of the following conditions occur: Australia’s underemployment rate falls below 8% China’s economy shows convincing evidence of reacceleration, especially in commodity-intensive industries like construction Core CPI inflation rises back to at least the midpoint of the RBA’s 2-3% target band We will now discuss each of these in turn. Underemployment Australia is a fairly open economy with a large export sector, but consumer spending is still the largest share of GDP (60%) so it matters most for growth. On that front, real consumption has grown in a narrow and uninspiring range between 2-3% over the past five years. Anemic wages and disposable incomes have been the problem, with the growth of both (in nominal terms) struggling to grow faster than low realized inflation, which now sits below the RBA’s inflation target range of 2-3% (Chart 2). Households have been forced to deploy a greater share of that modest income growth just to maintain spending, with the savings rate plunging from 8% at the end of 2014 to 1% this year and consumer debt piling up. Chart 2An Income-Fueled Pickup In Consumer Spending
An Income-Fueled Pickup In Consumer Spending
An Income-Fueled Pickup In Consumer Spending
The dynamics may be changing in a more positive direction, however. Growth rates of nominal wage (+2.3%) and disposable income (+3.1%) have accelerated this year to a pace faster than inflation. With real incomes perking up, the year-over-year growth rate of real consumer spending growth accelerated to 3% in Q3/2018, driving real GDP growth to similar levels. A sustained pickup in wage growth is necessary before the RBA would even contemplate a rate hike. For that to occur, there must be decisive evidence of a tightening Australian labor market and increased resource utilization. While the headline unemployment rate of 5.0% is below the OECD’s estimate of the full employment NAIRU for Australia (5.3%), broader measures of labor market slack are still at elevated levels. Specifically, the “underemployment” rate, which includes workers who are working fewer hours than they would like or at jobs below their skill levels, is still at an elevated 8.3% (Chart 3). That is down from the peak of just below 9% seen in early 2017, but well above the 2012 trough near 7% (when wage growth was close to 4%). Chart 3UNDERemployment Rate Matters More For Australian Wages
UNDERemployment Rate Matters More For Australian Wages
UNDERemployment Rate Matters More For Australian Wages
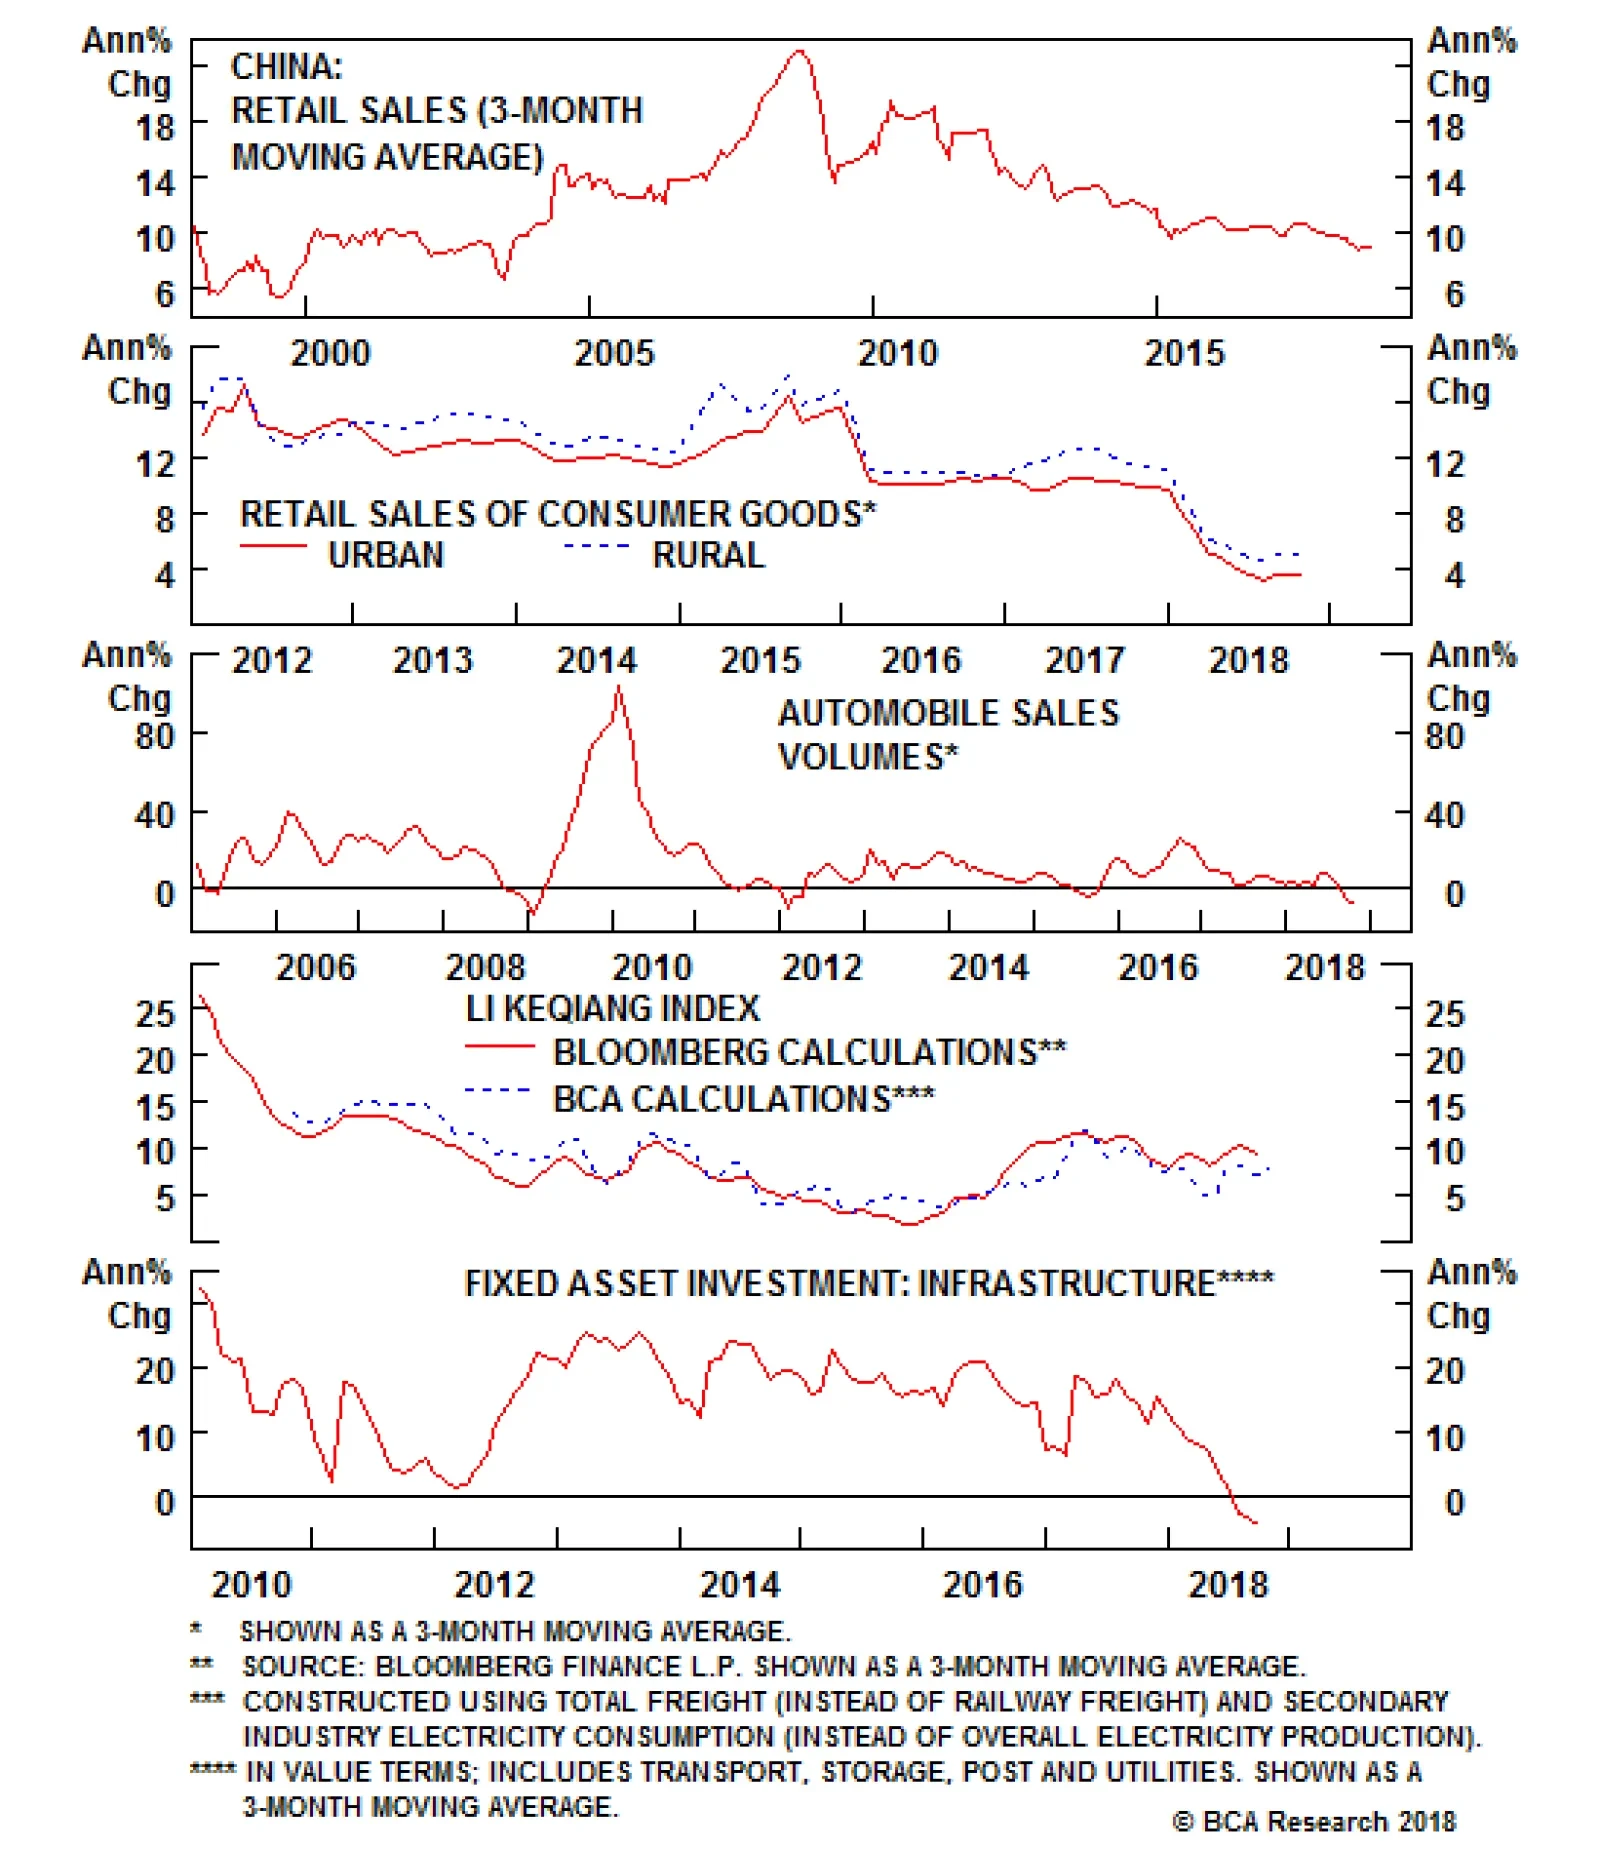
Australian wage growth tends to correlate more with the underemployment rate than the traditional unemployment rate (middle panel). This suggests that the recent blip higher in wage growth could be the beginning of a new trend, given that it has occurred alongside the recent drop in underemployment. Already, underemployment is back below the levels that prevailed when the RBA did its last interest rate cut back in 2016 (bottom panel). A further dip lower in the underemployment rate to below the 8% threshold would likely confirm that wage growth has more upside. That outcome would give the RBA greater confidence that consumer spending will gain more strength even with a low savings rate, and that CPI inflation will return back into the target range – both outcomes that would justify some removal of the RBA’s highly stimulative monetary accommodation. China Stimulus The main connection from China’s economy to Australia is through Chinese demand for Australian exports. There is also an indirect, but very important, link between Chinese demand boosting industrial commodity prices. The latter boosts Australian growth through positive terms-of-trade effects and increased capital spending in commodity-related sectors like mining. Iron ore is the most important of those commodities, representing 18% of total Australian goods exports, with 85% of those iron ore exports going to China. Australian export growth has decelerated during 2018 from the very robust 15% year-over-year pace to a still solid 10% rate. This has mirrored the trends seen in many other economies, where exports have slowed alongside diminished demand from China. If Chinese authorities change their current policy trajectory, and embrace more aggressive fiscal and credit stimulus, then they will reaccelerate the country’s flagging demand, which should benefit Australian exporters. If the increase in spending occurs in commodity-intensive parts of China’s economy, like construction, then Australia can also benefit from a terms-of-trade impact if commodity prices rise. However, BCA’s Geopolitical Strategy and China Investment Strategy remain skeptical that China will launch a major economic stimulus package along the lines of what occurred in 2015-16. That surge not only boosted Chinese GDP and import demand but also triggered a boost to global industrial commodity prices that benefitted many commodity exporters, including Australia. In recent months, there has been a pickup in overall Chinese import growth, as well as some acceleration of higher frequency growth indicators like the Li Keqiang index (Chart 4). Australian exports to China have not picked up though, and Chinese iron ore imports are contracting. Part of that is due to the elevated levels of Chinese iron ore inventories. More likely, there is little demand for additional iron ore given China’s reform agenda and the struggles of its construction sector (which accounts for roughly 35% of Chinese steel demand). Chart 4China Stimulus Not Helping Australia...Yet?
China Stimulus Not Helping Australia...Yet?
China Stimulus Not Helping Australia...Yet?
Our colleagues at BCA China Investment Strategy2 have noted that both weakening sales and tighter funding sources for real estate developers point to declining growth in property starts and construction. This will be negative for construction-related commodity markets and construction-related machinery. This is coming at a time when the Chinese government is trying specifically to address over-indebted industries like construction. As for the U.S.-China trade truce, a permanent de-escalation of tensions – which has not yet occurred – could provide a boost to Australian export demand, as with other export-focused countries. But the negative impact of bilateral U.S.-China tariffs on the global economy is much smaller than that of China’s attempt to limit indebtedness. Moreover, a trade truce will remove China’s primary incentive to adopt more aggressive stimulus. Nevertheless, from the RBA’s perspective, any boost to China’s construction-related activity would have a big impact on Australia’s economy and would strengthen the case for a rate hike in 2019. Core Inflation Australia’s headline CPI inflation has struggled to hit even the bottom end of the RBA’s 2-3% target band since 2015, reaching only 1.9% in Q3 of this year (Chart 5). The story is even worse for inflation excluding food and energy, with core CPI inflation now only at 1.2% after having drifted lower in two consecutive quarters. Both market-based and survey-based measures of inflation expectations are also hovering near 2%. Chart 5Australian Inflation Well Below RBA Target
Australian Inflation Well Below RBA Target
Australian Inflation Well Below RBA Target
When breaking down the CPI into tradeables (i.e. more globally-focused) and non-tradeables (i.e. more domestically-focused), the two types of inflation have not been accelerating at the same time since the 2009-11 period. Since then, faster tradeables inflation has occurred alongside slowing non-tradeables inflation, and vice versa. While volatility on the tradeables side should be expected given the correlation to swings in commodity prices and the Australian dollar, the weakness in non-tradeables is more directly related to the spare capacity in the domestic economy. Therefore, if wage growth continues to pick up as the labor market tightens, then non-tradeables inflation should follow suit and boost Australian CPI inflation back towards the RBA target range. The implication for the RBA is that a move in core CPI inflation back towards 2.5% (the midpoint of the RBA band), occurring after an acceleration in wage growth as described above, would give the central bank confidence that a higher Cash Rate is required. Bottom Line: The RBA has kept interest rates on hold for over two years, but may consider a rate hike in 2019 if additional tightening of labor markets leads to higher wage inflation, which would help lift core inflation back to the midpoint of the RBA’s 2-3% target band. A more aggressive fiscal and monetary stimulus package in China, while not our base case, would also embolden the RBA to tighten monetary policy. Risks From Australian Banks? Throughout 2018, the Australian financial industry has had to endure the slings and arrows of a government inquiry into its questionable business practices and misconduct. Revelations of bribery, fraud, the charging of fees for no service and from the accounts of deceased people, as well as board-level deception of regulators, have roiled Australia's financial sector since the explosive inquiry began in February. The final report of the Australian Financial Services Royal Commission will be published in February, but the impact is already being felt throughout the industry. Bank CEOs have been publically shamed, while other senior financial sector executives have been forced from their jobs. The chairman of National Australia Bank stated before the inquiry that customers’ trust in lenders had been “pretty well eroded to zero”, and that it could take as long as a decade to successfully overhaul the culture within the banks. The biggest impacts from the Commission will come through hits to banks’ earnings and funding costs, as well as the potential impact on lending standards for new loans. Australian banks will be less profitable because of fines, customer refunds, setting aside provisions for potential misconduct penalties and the government wanting increased competition. If banks also choose to be more conservative with the marking of loans, then higher loan-loss provisions could be an additional drag on bank earnings. Already, Australian bank stocks have severely underperformed the overall domestic market, and there has been some slowing of domestic credit growth (Chart 6). There are also signs of bank funding stresses from contracting bank deposit growth (second panel) and wider offshore funding costs like relatively elevated LIBOR-OIS spreads (bottom panel). Considering how heavily Australian banks rely on offshore funding, any squeeze in those markets could severely influence the availability of credit within the Australian economy. Chart 6Australian Banks Under Some Stress...
Australian Banks Under Some Stress...
Australian Banks Under Some Stress...
Looking ahead, if banks do tighten up their lending standards in response to the criticism and findings of the Commission, that will be from a starting point of very accommodative levels. In other words, getting a loan will likely still be “easy”, rather than “incredibly easy”. The reason is that Australian bank balance sheets remain in excellent condition. Credit crunches begin when banks are undercapitalized and are forced to retrench new loan activity as losses on existing loans pile up. That is not the case in Australia, where the major banks have Tier 1 capital ratios in the 10-12% range and non-performing loans are a tiny share of total lending. In our view, a true credit crunch would likely only occur after the Australian housing bubble bursts and the economy enters a severe downturn. That outcome would most likely be triggered by monetary policy tightening via multiple RBA rate hikes. Importantly, some of the steam has already been taken out of Australian house prices thanks to changes in regulations on new lending (Chart 7), potentially reducing some of the immediate risks to growth from a sharp plunge in home values. Chart 7...But No Credit Crunch Expected
...But No Credit Crunch Expected
...But No Credit Crunch Expected
Bottom Line: In 2019, the Australian government and its key financial regulators will have to work together to enforce responsible lending without triggering a catastrophic property market unwind. RBA policymakers are less likely to hike rates given their desire to maintain financial stability in the aftermath of the Commission – or at least until the inflation story forces their hand, as outlined in this report. The Federal Election: Polling Slightly Favors Labor Scandals in the financial sector are of utmost importance to the other major factor that could make 2019 a year of significant change in Australia: the federal election that looms most likely in the spring. Parliament is balanced on a knife’s edge, with the Australian Liberal Party’s loss of former Prime Minister Malcolm Turnbull’s parliamentary seat in a Sydney by-election on October 20. The ruling Liberal-National Coalition no longer has a majority and must rely on independent MPs to survive any no-confidence vote. This precarious situation suggests that the election could come even sooner than May and that the slightest twist in the campaign could deliver at least a small majority to either of the top two parties. Indeed, at this early stage, a high-conviction view on the election outcome is not warranted. After all, the 2016 election was decided in the Coalition’s favor only after a shift in opinion in the final month! Chart 8Labor Party Narrowly Leads All-Party Opinion Polls
A Year Of Change In Australia?
A Year Of Change In Australia?
Nevertheless, with all due caveats, our baseline case is for a Labor majority in 2019, however slim it may be.3 Labor is slightly ahead of the Coalition in the primary opinion polling, which includes all parties (Chart 8). In two-party preference polling, Labor has gradually widened its general lead since the July 2016 election and now holds a 10% advantage in the federal polls – albeit only a 6% lead when a moving average is taken (Chart 9). Labor is also winning or tied in every major state. Chart 9Labor Has Large Lead In Two-Party Preference Polls
A Year Of Change In Australia?
A Year Of Change In Australia?
The dramatic shift in polling since August is significant because that is when the knives came out and the Coalition ousted Turnbull in favor of the current Prime Minister Scott Morrison. The purpose of this move was to give the party a facelift ahead of the election. It is true that public opinion views Morrison as the preferred prime minister to Labor’s Bill Shorten. Shorten has a negative net approval rating and has never been viewed as an inspiring politician, while Morrison is just barely net positive. This perception works against Labor’s lead in the party polling – which is very competitive anyway – and suggests the election will be close. Critically, the Liberal-National Coalition’s polling as a whole has not benefited from the change in leadership. And in fact the data does not support the two major Australian parties’ abiding belief that a leadership coup will boost their popularity: Australia has seen four of these coups since 2010, two from Labor and two from the Coalition, and the party in question lost an average of 8% of the popular vote and 14 seats in parliament in the succeeding election (Table 1). Table 1Intra-Party Coups Don’t Win Votes
A Year Of Change In Australia?
A Year Of Change In Australia?
Turnbull’s ouster also calls attention to another detrimental factor for the Coalition: the challenge on the right flank from minor and anti-establishment parties. Pauline Hanson’s One Nation has a relatively low support rate both historically and in today’s race, currently at 8%, but anti-establishment feeling may have forced the Coalition into an error. Judging by the party’s weak polling since August, the negative response to Turnbull’s ouster has been more detrimental than the nomination of Morrison, an immigration hardliner and social conservative, has been beneficial. Meanwhile, Labor’s momentum has been corroborated by a string of surprise victories in by-elections and a sweeping win in the Victoria state elections on November 24. In the latter case, the party not only defended its hold on government, as one might expect in this progressive state, but exceeded expectations to win 56 seats out of 88 in the lower House, while the Coalition lost nearly half of its seats, falling from 37 to 21. Still, Labor’s lead is by no means decisive. In the average of the various primary polls its edge over the Coalition is within the margin of error. Moreover, the Coalition holds more “safe” (uncompetitive) seats than Labor.4 The bottom line is that a small swing in either party’s favor can produce a thin majority. The Coalition’s best case is the economy. But as concerns about unemployment and job creation recede, voters will make other demands. The top issues in recent polling are the cost of living, health care, housing affordability, and wages. Some polls also emphasize social mobility and climate change and renewable energy. Will Shorten’s Labor Party be able to capture the median voter? It is highly significant that the party has taken a rightward turn on immigration and taxes even as it holds out a more left-wing agenda on health, education, regulation, and social benefits. Immigration has played a major role in Australian politics and Labor is currently positioned near the political center – in other words, if Morrison hardens his line to guard against populists, he risks over-hardening and moving away from the median voter (Chart 10). Shorten has proposed a large bipartisan task force to determine the proper limits to immigration and how to deal with congestion and infrastructure pressures. Shorten’s platform also calls attention to abuse of temporary visas by foreign workers. Chart 10Labor Is Not Too Soft On Immigration
A Year Of Change In Australia?
A Year Of Change In Australia?
On taxes, Shorten has attempted to separate small and big companies, again in a bid for the political center. When Prime Minister Morrison sought to establish his anti-tax credentials (Chart 11), Shorten met him halfway and proposed relief for middle class families and small and medium-sized enterprises. Yet he doubled down on higher taxes for multinational corporations and high-income earners. Chart 11Liberal-National Coalition Cutting Corporate Tax Rates
A Year Of Change In Australia?
A Year Of Change In Australia?
Critically, the latter redistributive stances are more in line with the median voter than the Liberal Party’s more conservative, supply-side, tax cut agenda. All of Australia’s parties, including the increasingly popular “minority parties,” have a more favorable attitude toward redistribution than the Coalition, which is the outlier (Chart 12). Indeed, the National Party is closer in line with the others than the Liberals, highlighting the divisions within the Coalition that have been jeopardizing votes. As for tax cuts on middle income earners and small businesses, Labor’s acceptance of them speaks to voter concerns about living costs, jobs, and wages. Chart 12The Coalition Is Out Of Synch On Taxes
A Year Of Change In Australia?
A Year Of Change In Australia?
Labor is also closer to the median voter on the aforementioned financial sector scandals. The Coalition stands to suffer because it has developed a reputation for being too cozy with the banks (Chart 13). This is one of the biggest perceived differences between the two major parties – in addition to the negative perception of intra-Coalition betrayal – and it is possibly one of the most salient issues in the election. This presents a serious danger for the Coalition. Chart 13Banks: The Coalition’s Ball And Chain
A Year Of Change In Australia?
A Year Of Change In Australia?
What would a Labor government bring? The market will be jittery about Shorten’s attempts to increase tax revenue, which threatens a non-negligible tightening of fiscal policy. Shorten wants to raise taxes on high income earners; remove or lower deductions and discounts (such as on capital gains); crack down on tax evasion; and tighten control over a range of tax practices specific to Australia (limiting “negative gearing” and cutting cash refunds for “franking credits”). He is also taking a tough position on banks and the energy sector. At the same time, it is clear from Labor’s proposals in 2016 (Chart 14) that there will be a hefty amount of new spending coming down the pike if a Labor government is formed – primarily on education, health, infrastructure and job training. The tax cuts that Shorten does support will go to those with a higher propensity to consume, as well as to SMEs that are responsible for job creation. Chart 14Labor’s Spending Plans Unlikely To Change Much
A Year Of Change In Australia?
A Year Of Change In Australia?
Ultimately, Australia’s recent history, taken in consideration with the global business cycle, does not suggest that the Labor Party is all that much more fiscally profligate than the Coalition – but the current budget balance does suggest that there is substantial room to increase deficits, which is convenient for a government that is predisposed to give voters more services (Chart 15). Hence fiscal easing is the path of least resistance - one that could make the RBA even more comfortable in raising interest rates if the conditions laid out earlier in this report come to pass. Chart 15Australia's Next Government Will Have Room To Spend!
Australia's Next Government Will Have Room To Spend!
Australia's Next Government Will Have Room To Spend!
Bottom Line: The Australian Labor Party is slightly favored to win the next Australian election. This is a low-conviction call given the tight competition in public opinion polling and other mixed indicators. Broadly speaking, Labor’s shift to the political center on immigration and some tax issues makes the party more electable relative to the Coalition; meanwhile its promise of more government services fits with voter demands. We do not accept the narrative that Shorten’s Labor Party will engage in substantial fiscal tightening. The path of least resistance is for tax cuts as well as revenue collection, and for greater government spending. On the other hand, if the Coalition capitalizes on the incumbent advantage and stays in power, larger tax cuts will be in store. Hence we expect Australia to see marginally larger-than-expected budget deficits and fiscal thrust as the one reliable takeaway of next year’s election. Fixed Income Investment Implications We continue to recommend an overweight stance on Australian government bonds in currency-hedged global bond portfolios. While we have laid out the conditions that would make us change that view in this report, it is still too soon to position for such a move. Our RBA Monitor, which measures the cyclical pressures on the central bank to change monetary policy settings, is modestly below the zero line (Chart 16). This indicates a need for easier policy, although the indicator is starting to rise driven by the inflation components in the Monitor (bottom panel). In terms of market pricing, there are only 15bps of rate hikes over the next year discounted in the Australian Overnight Index Swap (OIS) curve, so markets are exposed to any shift to a more hawkish bias by the RBA as 2019 progresses. Chart 16Our RBA Monitor Starting To Turn Less Dovish
Our RBA Monitor Starting To Turn Less Dovish
Our RBA Monitor Starting To Turn Less Dovish
Looking purely at Australian government bond yields, the forward curves are priced for very little change in yields over the next year (Chart 17). This suggests that outright duration trades in Australia look uninteresting from a carry perspective of betting against the forwards. We continue to prefer Australian bonds on a relative basis to global developed market peers until there is more decisive evidence pointing to convergence of Australian growth and inflation to the other major economies (bottom panel). Chart 17Stay Overweight Australian Government Bonds
Stay Overweight Australian Government Bonds
Stay Overweight Australian Government Bonds
Over the past year, Global Fixed Income Strategy has recommended tactical trades in Australian money market futures to fade the pricing of RBA hikes that we did not expect to materialize. Specifically, we entered a long position in December 2018 Australian 90-Day Bank Bill futures on October 17, 2017, then switched to a long October 2019 90-Day Bank Bill futures position on May 29, 2017. The latter contract is now trading at implied interest rate levels just above the RBA’s 1.5% Cash Rate (Chart 18), suggesting that there is no more value in this trade. Chart 18Taking Profits On Our Long Bank Bill Futures Trade
Taking Profits On Our Long Bank Bill Futures Trade
Taking Profits On Our Long Bank Bill Futures Trade
We therefore take a profit of 21bps on the Bank Bill futures trade, while awaiting evidence from the “RBA Hike Checklist” introduced in this report before considering trades that will benefit from a more hawkish central bank. Robert Robis, CFA, Senior Vice President Global Fixed Income Strategy rrobis@bcaresearch.com Matt Gertken, Vice President Geopolitical Strategy mattg@bcaresearch.com Ray Park, CFA, Research Analyst ray@bcaresearch.com Footnotes 1 Technically the House of Representatives election could occur as late as November 2, while the half Senate election is due May 18, but the norm is to hold the election simultaneously. The 2016 election was a “double dissolution” involving the election of the entire Senate and House of Representatives. 2 Please see BCA China Investment Strategy Special Report, “China’s Property Market: Where Will It Go From Here?” dated September 13, 2018, available at cis.bcareserach.com. 3 We would slightly favor Labor leading a slim majority in the Senate as well as in the House. In the Senate, the half of the seats that are up for grabs are evenly split and the polling at this early stage favors Labor over the Coalition. The poor performance of the Greens, in recent polling and in the Victoria state election, suggests a positive development for Labor on the margin, whereas One Nation, whose polls are improving, poses a threat to the Coalition. 4 Labor is fighting for 15 “marginal” (hotly contested) seats and 28 “fairly safe” seats, while the Coalition is only fighting for 12 marginal seats and 14 fairly safe seats.
There are five reasons our geopolitical strategists doubt the sustainability of the truce: Trade imbalance: It is highly unlikely that the trade imbalance between China and the U.S. can be substantively altered over the course of 90 days. The U.S. economy…
President Donald Trump and President Xi Jinping have agreed to freeze additional new tariffs on Chinese exports to the U.S. for three months. This means that as of January 1, 2019, U.S. tariffs on Chinese exports will remain at 10%, and will not jump to 25%.…
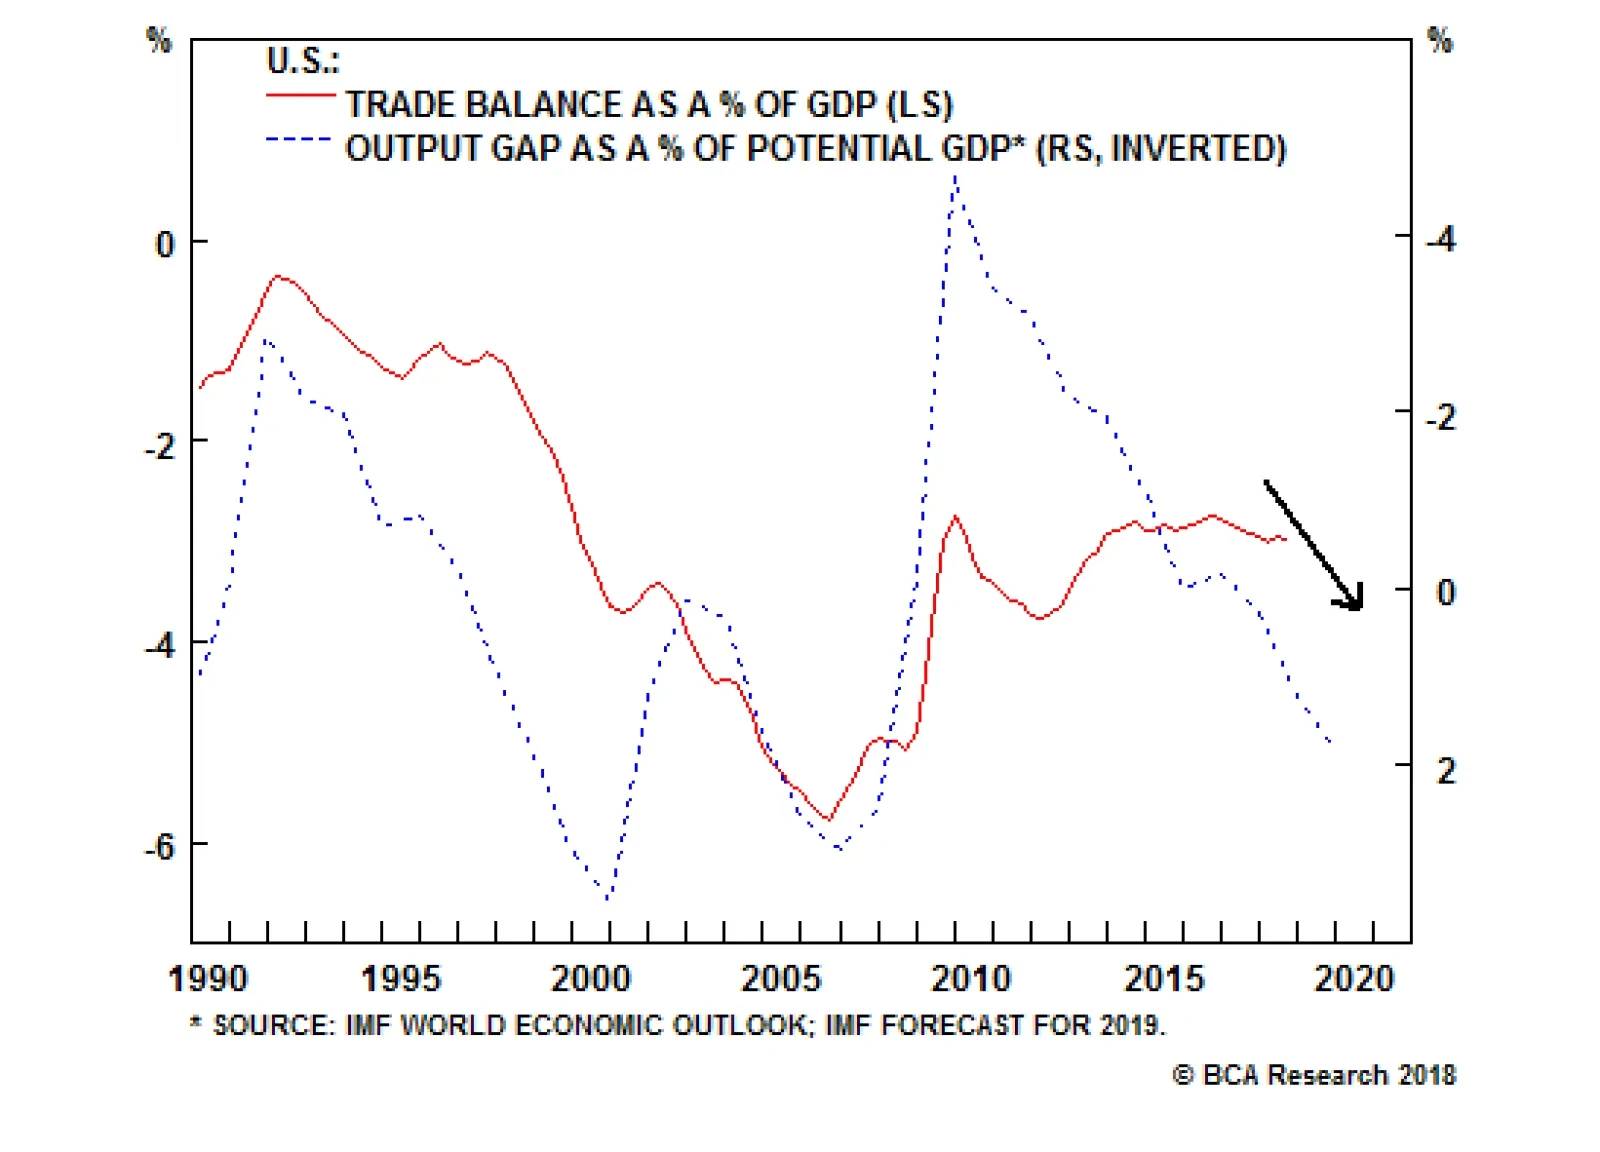
Highlights So What? The U.S.-China tariff ceasefire is a net positive, but a final deal is by no means assured. Why? In the near term there may be a play on global risk assets, but beyond that we remain cautious. Global divergence remains the key theme, and China now has less reason to stimulate. What to watch for a final deal: Trump’s approval rating, China’s structural concessions, and geopolitical tensions. We recommend booking gains on our long DM / short EM trades. Go long EM oil producers on OPEC 2.0 cuts. Feature U.S. President Donald Trump and Chinese President Xi Jinping have agreed to a trade truce at the G20 summit in Buenos Aires. The deal includes: Tariff Ceasefire: A 90-day ceasefire – until March 1 – on hiking the second-round tariffs from 10% to 25% on $200bn of Chinese imports. Substantive Talks: The talks will center on structural changes to the Chinese economy, including forced tech transfer, IP theft, hacking, and non-tariff barriers. Vice-Premier Liu He, Xi Jinping’s key economics and trade advisor, may visit Washington in mid-December. Imports: China has agreed to import more goods to lower the U.S. trade deficit, including agricultural and capital goods. This harkens back to the failed May 20 “beef and Boeings” deal. As with the previous deal, there are no deadlines or quantities promised. Not included in the two-and-a-half-hour dinner between Trump and Xi was a substantive discussion on geopolitical tensions. While Chinese statements following the summit did reaffirm Chinese commitment to the U.S.-North Korean diplomacy, there was no broader agreement on tensions, particularly in the South China Sea. The U.S. has recently demanded that China demilitarize the area. Should investors “play” the summit? Tactically, there is an opportunity to play global risk assets in the near term. Cyclically and structurally, however, both economic fundamentals and the underlying trajectory of U.S.-China relations call for caution over the course of 2019. Will The Truce Hold? There are five reasons to doubt the sustainability of the truce: Trade imbalance: It is highly unlikely that the trade imbalance between China and the U.S. can be substantively altered over the course of 90 days. The U.S. economy is in “rude health,” the USD is strong, unemployment is low and pushing up wages, and the output gap is closed. These are the macroeconomic conditions normally associated with an elevated trade imbalance (Chart 1). Chart 1Trade Deficit To Rise Despite Tariffs
Trade Deficit To Rise Despite Tariffs
Trade Deficit To Rise Despite Tariffs
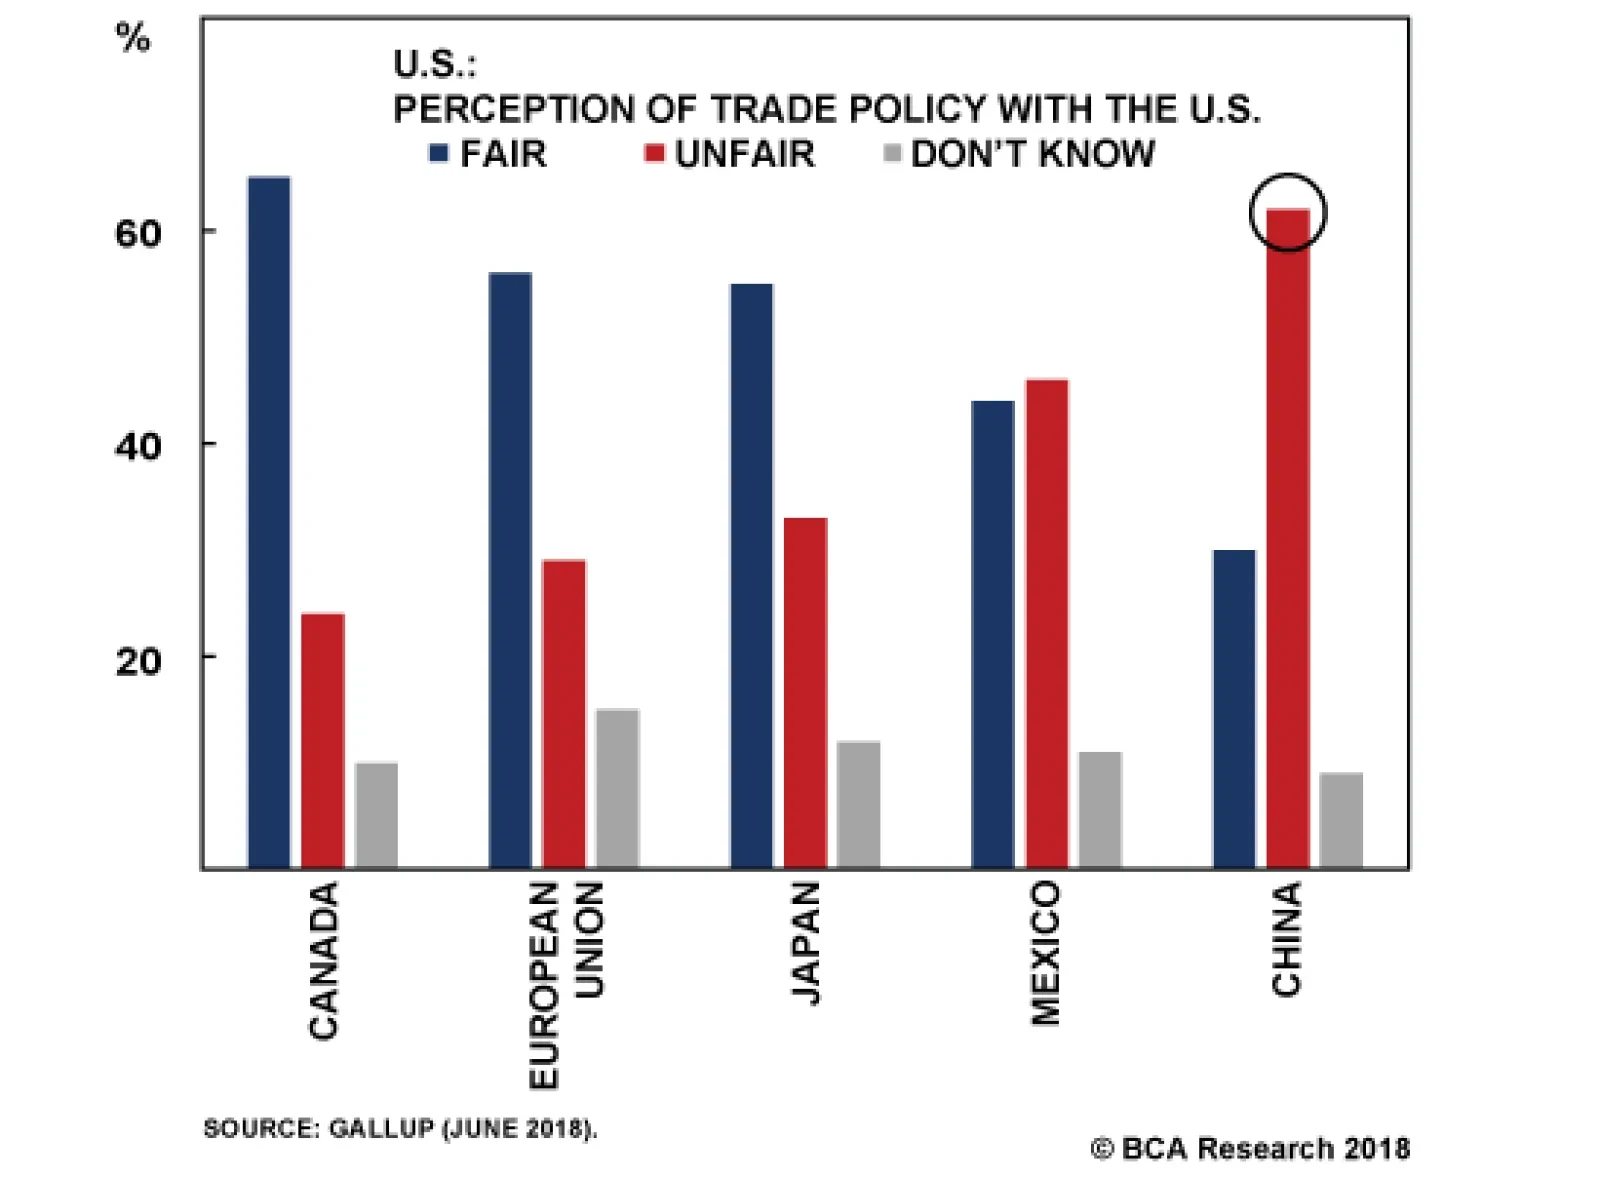
Domestic politics: The just-concluded midterm election saw no opposition to President Trump on trade. The Democratic Party candidates campaigned against the president on a range of issues throughout the election season, but not on the issue of his aggressive China policy. Polling from the summer also shows that a majority of American voters consider trade with China unfair, unlike trade with other countries (Chart 2). As such, President Trump will have to produce a convincing deal in order to ensure that his base, and many Democrats, support the deal. Chart 2Americans Are Focused On China As Unfair
Trade Truce: Narrative Vs. Structural Shift?
Trade Truce: Narrative Vs. Structural Shift?
Structural tensions: U.S. Trade Representative Robert Lighthizer issued a hawkish report ahead of the G20 summit concluding that China has not substantively changed any of the trade practices that initiated U.S. tariffs.1 The report was an update to the original investigation that launched the Section 301 tariffs against China. Lighthizer’s report therefore provides a road-map for what the U.S. will want to see over the course of 90 days. High-tech transfers: The Department of Commerce announced on November 19 a “Review of Controls for Certain Emerging Technologies.” This review will conclude on December 19 when the public comment period ends. In the report, the federal government lists biotech, AI, genetic computation, microprocessors, data analytics, quantum computing, logistics, 3D printing, robotics, hypersonic propulsion, advanced materials, and advanced surveillance as technologies with potential “dual-use” that may be critical to U.S. national security and thus might merit consideration for export control.2 As such, the U.S. may decide to impose export controls on technologies that China deems critical to accomplishing its “Made in China 2025” goals within the period of the 90 day talks. If those export controls were to include critical items – such as semiconductors, which are critical to China’s export-oriented manufacturing (Chart 3) – negotiations may become more complicated. Geopolitics: The trade truce did not contain any substantive resolution to ongoing strategic tensions between the U.S. and China. These tensions precede President Trump: we have detailed them in these pages since 2012.3 As such, the U.S. defense and intelligence community will have to be on board with any trade deal and that may suggest that Beijing will be asked to make geopolitical concessions over the course of the next 90 days. Chart 3China Accounts For 60% Of Global Semiconductor Demand
Trade Truce: Narrative Vs. Structural Shift?
Trade Truce: Narrative Vs. Structural Shift?
Despite the above, the trade truce is a meaningful and substantive move away from an open trade war. Yes, the U.S. will retain tariffs on $250bn Chinese imports, with China maintaining tariffs on $66bn of U.S. imports (Chart 4). No, the U.S. did not rule out a third round of tariffs covering the remaining $267 billion of Chinese imports, if things go awry. Nevertheless, the 90-day truce implies that the U.S. will not ratchet up the tensions for now. Chart 4U.S.-China Trade Hit By Tariffs
Trade Truce: Narrative Vs. Structural Shift?
Trade Truce: Narrative Vs. Structural Shift?
The truce also allows China to make substantive changes to its domestic economic policies that may satisfy some of the structural concerns cited in the above U.S. Trade Representative report. The soundest basis for a durable deal lies in China recommitting to structural reforms: this would both be positive for China’s productivity and would assuage some of Washington’s underlying anxieties about China’s state-backed industrial policies. Significantly, China’s Ministry of Foreign Affairs now says that it will “gradually resolve the legitimate concerns of the U.S. in the process of advancing a new round of reform and opening up in China.” When would this new round of reform occur? The upcoming Central Economic Work Conference, and the 40th anniversary of Deng Xiaoping’s reforms, should be watched closely for new initiatives. Also, the new March 1 tariff deadline lines up with the calendar for China’s National People’s Congress (NPC). The NPC meets every year and is the occasion when any major new domestic reforms would need to be laid out. Thus, any Chinese compromises on structural issues could be rolled out as part of a more general reform agenda in March. This is important because the U.S. administration is determined to focus on implementation and not to let China delay resolution of differences through endless rounds of dialogue. As such, investors should watch the following issues over the course of the next three months in order to gauge the likelihood of a substantive deal that not only rules out new tariffs but also rolls back the existing ones: Polls: President Trump is focused on his 2020 reelection. As such, he will want to see political gains from the easing of pressure on China, both in the general populace and amongst his GOP base (Chart 5). A slump in the polls, or a threatening turn in the Mueller investigation, may justify a shift in the narrative come March-April and thus end the truce. Chart 5Trump’s Approval Will Affect Trade Talks
Trade Truce: Narrative Vs. Structural Shift?
Trade Truce: Narrative Vs. Structural Shift?
Big ticket announcements: China is going to have to make big-ticket item purchases. A huge order of Boeing airplanes, a massive ramp-up in the purchase of agricultural products, a raft of direct investments in manufacturing in the heartland … these are the type of announcements that President Trump could use to sell a substantive deal to his base. Structural changes to the Chinese economy: China will have to prove that it is addressing the concerns outlined in the U.S. Trade Representative report. We suspect that Lighthizer issued the report ahead of the G20 summit so as to set the benchmark for what the U.S. wants to see from Beijing. It is a high benchmark as it includes: An end to cyber theft, hacking, and corporate espionage; Substantive, rather than merely “incremental,” improvements to U.S. market access, including increased ownership of ventures; Serious changes to state-subsidized industrial programs that utilize stolen technology, particularly the so-called “Strategic Emerging Industries” program and “Made in China 2025”; An end to China’s state-backed investment campaign in Silicon Valley. No new U.S. embargoes: The public comment period for the newly proposed U.S. export controls ends on December 19. That suggests that high-tech restrictions could emerge over the course of the first quarter of 2019. These could exacerbate tensions. No new geopolitical tensions: Geopolitical tensions, such as over human rights in Xinjiang or the militarization of the South China Sea, would obviously make a deal less likely. Bottom Line: The trade truce could lead to a substantive trade deal between China and the U.S. However, many impediments remain. Investors have to answer three key questions: is the deal politically useful for President Trump ahead of the 2020 election? Does the deal resolve the concerns laid out in the U.S. Trade Representative’s Section 301 report? And will geopolitical and national security tensions ease? Since 2012, we have had a structurally bearish view of the Sino-American relationship. This view is based on long-term structural factors that we do not think can be resolved over the course of 90 days. That said, every structural view can have cyclical deviations. The question we now turn to is how to play such a cyclical deviation in terms of the markets. What Does The Truce Mean For The Markets? In our view, the trade war has been of secondary importance to global markets. Far more relevant to the BCA House View that DM assets will outperform EM has been our conclusion that U.S. and Chinese economies would experience policy divergence. The U.S. economy has been buoyed by pro-cyclical stimulus, whereas Chinese policymakers have created a macro-prudential framework that has impaired the country’s credit channel. This divergence has led to the outperformance of the U.S. economy over the rest of the world, leading to a substantive USD rally (Chart 6). Chart 6U.S. Outperformance Should Be Bullish USD
U.S. Outperformance Should Be Bullish USD
U.S. Outperformance Should Be Bullish USD
While this view has worked out well in 2018, it appears to be fraying as the year comes to the end: Chart 7U.S. Growth Weakening?
U.S. Growth Weakening?
U.S. Growth Weakening?
Fed dovishness: Our recent travels to Asia, the Middle East, Europe, and the Midwest have revealed unease among investors regarding the health of the U.S. economy. Some recent data, such as the woeful core durable goods orders (Chart 7) and weak housing, have prompted calls for a more dovish Fed. On cue, Fed Chair Jay Powell delivered what was perceived as a dovish speech. BCA’s Chief Global Strategist, Peter Berezin, makes a strong case for why investors should fade the enthusiasm.4 Specifically, Peter thinks that investors are focusing too much on the unknown – the neutral rate – and not enough on the known – the budding inflationary pressures (Chart 8). Nonetheless, in the near-term, the narrative of a “Fed pause” may overwhelm the data. Chart 8Does The Fed Like It Hot?
Does The Fed Like It Hot?
Does The Fed Like It Hot?
Chart 9Fiscal Policy Becomes More Proactive
Trade Truce: Narrative Vs. Structural Shift?
Trade Truce: Narrative Vs. Structural Shift?
Chinese stimulus: Evidence of a broad-based, irrigation-style, credit stimulus is scant in China’s data. Nonetheless, many investors we have met on the road are latching on to higher local government bond issuance (Chart 9) and a positive M2 credit impulse (Chart 10). Moreover, Q1 almost always brings a boost in new lending in China. Our colleague Dhaval Joshi, BCA’s Chief European Strategist, has recently pointed out that the global credit impulse has hooked up, suggesting that EM underperformance is over (Chart 11).5 We do not think that China can turn the corner on a slumping economy without a substantive increase in its total social financing, which remains subdued both in growth terms and as a second derivative (Chart 12). However, we concede that the narrative may have shifted sufficiently in the near term to warrant some tactical caution on our cyclical House View. Chart 10China's M2 Turned Positive
China's M2 Turned Positive
China's M2 Turned Positive
Chart 11An Up-Oscillation In Global Credit Growth Technically Favours EM
An Up-Oscillation In Global Credit Growth Technically Favours EM
An Up-Oscillation In Global Credit Growth Technically Favours EM
Trade truce: Trade concerns have had a clear impact on the outperformance of U.S. equities relative to the rest of the world (Chart 13). As such, a trade truce may alter the narrative sufficiently in the near term to change the direction. In this report, we cite why we are cautious regarding the truce leading to a substantive deal. However, we are biased by our structural perspective that Sino-American tensions are unavoidable. The vast majority of our clients and global investors does not share this view. In fact, the trade war has caught the investment community by surprise. As such, we would argue that investors are biased towards a “win-win” scenario. Therefore, investors may not be cautious, but may in fact project a much higher probability of a final deal into their market decisions. Chart 12China's Total Credit Is Weak
China's Total Credit Is Weak
China's Total Credit Is Weak
Chart 13U.S. Is Winning The Trade War
U.S. Is Winning The Trade War
U.S. Is Winning The Trade War
Over the course of 2019, we do not think the global risk asset bullishness is sustainable. In fact, a reprieve rally now is going to make global growth resynchronization less likely and continued policy divergence more likely. Why? First, Chinese policymakers will have less of a reason to deploy an irrigation-style credit stimulus if fears of an accelerated trade war abate. Second, the Fed will have less of a reason to back off from its hiking trajectory if both the DXY rally and equity market volatility ease. That said, we are going to close our long DM / short EM trades for the time being. This includes: Our long DM equities / short EM equities, for a gain of 15.70%; Our long U.S. Dollar (DXY) index for a gain of 0.56%; Our long USD / Short EM currency basket for a loss of 0.76%; Our long JPY/GBP call, for a gain of 0.32%. Our hedge of being long China play index ought to outperform on a tactical horizon, so we are leaving it open despite its paltry return so far of 0.32%. Also, we are keeping our long Chinese equities ex. Tech / short EM equities trade, as Chinese assets should rally on the back of the truce. Note that, as outlined above, China’s tech sector is not out of the woods yet. Our decision to close these recommendations is to preserve profits, not change our investment stance. On a cyclical horizon, we remain skeptical that global risk assets will outperform DM, and U.S. assets in particular, over the course of 2019. In the end, we do not believe that a mere narrative shift will be sustainable, especially given the robustness of the U.S. labor market (Chart 14) and the tepidness of Chinese stimulus (Chart 15). Chart 14A Tight Labor Market
A Tight Labor Market
A Tight Labor Market
Chart 15Compare Any Stimulus To Previous Efforts
Compare Any Stimulus To Previous Efforts
Compare Any Stimulus To Previous Efforts
Finally, a word on oil prices. The G20 was crucial for the oil call, as well as the trade war, given that Saudi Arabia and Russia suggested that their OPEC 2.0 union would produce supply cuts at the upcoming Vienna meeting on December 6. This proves that fundamentals were more important than the narrative that Saudi leadership “owed” a favor to President Trump. In particular, the Saudis have fiscal constraints given their budget breakeven oil price is around $80-$85 per barrel. As such, we are reinitiating our long EM energy producers (ex-Russia) / short broad EM (ex-China) equity call. We are excluding Russia from the “long” due to lingering geopolitical concerns – sanctions and Ukraine – and China from the “short,” as we are now tactically bullish on China. Marko Papic, Senior Vice President Chief Geopolitical Strategist marko@bcaresearch.com Matt Gertken, Vice President Geopolitical Strategy mattg@bcaresearch.com Footnotes 1 Please see Office of the United States Trade Representative, “Update Concerning China’s Acts, Policies, And Practices Related To Technology Transfer, Intellectual Property, And Innovation,” dated November 20, 2018, available at www.ustr.gov. 2 Please see The Federal Register, “Review of Controls for Certain Emerging Technologies,” dated November 19, 2018, available at www.federalregister.gov. 3 Please see Geopolitical Strategy Special Report, “Power And Politics In East Asia: Cold War 2.0?,” dated September 25, 2012, Global Investment Strategy Special Report, “Searing Sun: Japan-China Conflict Heating Up,” dated January 25, 2013, “Sino-American Conflict: More Likely Than You Think, Part II,” dated November 6, 2015, and “The South China Sea: Smooth Sailing?,” dated March 28, 2017, available at gps.bcaresearch.com. 4 Please see Global Investment Strategy Weekly Report, “Shades Of 2015,” dated November 30, 2018, available at gis.bcaresearch.com. 5 Please see European Investment Strategy Weekly Report, “DM Versus EM, And Two European Psychodramas,” dated November 22, 2018, available at eis.bcaresearch.com.
The U.S. economy continues to support the case for Fed normalization, while China’s stimulus continues to disappoint. The result is a double whammy for commodity prices and EM assets as the dollar strengthens and exports of resources and capital goods to…
Although there are a few signs of easing tensions between the U.S. and China, there are also signs that any agreement will provide just a temporary reprieve from the broader U.S-China tussle. First, China is negotiating under duress. Over the past month…
Presidential summits can have major consequences, but context is everything. Trump’s impending meeting with President Xi will be the third since he took office. The first two did not prevent the trade war. Neither did high-level negotiations in May 2018,…
The scheduled meeting between President Trump and President Xi on the sidelines of the G20 summit in Buenos Aires on December 1 has generated a fair amount of speculation that the trade war will be resolved or at least put on pause. A major de-escalation…
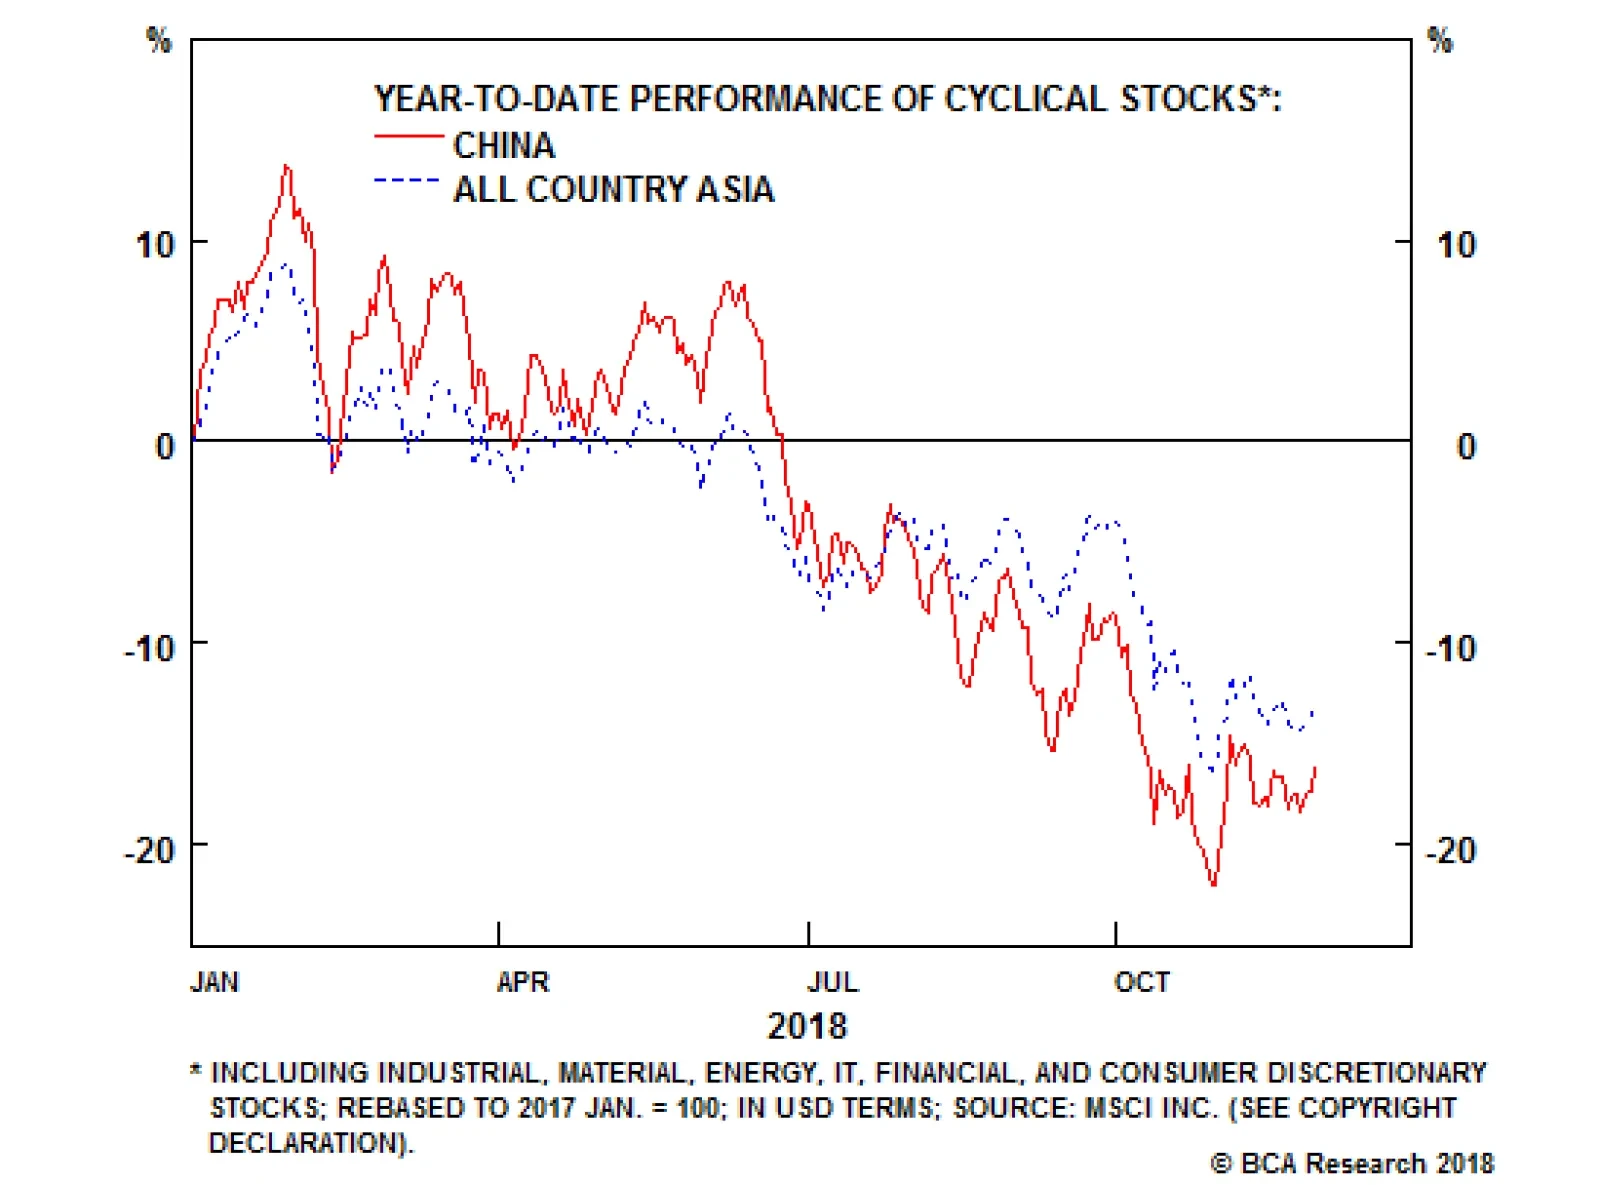
Highlights So What? A trade deal is unlikely at the G20. Stay short CNY/USD. Why? The odds of a U.S.-China tariff ceasefire are around 30%-40%. Investors should see any ceasefire as a temporary reprieve. Stay neutral on Chinese equities. Expect a weaker CNY/USD. Fade any rally in U.S. China-exposed equities. In Taiwan, local elections do not herald a decline in geopolitical risk, which is elevated. Feature The scheduled meeting between U.S. President Donald Trump and Chinese President Xi Jinping on the sidelines of the G20 summit in Buenos Aires on December 1 has generated a fair amount of speculation that the trade war will be resolved or at least put on pause. A major de-escalation would bring some consolation to global equity markets that have fallen by 11% since their peak in late January, 2018, especially to Chinese and Asian cyclicals, which have fallen by 27% and 21% respectively over the same time period (Chart 1). Chart 1Desperate For Good News
Desperate For Good News
Desperate For Good News
We are doubtful that the summit will cause a major positive catalyst for markets. Yes, it is tempting to think that President Trump could wrap up the whole trade war promptly, just as he wrapped up negotiations with Mexico and Canada in October. If President Xi could add a few sweeteners to concessions he has already made, then Trump could proclaim a “historic new deal” and roll back the tariffs. Equity markets would celebrate. The past year would seem like a bad dream. But this is all fantasy. U.S.-China relations have gotten worse every year since 2008 for a host of economic, political, military, and strategic reasons. Is the current stock market selloff really enough to force Trump into a major capitulation, given that trade tensions were not the primary cause either of the October correction or of the earlier pullback in February? And is Xi really going to make significant concessions with Trump holding bigger threats over his head? We admit that some kind of improvement is plausible – say, a tariff ceasefire and an agreement to launch a new round of talks. We attach a 30%-40% subjective probability to such a scenario. But our base case – which is driven as always by structural factors – is that the summit will turn out to be a flop and the trade war will escalate in 2019. How Likely Is A Tariff Ceasefire? Presidential summits can have major consequences, but context is everything. Trump’s impending meeting with President Xi will be the third since he took office. The first two – in April and November 2017 – did not prevent the trade war. Neither did high-level negotiations in May 2018, which produced a “trade truce” that did not last a week. However, much has changed since then: the U.S. has imposed tariffs on half of Chinese imports, while China has suffered a bear market and some signs of domestic economic stress (Chart 2). Chart 2Signs Of Economic Weakness
Signs Of Economic Weakness
Signs Of Economic Weakness
Over the past month, some developments suggest that the U.S. and China are managing their strategic tensions a bit better than they were earlier this year. Tensions peaked in early October, when the U.S. imposed sanctions on China’s People’s Liberation Army for purchasing Russian Sukhoi-25 jets and S400 surface-to-air missiles, under a law designed to punish Russia for meddling in the U.S.’s 2016 election. Meanwhile CNN reported that the U.S. military was considering staging a “global show of force” in November, a show that would have included sensitive operations in the Taiwan Strait and South China Sea. Since then, however, positive signs have emerged: Presidents Trump and Xi confirmed their meeting at the G20 in Buenos Aires. The two sides have exchanged letters and will bring trade negotiators to the summit, making it at least possible for substantive work to be done. Various preparatory discussions have been held, including a phone call between Treasury Secretary Steve Mnuchin and top Chinese economic adviser and negotiator, Vice Premier Liu He. Beijing offered to hold military-to-military talks that it had previously canceled between Defense Minister Wei Fenghe and Secretary of Defense James Mattis. The two officials met in Singapore and in Washington for the second round of the U.S.-China Diplomatic and Security Dialogue. The U.S. and China tentatively agreed to a multilateral protocol for avoiding accidental encounters by military aircraft, supplementing a similar agreement covering unplanned encounters at sea.1 Treasury Secretary Mnuchin met with People’s Bank of China Governor Yi Gang on the sidelines of the World Bank’s annual meeting in Bali, Indonesia in October, and afterwards refrained from accusing China of currency manipulation in the Treasury’s biannual foreign exchange report. Director of the National Trade Council Peter Navarro, a fierce trade hawk on China, is reportedly not attending the G20 summit. National Economic Adviser Larry Kudlow publicly chastised Navarro for criticizing the new negotiations as a Wall Street capitulation to China.2 This piece of anecdotal evidence has captured the imagination of sell-side analysts and many of our clients. These developments, in addition to Trump’s positive tweets on the subject, suggest that both China and the U.S. are trying to step back from the brink and accomplish something at the upcoming summit. However, there are many reasons to take these developments with a grain of salt: China is negotiating under duress: In statements over the past month, and reiterated by President Trump as we go to press, the U.S. has warned that if the G20 summit does not go well, it will ratchet up the pressure. In early December, it might move forward with the third round of threatened tariffs, covering the remaining $267 billion in imports from China. On December 19, the U.S. Department of Commerce will conclude consultations on whether to impose new export controls on “emerging technologies.” And on January 1, 2019, the existing tariff rate on $200 billion worth of imports (the second round) is supposed to rise from 10% to 25%, which implies that a third round of tariffs would eventually have the same rate. Indeed, since the confirmation of the G20 summit, the U.S. has imposed sanctions on Chinese technology companies like Fujian Jinhua. It has also begun implementing a new law strengthening the Committee for Foreign Investment in the United States and its foreign investment reviews, which already mostly target China (Chart 3). Chart 3Rising Scrutiny Of Chinese Investment
Rising Scrutiny Of Chinese Investment
Rising Scrutiny Of Chinese Investment
Further, the U.S. has taken the occasion in the recent military and diplomatic dialogue to demand, for the first time ever, that China remove its missile systems from the Spratly Islands in the South China Sea.3 Some of these moves can be read as evidence that the U.S. will impose penalties for various grievances even if China agrees to some of its key trade demands. The demands on the South China Sea and arms purchases, for instance, will stand even if China makes major concessions on key trade issues like technology acquisition. At minimum, the above details suggest that Xi Jinping will be negotiating with a sword over his head and thus may refuse to make concessions on principle, despite the negative impact on China’s stock market and export sector (Chart 4). Chart 4The Impending Tariff Impact
The Impending Tariff Impact
The Impending Tariff Impact
Leaks from the negotiations do not suggest any breakthroughs: China’s written response to Trump’s letter reportedly contains no new, significant trade concessions.4 U.S. Trade Representative Robert Lighthizer, the sine qua non of any trade deal, has issued a hawkish report on the eve of the summit arguing that China has not substantively changed any of the trade practices that prompted the tariffs so far.5 The report, an update to his initial Section 301 report, makes grave accusations about China’s use of cyber theft and corporate espionage over the past year alone, in addition to earlier years. These activities go far beyond trade disputes and clearly affect national security: a tariff freeze is hardly possible without substantial commitments by China to rein in these operations. Lighthizer also argues that China’s trade concessions so far are merely “incremental” and in several cases deceptive. For instance, China’s propaganda outlets have de-emphasized the “Made in China 2025” program even though the government is continuing apace with this program as well as other state-subsidized industrial programs that utilize stolen tech, such as the “Strategic Emerging Industries” (SEI) policy. Not only has China maintained certain targets for domestic market share in key technologies (Chart 5), but modifications to the program have in some cases increased these targets, such as in the production of “new energy vehicles” (Chart 6). Chart 5China’s High-Tech Protectionism
Trump And Xi: Third Time Not A Charm
Trump And Xi: Third Time Not A Charm
Chart 6More High-Tech Protectionism
Trump And Xi: Third Time Not A Charm
Trump And Xi: Third Time Not A Charm
Lighthizer further claims that China’s state-backed investment campaign in Silicon Valley continues despite a headline reduction in capital flight to the United States. And he also presents evidence that the full range of U.S. government agencies as well as the U.S.’s major allies are observing the same malicious or abusive practices from China and share the U.S.’s concerns. As for China hawk Navarro – who is far less important than Lighthizer to trade negotiations – his status today is not worse than it was in 2017, when his office was subordinated to that of former National Economic Council Director Gary Cohn. Of course, Cohn got fired, while Navarro’s office was upgraded and his pro-tariff argument won out. Trump’s olive branch is suspicious: Trump and his administration adopted friendly rhetoric during the lead-up to the midterm election, when it might have been desirable to show “progress” in the trade negotiations. It would have been impossible to engineer credible signs of progress without genuinely engaging the Chinese. Now, however, the midterms are over and there is no pressing political need for Trump to agree to a deal. Many of our clients – and almost all broker research – believe that Trump has a financial need to agree to a deal – i.e. to calm the stock market. However, there are two problems with this thesis. First, it is not clear that stock performance has had any relationship with President Trump’s approval rating (Chart 7). Chart 7Trump No Slave To Stock Market
Trump No Slave To Stock Market
Trump No Slave To Stock Market
Second, both of the U.S. stock market pullbacks this year were catalyzed by sharp rises in treasury yields, not disruptive news on the trade front (Chart 8). As such, positive news about the trade war will yield only a passing relief rally in the United States. Chart 8Yields, Not Trade, Drive U.S. Selloff
Yields, Not Trade, Drive U.S. Selloff
Yields, Not Trade, Drive U.S. Selloff
On this basis, we doubt that President Trump will agree to a hurried, watered-down trade deal that the Democrats will slam as a “giveaway” to China for the remaining two years of his presidency. With the U.S. economy fired up, the trade deficit is likely to widen regardless of tariffs (Chart 9), rendering any weak Trump-China deal a humiliation. Chart 9Trade Deficit To Rise Despite Tariffs
Trade Deficit To Rise Despite Tariffs
Trade Deficit To Rise Despite Tariffs
However, while a trade deal is out of reach, there is a logic to suspending further tariff impositions: Trump may wish to disperse the negative impact of the trade tariffs over a longer period of time. This would give him room to try to settle a very tricky trade agreement before the 2020 election. Then, if the talks succeed, he can present himself as a great dealmaker. If the talks fail, he has all the more ammunition to launch a third round of tariffs. (And on this time frame, the effects of the third round would not be felt by consumers until after the election.) Xi, for his part, may wish to “lock in” Trump with concessions today rather than wait to see how aggressive Trump will become as 2020 draws near. True, Xi cannot afford to “lose face” by capitulating abjectly. But he is the dictator of a regime that has full control of the media; he will be able to suppress domestic criticism of his concessions. In fact, the most insidious criticism of Xi is that he flouted the maxims of both Sun Tzu and Deng Xiaoping by provoking the wrath of China’s greatest enemy prematurely. Thus, if he stays Trump’s hand on tariffs in exchange for a new round of talks or minor concessions, then he comes out of Buenos Aires looking okay. The reason we put this ceasefire scenario at only 30%-40% probability is that we still do not see Trump as heavily constrained by the trade war. His greatest constraint is political and works against a trade deal: it comes from the Democrats, whose protectionist candidates performed very well in the midterm election in the Rust Belt states that are critical for Trump’s reelection (Table 1). Table 1Massive Republican Losses Across The Midwest
Trump And Xi: Third Time Not A Charm
Trump And Xi: Third Time Not A Charm
Economically, our assessment is that the selloff in U.S. financial markets is a correction, not a bear market, and that there is no sign that the U.S. economy is likely to slip into recession (Chart 10). Trump is constrained by the unemployment rate, not by the stock market alone. As long as Trump shares this assessment, he will not be lulled into a politically damaging capitulation to China. Chart 10No Sign Of Recession Yet
No Sign Of Recession Yet
No Sign Of Recession Yet
Also, Xi will fear that difficult concessions will encourage Washington to continue what Chinese government officials have called “trade bullyism,” i.e. using coercive measures and upping its demands. In other words, the main argument for a tariff ceasefire is that Trump might simply prefer one to boost the stock market and thus may accept few or no concessions. And that preference is not enough to change our baseline view in light of his political constraints. Bottom Line: There is no basis for a resolution of the trade war at present, but there is a basis for a tariff ceasefire and a new effort at trade negotiations. Still, it is not our base case. Xi has good reason not to make major concessions under duress and Trump does not want to get outflanked by his political opponents by freezing tariffs without major Chinese concessions. Do Presidential Summits Matter? Have presidential summits between the U.S. and China ever brought about major breakthroughs? Yes, but not since the Great Recession. As Table 2 demonstrates, looking at 50 U.S.-China leadership summits since 1972, only 18 qualify as true “green light” summits in which the outcome was a concrete improvement in relations over the period before the next summit – and 10 of these were during the first decade of the 2000s, the heyday of “Chinamerica,” when China and Emerging Market economies roared ahead while George W. Bush courted China’s cooperation on terrorism and North Korea. Table 2U.S.-China Leaders Summits: A Chronology
Trump And Xi: Third Time Not A Charm
Trump And Xi: Third Time Not A Charm
Only eight summits mark truly historic positive inflection points: Nixon 1972, Carter 1979, Reagan 1984, Clinton 1997, Clinton 2000, Bush 2002, Bush 2005, and arguably Obama 2009. Since 2009, under four different leaders (two from each country), Sino-American relations have categorically worsened. Moreover, both President Obama’s and President Trump’s major meetings with President Xi, at the Sunnylands estate in California in 2013 and at the Mar-a-Lago resort in Florida in 2017, saw much fanfare at the time but were followed by a significant deterioration in relations. Indeed, the Obama administration launched a more aggressive China policy in September 2015, including freedom of navigation operations in disputed areas of the South China Sea. This was after President Xi declared that China “does not intend to pursue militarization” of the Spratly Islands – a statement that American officials have repeatedly cited when arguing that China’s foreign policy is increasingly aggressive and that China is not following through with diplomatic promises. Investors should focus not on the Trump-Xi summit on December 1 but rather on the two governments’ actions afterwards. The substance of any positive outcome will depend, in particular, on whether Trump indicates that he will proceed with the tariff rate hike on January 1, 2019 and/or the initiation of a third round of tariffs covering the remainder of U.S. imports from China.6 Bottom Line: History does not give reason for optimism about the summit – especially not recent history, in which heavily hyped summits have not been able to arrest the secular decline in U.S.-China cooperation due to underlying strategic distrust. Investment Implications The primary driver of the recent selloff in global risk assets is not the trade war but the divergence between U.S. and Chinese economic policy writ large. The U.S. economy continues to support the case for Fed normalization, while China’s stimulus continues to disappoint. The result is a double whammy for commodity prices and EM assets as the dollar strengthens and exports of resources and capital goods to China soften (Chart 11). Chart 11A Bad Combination For EM
A Bad Combination For EM
A Bad Combination For EM
Given that China’s December Central Economic Work Conference will likely reinforce the message of greater policy support, and that China tends to frontload new credit expansion in the beginning of the year (Chart 12), it is entirely possible that a rally in global risk assets on the back of positive trade news in late November could gain traction in December and the New Year. BCA’s Geopolitical Strategy will continue to hedge against the risk of substantial reflation in China by means of our Foreign Exchange Strategy’s long “China Play Index” trade (Chart 13). Chart 12China May See A Q1 Credit Spike
Trump And Xi: Third Time Not A Charm
Trump And Xi: Third Time Not A Charm
Chart 13Monitoring The Risk To Our View
Monitoring The Risk To Our View
Monitoring The Risk To Our View
Fundamentally, however, we would view a December-January rally as a short-term movement that is not worth playing. We expect the Xi administration to remain disciplined in its use of stimulus measures, for the purposes of economic restructuring. Ever worsening trade tensions give Xi the option of blaming the American administration for the economic pain incurred due to his reform agenda. Therefore we think global divergence can persist, which is positive for the dollar and USD/CNY exchange rate. While acknowledging the potential for a near-term rally, we remain neutral Chinese stocks relative to their global counterparts over a 6-12 month horizon and continue to favor low-beta stocks within the Chinese equity universe. We also remain neutral on Taiwanese equities. The ruling Democratic Progressive Party’s (DPP) loss in local elections on November 24 was severe (Chart 14), though not unexpected. The election result does not change Geopolitical Strategy’s view that Taiwan faces heightened geopolitical risk. Chart 14Taiwanese Voters Seek More Conciliatory Approach To Beijing
Trump And Xi: Third Time Not A Charm
Trump And Xi: Third Time Not A Charm
Indeed, the election suggests that the Tsai Ing-wen administration may only have 14 months remaining in power, and hence that it will try rapidly to finalize some material improvement in the U.S.-Taiwan relationship. Since the Trump administration will also try to exploit this closing window of opportunity, the potential is rising for a controversy to erupt over diplomatic or military relations. This could prompt a negative, market-relevant reaction from Beijing. It is also too soon to bottom-fish within the tech sector in China and the U.S., and we remain pessimistic about the earnings outlook for companies exposed to the U.S.-China trade relationship. Matt Gertken, Vice President Geopolitical Strategy mattg@bcaresearch.com Footnotes 1 While these agreements do not ensure collisions will not occur, given the USS Decatur incident earlier this year, they are at least a sign of coordination. 2 Navarro had said the following at a speech at the Center for Strategic and International Studies: “Consider the shuttle diplomacy that’s now going on by a self-appointed group of Wall Street bankers and hedge fund managers between the U.S. and China. As part of a Chinese government influence operation, these globalist billionaires are putting a full-court press on the White House in advance of the G-20 in Argentina. The mission of these unregistered foreign agents – that’s what they are; they’re unregistered foreign agents – is to pressure this president into some kind of deal.” Please see “Economic Security as National Security: A Discussion with Dr. Peter Navarro,” CSIS, November 13, 2018, available at www.csis.org. 3 Please see U.S. Department of State, “U.S.-China Diplomatic and Security Dialogue,” November 9, 2018, available at www.state.gov. For the proposed export controls, open for public comment until December 19, 2018, please see U.S. Department of Commerce, “Review of Controls for Certain Emerging Technologies,” Bureau of Industry and Security, November 19, 2018, available at www.bis.doc.gov. 4 Please see Jeff Mason and David Shepardson, “Exclusive: China sends written response to U.S. trade reform demands - U.S. government sources,” Reuters, November 14, 2018, available at www.reuters.com. 5 Please see Office of the United States Trade Representative, “Update Concerning China’s Acts, Policies, And Practices Related To Technology Transfer, Intellectual Property, And Innovation,” dated November 20, 2018, available at https://ustr.gov/ 6 It is very unlikely, but perhaps not impossible, that China would accept a ceasefire that allows the January 1 tariff hike to go forward but forswears the third round of tariffs on the remaining Chinese imports.