Geopolitics
The macro backdrop is hardly encouraging: global export volumes are contracting and a huge spike in global policy uncertainty is providing additional support to the dollar. Any further rebound in the greenback will pile additional pressure onto trade flows,…

Highlights Currency markets continue to fight a tug of war between weak incoming data but easier financial conditions. Our thesis remains that the path of least resistance for the dollar is down, but the rising specter of global market volatility suggests it could catapult to new highs before ultimately reversing. Most of our pro-cyclical trades have been put offside in this environment of rising volatility. Maintain tight stops until more evidence emerges that global growth has bottomed. Large net short positioning in the Swiss franc and yen, together with cheap valuations, make them attractive from a contrarian standpoint. Hold on to CHF/NZD positions recommended on April 26. Feature Our thesis remains that global growth is in a volatile bottoming process. However, incoming data pretty much across the globe has been very weak, with the latest specter of a global trade war suggesting that economic softness could linger for longer than we originally anticipated. Given the shifting market dynamics, it is important to revisit our thesis on how to be positioned in currency markets. We do so this week via the lens of the Australian dollar, one of the market’s favorite short positions. Future reports will focus on additional global growth barometers, and when to time the shift towards a more pro-cyclical stance. Positive Divergences Chart I-1Global Growth Barometers Flashing Amber
Global Growth Barometers Flashing Amber
Global Growth Barometers Flashing Amber
On the surface, most data points appear negative for the Aussie dollar. Typical reflation indicators such as commodity prices, emerging market currencies, and industrial share prices are breaking down after a nascent upturn earlier this year. One of our favorite indicators on whether or not easing liquidity conditions will lead to higher growth are the CRB Raw Industrials index-to-gold, copper-to-gold, and oil-to-gold ratios. It is disconcerting that these indicators have moved decidedly lower together with U.S. bond yields, another global growth barometer (Chart I-1). On a similar note, currencies in emerging Asia that sit closer to the epicenter of Chinese stimulus are breaking down. This suggests that so far, policy stimulus in China has not been sufficient to lift global growth, and/or the transmission mechanism towards higher growth is not working. Not surprisingly, the Australian dollar has been breaking down at a rapid pace, putting our long AUD/USD position offside. We will respect our stop-loss at 0.68 if breached, but a few indicators suggest the bearish view on the Australian dollar is very late: Chart I-2Australian Stocks Hitting New Highs
Australian Stocks Hitting New Highs
Australian Stocks Hitting New Highs
Election Results: The recent general election outcome was a big surprise to the market, and has eased risks to both the country’s banks and housing market. The center-left Labour party, which moved further to the left in this electoral cycle, was defeated by a substantial margin. This has a few important implications. First, “negative gearing” – the practice of using investment properties that are generating losses to offset one’s income tax bill – will remain in place. This was a big overhang on the housing market, which likely exacerbated the downturn in Aussie house prices. Second, the capital gains tax exemption from selling properties will probably not be reduced from 50% to 25%, as previously pledged. Finally, the Liberal-National coalition government will maintain the policy of reimbursing investors for corporate taxes paid by the underlying company. This keeps the incentive for retirees to own high dividend-yielding equities such as those of Australian banks. Australian equities hit a new cyclical high following the election results. This suggests the return on capital for Aussie companies may have inched higher following the more pro-market leadership shift (Chart I-2). At low levels of interest rates, fiscal policy is much more potent than monetary policy. Interest Rates: The latest Reserve Bank Of Australia (RBA) minutes suggest that rate cuts are back on the agenda. But the question is, with the markets pricing in two rate cuts by the end of this year, does it still pay to be short the Aussie dollar on widening interest rate differentials? More importantly, fiscal policy is set to become decisively loose this year. The new government is slated to introduce income tax cuts as early as July. This is skewed towards lower-income households, meaning the fiscal multiplier may be larger than what the Australian economy is normally accustomed to. Meanwhile, infrastructure spending will remain high, which will be very stimulative for growth in the short term. At low levels of interest rates, fiscal policy is much more potent than monetary policy, and the RBA will be loath to cut rates more than is currently expected by the market, at a time when consumer indebtedness remains quite high, and policy rates are already close to rock-bottom levels. The key for the RBA will be the job market, which at the moment remains a pillar of support for the Aussie economy. Job growth is accelerating, and labor force participation is hitting fresh highs (Chart I-3). So long as these trends continue, the RBA can afford to remain on the sidelines for a while longer. Meanwhile, while Aussie rates continue to drift downward, it has not been particularly profitable to buy U.S. Treasurys on a hedged basis (Chart I-4). Chart I-3Australia Employment Remains Robust
Australia Employment Remains Robust
Australia Employment Remains Robust
Chart I-4It is Expensive To Short The Aussie
It is Expensive To Short The Aussie
It is Expensive To Short The Aussie
Housing Market: For more than two decades, the Australian dollar has tended to be mostly driven by external conditions, especially the commodity cycle. But for the first time in several years, domestic factors have joined in to exert powerful downward pressure on the currency. The Australian Prudential Regulation Authority (APRA) has been on a mission to surgically deflate the overvalued housing market, while engineering a soft landing in the economy. Initially, their macro-prudential measures worked like a charm, as owner-occupied housing activity remained resilient relative to “investment-style” housing. What has become apparent now is that the soft landing intended by the authorities has rapidly morphed into a housing crash (Chart I-5). This is negative for consumption, both via the wealth effect and as well as for the outlook for residential construction activity. Chart I-5Could Australian Housing Bottom Soon?
Could Australian Housing Bottom Soon?
Could Australian Housing Bottom Soon?
The good news is that policy is supposed to become supportive for Aussie homebuyers at the margin, with the government slated to introduce new initiatives to help first-time homebuyers. Should labor market improvements continue, it will also help household income levels. Over the past few decades, house prices in Australia have generally staged V-shaped recoveries when at this level of contraction. Betting on at least some stabilization going forward seems reasonable. Commodity Prices: One bright spot for the Aussie dollar has been rising terms of trade. Admittedly, most measures of Chinese (and global) growth remain weak. However, there have been notable improvements in recent months that suggest economic velocity may be picking up: Production of electricity and steel, all inputs into the overall manufacturing value chain, are inflecting higher. Intuitively, these tend to lead overall industrial production. If these advance any further, they will begin to exceed GDP growth, indicating a renewed mini-cycle (Chart I-6). Production of electricity and steel, all inputs into the overall manufacturing value chain, are inflecting higher. In recent months, both steel and iron ore prices have been soaring. Many commentators have attributed these increases to supply bottlenecks and/or seasonal demand. However, it is evident from both the manufacturing data and the trend in prices that demand is also playing a role. Meanwhile, Beijing’s clear environmental push has lifted the share of liquefied natural gas in Australia’s export mix (Chart I-7). Given that the reduction – if not the outright elimination – of pollution is a long-term strategic goal in China, this will be a multi-year tailwind. As the market becomes more liberalized and long-term contracts are revised to reflect higher spot prices, the Aussie dollar will get a boost. Chart I-6Some Green Shoots From China
Some Green Shoots From China
Some Green Shoots From China
Chart I-7Australian LNG Will Buffet Terms Of Trade
Australian LNG Will Buffet Terms Of Trade
Australian LNG Will Buffet Terms Of Trade
Valuation: In terms of currency performance, a lot of the bad news already appears priced in to the Australian dollar, which is down 15% from its 2018 peak, and 38% from its 2011 peak. Meanwhile, Australian dollar short positions appeared to have already hit a nadir. This suggests outright short AUD bets are at risk from either upside surprises in global growth or simply the forces of mean reversion (Chart I-8). One of our favorite metrics for the Australian dollar’s fair value is its real effective exchange rate relative to its terms of trade. On this basis, the Aussie dollar is cheap by about 10% (Chart I-9). Chart I-8Short AUD: ##br##A Consensus Trade
Short AUD: A Consensus Trade
Short AUD: A Consensus Trade
Chart I-9AUD Is Attractive From A Terms Of Trade Perspective
AUD Is Attractive From A Terms Of Trade Perspective
AUD Is Attractive From A Terms Of Trade Perspective
China Credit Cycle: We have discussed at length how a revival in the Chinese credit cycle will help global and Australian growth. On the real estate front, residential property sales remain soft, but evidence from tier-1 and even tier-2 cities is signaling that this may be behind us, given robust sales. Over the longer term, the ebb and flow of property sales have usually been in sync across city tiers. A revival in the property market will support construction activity and investment. Chart I-10How Long Will The Weakness In China Last?
How Long Will The Weakness In China Last?
How Long Will The Weakness In China Last?
House prices have been rising to the tune of 10%-15% year-on-year, and may be sniffing an eventual pick-up in property volumes. Finally, Chinese retail sales including those of durable goods remain very weak. Car sales are deflating at the fastest pace in over two decades. But the latest VAT cut by the government is being passed through to consumers, with an increasing number of car manufacturers cutting retail prices. This should help retail sales (Chart I-10). Other Global Growth Barometers Investors looking for more clarity on the global growth picture from the April and May data prints remain in a quandary. And the preliminary European PMI numbers this morning offered no glimmers of hope. That said, the most volatile components of euro area growth tend to be investment and net exports. Should they both pick up on the back of stronger external demand, GDP could easily gravitate towards 1.5%-2%, pinning it well above potential. The German PMI is currently among the weakest in the euro zone. But forward-looking indicators suggest we may be on the cusp of a V-shaped bottom over the next month or so (Chart I-11). Chart I-11German Manufacturing Might Be At The Cusp Of A V-Shaped Recovery
German Manufacturing Might Be At The Cusp Of A V-Shaped Recovery
German Manufacturing Might Be At The Cusp Of A V-Shaped Recovery
The broad message is that global growth is in the midst of volatile bottoming process. However, before evidence of this fully unfolds, markets are likely to be swayed by the ebbs and flows of higher-frequency data. We recommend maintaining a pro-cyclical bias at the margin, but having tight stop losses as well as positions in both the Swiss franc and yen as insurance. Housekeeping Our buy-limit order on the British pound was triggered at 1.30 on March 29th. As we argued at the time, the pound was sitting exactly where it was after the 2016 referendum results, but the odds of a hard Brexit had significantly fallen. Since then, policy-induced volatility has led to a significant depreciation in the pound, with our position at risk of being stopped out at our 1.25 stop-loss this week. Given the rising specter of political volatility, we will respect our stop-loss if breached at 1.25. On the domestic front, economic surprises in the U.K. relative to both the U.S. and euro area continue to soar. The reality is that the pound and U.K. gilt yields should be much higher – solely on the basis of hard incoming data. Employment growth has been holding up very well, wages are inflecting higher, and the average U.K. consumer appears in decent shape (Chart I-12). The CPI data this week confirm that the domestic environment is hardly deflationary. That said, given the rising specter of political volatility, we will respect our stop-loss if breached at 1.25. Chart I-12Hold GBP/USD, But Stand Aside At 1.25
Hold GBP/USD, But Stand Aside At 1.25
Hold GBP/USD, But Stand Aside At 1.25
Chester Ntonifor, Foreign Exchange Strategist chestern@bcaresearch.com Currencies U.S. Dollar Chart II-1USD Technicals 1
USD Technicals 1
USD Technicals 1
Chart II-2USD Technicals 2
USD Technicals 2
USD Technicals 2
Recent data in the U.S. have been soft: The Michigan consumer sentiment index jumped to 102.4 in May. However, the Chicago Fed national activity index fell to -0.45 in April. The Redbook index increased by 5.4% year-on-year in May. Existing home sales contracted by 0.4% month-on-month to 5.2 million in April. Moreover, new home sales fell by 6.9% month-on-month in April. The Markit composite index fell to 50.9 in April. The manufacturing and services PMI fell to 50.6 and 50.9 respectively. Importantly, this a just a nudge above the 50 boom/bust level. DXY index initially increased by 0.3%, then plunged on the weak PMI data, returning flat this week. The FOMC minutes released on Wednesday reiterated that the recent drop in core inflation is mostly transitory, and that no strong evidence exists for a rate change in either direction. With the forward market already pricing an 82% probability of a rate cut this year, any hawkish shift by the Fed will be a surprise. However, this will not necessarily be bullish for the dollar, if accompanied by a global growth bottom. We remain of the view that the path of least resistance for the dollar is down. Report Links: President Trump And The Dollar - May 9, 2019 Take Out Some Insurance - May 3, 2019 Currency Complacency Amid A Global Dovish Shift - April 26, 2019 The Euro Chart II-3EUR Technicals 1
EUR Technicals 1
EUR Technicals 1
Chart II-4EUR Technicals 2
EUR Technicals 2
EUR Technicals 2
Recent data in the euro area have been mixed: Headline consumer price inflation was unchanged at 1.7% year-on-year in April, while core inflation increased to 1.3%. The current account balance narrowed to a surplus of 24.7 billion euros in March. However, this was above expectations. German GDP was unchanged at 0.6% year-on-year in Q1. The euro area Markit composite PMI was flat at 51.6 compared to the last reading of 51.5. Below the surface, both the manufacturing and services PMIs fell to 47.7 and 52.5, respectively. German composite PMI was held up at 52.4 by the services component that came in at 55. However, the manufacturing component fell to 44.3. German IFO current assessment dropped to 100.6 in May, and the business climate dropped to 97.9. In France, the Markit composite PMI came in at 51.3. The manufacturing and services PMIs both increased, to 50.6 and 51.7 respectively. This was the one bright spot in euro area data. EUR/USD has been flat this week, with recent data being on the softer side. The PMI data remain subdued, in particular. Meanwhile, political uncertainties continue to weigh on investors’ sentiment. Report Links: Take Out Some Insurance - May 3, 2019 Reading The Tea Leaves From China - April 12, 2019 Into A Transition Phase - March 8, 2019 The Japanese Yen Chart II-5JPY Technicals 1
JPY Technicals 1
JPY Technicals 1
Chart II-6JPY Technicals 2
JPY Technicals 2
JPY Technicals 2
Recent data in Japan have been mixed: Q1 annualized GDP grew by 2.1% quarter-on-quarter, well above estimates. Industrial production fell by 4.3% year-on-year in March, but was higher than the previous reading of -4.6% in February. Capacity utilization fell by 0.4% month-on-month in March. Exports contracted by 2.4% year-on-year in April, while imports increased by 6.4% year-on-year. The total trade balance thus narrowed from ¥528 billion to ¥64 billion. Notably, the exports to China fell by 6.3%, while exports to the U.S. increased by 9.6%. Machinery orders fell by 0.7% year-on-year in March. Nikkei manufacturing PMI fell below 50, coming in at 49.6 in May. USD/JPY fell by 0.5% this week. Yutaka Harada, a dovish member of the BoJ, warned during a news conference that by hiking the consumption tax rate at this critical juncture, Japan could risk sliding into a recession. With core CPI far from its 2% target, more monetary easing is probably exactly what the doctor ordered. Report Links: Beware Of Diminishing Marginal Returns - April 19, 2019 Tug OF War, With Gold As Umpire - March 29, 2019 A Trader’s Guide To The Yen - March 15, 2019 British Pound Chart II-7GBP Technicals 1
GBP Technicals 1
GBP Technicals 1
Chart II-8GBP Technicals 2
GBP Technicals 2
GBP Technicals 2
Recent data in the U.K. have been firm: The Rightmove house price index increased by 0.1% year-on-year in May. The orders component of the CBI industrial trends survey decreased to -10 in May. Retail sales increased by 3% year-on-year in April. Producer prices and input prices increased by 2.1% and 3.8%, year-on-year respectively in April. Headline inflation and core inflation increased by 2.1% and 1.8% year-on-year in April, both below expectations. GBP/USD decreased by 0.6% this week. Teresa May offered MPs a vote on a second referendum on Brexit, which considers a tighter customs union with the EU. The ongoing Brexit chaos has increased volatility in the pound. Report Links: Take Out Some Insurance - May 3, 2019 Not Out Of The Woods Yet - April 5, 2019 A Trader’s Guide To The Yen - March 15, 2019 Australian Dollar Chart II-9AUD Technicals 1
AUD Technicals 1
AUD Technicals 1
Chart II-10AUD Technicals 2
AUD Technicals 2
AUD Technicals 2
Recent data in Australia have been mostly negative: ANZ Roy Morgan weekly consumer confidence index increased to 117.2 this week. Westpac leading index fell by 0.1% month-on-month in April. Completed construction work fell by 1.9% in Q1. AUD/USD fell by 0.3% this week. During this week’s federal election, the coalition government led by Prime Minister Scott Morrison won. Besides the political development, the RBA governor Philip Lowe gave a speech on Monday, highlighting external shocks to Australian economy. He also expressed the positive outlook for Australian economy in the second half of 2019 and 2020, supported by the ongoing capex in infrastructure and resources sectors, together with strong population growth. More importantly, he mentioned that the RBA would consider the case for lower interest rates, which is a dovish shift from previous speeches. We are long AUD/USD with a tight stop at 0.68. Report Links: Beware Of Diminishing Marginal Returns - April 19, 2019 Not Out Of The Woods Yet - April 5, 2019 Into A Transition Phase - March 8, 2019 New Zealand Dollar Chart II-11NZD Technicals 1
NZD Technicals 1
NZD Technicals 1
Chart II-12NZD Technicals 2
NZD Technicals 2
NZD Technicals 2
Recent data in New Zealand have been mixed: Credit card spending growth missed expectations, coming in at 4.5% year-on-year in April. Retail sales increased by 0.7% quarter-on-quarter in Q1. Retail sales excluding autos increased by 0.7% quarter-on-quarter in Q1. NZD/USD fell by 0.3% this week. NZD/USD is currently trading at a 7-month low around 0.65. A bleak external picture is worrisome for the kiwi. We continue to favor the AUD/NZD cross, from a strategic standpoint. Report Links: Not Out Of The Woods Yet - April 5, 2019 Balance Of Payments Across The G10 - February 15, 2019 A Simple Attractiveness Ranking For Currencies - February 8, 2019 Canadian Dollar Chart II-13CAD Technicals 1
CAD Technicals 1
CAD Technicals 1
Chart II-14CAD Technicals 2
CAD Technicals 2
CAD Technicals 2
Recent data in Canada have been solid: Retail sales increased by 1.1% month-on-month in March. In particular, retail sales excluding autos increased by 1.7% month-on-month, well above estimates. USD/CAD appreciated by 0.3% this week. The better-than-expected retail sales data in March sparked a small rally in the loonie. However, the rally proved to be short-lived following softer oil prices. Positive data surprises in Canada will have to be sustained for the loonie to find some measure of support. Report Links: Currency Complacency Amid A Global Dovish Shift - April 26, 2019 A Shifting Landscape For Petrocurrencies - March 22, 2019 Into A Transition Phase - March 8, 2019 Swiss Franc Chart II-15CHF Technicals 1
CHF Technicals 1
CHF Technicals 1
Chart II-16CHF Technicals 2
CHF Technicals 2
CHF Technicals 2
Recent data in the Switzerland have been positive: Money supply (M3) growth was unchanged at 3.5% year-on-year in April. Industrial production increased by 4.3% year-on-year in Q1, albeit lower than the last reading of 5.1%. USD/CHF fell by 0.8% this week. As we argued in last week’s research note, the increasing global market volatility has reignited interest in the Swiss franc. We continue to recommend the franc as an insurance policy amid rising geopolitical risk. Report Links: What To Do About The Swiss Franc? - May 17, 2019 Beware Of Diminishing Marginal Returns - April 19, 2019 Balance Of Payments Across The G10 - February 15, 2019 Norwegian Krone Chart II-17NOK Technicals 1
NOK Technicals 1
NOK Technicals 1
Chart II-18NOK Technicals 2
NOK Technicals 2
NOK Technicals 2
There was little data out of Norway this week: The unemployment rate came in at 3.5% in March, well below consensus of 3.7% and the previous reading of 3.8%. USD/NOK fell by 0.4% this week. Rising geopolitical risks will be supportive of the oil market and put a floor under the krone. Aside from the U.S.-Iran tensions, the world faces the prospect of the loss of Venezuelan production, and significant outages in Libya, which are all bullish. Meanwhile, Norway remains one of few G10 countries that can hike interest rates in the near term. Report Links: Currency Complacency Amid A Global Dovish Shift - April 26, 2019 A Shifting Landscape For Petrocurrencies - March 22, 2019 Balance Of Payments Across The G10 - February 15, 2019 Swedish Krona Chart II-19SEK Technicals 1
SEK Technicals 1
SEK Technicals 1
Chart II-20SEK Technicals 2
SEK Technicals 2
SEK Technicals 2
Recent data in Sweden have been positive: Capacity utilization increased by 0.5% in Q1. Moreover, the unemployment rate fell to 6.2% in April. This was well below expectations of 6.8% and the previous month’s reading of 7.1%. USD/SEK fell by 0.3% this week. While we favor both the NOK and SEK against the U.S. dollar, near-term factors are more bullish for the krone. Our long NOK/SEK position is currently 4.38% in the money. Stick with it. Report Links: Balance Of Payments Across The G10 - February 15, 2019 A Simple Attractiveness Ranking For Currencies - February 8, 2019 Global Liquidity Trends Support The Dollar, But... - January 25, 2019 Trades & Forecasts Forecast Summary Core Portfolio Tactical Trades Closed Trades
Highlights So What? Markets remain complacent about U.S.-China trade. Why? The U.S. has escalated the trade war by threatening sanctions on key Chinese tech firms. Chinese President Xi Jinping is preparing his domestic audience for protracted struggle. U.S. domestic politics do not prohibit, and likely encourage, a tough stance on China. Farmers are not a constraint on Trump — economic growth is. Go long spot gold and JPY-USD. Feature Markets remain complacent. Chart 1 suggests that while the combination of unilateral trade tariffs and spiking U.S. 10-year Treasury yields was enough to sink the S&P 500 in 2018, the former alone cannot do so today. Chart 1Tariffs Alone Not Enough To Sink Equities? Wrong.
Tariffs Alone Not Enough To Sink Equities? Wrong.
Tariffs Alone Not Enough To Sink Equities? Wrong.
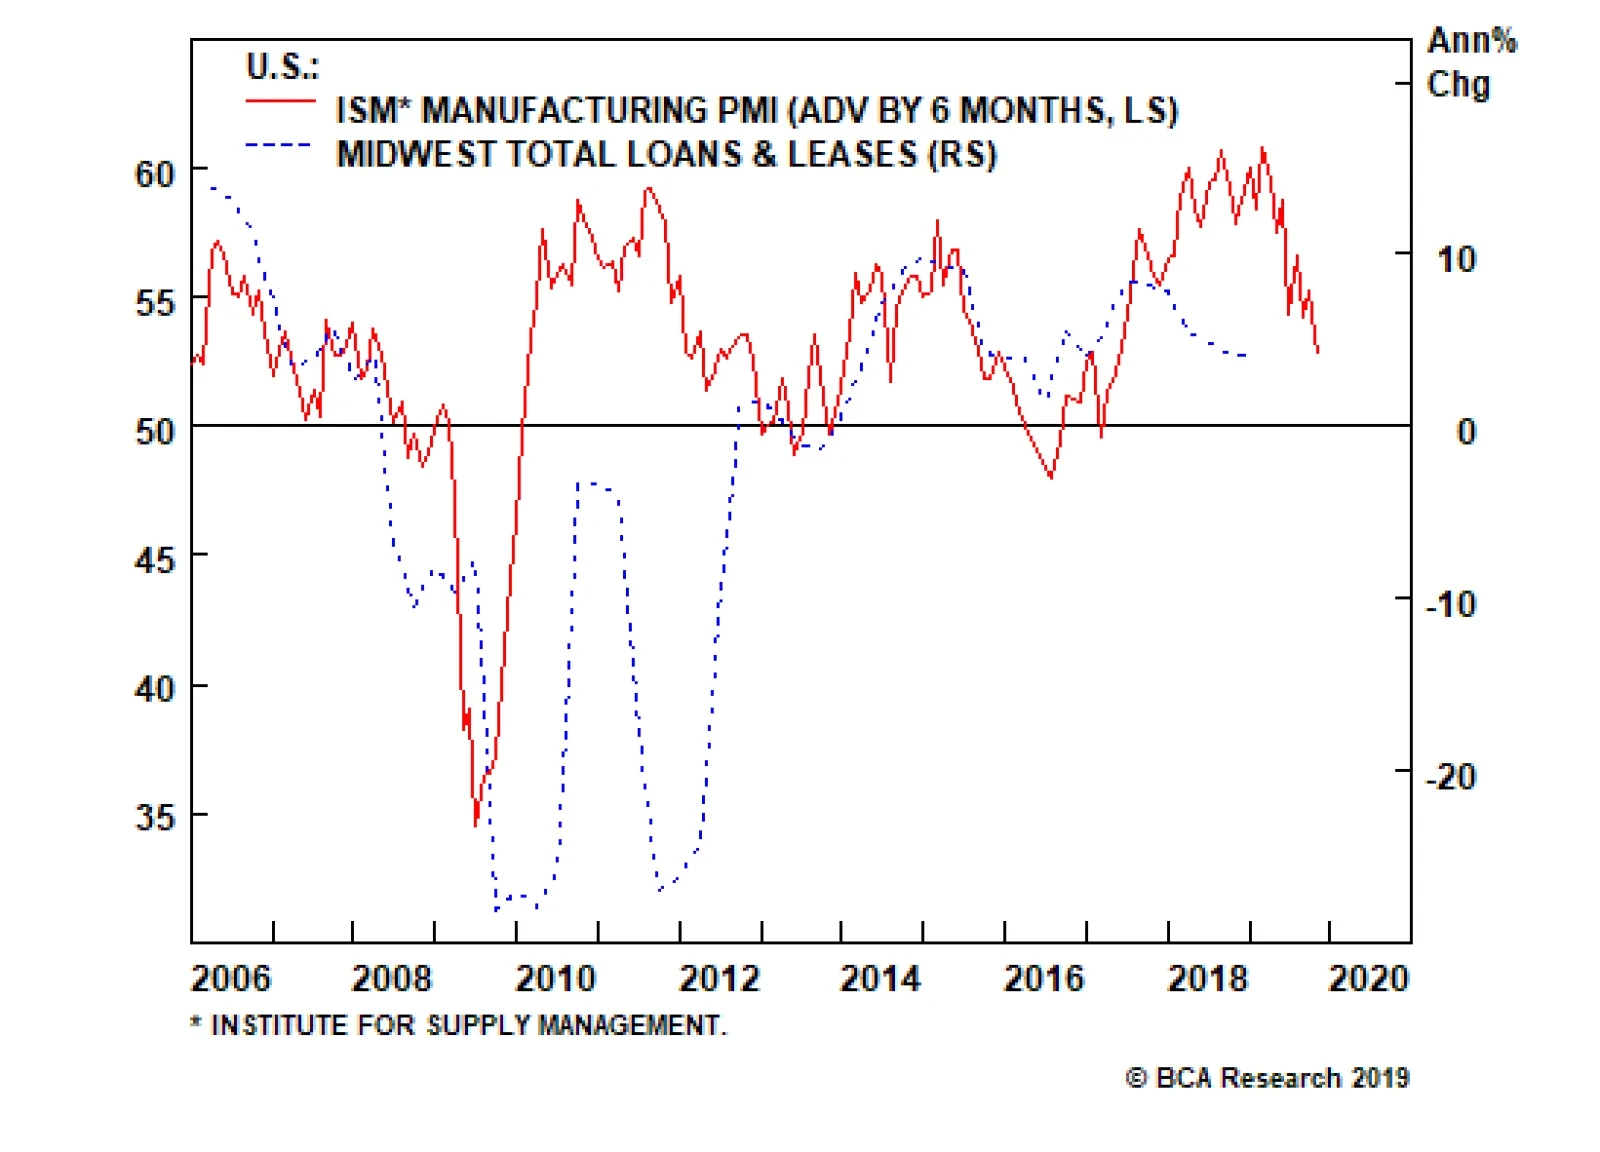
Specifically, the increase in the Section 301 tariff rate from 10% to 25% on $200 billion worth of Chinese imports and the threat of a new 25% tariff on the remaining $300 billion worth of Chinese imports in just a month’s time has only led to a 3% pullback in equities since May 3. That was the last trading day prior to President Donald Trump’s infamous tweet about hiking the tariff. Unlike the trade war escalation in October through November of last year, the Federal Reserve is no longer hiking rates, China’s economic indicators have bottomed, and U.S. equity investors have now fully imbibed the “Art of the Deal.” The consensus holds that the escalation of trade tensions with China is contained within the context of Trump’s well-known routine of inflicting pain and then compromising. We would wager that the bond market is right and equities are wrong. Equities will converge to the downside, unless the market receives a concrete positive catalyst that improves the near-term outlook for U.S.-China relations and hence global trade. The problem is that for equities such a catalyst could happen at any time in the form of additional Chinese stimulus. Therefore, higher volatility is the only guaranteed outcome. The sudden onslaught of U.S. pressure makes it harder for Chinese President Xi Jinping to offer structural concessions to his American counterpart without looking weak. It was easier to do so when the threat of tariffs was under wraps, as was the case between December 1 and May 5. This new obstacle informed our decision to close out our long China equities and long copper trades and downgrade our end-June trade deal probability from 50% to 40%. But the escalation of tensions makes stimulus more likely to surprise to the upside, which will at least partially offset the negative hit to global sentiment and the trade outlook. Waiting For A Positive Political Intervention Three negative geopolitical catalysts loom in plain sight, while investors are still waiting on a positive catalyst. The negatives: China has not yet announced retaliation to the U.S. Commerce Department’s blacklisting of Huawei and a handful of other Chinese tech firms; the U.S. could implement the blacklist within three months, increasing the risk of a broader “tech blockade” against China; and the U.S. authorities are prepared to extend tariffs to all Chinese goods in one month. Meanwhile there are no high-level talks currently scheduled between the principal Chinese and American negotiators as we go to press. This could change quickly. But if negotiating teams do not hold substantive meetings with positive reports afterwards, then investors cannot be sure that Presidents Donald Trump and Xi Jinping will speak to each other, let alone finalize a substantive trade deal, at the G20 in Japan on June 28-29. The macro backdrop is hardly encouraging: global export volumes are contracting and the dollar’s fall may be arrested amid a huge spike in global policy uncertainty. Any rebound in the greenback will pile additional pressure onto trade flows, at least until the market sees a substantial increase in Chinese stimulus (Chart 2). Furthermore, it is concerning that President Trump, a businessman president and champion of American manufacturing, is raising tariffs at a time when lending and factory activity are already slowing in the politically vital Midwestern states (Chart 3). The implication is that he is unfazed by economic risks and therefore less predictable. He is pursuing long-term national foreign policy objectives at the expense of everything else. This may be patriotic but it will be painful for global equity investors. Chart 2Trump Unfazed By Deteriorating Global Economy
Trump Unfazed By Deteriorating Global Economy
Trump Unfazed By Deteriorating Global Economy
Chart 3Economic Activity Is Already Slowing
Economic Activity Is Already Slowing
Economic Activity Is Already Slowing
Chart 4Markets Blasé About Looming Risks
Markets Blasé About Looming Risks
Markets Blasé About Looming Risks
It is not only the S&P 500 that is failing to register the dangerous combination of weak global trade and escalating U.S.-China strategic conflict. Our colleague Anastasios Avgeriou of the BCA U.S. Equity Strategy points out that the “Ted spread,” the premium charged on interbank lending over the risk-free rate, is as docile as the safe-haven Japanese yen (Chart 4). President Xi Jinping, however, is not so blasé. He took a trip to Jiangxi province on May 20 to declare that China is embarking on a “new Long March.” This is a reference to the legendary strategic withdrawal executed by the early Chinese Communist Party in its civil war against the nationalists in 1934-35. It was an 8,000-mile slog across the rugged terrain of western and central China, peppered with battles against warlords and nationalists, in which nearly nine-tenths of the communist troops never made it. It is a historical event of immense propagandistic power used to celebrate the CPC’s resilience and ultimate triumph over corrupt and capitalist forces backed by imperialist Western powers. Most importantly, the Long March culminated in Mao Zedong’s consolidation of power over the party and ultimately the nation. In short, President Xi just told President Trump to “bring it on,” as he apparently believes that a conflict with the U.S. will strengthen his rule. The S&P 500 and the “Ted spread” are failing to register the dangerous combination of weak global trade and escalating U.S.-China strategic conflict. Trump, meanwhile, operates on a much shorter time horizon. He is coming closer to impeachment, as House Speaker Nancy Pelosi sharpens her rhetoric and negotiations over a bipartisan infrastructure bill collapse. Impeachment will fail and in the process will most likely help Trump’s reelection chances. But gridlock at home means that one of our top five “Black Swan” risks for 2019 is now being activated: Trump is at risk of becoming a lame duck and is therefore looking for conflicts abroad as a way of stirring up support at home. Bottom Line: The bad news in the trade war is all-too-apparent while good news is elusive. Yet key “risk off” indicators have hardly responded. We recommend going long JPY-USD on a cyclical basis on the expectation that the market will continue to have indigestion until a positive catalyst emerges in the trade talks. Trump’s Trade War Calculus
Chart 5
The trade war is focused on China more so than other states – and Trump likely has the public backing for such a conflict. President Trump delayed any Section 232 tariffs on auto and auto parts imports this month as the China trade war escalated (Chart 5). This confirms our reasoning that the nearly 50/50 risk of tariffs on car imports from Europe and Japan (recently upgraded from 35%) is contingent on first wrapping up a China deal. Another signal that Trump is conscientious not to saddle the equity market with too many trade wars is the decision finally to exempt Canada and Mexico from Section 232 aluminum and steel tariffs (Chart 6). It is now possible for Canada to ratify the deal before parliament dissolves in late June and for the U.S. and Mexico to follow. American ratification will involve twists and turns as the Democrats raise challenges but their obstructionism is ultimately fruitless as it will not hurt Trump’s approval ratings and labor unions largely support the new deal. Meanwhile a major hurdle relating to Mexican labor standards has already been met. These are positive developments for these markets and yet they call attention to a critical point about the Trump administration’s trade strategy: Trump has not shown much willingness to compromise his trade demands with allies in order to secure their cooperation in pressuring China. The threat of car tariffs is still looming over Europe (and even Japan and South Korea). In fact, a united front among these players would have made it much harder for China to resist structural changes (Chart 7). Chart 6Canada And Mexico Are Off The Hook
Canada And Mexico Are Off The Hook
Canada And Mexico Are Off The Hook
Chart 7A 'Coalition Of The Willing' Would Be More Effective
A 'Coalition Of The Willing' Would Be More Effective
A 'Coalition Of The Willing' Would Be More Effective
Nevertheless, we have long held that China, not NAFTA or Europe, would be the focus of Trump’s ire because there is much greater consensus within the U.S. political establishment on the need for a more muscular approach to China grievances, and hence fewer constraints on Trump. This view has now come full circle, at least for the time being. Bear in mind that while Republicans and even Democrats have a favorable view of international trade, in keeping with an improving economy (Chart 8), the U.S. as a whole is more skeptical of free trade than most other countries (Chart 9). The economy is insulated and globalization has operated unchecked for several decades, generating resentment.
Chart 8
Chart 9
Chart 10
This is especially relevant with China. Americans have an unfavorable view of China’s trade practices and China in general (Charts 10 and 11). This perception is getting worse as the great power competition heats up. Even a majority or near-majority of Democrats view China’s cyber-attacks, ownership of U.S. debt, environmental policies, and economic competition as causes of real concern (Chart 12). This means Trump is closer to the median voter when he is tough on China.
Chart 11
Chart 12
The result is a lower chance of a “weak deal,” i.e. a short-term deal to reduce the trade deficit primarily through Chinese purchases of commodities, since this will be a political liability for Trump. He may be forced into such a deal if the market revolts (say 35% odds). But otherwise he will hold out for something better, which Xi Jinping may be unwilling to give. China, not NAFTA or Europe, is the focus of Trump’s ire. This is why we rank “no deal” at 50%, more likely than any kind of deal (40%), though there is some chance of an extension of talks beyond the June G20 (10%). Bottom Line: The delay of auto tariffs and progress in replacing NAFTA suggest that the Trump administration is cognizant of the negative market impact of its trade wars and the need to focus on China. However, the risks to Europe and Japan are not yet removed. And any Chinese concessions will be weaker than might otherwise have been possible had Trump created a “coalition of the willing” to prosecute China’s violations of global trading norms. A weak deal makes it more likely that strategic conflict is the result. Trump Beats Bernie Beats Biden? Or Vice Versa? U.S. domestic politics are also pushing Trump in the direction of conflict with China. The American voter’s distrust of China explains why former Vice President Joe Biden, and leading contender for the Democratic Party nomination in 2020, recently caught flak from both sides of the aisle for being soft on China. At a campaign stop in Iowa on May 1, Biden said, “China is going to eat our lunch? Come on, man … They’re not competition for us.” He has made similarly dovish comments in the recent past. It makes sense, then, that Trump is trying to link “Sleepy Joe” (as he calls Biden) with weakness on China and trade. Biden, who is still enjoying a very sizable bump to his polling a month after formally announcing his candidacy (Chart 13), is a direct threat to Trump’s electoral strategy of maximizing white blue-collar turnout and support, particularly in the Midwestern swing states. Biden was on the ticket when President Barack Obama won these states in 2008 and 2012. He is a native son of Pennsylvania. And he appeals to the same voters as a plain-talking everyman.
Chart 13
Both Biden and Democratic Socialist Bernie Sanders of Vermont are beating Trump in the very early head-to-head polling for the 2020 presidential race. In fact, Sanders has a bigger lead over Trump than Biden in many of these polls (Chart 14).
Chart 14
Yet Sanders has a narrower path to victory in the general election – he is heavily dependent on the Rustbelt, where he could either win based on repeating the 2016 results in a new demographic context (the “Status Quo” scenario in Chart 15), or by winning back the blue-collar voters who abandoned the Democrats for Trump in 2016 (the “Blue Collar Democrats” scenario). Sanders performed well in these states in the Democratic primary in 2016, whereas he struggled in the South.
Chart 15
Chart 16Democrats Swung Too Far Left For Many Independents
Democrats Swung Too Far Left For Many Independents
Democrats Swung Too Far Left For Many Independents
Biden, on the other hand, is capable of winning not only in these two scenarios, but also by rebuilding the Obama coalition. He has a better bid to win over the black community due to his close association with Obama and his command of Democratic Party machinery, plus potentially his choice of running mate (the “Obama vs. Trump” scenario). By this means Biden, unlike Sanders, can compete against Trump in the Sun Belt and South in addition to the Midwest. Therefore, it is all the more imperative for Trump to try to corner Biden and frame the debate about Biden early. Trump may also be betting that despite the head-to-head polling, Sanders is too far left for the median voter. While the Democratic Party swings sharply to the left, the median voter remains more centrist, judging by the fact that independent voters (who make up half the electorate now) only slightly favor Democrats over Republicans, a trend that is only slightly rising (Chart 16). Biden’s polling is strong enough that he holds out the prospect of winning the Democratic nomination relatively smoothly, without deepening the ideological split in the party too much. Whereas Trump would benefit in the general election if Democrats suffered an internal split over a bloody primary season in which Bernie Sanders clawed his way to the nomination. The hit to American farmers is probably not a significant political constraint on President Trump waging his trade war. The upshot is that Trump is vulnerable in U.S. politics and will attempt to take action to strengthen his position. Meanwhile if Biden’s position on trade changes then we will know that he reads the Midwestern voter the same way Trump does – as a protectionist. Bottom Line: Trump’s eagerness to attack Biden reveals the specific threat that Biden poses to Trump’s electoral strategy as well as Trump’s calculus that a belligerent position on China is a vote-getter in the key Midwestern swing states. We expect Biden to become more hawkish on China, which will emphasize the long-term nature of the U.S.-China struggle and confirm the median voter’s appetite for hawkish policy. American Farmers Unlikely To Alter The 2020 Playing Field
Chart 17
Chart 18
Yet can Trump’s political base withstand the trade war? And can he possibly win the swing states if the trade war is escalating and damaging pocketbooks? There are many stories about farmers in the Midwest and other purple states who are deeply alarmed at Trump’s trade policies, prompting questions about whether he could be unseated there. American farmers have been among the hardest hit in the trade war. China was a major market for U.S. agricultural exports prior to the conflict (Chart 17). Since then U.S. agriculture has struggled, as exports to China have declined by more than 50% y/y in 2018 (Chart 18). Agricultural commodity prices are down ~10% since a year ago, with soybeans – the poster child of the conflict – trading at 10 year lows. Net farm incomes – a broad measure of profits – were on a downward trend prior to the trade war (Chart 19). While the USDA estimates that overall U.S. farm income will increase by 8.1% y/y this year, this follows a nearly 18% y/y decline in 2018 to reach the lowest level since 2002 (Chart 20). The recent escalation of the trade war will weigh on these incomes.
Chart 19
Chart 20
A common narrative in the financial media is that this hit to American farmers is a significant political constraint on President Trump in waging his trade war. He could be forced to accept a watered-down deal with China to preserve this voting bloc’s support ahead of November 2020, the thinking goes. Possibly, but probably not because of farmers abandoning the Republican Party en masse. First of all, rural counties and small towns continued supporting the Republican Party in the 2018 midterms, at a time when the initial negative impact of the trade war was front-page news (Chart 21). Second, some of the key farm states are unlikely to be key swing states in the election. Take soybeans, for example. Prior to the trade war, nearly 60% of U.S. soybean exports, and more than a third of U.S. soybeans, ended up in China. Illinois is the top producer, followed by Iowa and Minnesota. Last year soybean production in these three states accounted for 15%, 13%, and 8% of total U.S. production, respectively. As such, agriculture and livestock products exports to China in 1Q2019 are down 76% y/y in Illinois and 97% y/y in Minnesota. However, Trump won Iowa by nearly 150 thousand votes, a 9.4% margin, and there are not enough farmers in the state to overturn that margin. The negative impact on soybeans could prevent Trump from picking up Minnesota, where he lost by only 1.5% of the vote. But Minnesota is unlikely to cost him the White House in 2020. The picture is different in the key swing states of Michigan, Pennsylvania, and Wisconsin. Farming accounts for only ~1% of jobs in Michigan, Ohio, and Pennsylvania – and 2.3% of jobs in Wisconsin – and thus farmers represent a small share of the voting bloc in these states (Chart 22). But Trump won Michigan by a mere 0.23% of the vote, Pennsylvania by 0.72%, and Wisconsin by 0.77%. If one-fifth of farmers in these states switched their vote, Trump’s 2016 margin of victory would vanish.
Chart 21
Chart 22
Of course, manufacturers are a much larger voting bloc (Chart 23). And rural voters are unlikely to shift to the Democrats on such a large scale. Moreover, ag exports from these states have generally held up (Chart 24), the majority of their exports are destined for North America rather than China. The benefit from the recent thaw in North American trade relations will outweigh the loss of China as a market (Chart 25).
Chart 23
Chart 24
The Trump administration is also producing an aid package worth at least $15 billion to shield farmers at least partially from the trade war impact.1 This compares to an estimated $12 billion loss in net farm income in 2018.
Chart 25
Chart 26
Ultimately, Trump is much more threatened by other voting groups in these states. Young voters, women, minorities, suburbanites, and college-educated white voters all pose a threat to his thin margins if they turn out to vote and/or increase their support for the Democratic Party in 2020. A surge in Millennials, for instance, played the chief role in unseating Republican Governor Scott Walker in Wisconsin in 2018 (Chart 26). While midterm elections differ fundamentally from presidential elections, the Republicans lost 10 out of 12 significant elections in the Midwest during the midterms (Table 1). Table 1Republicans Lost Almost All Significant Midwest Elections In The Midterm
Is Trump Ready For The New Long March?
Is Trump Ready For The New Long March?
It is true that the winning Democratic candidates in the six major statewide races in Michigan, Pennsylvania, and Wisconsin all had voters who believed Trump’s trade policies were more likely to “hurt” the local economy than help it, according to exit polls (Chart 27). At the same time, a majority of voters believed that the trade policies either “helped” the local economy or “had no impact,” as opposed to hurting it. And Democrats are somewhat divided on this issue. Health care, not the economy, was the primary concern of voters. Moreover, health care, not the economy, was the primary concern of voters, especially Democratic voters (Chart 28). Republicans cared more about the economy and tended to support Trump’s trade policies.
Chart 27
Chart 28
In sum, unless the trade war causes a general economic slowdown that changes voter priorities, Trump’s chief threat in 2020 comes from urban and suburban voters angry over his attempt to dismantle the Affordable Care Act, rather than from farmers suffering from the trade war. The large bloc of manufacturing workers in the Midwestern battleground states helps to explain why Trump is willing to wage a trade war at such a critical time: loyal rural counties bear the brunt of the economic pain yet a tough-on-China policy could bring out swing voters from the manufacturing sector in suburbs and cities. Bottom Line: Trump could very well lose agriculture-heavy swing states in 2020, but it would not be because of losing his base among rural voters. Rather, it would be a result of a broader economic slowdown – or a superior showing of key demographic groups in favor of Democrats for other reasons like health care. The large bloc of manufacturing voters relative to Trump’s margins of victory helps to explain his aggressive posture on the trade war. Investment Conclusions Go long JPY-USD on a cyclical, 12-month horizon in the context of escalating trade war, complacent markets, and yet the prospect of additional Chinese stimulus improving global growth. This trade should be reinforced by the specific hurdles facing Japan over the next three to 18 months. While we would not be surprised if a trade agreement with the U.S. is concluded quickly, even ahead of any U.S.-China deal, nevertheless Japan faces upper house elections, a potential consumption tax hike, and preparations for a contentious constitutional revision and popular referendum on the cyclical horizon. On the expectation of greater Chinese stimulus, we are maintaining our long China Play Index call, which is up 2.2%. As a hedge against both geopolitical risk and the impact of Chinese stimulus over the cyclical horizon, go long spot gold. Matt Gertken, Vice President Geopolitical Strategy mattg@bcaresearch.com Roukaya Ibrahim, Editor/Strategist Geopolitical Strategy RoukayaI@bcaresearch.com Footnotes 1 While the plan is yet to be finalized, payments of ~$2/bushel to soybean farmers, $0.63/bushel to wheat farmers, and $0.04/bushel to corn farmers are under consideration. Unlike last year when the payments were distributed according to farmers’ current production, a potential modification to this year’s plan is that the payments will be distributed based on this years’ planted acreage and past yields.
Highlights The risk premium in crude oil prices is rising again, as policy risk – and the potential for large policy-driven errors – increases (Chart of the Week).1 This is not being fully reflected in options markets, where implied volatilities are trading close to their long-term average levels (Chart 2). In the past month, risks to oil flows – military and otherwise – and supply have risen, which is keeping a bid under prices. The Sino – U.S. trade war has worsened, and threatens to put global supply chains at risk, along with EM demand growth in the medium term. Meanwhile, amid global monetary easing, the USD has strengthened, producing a more immediate headwind for EM commodity demand. Against this backdrop of opposing forces, oil prices remain elevated and relatively stable in the low $70/bbl range for Brent. Our balances estimates and price forecasts have not changed materially this month. However, the balance of risks has widened in both tails of the price distribution. We expect implied volatilities in the crude oil options markets – particularly Brent – to move higher, as a result. As for prices, we continue to expect Brent to average $75/bbl this year and $80/bbl next year, with WTI trading $7/bbl and $5/bbl below those levels in 2019 and 2020, respectively. Energy: Overweight. The U.S. EIA moved closer to our fundamental assessment and Brent forecast in its most recent market update, lifting its Brent spot-price expectation for this year to an average of $70/bbl, ~ $5/bbl above its April forecast. The EIA’s revision reflects “tighter expected global oil market balances in mid-2019 and increasing supply disruption risks globally.” Base Metals: Neutral. In the wake of Vale’s January supply disaster at its Córrego do Feijão mine, iron ore shipments from Brazil were down 60% in April y/y. Cyclones disrupted supply in Western Australia, pushing 62% Fe iron ore prices to a 5-year high above $100/MT last week. Chinese steelmakers registered a 12.7% y/y gain in crude steel output last month, which, along with dockside iron ore inventory draws of ~ 20 MT ytd, is supporting prices generally. Precious Metals: Neutral. A stronger USD is weighing on gold. Global geopolitical tensions – chiefly in the Persian Gulf and in Sino – U.S. trade relations – are keeping prices above $1,270/oz. We remain long gold as a portfolio hedge. Ags/Softs: Underweight. Severe weather conditions in the Midwest continues to delay corn planting, and is contributing to a rally this week in corn prices to $3.94/bushel on Tuesday, up $3.48/bushel from last week’s level. Feature The risk of a military confrontation between the U.S. and Iran is higher than it was a month ago and rising. Should it erupt, such a confrontation would threaten oil exports from the Persian Gulf through the Strait of Hormuz, where ~ 20% of global supply transits daily.2 Bellicose rhetoric from the U.S. – some of it directed at materially reducing Iran’s influence in Iraq – alternately is ramped up and walked back, while attacks on soft targets in the Kingdom of Saudi Arabia (KSA) – e.g., oil shipping and west-bound oil pipelines – draw attention to the exposure of this critical infrastructure, upon which global oil markets rely.3 Iran, meanwhile, uses the media to prepare its population for further economic deprivation, and to lob its own vituperative rhetoric at the U.S.
Chart 1
Venezuela’s collapse as an oil producer and exporter continues unabated, keeping markets for the heavier sour crude favored by U.S. refiners tight. Civil war threatens to cut into Libyan production, which we are carrying at just over 1mm b/d, while whiffs of another Arab Spring can be detected in Algeria, where popular discontent with ruling elites grows.4 On the demand side, the summer driving season is about to kick off in the Northern Hemisphere, heralding increased gasoline demand. Countering that, the Sino – U.S. trade war shows signs of devolving into a Cold War, which could force a re-ordering of supply chains globally, lifting costs and consumer-level inflation in the process. Longer-term, this could work against central-bank easing globally, and retard growth in EM consumer demand. The risk of a military confrontation between the U.S. and Iran is higher than it was a month ago and rising. Should it erupt, such a confrontation would threaten oil exports from the Persian Gulf through the Strait of Hormuz. For the present, we continue to expect EM demand growth to hold up, expanding by 1.5mm b/d this year and 1.6mm b/d next year. This will be supported by continued monetary easing globally, and additional fiscal stimulus from China if its trade war with the U.S. worsens. There is a chance weakness in DM demand will persist, but we think the odds of a normal seasonal pick-up in 2H19 will continue to support demand overall (Chart 3). That said, given the threats to demand growth – an expanded Sino – U.S. trade war and stronger USD, in particular – we will continue to monitor the health of EM demand closely. Chart 2Brent Implied Volatility Will Move Higher
Brent Implied Volatility Will Move Higher
Brent Implied Volatility Will Move Higher
Chart 3DM Oil Demand Growth Wobbles, EM Steady
DM Oil Demand Growth Wobbles, EM Steady
DM Oil Demand Growth Wobbles, EM Steady
OPEC 2.0 Maintains Production Discipline Chart 4OPEC 2.0's Production Discipline, Strong Demand Drained Inventories
OPEC 2.0's Production Discipline, Strong Demand Drained Inventories
OPEC 2.0's Production Discipline, Strong Demand Drained Inventories
The goal of OPEC 2.0 from its inception at the end of 2016 has been to drain OECD inventories, which swelled to 3.1 billion barrels in July 2016, on the back of a market-share war launched by the old OPEC under the leadership of KSA, and a surge in U.S. shale-oil production. KSA continues to stress the need to restrain crude oil production so as to draw down global oil inventories, and has done much of the heavy lifting this year to make that happen (Chart 4). The other putative leader of OPEC 2.0, Russia, continues to express misgivings with such a strategy, arguing instead the producer coalition should make more oil available to the market. We are more aligned with Russia’s view, and continue to believe OPEC 2.0 will need to increase production. In our balances (Table 1), our base case assumes those producers that can lift production – core OPEC and Russia – will do so to keep prices below $85/bbl (Chart 5). We expect OPEC 2.0 will be able to offset the loss of ~ 700kb/d from Iran exports by increasing production gradually from May to September in proportion to its quota agreement. In our base case, we have Iranian exports falling to 600k b/d. We continue to expect OPEC 2.0 to be able to offset the loss of Venezuela’s production throughout the year, which we expect to fall to 500k b/d by December (vs. ~ 735k b/d presently). Going into next month’s Vienna meeting, we do not expect KSA to dramatically increase production, but would not be surprised if it took production from its current 9.8mm b/d level closer to its OPEC 2.0 quota of 10.33mm b/d in 2H19. Table 1BCA Global Oil Supply - Demand Balances (MMb/d, Base Case Balances)
Policy Risk Sustains Oil's Unstable Equilibrium
Policy Risk Sustains Oil's Unstable Equilibrium
Going into next month’s Vienna meeting, we do not expect KSA to dramatically increase production, but would not be surprised if it took production from its current 9.8mm b/d level closer to its OPEC 2.0 quota of 10.33mm b/d in 2H19. We also expect Russia to lift its production closer to 11.6mm b/d from ~ 11.4mm b/d at present. Even with OPEC 2.0 lifting production ~ 900k b/d in 2H19 vs. 1H19, the bulk of global production increases will be concentrated in the U.S., where we expect shale-oil output to grow 1.2mm b/d this year, and 840k b/d next year. This will account for 85% of the overall increase of 2.4mm b/d we expect in the U.S. this year and next. Our estimates of production growth in the U.S. shales is tempered by a growing conviction the large integrated oil majors and stand-alone E&P companies will continue to put the interests of shareholders above their desire to increase production just for the sake of increasing it, as was done in the past. This is driven by a desire to attract and retain capital, which will be critical to the majors and the big E&Ps in the years ahead.5 We continue to see demand growth exceeding supply growth this year. This will produce a physical deficit, which will continue to drain inventories. Even with these production increases, we continue to see demand growth exceeding supply growth this year. This will produce a physical deficit, which will continue to drain inventories (Chart 6). Chart 5Core OPEC 2.0 Will Lift Production
Core OPEC 2.0 Will Lift Production
Core OPEC 2.0 Will Lift Production
Chart 6Balances Continue To Tighten
Balances Continue To Tighten
Balances Continue To Tighten
Spare Capacity Will Be Stretched
Chart 7
In addition to Iran and Venezuela, we are closely following what appears to be the early stages of another civil war in Libya, which threatens the ~ 1mm b/d of production flowing from there. In addition, we are seeing signs of growing civil discontent in Algeria not unlike that of 2011, which was sparked by popular dissatisfaction with ruling elites throughout the Middle East in the lead-up to the Arab Spring. We have maintained existing spare capacity can handle the loss of Iranian and Venezuelan production and exports we’ve built into our balances and price-forecast models. However, covering these losses will stretch the capacity of global supply to accommodate unplanned outages, which could leave markets extremely tight in the event of production losses in Libya or Nigeria, or in producing provinces prone to natural disasters (e.g., Canadian wildfires or U.S. Gulf hurricanes). At present, markets appear to be comfortable with OPEC 2.0’s ability to cover losses from Iran and Venezuela, given current spare capacity of ~ 3mm b/d, most of which remains in KSA, and continued growth in non-OPEC output (Chart 7). As inventories continue to draw globally, markets’ attention will turn more toward this spare capacity. Expect Higher Volatility We remain long Brent call spreads in July and August 2019, which are up an average 101% since they were recommended in February. These positions benefit from higher prices and higher volatility. Chart 8Geopolitics, Increasing Backwardation Support Higher Brent Implied Volatility
Geopolitics, Increasing Backwardation Support Higher Brent Implied Volatility
Geopolitics, Increasing Backwardation Support Higher Brent Implied Volatility
Our fundamental assessments of supply, demand and inventory levels remain fairly steady. Thus, our price forecasts – $75 and $80/bbl this year and next for Brent, with WTI trading $7 and $5/bbl under that – remain unchanged. With OPEC 2.0 maintaining production discipline and U.S. shale producers maintaining capital discipline, the rate of growth on the supply side will be restrained, and below the rate of growth in global demand. These forces combine to keep inventories drawing this year, which will lead to a steeper backwardation in forward curves, particularly Brent’s (Chart 8). Coupled with true uncertainty re how the U.S. – Iran confrontation in the Persian Gulf is resolved, and how the Sino – U.S. trade war plays out, this steepening backwardation will lead to higher implied volatility in crude oil options markets. Bottom Line: Our expectation of higher prices and steepening backwardation in forward curves is supported by our analysis of fundamentals and the current political economy of global oil markets, which emphasizes policy risk arising from the actions of geopolitically significant states. These factors also will push implied volatility in options markets higher. As a result, we remain long Brent call spreads in July and August 2019, which are up an average 101% since they were recommended in February. These positions benefit from higher prices and higher volatility. We also remain long 2H19 Brent vs. short 2H20 Brent futures in line with our view backwardation will increase; this position is up 155.4% since it was initiated in February, as a result of the steepening of backwardation in the forward curve. Steepening backwardation also will benefit our long S&P GSCI recommendation, which is heavily weighted to energy markets; this position is up 8% since inception. Lastly, we remain long spot WTI, which is up 34.6% since it was recommended in January. Robert P. Ryan, Chief Commodity & Energy Strategist rryan@bcaresearch.com Hugo Bélanger, Senior Analyst Commodity & Energy Strategy HugoB@bcaresearch.com Footnotes 1 In the price decomposition shown in our Chart of the Week, we account for the contribution that changes in global supply, demand and inventory levels make to the evolution of Brent prices, using a proprietary econometric model. We treat the residual term of the model – what’s left of the price decomposition after these fundamental variables are accounted for – as a measure of the risk premium in prices. An expansion of the risk premium – in the positive or negative direction – is coincident with an expansion of the implied volatility of Brent crude oil options typically expands (sometimes with a lag or two), and vice versa. This is intuitively appealing, since risk premia and volatility expand as uncertainty in the market rises. 2 We considered this topic in depth in a Special Report written with BCA Research’s Geopolitical Strategy entitled “U.S., OPEC Talk Oil Prices Down; Gulf Tensions Could Become Kinetic,” published July 19, 2018, and in “Brinkmanship Fuels Chaos In Oil Markets, And Raises The Odds Of Conflict In The Gulf,” published July 5, 2018. Both reports are available at ces.bcaresearch.com. 3 Iran’s influence in Iraq is an internally divisive issue, and a focal point of the U.S., a view we share. Please see, “Iraq: The Fulcrum Of Middle East Geopolitics And Global Oil Supply,” a Special Report we published with BCA Research’s Geopolitical Strategy September 5, 2018. KSA and Western intelligence agencies allege Iran is behind the attacks on Saudi oil infrastructure. Please see “Saudi Arabia accuses Iran of ordering drone attack on oil pipeline,” published by reuters.com. The westbound pipelines in KSA are critical to maintaining the Kingdom’s export capacity, as we noted in “Risk Premium In Oil Prices Rising; KSA Lifts West Coast Export Capacity,” published by BCA Research’s Commodity & Energy Strategy October 25, 2018. This report is available at ces.bcaresearch.com. 4 Please see “Algeria Has a Legitimacy Problem,” posted on the LSE’s Middle East Centre Blog by Benjamin P. Nickels on May 20, 2019, and “Algeria’s Second Arab Spring?” by Ishac Diwan posted at project-syndicate.org March 28, 2019. 5 We will be exploring this topic in depth in a Special Report next month. Investment Views and Themes Recommendations Strategic Recommendations Tactical Trades TRADE RECOMMENDATION PERFORMANCE IN 2019 Q1
Policy Risk Sustains Oil's Unstable Equilibrium
Policy Risk Sustains Oil's Unstable Equilibrium
Commodity Prices and Plays Reference Table Trades Closed in 2019 Summary of Trades Closed in
Policy Risk Sustains Oil's Unstable Equilibrium
Policy Risk Sustains Oil's Unstable Equilibrium
With all U.S. imports from China affected, price rises will percolate upward through all tradable industries and consumer goods. Two points are worth noting: The domestic value-add of Chinese exports to the U.S. is not as low as consensus holds. China’s…
There are at least five reasons for the true cost of a trade war being higher than expected. A trade war would degrade the value of the existing stock of human and physical capital. This would result in lower potential GDP. It would also lead to…
Highlights Duration: We see current bond market behavior as very similar to mid-2016, when heightened political uncertainty obscured the economy’s true strength and kept bond yields lower for longer than was justified by the economic fundamentals. The correct strategy at that time was to sell into the bond market’s strength, and we advocate a similar strategy today. China: Any attempt by the Chinese government to retaliate in the trade war by selling U.S. Treasury securities would be either self-defeating or ineffective, depending on the exact strategy employed. In either case, U.S. Treasury yields will be unaffected. Fed: At least part of the Fed’s dovish turn might represent a desire to send the labor share of national income higher. We introduce a new data series for Fed Watchers to track. Feature The Trump Administration fired the latest salvo in the trade war two weeks ago, expanding tariffs to a broader swathe of Chinese imports. Then last week, the escalation of tensions spilled over to the bond market, sending global yields abruptly lower. Chart 1Flight To Safety
Flight To Safety
Flight To Safety
The 10-year U.S. Treasury yield bounced off 2.35% last Thursday and has since settled at 2.39% (Chart 1). Meanwhile, the overnight index swap curve is now priced for 44 bps of Fed rate cuts over the next 12 months (Chart 1, bottom panel). It is possible, and even likely, that geopolitical tensions will keep yields low during the next month or two. In fact, our Geopolitical Strategy service places the odds of a complete breakdown in trade negotiations by the end of June at 50%.1 But we would encourage investors to sell into rallies, positioning for higher yields on a 6-12 month horizon. To see why, we return to a Weekly Report from early April where we walked through different factors that would be useful in the creation of a macroeconomic model for the 10-year U.S. Treasury yield.2 We consider what has changed during the past six weeks and what those developments mean for bond yields going forward. Back In The Bond Kitchen In early April, we ran through four different factors that should be included in any bond model and suggested macroeconomic indicators that best capture the trends in each. The four factors are: Global Growth: Best proxied by the Global Manufacturing PMI and Bullish Dollar Sentiment Policy Uncertainty: Best proxied by the Global Economic Policy Uncertainty Index Output Gap: Best proxied by Average Hourly Earnings Sentiment: Best proxied by the U.S. Economic Surprise Index We consider each factor in turn. Global Growth Chart 2Monitoring Global Growth
Monitoring Global Growth
Monitoring Global Growth
The Global Manufacturing PMI, our preferred series for tracking global growth, ticked down during the past month, continuing the free-fall that has been in place since the end of 2017 (Chart 2). At 50.3, it is now only slightly above the 50 boom/bust line and is close to where it was in mid-2016, when the 10-year yield hit its cyclical low. But on a positive note, several leading indicators have hooked up in recent months, suggesting that the Global PMI could soon trough and move higher in the second half of the year. Specifically, the ZEW survey of global economic sentiment is off its lows, as is the BCA Global Leading Economic Indicator (LEI). Meanwhile, the Global LEI Diffusion Index has surged, indicating that 74% of the 23 countries in our sample are seeing improvement in their LEIs. Historically, the Global LEI Diffusion Index leads changes in both the Global LEI and the Global Manufacturing PMI (Chart 2, panel 3). Financial market prices that are highly geared to global growth had been singing a similar tune, but they rolled over as trade tensions flared during the past two weeks. For example, cyclical equity sectors recently started to underperform defensive sectors (Chart 2, bottom panel), and the important CRB Raw Industrials index took a nosedive. We place particular importance on the CRB Raw Industrials index as a timely indicator of global growth, because the ratio between the CRB index and gold correlates nicely with the 10-year Treasury yield (Chart 3).3 Unsurprisingly, the ratio’s recent dip coincides with last week’s drop in the 10-year. Several leading indicators have hooked up in recent months, suggesting that the Global PMI could soon trough and move higher in the second half of the year. In addition to the Global Manufacturing PMI, we recommend including a survey of bullish sentiment toward the U.S. dollar in any bond model. More bullish dollar sentiment coincides with lower Treasury yields, and vice-versa. Our preferred survey shows that dollar sentiment remains elevated, but hasn’t changed much since April (Chart 4). The dollar itself, however, has begun to appreciate during the past two weeks (Chart 4, bottom panel). Chart 3A Falling CRB/Gold Ratio...
A Falling CRB/Gold Ratio...
A Falling CRB/Gold Ratio...
Chart 4...And The Greenback Is On The Rise
...And The Greenback Is On The Rise
...And The Greenback Is On The Rise
Bottom Line: The coincident global growth indicators that correlate best with bond yields – the Global Manufacturing PMI and Dollar Bullish Sentiment – are sending a similar message as in April. Meanwhile, leading economic indicators continue to suggest that we should expect improvement in the second half of the year. The biggest change from April is that global growth indicators derived from financial market prices – cyclical versus defensive equities, the CRB Raw Industrials index and the trade-weighted dollar – have responded negatively to heightened political risk. If this weakness persists and eventually infects the economic data, then it could prevent a second-half rebound in global growth, keeping Treasury yields low for even longer. Policy Uncertainty Spikes in the monthly Global Economic Policy Uncertainty Index often cause capital to seek out the safety of U.S. Treasuries, and we recommend including this index in any macroeconomic bond model (Chart 5A). Spikes in the monthly Global Economic Policy Uncertainty Index often cause capital to seek out the safety of U.S. Treasuries. While there have been no updates to the monthly index since the trade war’s recent escalation, one of its components – a daily index that tracks the number of relevant news stories – has surged during the past two weeks (Chart 5B). This clearly illustrates that a sharp increase in political uncertainty has been the catalyst for the bond market rally. Investors are obviously concerned that an ongoing and intensifying trade war might derail the economic recovery, and they are seeking out Treasuries as a hedge. Chart 5AGlobal Uncertainty Set To Spike
Global Uncertainty Set To Spike
Global Uncertainty Set To Spike
Chart 5BMarkets Are Concerned
Markets Are Concerned
Markets Are Concerned
In such situations, the traditional playbook is to fade any purely uncertainty-driven rally, on the view that markets tend to overreact to headline risk. This strategy worked well following the mid-2016 Brexit vote. The uncertainty shock from the vote sent the 10-year quickly down to 1.37%, but it then increased in the second half of the year when it became apparent that the economic recovery would continue. While higher tariffs will certainly be a drag on growth going forward, accommodative Fed policy and a probable increase in Chinese economic stimulus will mitigate the impact, keeping the economic recovery intact.4 Output Gap Chart 6Wages Are Headed Higher
Wages Are Headed Higher
Wages Are Headed Higher
The output gap is a concept that represents where the economy is operating relative to its peak capacity, and its progress during the past three years is the main reason why bond yields will not re-test 2016 lows. We have found that wage growth is the most reliable way to measure the output gap: higher wage growth signals less spare capacity, and less spare capacity coincides with higher bond yields. We recommend Average Hourly Earnings as the best wage measure to include in any bond model. Since April, average hourly earnings growth has been roughly flat, but leading indicators suggest that further acceleration is highly likely in the coming months (Chart 6). While the Fed is keen to let wage growth accelerate, rising wage growth also makes a rate cut difficult to justify. The combination of rising wage growth and an on-hold Fed should put a rising floor under long-maturity bond yields. Sentiment The final factor that should be included in any bond model is sentiment. In April, we suggested that the U.S. Economic Surprise Index is the best measure of sentiment. When the surprise index has been deeply negative for a long time, it usually means that investors are downbeat on the economy and that the bar for a positive surprise is low. This has actually been the case in recent months, and our simple auto-regressive model suggests that the surprise index is biased higher (Chart 7). Positioning data confirm this message, and in fact show that investors are taking as much duration risk as they were when yields troughed in mid-2016 (Chart 8). Chart 7Low Bar For Positive Surprises
Low Bar For Positive Surprises
Low Bar For Positive Surprises
Chart 8Similar Positioning As In Mid-2016
Similar Positioning As In Mid-2016
Similar Positioning As In Mid-2016
The overall message is that bond investors have a very dim view of the economy, and it will not take much positive news to send yields higher. Investment Strategy We see current bond market behavior as very similar to mid-2016, when heightened political uncertainty obscured the economy’s true strength and kept bond yields lower for longer than was justified by the economic fundamentals. The correct strategy at that time was to sell into the bond market’s strength, and we advocate a similar strategy today. Timing when the next move higher in bond yields will occur is difficult, but we take some comfort in the fact that the flatness of the yield curve makes it less costly than usual to carry below-benchmark duration positions. In fact, the average yield on the Bloomberg Barclays Cash index is 7 bps higher than the average yield on the Bloomberg Barclays Treasury Master Index. Bond investors have a very dim view of the economy, and it will not take much positive news to send yields higher. To further mitigate the cost of keeping duration low, we advocate taking duration-neutral positions that are short the belly (5-year & 7-year) part of the yield curve and long the very long and very short ends of the curve. Such trades are also provide a positive yield pick-up, and will earn capital gains when Treasury yields move higher.5 A Quick Note On China’s Treasury Purchases Chart 9Do Not Expect Treasuries To Be Used As A Weapon In This War
Do Not Expect Treasuries To Be Used As A Weapon In This War
Do Not Expect Treasuries To Be Used As A Weapon In This War
The trade war’s recent escalation has led some to speculate that China could retaliate against higher tariffs by dumping U.S. Treasury securities onto the open market. The speculation only increased when the TIC data revealed that Chinese net Treasury purchases totaled -$24 billion in March, the most deeply negative figure since October 2016 (Chart 9). We see low odds that China will employ this tactic in the trade war, and no meaningful impact on Treasury yields in any case. To see why, let’s consider two possible scenarios. In the first scenario, China sells a large amount of U.S. Treasury securities and keeps the proceeds from the sales in its domestic currency. Assuming the amounts in question are sufficiently large, these transactions would cause the RMB to appreciate and lead to a tightening of Chinese monetary conditions. Tighter monetary conditions are exactly what the Chinese government does not want as it seeks to counteract the negative economic impact from tariffs. In fact, China is much more likely to engineer a further easing of monetary conditions, much like in 2015/16 (Chart 9, bottom panel). In the second scenario, China could sell U.S. Treasuries and purchase other foreign bonds (German bunds, for example). This would nullify any impact on Chinese monetary conditions, but it would not have much impact on U.S. Treasury yields. With Chinese money still flowing into global bond markets, the re-balancing would only push other investors out of non-U.S. bond markets and into U.S. Treasuries. Without changing the overall demand for global bonds, it is difficult to envision much of an impact on U.S. yields. Bottom Line: Any attempt by the Chinese government to retaliate in the trade war by selling U.S. Treasury securities would be either self-defeating or ineffective, depending on the exact strategy employed. In either case, U.S. Treasury yields will be unaffected. A New Data Series For Fed Watchers: Rich’s Ratio A number of recent Fed speeches have referred to the time series plotted in Chart 10: The share of national income going to labor, as opposed to corporate profits. Chart 10Introducing Rich's Ratio
Introducing Rich's Ratio
Introducing Rich's Ratio
Vice-Chair Richard Clarida brought this analysis to the Fed, and the data series was actually once dubbed “Rich’s Ratio” by Clarida’s old PIMCO colleague Paul McCulley. The idea behind Rich’s Ratio is that while some late-cycle wage gains are passed through to prices, a portion also eat into corporate profits. Notice in Chart 10 that Rich’s Ratio has a tendency to rise late in the economic recovery. Based on his past writings, we would not be surprised if at least part of the Fed’s recent dovish turn represents a desire to send Rich’s Ratio higher, even if that goal might entail a modest overshoot of the Fed's 2 percent inflation target. We will have more to say about Rich’s Ratio in the coming weeks. For now, we simply want to make Fed Watchers aware that they have a new series to track. Stay tuned. Ryan Swift, U.S. Bond Strategist rswift@bcaresearch.com Footnotes 1 Please see Geopolitical Strategy Weekly Report, “How Trump Became A War President”, dated May 17, 2019, available at gps.bcaresearch.com 2 Please see U.S. Bond Strategy Weekly Report, “Bond Kitchen”, dated April 9, 2019, available at usbs.bcaresearch.com 3 The rationale for why the CRB/Gold ratio tracks the 10-year Treasury yield is found in U.S. Bond Strategy Weekly Report, “The Search For Aaa Spread”, dated March 12, 2019, available at usbs.bcaresearch.com 4 Please see Global Investment Strategy Weekly Report, “Tarrified”, dated May 16, 2019, available at gis.bcaresearch.com 5 Please see U.S. Bond Strategy Weekly Report, “Paid To Wait”, dated February 26, 2019, available at usbs.bcaresearch.com Fixed Income Sector Performance Recommended Portfolio Specification
Highlights We’ve searched in vain for imminent domestic weakness in the U.S. economy, … : Much of our work this spring has focused on trying to poke holes in our view that the equilibrium fed funds rate remains above the target fed funds rate, but we haven’t found any evidence of overheating in the real economy, or worrisome excesses in financial markets. … but an exogenous shock could well precipitate a recession if it were serious enough: The U.S. is a comparatively closed economy, but there’s no such thing as full-on decoupling. The U.S. may react more slowly than other major economies to what’s going on in the rest of the world, but it’s not immune to it. A trade war would threaten global growth, … : U.S.-China trade negotiations have taken center stage over the last couple weeks, and escalating tension between the world’s two largest standalone economies will surely cast a pall over the global outlook. … but there are other potential threats that bear monitoring: Tensions with Iran could be the catalyst for an oil price shock, while a significant rollback of globalization could crimp corporate profit margins. Either would hasten the end of the equity bull market and the expansion. Feature Tight monetary policy is a necessary, if not sufficient, condition for a recession. We deem policy to be tight if the fed funds rate exceeds our estimate of the equilibrium fed funds rate, and easy if it is below our estimate of equilibrium. Over the six decades for which we compute an estimate of the equilibrium fed funds rate, the U.S. has only ever experienced recessions when the fed funds rate has exceeded our estimate of equilibrium (Chart 1). Tight policy isn’t always tantamount to a recession – nothing came of tight settings in 1984 or 1995 – but recessions don’t occur without it. Chart 1Recessions Only Occur When Monetary Conditions Are Tight
Recessions Only Occur When Monetary Conditions Are Tight
Recessions Only Occur When Monetary Conditions Are Tight
We currently estimate that the equilibrium fed funds rate, a.k.a. the neutral rate, is about 3⅛%, and we continue to project that it will be around 3⅜% by the end of the year. Those estimates leave the Fed with plenty of headroom before it materially slows the economy. If our estimate is on the money, it will take four more rate hikes to induce an inflection in the business cycle. We have not seen anything in the ongoing flow of macro data, or evidence of excesses in the financial markets, that would suggest a recession is already under way or is lurking around the corner. Internal dynamics should continue to support the expansion, but threats from outside the U.S. are growing. We therefore conclude that the next recession may well not arrive for another two years, in the absence of a significantly adverse exogenous event. This week, we extend our focus beyond the U.S. to try to uncover the external threats that could stop the U.S. economy, and the bull markets in risk assets, in their tracks. Beyond the tariff fireworks, we also contemplate the possibility that conflict with Iran could lead to an oil price shock, and the impact of a significant rollback of globalization. It is not our base case that any of the various external threats will tip the U.S. into a recession, but investors should keep tabs on the biggest ones. Tariffs The U.S.-China trade saga has unfolded in three pairs of moves and counter-moves (Diagram 1). While the aggregate $50bn worth of Chinese goods tariffed in the first two salvos mostly targeted industrial equipment and machinery, the third installment, covering $200bn worth of imports, extended the tariffs’ reach to consumer products. Major categories included not only commodities such as base metals, chemical products and mineral fuels and oils, but also a broad swath of foods, textiles, electronics, vehicles and spare parts. After a three-month cease-fire, the developments of the last two weeks arguably marked the most significant escalation of tensions on both sides. The U.S. is now threatening to levy tariffs on the remaining $325bn of Chinese goods that have so far been spared. Diagram 1Anything You Can Do
External Threats
External Threats
Our colleagues at BCA’s Geopolitical Strategy service suggest that recent foreign policy initiatives indicate that the White House does not feel any particular pressure to minimize economic risk this far ahead of the election. The risk of market-disruptive measures has therefore increased, and they see a 50-50 chance that the U.S. and China will fail to reach an accord (Table 1). Although the administration has delayed any action on autos and auto parts for now, Europe could be the next trade partner in its cross hairs. The odds that Section 232 (national-security-threat) tariffs will be levied on European auto imports is rising (Chart 2). Table 1U.S.-China Trade War: Probabilities Of A Deal By End Of June 2019
External Threats
External Threats
Chart 2
These heightened trade tensions may delay the global growth recovery that we were expecting to bloom in the summer, and they may also allow the dollar to keep advancing. The greenback is a countercyclical currency, moving inversely with global activity (Chart 3), and a bump in the road for global growth would likely extend its upward run. Chart 3The Countercyclical Dollar
The Countercyclical Dollar
The Countercyclical Dollar
Although a strong dollar would be a headwind for exporters, the U.S. economy is comparatively closed. Tariffs are likely to exert the greatest pressure on the economy via softer consumption and investment. So far, the available evidence suggests that U.S. consumers and corporations have borne the brunt of higher tariffs in the form of higher retail prices and lower profit margins.1 Iran Our geopolitical strategists contend that investors have underrated conflict with Iran as a market risk for a while. Now that the contentiousness of U.S.-Iran relations has ratcheted higher upon the administration’s decision not to extend the import waivers on Iranian oil, the issue is back in the spotlight. Our strategists caution that managing the dispute may require more delicacy than the more hawkish elements of the administration realize. In their view, the potential for a misstep increases the odds of a recession and poses a significant risk to the equity bull market. In a joint Special Report by our Commodity and Energy Strategy and Geopolitical Strategy services at the beginning of the month, our in-house experts stressed that there are multiple moving parts driving the supply-demand balance in the global oil market.2 Investors should realize that the world faces the prospect of the loss of Venezuelan production (approximately 600,000 barrels per day (b/d)) and significant outages in Libya (~600,000 to 800,000 b/d), in addition to our strategists’ base-case estimate of 700,000 b/d from Iran’s current 1.3 million b/d output. BCA does not expect that all of that output will be lost, but the key point is that Iran is not the only potential source of a supply shortfall. Our energy strategists believe that OPEC 2.0 – the producer coalition led by Saudi Arabia and Russia, and supported by Saudi Arabia’s OPEC allies – has the capacity to make up for even their larger shortfall scenarios (Chart 4). The problem is that OPEC 2.0 may not have the will to do so in a timely fashion. Saudi Arabia and the rest of the OPEC 2.0 coalition were caught completely off guard by the administration’s issuance of import waivers in November, after they had ramped up production at its request to limit the market disruptions that would have ensued when Iran’s output was taken off the market. The last-minute waiver decision caused oil prices to crater in the wake of a supply glut that OPEC 2.0 has been working to sop up ever since (Chart 5).
Chart 4
Chart 5... But The Oil Market Is Pretty Tight
... But The Oil Market Is Pretty Tight
... But The Oil Market Is Pretty Tight
OPEC 2.0’s members may feel that they were badly used last fall, and may not be inclined to move proactively now. Russia is managing its own low-grade conflict with the U.S., and all of the coalition should bear in mind that the U.S. could release over a million b/d from its Strategic Petroleum Reserve (SPR) for a solid six to nine months, according to our energy team’s estimates. If rising oil prices are often viewed as a tax on American consumers, a late summer/early fall release of holdings could be viewed as an election rebate, courtesy of the skilled economic managers in the White House. Our team expects that OPEC 2.0 will likely guard against an oversupply-driven swoon in oil prices by managing its production on something akin to a just-in-time inventory strategy. Our energy and geopolitical strategists caution that there are two other ways the administration may overplay its hand. First, it might overestimate U.S. shale drillers’ ability to export their production. While new pipeline construction will relieve the transportation bottleneck limiting the Permian Basin output that reaches the Gulf of Mexico, oil exports from the Gulf are limited by a shortage of deep-water harbor facilities. If global trade tensions do worsen, both the dollar and U.S. equities may attract safe-haven flows. There is also the possibility that Iran might strike at Iraq, putting some of its 3.5 million b/d output at risk. It could also make good on its repeated threat to close the Straits of Hormuz, through which nearly a fifth of global oil supplies travel daily. Either of these options would dramatically escalate the conflict, but a desperate Iran might pursue them if it felt cornered. The bottom line is that the probability of an oil price shock is not negligible. Brinkmanship with Iran could upset a delicate supply-demand balance in global oil markets, and a delicate geopolitical balance in the Middle East. If the Volcker double-dip is treated as a single event, a surge in oil prices has preceded every recession in the last 45 years, except for the 2001 recession precipitated by the bursting of the dot-com bubble (Chart 6). Chart 6Oil Price Spikes Often Precede Recessions
Oil Price Spikes Often Precede Recessions
Oil Price Spikes Often Precede Recessions
Significant Rollback Of Globalization Our Geopolitical Strategy and Global Asset Allocation services have cited peak globalization as an important long-term investment theme for the last several years. The tariff tensions between the U.S. and its trading partners would seem to have borne out their predictions, especially if one views them as having been inspired by unskilled workers’ losses from globalization. Taking on foreign exporters is likely to play well in the electorally decisive Rust Belt states, where manufacturing job losses have hit especially hard. We fully subscribe to the theory of comparative advantage as formulated by David Ricardo in the early 19th century. By allowing individual countries to specialize in what they do best, free trade increases the size of the global economic pie. Empirical evidence suggests that globalization also re-slices the pie, however. In the developed world, outsourcing manufacturing has operated to the benefit of investors and the detriment of less-skilled workers. For U.S.-based multinationals, tariffs are a minor irritant compared to the prospect of having to reroute supply chains around China. The modest headwinds to globalization observed before the U.S. began engaging in serial bilateral trade conflicts did not undermine corporate profit margins in any material way. A bigger anti-globalization push that forced global supply chains to be rerouted or partially unwound would have much more negative effects. The U.S. is a comparatively closed economy, but the multinationals that dominate equity market capitalization rely heavily on interactions with the rest of the world. Unwinding the global supply chains that have been carefully constructed over the last 30 years would be disruptive and costly. The worst-case scenario envisioned by our geopolitical strategists, in which U.S.-China relations dramatically worsen and the tariff back-and-forth escalates in a major way, would hit equities hard, especially if supply chains had to be rebuilt. As a proxy for what globalization has meant for investors’ and blue-collar workers’ share of the pie, we consider the path of real wages relative to productivity over the last 50 years. From 1970 through 2001, U.S. wages generally kept pace with productivity gains, observing a fairly narrow, well-defined range (Chart 7). Once China entered the WTO (as denoted by the vertical line on the chart), productivity-adjusted wages fell precipitously, and even their periodic bounces have fallen well short of the level that marked the lower end of the previous range. Chart 7The Pie Has Grown, But Unskilled Labor's Slice Has Shrunk
The Pie Has Grown, But Unskilled Labor's Slice Has Shrunk
The Pie Has Grown, But Unskilled Labor's Slice Has Shrunk
Bottom Line: Temporary barriers to free trade, implemented as a negotiating tactic, are not a big deal for equities. A significant rollback of globalization would be, however, and a need to divert global supply chains away from China could stop the bull market in its tracks. Investment Implications Along with our Global Investment Strategy colleagues, we are somewhat more sanguine than our Geopolitical Strategy service that a worst-case outcome between the U.S. and China can be averted. We therefore continue to believe that the U.S. expansion, and the bull markets in risk assets, will persist until the Fed tightens monetary conditions enough to spark the next recession. We reiterate our recommendations that investors should maintain at least an equal weight position in equities and spread product. Enough is at stake in the conflicts with China and Iran, however, that a worsening of either could cause us to change our view, and we will be watching developments on each front closely. Doug Peta, CFA Chief U.S. Investment Strategist dougp@bcaresearch.com Jennifer Lacombe Senior Analyst, Global ETF Strategy jenniferl@bcaresearch.com Footnotes 1 Mary Amiti, Stephen J. Redding, and David E. Weinstein, “The Impact of the 2018 Trade War on U.S. Prices and Welfare,” NBER Working Paper No. 25672, (March 2019). 2 Please see Commodity & Energy Strategy/Geopolitical Strategy Special Report, “U.S.-Iran: This Means War?,”dated May 3, 2019, available at ces.bcaresearch.com.
Highlights So What? Odds of a total breakdown in U.S.-China relations are highly underrated. Why? The key market-relevant geopolitical event is Trump’s large risk appetite. Inflationary pressures resulting from the trade tariffs are not prohibitive for Trump’s trade war. Chinese stimulus will surprise to the upside, but a massive stimulus package will depend on talks collapsing and maximum tariffs. Markets will sell before they recover. We will maintain our current portfolio hedge of Swiss bonds and gold. Feature Chart 1Equities Sell, Safe Havens Rally
Equities Sell, Safe Havens Rally
Equities Sell, Safe Havens Rally
Global equities have sold off and safe-haven assets caught a bid since the near-breakdown in U.S.-China trade negotiations on May 5 (Chart 1). Yet financial markets are still complacent, as the 2.8% drawdown to date on global equities and the S&P 500 does not yet reflect the depth of the geopolitical risk to sentiment and corporate earnings. To understand this risk we need to step away from the ups and downs of the trade negotiations and ask, What have we learned about U.S. policy over the past month and what does it mean for global markets on a cyclical and structural horizon? We have learned that in the lead-up to the 2020 election, President Trump is not seeking to protect his greatest asset – namely, a strong American economy – but rather to solidify his support through new ventures. By imposing the full brunt of sanctions on Iran and hiking the tariff rate on Chinese imports, Trump has made two highly significant decisions that could jeopardize the American voter’s pocketbook, with a full 18 months to go before November 3, 2020. Why has he done this? Because he believes the American economy can take the pain and he will achieve resounding foreign policy successes. These, he hopes, will make his reelection more likely. President Trump’s aggressive posture is a direct threat to the global equity bull market due to (1) higher odds of a negative shock to global trade when global growth is already weak, and (2) higher odds of an oil price shock due to a potential vicious spiral of Middle East conflict. Wreaking Havoc Historically, the United States thrives when the rest of the world is in chaos. This was obviously the case during World War I and II (Chart 2). But it also proved true in the chaotic aftermaths of the Soviet Union’s collapse and the global financial crisis, though the U.S. did suffer along with everyone else during the 2008-09 downturn. American equities have generally outperformed during periods of global chaos (Chart 3). Chart 2America Thrives Amid Global Chaos
America Thrives Amid Global Chaos
America Thrives Amid Global Chaos
Chart 3U.S. Equities Outperform During Global Crises
U.S. Equities Outperform During Global Crises
U.S. Equities Outperform During Global Crises
The reasons for U.S. immunity are well known: the U.S. has a large, insulated, consumer-driven economy; it has immense economic advantages enhanced by its dominance of North America; it has vast and liquid financial markets; and it is the world’s preponderant technological and military power. This position enables Washington to act more aggressively than other capitals in pursuit of the national interest – and to recover more quickly from mistakes. Chart 4U.S. Preponderance Declining
U.S. Preponderance Declining
U.S. Preponderance Declining
It follows that there is an influential idea or myth that the country can or should exploit this advantage, when necessary or desirable, by “wreaking havoc” abroad. The prime example is the preemptive invasion of Iraq. In this way Washington can turn the tables on its opponents and keep them off balance. The Trump administration, regardless of Trump’s intentions, could soon become the epitome of this school of thought. First, it is true that, structurally, American preponderance has been decreasing: despite various crises, there has been sufficient peace and prosperity in the twenty-first century to see the rest of the world’s wealth, trade, and arms grow relative to the United States (Chart 4). With the rise of China and resurgence of Russia, U.S. global leadership is at risk and the Trump administration has adopted unorthodox policies to confront its rivals and try to reverse this process. Second, cyclically, President Trump is stymied at home after his Republican Party lost the House of Representatives in the 2018 midterm election. Scandals and investigations plague his inner circle. Unable to secure funding for his signature campaign promise – the southern border wall – Trump faces the risk of irrelevance. Foreign policy, especially trade policy, thus becomes the clearest avenue for him to try to notch up victories. Trump faces the risk of irrelevance. Foreign policy thus becomes the clearest avenue for him to try to notch up victories. Bottom Line: The key market-relevant event over the past month has been the Trump administration’s demonstration of voracious risk appetite. This is fundamentally a cyclical not tactical risk to the bull market due to tit-for-tat tariffs, sanctions, and provocations with rivals like China and Iran. Pocketbooks Versus Patriotism Trump’s vulnerability becomes clear by looking at our electoral Map 1, which highlights his excruciatingly thin margins of victory in the critical “swing states” in the 2016 election. We emphasize the margin of victory among white voters – which are slightly higher than the margins overall – because the Trump campaign courted the white working class specifically in a calculated strategy to swing the Midwest “Rustbelt” states and win the election.
Chart
The problem for Trump is that while whites remain the majority of the eligible voting population, it is a declining majority due to demographic change. Demographics is not near-term destiny, but the vanishingly thin margins ensure that Trump cannot assume that he will win reelection without generating even more turnout and support among blue-collar whites in the key states.
Chart 5
Job creation and rising incomes are the chief hope. The problem is that Trump’s tax cuts and the red-hot economy in 2018 did not prevent Republicans from getting hit hard in the midterm elections, especially in the Midwest. Moreover today’s resilient economy is not preventing the top two Democratic candidates, former Vice President Joe Biden and independent Vermont Senator Bernie Sanders, from beating Trump in head-to-head polling in the key swing states (Chart 5). Trump’s national approval rating, at about 44%, is nearly as good as it gets, but the indications from the Midwest are worrisome, especially because the economy has slowed. If the economy is not winning the argument on the campaign trail in 2020, Trump will need to have another leg to stand on. In addition to hammering home his attempts to build a wall on the border, Trump will highlight his economic nationalism. Protectionism has won the Rustbelt over the past three elections. As we have since 2016 argued, this now boils down to pressure on China. If Trump’s policies provoke China (or Iran) to take aggressive actions, he will have a pretext to exercise American power in a way that will likely create a rally-around-the-flag effect, at least in the short term. Elections do not normally hinge on foreign policy, but they certainly can. While President Trump may not actually want a war with Iran, he knows that George W. Bush cruised to victory amid the Afghan and Iraqi wars. Or he may have in mind 1964, when Lyndon B. Johnson crushed Barry Goldwater, an offbeat, ideological “movement candidate” (can anyone say Bernie Sanders?) in the face of a hulking communist menace, the Soviet Union. A conflict with China (or Iran) could serve similar purposes in 2020, either distracting the populace from a weakening economy or adding to an election bid centered on a reaccelerating economy. The problem is that a patriotic conflict with China or Iran is an insurance policy that threatens to undermine the health and safety of the very thing being insured: the U.S. economy. Indeed, U.S. stocks did not outperform after the September 11th attacks or during the Bush administration’s wars abroad. In essence, Trump is a gambler and is now going for broke. This constitutes a huge risk to the global economy and financial markets – a risk that was subdued just a month ago due to oil sanction waivers and tariff-free trade talks. Bottom Line: President Trump is courting international chaos because his policy priorities are tied down with gridlock and scandal at home. Aggressive foreign policy is a strategy to rack up policy victories and potentially expand his voter base, but it comes at the risk of higher policy uncertainty and negative economic impacts that could derail this year’s fledgling economic rebound and the long-running bull market. “No Deal” Is More Likely Than A Weak Deal It wasn’t just a tweet that sent volatility higher over the past two weeks. Most likely, President Trump decided to raise tariffs on China at the advice of his trade negotiators, who had become convinced that China was not offering deep enough concessions (“structural changes”) and was playing for time. This was always the greatest risk in the trade talks. China is indeed playing for time, as it has no security guarantee from the United States and therefore cannot embrace structural changes in the way that Japan did during the U.S.-Japanese trade war in the 1980s. Originally, the talks were set to last 90 days with the tariff hike by March 1. Trump was apparently determined not to lose credibility on this threat as China drew out the negotiations. Hence, he piled on the pressure to try to force a conclusion by the June 28-29 G20 summit in Japan, which has been the target date for our trade war probabilities over the past several months (Table 1). We have now adjusted those probabilities to upgrade the risk that talks collapse (50%) and downgrade the odds of a deal to 40% by that date. Table 1U.S.-China Trade War: Probabilities Of A Deal By End Of June 2019
How Trump Became A War President
How Trump Became A War President
The underlying calculation from the Trump administration is that a cosmetic, short-term deal – along the lines of the NAFTA renegotiation – will be difficult to defend on the campaign trail and hence politically risky. We upgraded the risk that talks collapse (50%) and downgraded the odds of a deal to 40% by end of June. If China agreed arbitrarily to increase imports from the U.S. by 10% by 2020, it would only increase the level of imports above the pre-trade war 2015-18 trend by $23 billion dollars in 2029 (Chart 6, panel 1). It would also have a minimal impact on the trade deficit. The deficit has increased so much in recent years that the impact of a 10% increase in exports by 2020 would merely offset the high point we reached during the trade war, leaving Trump with a mere $800 million per year by 2029 (Chart 6, panel 2).
Chart 6
For commodities in particular – where China offered the largest purchases – the negative impact of the trade war has been so great that a 10% increase by 2020 over the status quo would fail to offset the recent damages over a ten-year period. China would have to increase imports by at least 17% to offset the trade war-induced decreases. If commodity imports were 30% higher in 2020 than otherwise, the impact 10 years down the line would amount to a mere $11 billion per year. These gains are smaller, as Chinese negotiators have long argued, than what could be made if the U.S. increased exports of advanced technology products to China. If the U.S. exported as many of these products to China as it does to the EU, as a share of EU GDP, it would amount to a $48 billion increase in exports. For Japan, the equivalent would be an $85 billion increase. Increasing the growth of these exports to China to match the recent trend of such exports globally would nearly double the amount sent to China by 2029, earning the U.S. an additional $60 billion that year (Chart 6, panel 3). The problem, of course, is that the confrontation with China is specifically focused on the latter’s technological acquisition and competition with the United States – it is precisely not about making reductions to the trade deficit at the expense of technological superiority. The tech war is more likely to derail the trade talks than the trade talks are likely to resolve the tech war. It is hugely significant that, at the moment of decision, President Trump sided with U.S. Trade Representative Robert Lighthizer and did not accept a deal focused on marginal improvements to the trade deficit. There was always a strong possibility – we previously put it at a 50% chance – that Trump would accept a short-term deal in order to get a “quick win” and minimize tariff pains ahead of the election, while punting the longer-term structural grievances until his second term when he would be less constrained by the economy. But this possibility has clearly fallen. We now put it at 35%, as shown in Table 1 above. Trump sees a shallow deal as a political liability. The most important takeaway from Table 1, however, is that the odds of a “Grand Compromise” have dropped to a mere 5%. Trump still may settle for a deal to reduce economic risks ahead of the election, but a grand compromise is very hard to get. Bottom Line: Our adjusted trade war probabilities suggest that global equities can fall further on a tactical horizon and that downside risks are grave, given a 50% chance that talks utterly collapse by the end of June. This would include a 30% chance of igniting an intense period of saber-rattling, sanctions, and Cold War-esque tensions that would cause a global flight to quality. Won’t The Trade War Turn Voters Against Trump? No.
Chart 7
While geopolitical and political constraints push against a weak deal, the economic constraints of a failure to conclude a deal are not prohibitive. The latest tariff hike doubles the dollar magnitude of the tariffs, and an additional 25% tariff on the remaining $300 billion of imports would more than quadruple the magnitude of the tariffs from the April 2019 level (Chart 7). With all U.S. imports from China affected, price rises will percolate upward through all tradable industries and consumer goods. A few points are worth noting: The domestic value-add of Chinese exports to the U.S. is not as low as consensus holds. China’s manufacturing sector is highly competitive, comparable to the EU and Germany in the degree to which its exports to the U.S. incorporate foreign value (Chart 8). This means that Americans cannot substitute other goods for Chinese goods as easily as one might think.
Chart 8
There remains a massive gulf between the nominal output of China’s manufacturing sector and the rest of Asia (Chart 9). Strategically it makes sense for the U.S. to want to decrease China’s share of American imports from Asia and reduce China’s centrality to the production process. But Asia cannot yet substitute for China. In practical terms this requires spreading China’s concentrated production system across the Indonesian archipelago. It is inefficient and will raise costs and import prices. Even in areas where China is lacking – such as technology, institutions, and governance – it still has a productivity advantage over the rest of Asia, pointing yet again to the cost-push inflationary consequences of an abrupt transition forced by tariffs (Chart 10). Chart 9Asia Cannot Replace China ... Yet
Asia Cannot Replace China ... Yet
Asia Cannot Replace China ... Yet
Chart 10China's Productivity Beats Rest Of Asia
China's Productivity Beats Rest Of Asia
China's Productivity Beats Rest Of Asia
Nevertheless, these cost factors are not so great as to force Trump into a weak deal. While the new and proposed tariff expansions will impact consumer goods more than the earlier batches that attempted to spare the consumer, the truth is that Chinese imports do not comprise a large share of the U.S. consumer basket (Chart 11). Chart 11American Shoppers Not Too Exposed To China
American Shoppers Not Too Exposed To China
American Shoppers Not Too Exposed To China
Chart 12Goods Price Inflation Not An Immediate Risk
Goods Price Inflation Not An Immediate Risk
Goods Price Inflation Not An Immediate Risk
Goods prices have been flat in the U.S., albeit in great part because of China, and they have fallen while the consumer price index and the real wage component of the CPI have risen by more than 20% since 2001 (Chart 12). Moreover, it is precisely in consumer goods where the American shopper does have considerable ability to substitute away from China – as opposed to the American corporation, which will have a harder time replacing Chinese-made capital goods quickly (Table 2). Thus, the risk impacts Wall Street differently than Main Street. Table 2Capital Goods Harder To Substitute
How Trump Became A War President
How Trump Became A War President
Further, the median American household’s real income growth is still elevated (Chart 13). This comes on top of the fact that net household worth and the saving rate are both in good shape. President Trump has some leeway in waging his trade war. The risk, of course, is that this income growth is decelerating and Trump has given the tariffs 18 months to cause negative impacts for consumers prior to the election. He is also simultaneously wagering that the U.S.’s newfound energy independence – and his own ability to tap the strategic petroleum reserve – will prevent gasoline prices from spiking (Chart 14). This would occur as a result of any Iranian-backed attacks on oil production and export facilities across the Middle East. Chart 13American Household Still In Good Shape
American Household Still In Good Shape
American Household Still In Good Shape
Chart 14Fuel Prices Already Rising
Fuel Prices Already Rising
Fuel Prices Already Rising
Bottom Line: Inflationary pressures will result from trade tariffs (and Iranian sanctions) but they are not prohibitive for Trump thus far. This is not a recipe for cost-push inflation significant enough to trigger a recession or derail Trump’s reelection odds at present, but it is a risk that will need to be monitored. How Will China Respond? More Stimulus! The immediate ramification of a heightened trade war is deteriorating global trade and sentiment and hence slower global growth that pushes down prices. Indeed, the escalation of the trade war brings sharply into focus two long-running Geopolitical Strategy themes: Sino-American Conflict: U.S. and Chinese exports to each other have already sharply fallen off (Chart 15). Trade is interconnected so this will further depress global and Asia-ex-China exports. Chart 15Trade War Hurts Bilateral Trade ... And All Trade
Trade War Hurts Bilateral Trade ... And All Trade
Trade War Hurts Bilateral Trade ... And All Trade
Chart 16Global Trade Already Rolling Over
Global Trade Already Rolling Over
Global Trade Already Rolling Over
Apex of Globalization: Global trade as a whole is contracting as a result of the global slowdown, which the trade war has exacerbated (Chart 16). The negative impact on China is acute and threatens something akin to the global manufacturing recession of 2015 (Chart 17). Given that the trade war is now piling onto a merely fledgling rebound in Chinese and global growth this year, it is possible that the manufacturing slowdown could even get worse than 2015 and culminate in a global recession in our worst case scenario of a major strategic escalation. Preventing this outcome, China will increase fiscal-and-credit stimulus, which we have argued is likely to overshoot expectations this year due to trade war and the country’s desire to meet 2020 urban income goals (Chart 18). The magnitude should be comparable to the 2015-16 stimulus, unless a global recession is immediately in view, in which case it will be larger. Chart 17A Relapse Would Point Toward 2015-Sized Crisis
A Relapse Would Point Toward 2015-Sized Crisis
A Relapse Would Point Toward 2015-Sized Crisis
It was the Xi administration that undertook the huge 2015-16 expansion of credit, so this magnitude is not out of the question. While Xi has attempted to contain leverage and reduce systemic financial risk, he is ultimately like his predecessors, most notably Jiang Zemin, in the sense that he will aim for social stability above all. Chart 18China Will Keep Stimulating
China Will Keep Stimulating
China Will Keep Stimulating
The pain threshold of today’s policymakers has already been discovered, seeing how President Xi and the Politburo began easing policy in July 2018 after the U.S. implemented the initial Section 301 tariffs. The Chinese leaders were willing to tighten credit controls until this external risk materialized. The fact that the trade war is the proximate cause of heightened stimulus was confirmed in the wake of the Buenos Aires summit, where Xi chose to stimulate the economy further – resulting in a surge of credit in Q1 – as a way of improving China’s leverage vis-à-vis the United States in the 90-day talks. China will increase fiscal-and-credit stimulus … The magnitude should be comparable to the 2015-16 stimulus. In short, Xi and his government will stimulate first and ask questions later. Both fiscal and credit stimulus will be utilized, including traditional fiscal infrastructure spending and permissiveness toward shadow banking. A dramatic renminbi depreciation could occur but would be evidence that talks will fail (Chart 19). Chart 19Currency Agreement: Far From A Plaza Accord
Currency Agreement: Far From A Plaza Accord
Currency Agreement: Far From A Plaza Accord
Stimulus will continue to be tactical, rolled out in piecemeal announcements, at least as long as the trade talks continue and there is a prospect of China’s economy rebounding without drastic measures. Only a total breakdown in negotiations – and collapse into outright Cold War – will prompt a massive stimulus package. Bottom Line: Chinese stimulus will surprise to the upside while talks are going, and it will increase dramatically if talks collapse. This will ultimately support global growth but it will not prevent market riots between a negative policy shock and the point at which markets are totally reassured about the magnitude of stimulus. How Will The Negotiations Proceed? Precariously. The risk of a strategic conflict is much higher than the markets are currently pricing. This is highlighted in Table 1 above, but there are additional reasons to have a high conviction on this point. We can demonstrate this by constructing a simple decision tree that outlines the step-by-step process by which the U.S. and China will proceed in their negotiations after the May 10 tariff rate hike (Diagram 1). To these we attach subjective probabilities that we believe are fair and slightly conservative. The result shows that it is not difficult to conclude that the conditional probability of a long-term, durable trade agreement is a mere 4%, whereas the conditional probability of an uncontained escalation in strategic tensions is as high as 59%! This is a much worse outcome than our actual view as expressed in Table 1. Diagram 1A Simple Decision Tree Says Geopolitical Risks Are Huge
How Trump Became A War President
How Trump Became A War President
A similar exercise – an analysis of competing hypotheses conducted according to analytical techniques used by the U.S. intelligence community – reinforces the point that the most likely scenario is a major escalation in tensions, while the least likely is a “grand compromise” (Appendix). While our final trade war probabilities in Table 1 are not as pessimistic as these exercises suggest, the latter reinforce the point that the market is too sanguine. An increase in tariffs after five months of negotiations, with a threat to impose even more sweeping tariffs with a one-month deadline, is not conducive to Chinese concessions and therefore increases the odds of talks failing and an escalation in strategic conflict unprecedented in U.S.-China relations since the rupture from 1989-91. And this rupture would be considerably worse for the global economy. The Trump administration’s political logic is willing to accept such a conflict on the basis that a foreign policy confrontation can produce a rally-around-the-flag effect whereas a short-term deal that does not address significant technological and national security concerns is a political liability on the campaign trail. Yes, it is important that Presidents Trump and Xi are making verifiable preparations to attend the G20 summit in Japan. But they could cancel their attendance or snub each other at the event. In our view investors should wait for something more substantial to become more optimistic about political risk – such as public commitments to structural changes by China and a complementary tariff rollback schedule by the United States. Bottom Line: The odds of a total breakdown in U.S.-China relations and a Cold War-style escalation of strategic conflict are highly underrated. Markets will sell before they recover. Investment Implications Chart 20China's Nuclear Option Might Fizzle
China's Nuclear Option Might Fizzle
China's Nuclear Option Might Fizzle
Equity markets are exposed to further downside in the short run. Even a minor escalation is not fully priced according to our Global Investment Strategy’s equity market forecasts based on our own geopolitical scenario probabilities (see Table 1 above). Our Chief Global Strategist Peter Berezin would recommend increasing exposure to risk if the S&P 500 falls 5% from current levels, other factors being equal. Cyclically, any trade agreement will fail to bring substantial benefits to the U.S.-China trade and investment outlook over a horizon beyond 12-24 months. The tech industries of the two countries will not benefit greatly from the deal. While multinational corporations exposed to the Asian manufacturing supply chain could suffer earnings downgrades from trade war, China’s stimulus will be a countervailing factor, particularly for commodities and commodity-oriented EMs. Therefore, we will keep our China Play Index and long Indonesia trades in place despite near-term risks. Ironically, U.S. treasuries can rally even when China is reducing its holdings, as global demand rises amid crisis (Chart 20). However, given that bonds have already rallied and we expect Chinese stimulus to come sooner rather than later, we will maintain our current portfolio hedge of Swiss bonds and gold, which is up 2%. We are closing our long small caps trade for a loss of 11.9%. Matt Gertken, Vice President Geopolitical Strategist mattg@bcaresearch.com Appendix
Image
President Trump’s announcement this week of a new deployment of aid to U.S. farmers, to offset China’s retaliation to steeper tariffs, highlights that agriculture has been the sacrificial lamb in the U.S.’s hawkish trade policy. The $15 billion announcement follows last year’s $12 billion disbursement, and suggests that the path to a trade agreement with China remains fraught. Although China and the U.S. continue to negotiate, and President Trump has indicated that “maybe something will happen” within a “three or four week” timeframe, last week’s events indicate that a resolution is far from guaranteed. Both positive and negative trade war news will dominate the near term evolution of ag prices – stay on the sidelines as negotiations will sway markets. Highlights Energy: Overweight. Crude oil prices are up ~2% since the beginning of the week on escalating tensions in the Middle East, as expected. Two Saudi oil-pumping stations were targeted in a drone attack on Tuesday. This follows attacks on four oil tankers – including two Saudi ships – off the coast of the United Arab Emirates. These events highlight the increased risk of supply outages since the U.S. decision not to extend waivers on Iran sanctions.1 Base Metals: Neutral. The recent escalation in Sino-U.S. trade tensions pushed LMEX prices down 2% since the beginning of last week. Nevertheless, we believe that in the medium term Chinese authorities will manage to offset the negative economic impact on metals by ramping up fiscal-and-credit stimulus.2 Precious Metals: Gold’s geopolitical risk premium is rising amid escalating trade tensions. Gold rallied ~2% since May 3, amid declining global equities. Our gold trade is up 5.3% since inception. Ags/Softs: Underweight. Sino-U.S. trade tensions are weighing heavily on agriculture commodities. The grains and oilseed index is down 9% since the beginning of the year. Continued trade war uncertainty will keep risks elevated in the ags space (see below). Feature Several factors – including dollar strength and bearish fundamentals – have come together to drive down ag prices so far this year. However, the latest plunge highlights that trade risks remain a real threat to ag markets. This is in line with the sharp cutback in Chinese imports of U.S. ags, which make up a large share of Chinese imports from the U.S. and have been hit hard by tariffs (Chart of the Week). Soybeans in particular have become the poster child of the dispute. Uncertainty has taken their prices down to 10 year lows. In 2017, they accounted for $12.4 worth, or 9.3%, of U.S. exports to China. However, since the onset of the dispute, American soybean farmers have been struggling to market their crops. U.S. exports to China are down more than 80% y/y since 2H18 (Chart 2), and while there have been efforts to find other markets, they have yet to offset the impact of lower trade with China (Chart 3).
Chart 1
Chart 2Soybeans Are The Poster Child Of The Conflict
Soybeans Are The Poster Child Of The Conflict
Soybeans Are The Poster Child Of The Conflict
Chart 3
A long-term solution is necessary to support the agriculture industry and prices of grains and oilseeds. In fact, the Chinese tariffs add to ongoing trade disputes between the U.S. and some of its other major ag markets (Charts 4A & 4B). Canada, Mexico, and the EU have placed tariffs on a range of U.S. agricultural goods in response to the Section 232 tariffs on steel and aluminum.
Chart 4
Chart 4
As such, American farmers are suffering the brunt of the trade war’s burden. Chinese retaliation comes at a time when U.S. ag stockpiles are already elevated (Chart 5). Inflation-adjusted farm income had been deteriorating prior to the trade dispute, falling to about half its 2013 level (Chart 6). The trade dispute has only reinforced this trend. In its most recent Ag Credit Survey, the Kansas City Fed found the pace of decline in farm loan repayment rates increased, while carry-over debt increased for many borrowers, ultimately causing a deterioration in ag credit conditions. Given that exports account for 20% of U.S. farm income, according to USDA estimates, a long-term solution is necessary to support the agriculture industry and prices of grains and oilseeds. Otherwise, tariffs will simply be another constraint on U.S. ag exports, which have been losing global market share since the mid-1990s (Chart 7). Chart 5U.S. Stocks Are Relatively Elevated
U.S. Stocks Are Relatively Elevated
U.S. Stocks Are Relatively Elevated
Chart 6Farmers Suffering The Brunt Of The Burden
Farmers Suffering The Brunt Of The Burden
Farmers Suffering The Brunt Of The Burden
Chart 7U.S. Agriculture Losing Global Market Share
U.S. Agriculture Losing Global Market Share
U.S. Agriculture Losing Global Market Share
Even though China briefly resumed some purchases of U.S. ags this year as a goodwill gesture during negotiations, these purchases stand significantly below those of previous years. They resulted from one-time purchases by Chinese state-owned enterprises, and barriers to trade remain in place. Such ad hoc attempts at reconciliation will not be sufficient to support a distrustful market going forward. The trade war is just one facet of a broader strategic U.S.-China conflict. This means a resolution would be only a cyclical improvement in an ongoing structural deterioration in relations. A number of potential outcomes can result from the ongoing negotiations: Most bearish: China raises the tariff rate on U.S. ag exports even further. A situation in which a fallout in the negotiations leads to strategic tensions – a scenario to which BCA’s geopolitical strategists attribute a 50% chance – could result in further ratcheting up of tariffs by China. Given that Chinese imports of U.S. ags are approaching zero, there is limited significant further downside even in this most pessimistic scenario. However, unless the U.S. is able to smoothly market its crops in other regions, upside will also be limited for some time. Since trade tariffs have already been initiated with many of the U.S.’s major ag consumers, securing reliable alternative markets may prove a challenge. Especially since Trump’s hawkish foreign policy raises risks and uncertainties for America’s trade partners. Bearish: Tariffs remain at current levels. Similar to the most bearish scenario, given that the U.S. is already having a difficult time marketing its crops abroad, significant further downside from current levels is also limited. However, any premium priced on the expectation of a resolution of the trade conflict will be eliminated. Again, as in the most bearish scenario, the loss of the Chinese market may be mitigated by an expansion of alternative markets, but challenges will remain. Bullish: Tariffs are cut back to pre-trade war levels. In this scenario, the tariffs imposed since the onset of the trade war will be unwound. This would once again raise the competitiveness of American crops in Chinese markets, and would entail higher ag prices as demand channels are re-established. Most Bullish: Tariffs fall to equalized levels. One of Trump’s key complaints is that U.S. and Chinese tariffs are not “reciprocal in nature and value” (Chart 8). Given that Chinese tariffs are above those of the U.S., this would entail a reduction in Chinese tariffs to below trade war levels (Table 1).
Chart 8
Table 1... And They Have Gone Up
American Farmers Caught In The Crosshairs Of Sino-U.S. Brinkmanship
American Farmers Caught In The Crosshairs Of Sino-U.S. Brinkmanship
A lasting trade deal will likely include measures to close the bilateral trade deficit, which in 2018 stood at $379 billion. Last year Trump called on Beijing to reduce this deficit by $200 billion over two years. If we make the overly simplistic assumption that the share of imports remains unchanged, such a reduction would lead to an additional $19 billion in soybeans, $0.54 billion in wheat, and $0.23 billion in corn imports. This back of the envelope calculation implies a doubling of these U.S. exports to China, relative to 2017 levels. As we highlighted in our March ags update, investors had become overly optimistic with their expectation of a swift resolution of the trade war.3 In fact, according to BCA’s geopolitical strategists, the trade war is just one facet of a broader strategic U.S.-China conflict. This means a resolution would be only a cyclical improvement in an ongoing structural deterioration in relations. They assign only 40% odds that a deal will be finalized by year-end, with 30% odds that the frictions will escalate into strategic tensions. In the meantime, Trump’s palliatives – which include a “trade relief” program, an EU promise to purchase more U.S. soybeans, and last week’s suggestion of government purchases for humanitarian aid – are unlikely to lift ag prices. Bottom Line: The U.S.-China trade war has weighed on American ag exports. The impact on farmers – in terms of lower incomes, and higher stockpiles – has been significant. Granting that odds of a resolution this year are no greater than 40%, we recommend a cautious stance on ag markets. However, a trade deal that entails Chinese promises to import U.S. ags – either through more favorable tariff rates or commitments to purchase large volumes – would provide a buying opportunity. In any case, we suspect that prices are near the bottom, but will require a significant catalyst – in the form of a trade deal – to begin to climb materially. No Relief From Fundamentals, Either With spring planting underway, the recent escalation in trade tensions comes at a busy time of year for U.S. farmers. According to the USDA’s annual Prospective Planting Report, released at the end of March, the planted area of corn will likely increase by 4% in 2019, while soybean and wheat will fall 5% y/y and 4% y/y, respectively. If realized, the planting area that farmers intend to dedicate to wheat will be the lowest on record – that is, since 1919 (Chart 9). However, farms in the Midwest were hit by a “bomb cyclone” in March, which has damaged crops and delayed planting. Inundated fields mean farmers are forced to push back their schedule. The latest Weekly Crop Progress Report from the USDA, indicates that farmers have fallen behind relative to typical progress at this time of year (Table 2). Although farmers’ current lack of headway is cause for concern, they may still be able to catch up and attain their targeted acreage. Chart 9Record Low Wheat Acreage
Record Low Wheat Acreage
Record Low Wheat Acreage
Table 2Flooding Has Delayed Spring Planting
American Farmers Caught In The Crosshairs Of Sino-U.S. Brinkmanship
American Farmers Caught In The Crosshairs Of Sino-U.S. Brinkmanship
Given that stockpiles are full, due to years of surplus, the impact of the flooding is unlikely to move international ag prices. Nevertheless, planting delays raise the possibility that corn farmers will switch to soybeans, which can be planted later in the season. In the May update of the World Supply And Demand Estimates – which includes the first estimates for the 2019/20 crop year — the USDA projected a decline in U.S. soybean ending stocks on the back of lower production and a pickup in exports. The switch in planting intentions towards soybeans at the expense of corn may at least partially reverse this expectation, raising global soybean inventories which are expected to remain unchanged (Chart 10). In addition to trade war, the African swine fever has hit pig herds in China – the main consumers of soybeans. According to China’s official statistics, more than a million pigs have been culled, and Chinese pork production is expected to be slashed by between a quarter and a half this year. This will depress demand for soybeans, further weighing on prices. So far this year the greenback has been a source of bearishness toward ags. Since the epidemic has spread to other Asian neighbors including Hong Kong and Vietnam, soybean demand from Asia will be reduced, regardless of the outcome of the trade war. This will also weigh on other major producers such as Brazil and Argentina, which have so far benefited from China’s shunning of the American crop. South American producers are also at risk if a positive outcome emerges from the negotiations. Chart 10No Change In Soybean Inventories Expected In The Coming Crop Year
No Change In Soybean Inventories Expected In The Coming Crop Year
No Change In Soybean Inventories Expected In The Coming Crop Year
Chart 11Preliminary Projections Of Uptick In 2019/20 Wheat Inventories
Preliminary Projections Of Uptick In 2019/20 Wheat Inventories
Preliminary Projections Of Uptick In 2019/20 Wheat Inventories
On the other hand, according to the latest USDA estimates, both global and U.S. year-end wheat inventories are expected to pick up in the 2019/2020 crop year (Chart 11). Greater European production will add to already elevated supplies. While global corn inventories are projected to come down, U.S. inventories will likely rise amid greater production and weaker exports. However, these acres are at risk given the flood delays (Chart 12). In addition to these supply-demand fundamentals, U.S. financial conditions – especially the U.S. dollar – will remain a key driver of ag prices. So far this year the greenback has been a source of bearishness toward ags. Ag prices have an inverse relationship with the U.S. trade-weighted dollar (Chart 13). While in our earlier report we had expected the dollar to peak by mid-year, the May 5 escalation in the trade war poses a risk to this view by threatening the global trade and growth outlook and spurring risk-off sentiment. Chart 12Another Deficit Expected ##br##For Corn
Another Deficit Expected For Corn
Another Deficit Expected For Corn
Bottom Line: Farmers in the U.S. Midwest facing inundated fields are behind schedule in their spring planting. This poses a risk that a greater number of soybeans will be planted at the expense of corn – weighing down on an already depressed soybean market and potentially requiring the USDA to revise down its U.S. bean ending stocks in its next WASDE report. Chart 13U.S. Financial Conditions Continue To Weigh On Ags
U.S. Financial Conditions Continue To Weigh On Ags
U.S. Financial Conditions Continue To Weigh On Ags
What is more, the African swine fever, which is spreading across East Asia, is reducing demand for animal feed there. Unless the trade conflict is resolved, we expect corn and wheat to outperform the soybean market. Roukaya Ibrahim, Editor/Strategist Commodity & Energy Strategy RoukayaI@bcaresearch.com Footnotes 1 Please see BCA Research’s Commodity & Energy Strategy Special Report titled “U.S.-Iran: This Means War?” dated May 3, 2019, available at ces.bcaresearch.com. 2 Please see BCA Research’s Commodity & Energy Strategy Weekly Report titled “Expanded Sino-U.S. Trade War Could Be Bullish For Base Metals,” dated May 9, 2019, available at ces.bcaresearch.com. 3 Please see BCA Research’s Commodity & Energy Strategy Weekly Report titled “Financial Conditions, Trade War Continue To Dominate Ag Market,” dated March 28, 2019, available at ces.bcaresearh.com. Investment Views and Themes Recommendations Strategic Recommendations Tactical Trades TRADE RECOMMENDATION PERFORMANCE IN 2019 Q1
Image
Commodity Prices and Plays Reference Table Trades Closed in 2019 Summary of Closed Trades
Image