Geopolitics
The highlight of next week will be the highly anticipated Xi-Trump meeting at the G20 in Osaka on Friday or Saturday. BCA does not anticipate a deal that will end the trade to come out of this get-together, but an agreement for China and the U.S. to start…

Highlights So What? Geopolitical risks are not about to ease. Why? Fiscal policy becomes less accommodative next year unless politicians act. Financial conditions give President Trump room to expand his tariff onslaught. Our Iran view is confirmed by rapid escalation of tensions – war risk is high. The odds of a no-deal Brexit have risen. Feature The AUD-JPY cross and copper-to-gold ratio – two market indicators that flag global growth and risk-on sentiment – are hovering over critical points at which a further breakdown would catalyze a renewed flight to quality (Chart 1). Chart 1Risk-On Indicators Breaking Down?
Risk-On Indicators Breaking Down?
Risk-On Indicators Breaking Down?
Global sentiment remains depressed amid a rash of negative economic surprises and bonds continue to rally despite a more dovish outlook from the Fed (Chart 2). Chart 2Global Sentiment Remains Depressed
Global Sentiment Remains Depressed
Global Sentiment Remains Depressed
The cavalry is on the way: European Central Bank President Mario Draghi oversaw a dramatic easing of monetary policy on June 18, driving the Italian-German sovereign bond spread down to levels not seen since before the populist election outcome of March 2018 (Chart 2, bottom panel). The Federal Reserve adjusted its policy rate projections to countenance an interest rate cut in the not-too-distant future. More needs to be done, however, to sustain the optimism that has propelled the S&P 500 and global equities upward since the volatility catalyzed by President Donald Trump’s announcement of a tariff rate hike on May 6. Political and geopolitical risks are higher, not lower, since that time as market-negative scenarios are playing out with U.S. policy, Iran, and Brexit, while we take a dim view of the end-game of the U.S.-China negotiations despite recent improvements. Fiscal And Trade Uncertainties This year’s growth wobbles have occurred in the context of expansive fiscal policy in the developed markets. Next year, however, the fiscal thrust (the change in the cyclically adjusted budget balance) is projected to decline in the U.S. and Japan and nearly to do so in Europe (Chart 3). We expect President Trump and the House Democrats to raise spending caps (or at least keep spending at current levels) and thus prevent the budget deficit from contracting in FY2020 – this is their only substantial point of agreement. But this at best neutralizes what would otherwise be a negative fiscal backdrop. Meanwhile it is not at all clear that Brussels will relax its scrutiny of member states seeking to cut taxes and boost spending, such as Italy. Japanese Prime Minister Abe Shinzo would need to arrange for the Diet to pass a new law to avoid the consumption tax hike from 8% to 10% on October 1. He can pull this off, especially if the U.S. trade war escalates – or if he decides to turn next month’s upper house election into a general election and needs to boost his popularity. But as things currently stand in law, the world’s third biggest economy will face a deep fiscal pullback next year (Chart 3, bottom panel). In short, DM fiscal policy will not really become contractionary in 2020, but this is a view and not yet a reality (Chart 4). Chart 3Fiscal Pullback Likely Next Year
Fiscal Pullback Likely Next Year
Fiscal Pullback Likely Next Year
Chart 4Only The U.S. Is Profligate
Only The U.S. Is Profligate
Only The U.S. Is Profligate
Meanwhile China’s stimulus is still in question – in fact it remains the major macro question this year. The efficacy of China’s stimulus is declining ... An escalating trade war will bring greater stimulus but also greater transmission problems. Since February we have argued that the Xi administration has shifted to sweeping fiscal-and-credit stimulus in the face of the unprecedented external threat posed by the Trump administration (Charts 5A and 5B). We expect China’s credit growth to continue its upturn in June and in H2. Ultimately, we think the whole package will be comparable to 2015-16 – and anything even close to that will prolong the global economic expansion. We do not see a massive 2008-style stimulus occurring unless relations with the U.S. completely collapse and a global recession occurs. Chart 5AStimulus Amid The Trade War
Stimulus Amid The Trade War
Stimulus Amid The Trade War
Chart 5
The catch – as we have shown – is that the efficacy of China’s stimulus is declining over time because of over-indebtedness and bearish sentiment in China’s private sector. These tepid animal spirits stem from epochal changes: Xi’s reassertion of communism and America’s withdrawal of strategic support for China’s rise. An escalating trade war will bring greater stimulus but also greater transmission problems. The magnitude of the tariffs that President Trump is threatening to impose on China, Mexico, the EU, and Japan is mind-boggling. We illustrate this with a simple simulation of duties collected as a share of total imports under different scenarios (Chart 6).
Chart 6
China and Mexico are fundamentally different from the EU and Japan and hence the threat of tariffs will continue to weigh on markets for Trump’s time in office – China because of a national security consensus and Mexico because of the Trump administration’s existential emphasis on curbing illegal immigration. But we still put the risk of auto tariffs (or other punitive measures) on Europe at 45% if Trump seals a China deal. The odds are lower for Japan but it is still at risk. Global supply chains are shifting – a new source of costs and uncertainty for companies – as a slew of recent news has highlighted. Already 40% of companies surveyed by the American Chamber of Commerce in China say they are relocating to Southeast Asia, Mexico, and elsewhere (Chart 7). If the G20 is a flop – or results in nothing more than a pause in tariffs for another three-month dialogue – relocations will gain steam, forcing companies’ bottom lines to take a hit.
Chart 7
Even in the best case, in which the Trump-Xi summit produces a joint statement outlining a “deal in principle” accompanied by a rollback of the May 10 tariff hike, uncertainty will persist due to President Trump’s unpredictability, China’s incentive to wait until after the U.S. election, and Trump’s incentive to corner the “China hawk” platform prior to the election. We maintain that, by November 2020, there is a roughly 70% chance of further escalation. At least the U.S.-China conflict is nominally improving. The same cannot be said for other geopolitical risks discussed below: the U.S. and Iran are flirting with war; the U.S. presidential election is injecting a steady trickle of market-negative news; the chances of a no-deal Brexit are rising; and Trump may turn on Europe at a moment when it lacks leadership. This list assumes that Russia takes advantage of American distraction by improving domestic policy rather than launching into a new foreign adventure – say in Ukraine or Kaliningrad. If there is any doubt as to whether political risk can outweigh more accommodative monetary policy, remember that President Trump actually can remove Chairman Jerome Powell. Legally he is only allowed to do so “for cause” as opposed to “at will.” But the meaning of this term is a debate that would go to the Supreme Court in the event of a controversial decision. Meanwhile the stock market would dive. Now, this is precisely why Trump will not try. But the implication, as with Congress and the border wall, is that Trump is constrained on domestic policy and hence tariffs are his most effective tool to try to achieve policy victories. With an ebullient stock market and a Fed that is adjusting its position, Trump can try to kill two birds with one stone: wring concessions from trade partners while forcing the FOMC to keep responding to rising external risks. Bottom Line: Central banks are riding to the rescue, but there is only so much they can do if global leaders are tightening budgets and imposing barriers on immigration and trade. We remain tactically cautious. Oh Man, Oh Man, Oman Iran has swiftly responded to the Trump administration’s imposition of “maximum pressure” on oil exports. The shooting down of an American drone that Tehran claims violated its airspace on June 20 is the latest in a spate of incidents, including a Houthi first-ever cruise missile attack on Abha airport in Saudi Arabia. Two separate attacks on tankers near the Strait of Hormuz (Map 1) demonstrate that Iran is threatening to play its most devastating card in the renewed conflict with the U.S.
Chart
Chart 8
Hormuz ushers through a substantial share of global oil demand and liquefied natural gas demand (Chart 8). The amount of spare pipeline capacity that the Gulf Arab states could activate in the event of a disruption is merely 3.9 million barrels per day, or 6 million if questionable pipelines like the outdated Iraqi pipeline in Saudi Arabia prove functional (Table 1). Table 1No Sufficient Alternatives To Hormuz
Escalation ... Everywhere
Escalation ... Everywhere
A conflict with Iran could cause the biggest oil shock of all time. Even if this spare capacity were immediately utilized, a conflict could cause the biggest oil shock of all time – considerably bigger than that of the Iranian Revolution (Chart 9).
Chart 9
We have shown in the past that Iran has the military capability of interrupting the flow of traffic in Hormuz for anywhere from 10 days to four months. A preemptive strike by Iran would be most effective, whereas a preemptive American attack would include targets to reduce Iran’s ability to retaliate via Hormuz. The impact on oil prices ranges from significant to devastating. Needless to say, blocking the Strait of Hormuz would initiate a war so Iran is attempting to achieve diplomatic goals with the threats themselves – it will only block the strait as a last resort, say if it is convinced that the U.S. is about to attack anyway. As the experience of President Jimmy Carter shows, Americans may rally around the flag during a crisis but they will also kick a president out of office for higher prices and an economic slowdown. President Trump cannot be unaware of this precedent. The intention of his Iran policy is to negotiate a “better deal” than the 2015 one – a deal that includes Iran’s regional power projection and ballistic missile capabilities as well as its nuclear program. The problem is that Trump has already been forced to deploy a range of forces to the region, including additional troops (albeit so far symbolic at 2,500) (Chart 10). He is also sending Special Representative for Iran, Brian Hook, to the region to rally support among Gulf Cooperation Council. The week after Hook will court Britain, Germany, and France, three of the signatories of the 2015 deal. Trump ran on a campaign of eschewing gratuitous wars in the Middle East – a popular stance among war-weary Americans (Chart 11) – but there is a substantial risk that he could get entangled in the region. First, he is adopting a more aggressive foreign policy to attempt to compensate for the lack of payoff in public opinion from the strong economy. Second, Iran is not shrinking from the fight, which could draw him deeper into conflict. Third, there is always a high risk of miscalculation when nations engage in such brinkmanship. Chart 10Is The 'Pivot To Asia' About To Reverse?
Is The 'Pivot To Asia' About To Reverse?
Is The 'Pivot To Asia' About To Reverse?
Chart 11
The Iranian response has been, first, to reject negotiations. When Trump sent a letter to Rouhani via Japanese Prime Minister Abe Shinzo, Abe was rebuffed – and one of the tankers attacked near Oman was a Japanese flagged vessel, the Kokuka Courageous. This is a posture, not a permanent position, as the Iranian release of an American prisoner demonstrates. But the posture can and will be maintained in the near term – with escalation as the result. Second, Iran is increasing its own leverage in any future negotiation by demonstrating that it can sow instability across the region and bring the global economy grinding to a halt. Iran cannot assume that Trump means what he says about avoiding war but must focus on the United States’ actions and capabilities. Cutting off all oil exports is a recipe for extreme stress within the Iranian regime – it is an existential threat. Therefore, the Iranians have signaled that the cost of a total cutoff will be a war that will cause a global oil price shock. The Iranian leaders are also announcing that they are edging closer to walking away from the 2015 nuclear pact (Table 2). If so, they could quickly approach “breakout” capacity in the uranium enrichment – meaning that they could enrich to 20% and then in short order enrich to 90% and amass enough of this fuel to make a nuclear device one year thereafter. The Trump administration has reportedly reiterated that this one-year limit is the U.S. government’s “red line,” just as the Obama administration had done. Table 2Iran Threatens To Walk Away From 2015 Nuclear Deal
Escalation ... Everywhere
Escalation ... Everywhere
This Iranian threat is a direct reaction to Trump’s decision in May not to renew the oil sanction waivers. Previously the Iranians had sought to preserve the 2015 deal, along with the Europeans, in order to wait out Trump’s first term. These developments push us to the brink of war. Iran is retaliating with both military force and a nuclear restart. This comes very close to meeting our conditions for an American (and Israeli) retaliation that is military in nature. Diagram 1 is an update of our decision tree that we have published since last year when Trump reneged on the 2015 deal. The window to de-escalate is closing rapidly. The Appendix provides a checklist for air strikes and/or the closure of Hormuz. Diagram 1Iran-U.S. Tensions Decision Tree
Escalation ... Everywhere
Escalation ... Everywhere
At very least we expect to see the U.S. attempt to create a large international fleet to assert freedom of navigation in the Persian Gulf and Strait of Hormuz. While Iran may lay low during a large show of force, it will later want to demonstrate that it has not been cowed. And it has the capacity to retaliate elsewhere, including in Iraq, an area we have highlighted as a major geopolitical risk to oil supply. The U.S. government has already reacted to recent threats there from Iranian proxies by pulling non-essential personnel. Iran has several incentives to test the limits of conflict if the U.S. insists on the oil embargo. First, tactically, it seeks to deter President Trump, take advantage of American war-weariness, drive a wedge between the U.S. and Europe, and force a relaxation of the sanctions. This would also demonstrate to the region that Iran has greater resolve than the United States of America. This goal has not been achieved by the recent spate of actions, so there is likely more conflict to come. Second, President Hassan Rouhani’s government is also likely to maintain a belligerent posture – at least in the near term – to compensate for its loss of face upon the American betrayal of the 2015 nuclear deal. Rouhani negotiated the deal against the warnings of hardline revolutionaries. The 2020 majlis elections make this an important political goal for his more reform-oriented faction. Negotiations with Trump can only occur if Rouhani has resoundingly demonstrated his superiority in the clash of wills. Structurally, Iran faces tremendous regime pressures in the coming years and decades because of its large youth population, struggling economy, and impending power transition from the 80 year-old Supreme Leader Ali Khamanei. A patriotic war against America and its allies – while not desirable – is a risk that Khamenei can take, as an air war is less likely to trigger regime change than it is to galvanize a new generation in support of the Islamic revolution. For oil markets the outcome is volatility in the near term – reflecting the contrary winds of trade war and global growth fears with rising supply risks. Because we expect more Chinese stimulus, both as the trade talks extend and especially if they collapse, we ultimately share BCA’s Commodity & Energy Strategy view that the path of least resistance for oil prices is higher on a cyclical horizon, as demand exceeds supply (Chart 12). We remain long EM energy producers relative to EM ex-China. Chart 12Crude Oil Supply-Demand Balance Should Send Prices Higher
Crude Oil Supply-Demand Balance Should Send Prices Higher
Crude Oil Supply-Demand Balance Should Send Prices Higher
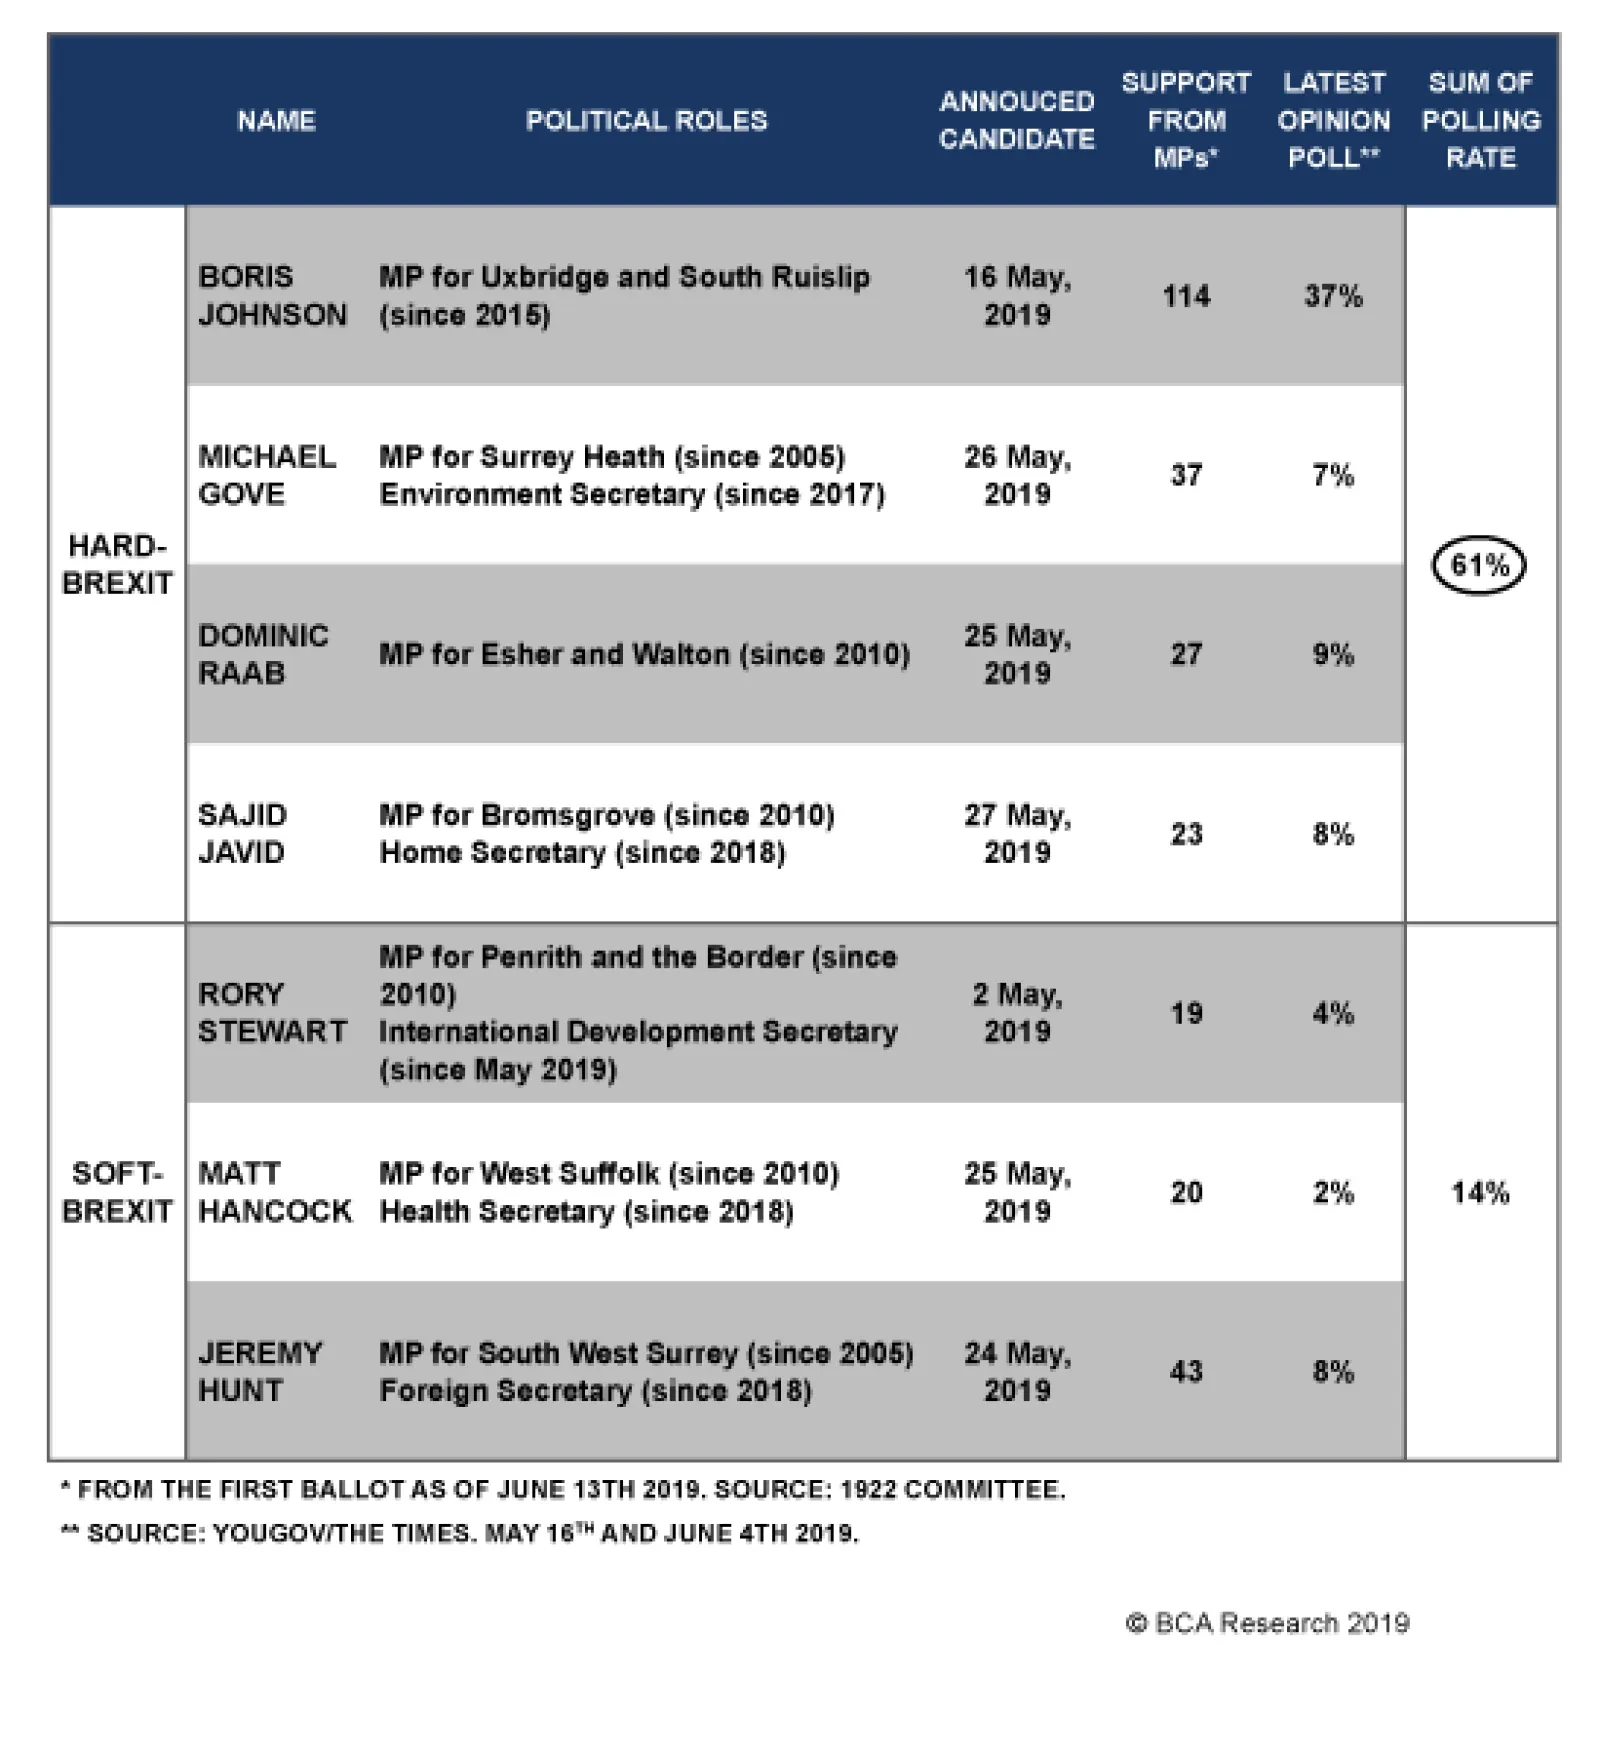
Bottom Line: The risk of military conflict has risen materially. This also drastically elevates the risk of a supply shock in oil prices that would kill global demand. The U.S. Election Adds To Geopolitical Risk The 2020 U.S. election poses another political risk for the rising equity market. The Democratic Party’s first debate will be held on June 26-27. The leftward shift in the party will be on full display, portending a possible 180-degree reversal in U.S. policy if the Democrats should win the election, with the prospect of a rollback of Trump’s tax cuts and deregulation of health, finance, and energy. The uncertainty and negative impact on animal spirits will be modest if current trends persist through the debates. Former Vice President Joe Biden remains the frontrunner despite having naturally lost the bump to his polling support after announcing his official candidacy (Chart 13). Biden is a known quantity and a centrist, especially compared to the farther left candidates ranked second and third in popular support– Vermont Senator Bernie Sanders and Massachusetts Senator Elizabeth Warren.
Chart 13
Chart 14
Biden is not only beating Sanders in South Carolina, which underscores the fact that he is competitive in the South and hence has a broader path to the White House, but also in New Hampshire, where the Vermont native should be ahead (Chart 14). These states hold the early primaries and caucuses and if Biden maintains his large lead then he will start to appear inevitable very early in the primary campaign next year. Hence a poor showing in the debate on June 27 is a major risk to Biden – he should be expected to be eschew the limelight and play the long game. Elizabeth Warren, by contrast, has the most to gain as she appears on the first night and does not share a stage with the other heavy hitters. If she or other progressive candidates outperform then the market will be spooked. The market could begin to trade off the polls. All of these candidates are beating Trump in current head-to-head polling – Biden is even ahead in Texas (Chart 15). This means that any weakness from Biden does not necessarily offer the promise of a Trump victory and policy continuity.
Chart 15
The Democrats also have a powerful demographic tailwind. The just-released projections from the U.S. Census Bureau reveal how Trump’s narrow margins of victory in the swing states in 2016 are in serious jeopardy in 2020 as a result of demographics if he does not improve his polling among the general public (Chart 16).
Chart 16
We still give Trump the benefit of the doubt as the incumbent president amid an expanding economy, but it is essential to recognize that his popular approval rating is reminiscent of a president during recession – i.e. one who is about to lose the White House for his party (Chart 17).
Chart 17
Even if there is not a recession, an increase in unemployment is likely to cost him the election – and even a further decrease in unemployment cannot guarantee victory (Chart 18). This is why we see Trump making a bid to become a foreign policy president and seek reelection on the basis that it is unwise to change leaders amid an international crisis.
Chart 18
We still give Trump the benefit of the doubt ... but his popular approval rating is reminiscent of a president during recession. The race for the U.S. senate is extremely important for the policy setting from 2021. If Republicans maintain control, they will be able to block sweeping Democratic legislation – which is particularly relevant if a progressive candidate should win the White House. However, if Democrats can muster enough votes to remove a sitting president with a strong economy – including a strong economy in the key senate swing races (Chart 19) – then they will likely win over the senate as well. Chart 19Hard To Win The Senate In 2020 While Key States Prosper
Hard To Win The Senate In 2020 While Key States Prosper
Hard To Win The Senate In 2020 While Key States Prosper
Bottom Line: The 2020 election poses a double risk to the bull market. First, the Democratic primary campaign threatens sharp policy discontinuity, especially if and when developments cause Biden to drop in the polls (dealing a blow to centrism or the political establishment). Second, Trump’s vulnerability makes him more likely to act aggressive on the international stage, whether on trade, immigration, or national security, reinforcing the risks outlined above with regard to China, Iran, Mexico, and even Europe. Rising Odds Of A No-Deal Brexit Former Mayor of London and former foreign secretary Boris Johnson looks increasingly likely to seal the Conservative Party leadership contest in the United Kingdom. It is not yet a done deal, but the shift within the party in favor of accepting a “no deal” exit is clear. None of the remaining candidates is willing to forgo that option. The newest development advances us along our decision tree in Diagram 2, altering the conditional probabilities for this year’s events. We expect the next prime minister to try to push a deal substantially similar to outgoing Prime Minister Theresa May before attempting any kamikaze run as the October 31 deadline approaches. The attempt to leverage the EU’s economic weakness will not produce a fundamental renegotiation of the exit deal, but some element of diplomatic accommodation is possible as the EU seeks to maintain overall stability and a smooth exit if that is what the U.K. is determined to accomplish. Diagram 2Brexit Decision Tree
Escalation ... Everywhere
Escalation ... Everywhere
Hence the prospect of passing a deal substantially similar to outgoing Prime Minister Theresa May’s deal is about 30%, roughly equal to the chance of a delay (28%). These options are believable as the new leader will have precious little time between taking the reins and Brexit day. The EU can accept a delay because it ultimately has an interest in keeping the U.K. bound into the union. Public opinion polling is not conducive to the new prime minister seeking a new election unless the change of face creates a massive shift in support for the Conservatives, both by swallowing the Brexit Party and outpacing Labour. If the purpose is to deliver Brexit, then the risk of a repeat of the June 2017 snap election would seem excessive. Nevertheless, the Tories’ working majority in parliament is vanishingly small, at five MPs, so a shift in polling could change the thinking on this front. The pursuit of a no-deal exit would create a backlash in parliament that we reckon has a 21% chance of ending in a no-confidence motion and new election. Bottom Line: The odds of a crash Brexit have moved up from 14% to 21% as a result of the leadership contest. The threat that the U.K. will crash out of the EU is not merely a negotiating ploy, although it will be a last resort even for the new hard-Brexit prime minister. Public opinion is against a no-deal Brexit, as is the majority of parliament, but the risk to the U.K. and EU economies will loom large over global risk assets in the coming months. Investment Conclusions Political and geopolitical risks to the late-cycle expansion are rising, not falling. U.S. foreign policy remains the dominant risk but U.S. domestic policy pre-2020 is an aggravating factor. Easing financial conditions give President Trump more ammunition to use tariffs and sanctions. Meanwhile our view that this summer will feature “fire and fury” between the U.S. and Iran has been confirmed by the tanker attacks in Oman. Tensions will likely escalate from here. Ultimately, we believe Trump is more likely to back off from the Iran conflict than the China conflict. This is part of our long-term theme that the U.S. really is pivoting to China and geopolitical risk will rotate from the Middle East to East Asia. But as highlighted above, the risk of entanglement is very high due to Trump’s approach and Iran’s incentives to raise the stakes. Oil prices will not resume their upward drift until Chinese stimulus is reconfirmed – and even then they will continue to be volatile. We remain cautious and are maintaining our safe-haven tactical trades of long gold and long JPY/USD. Matt Gertken, Vice President Geopolitical Strategist mattg@bcaresearch.com Appendix
Image
Supply - demand fundamentals point to higher oil prices going forward. Our expectation regarding OPEC production remains unchanged: The original cartel led by the Kingdom of Saudi Arabia (KSA) will maintain production discipline this year – likely continuing to over-comply with quotas agreed at the start of the year – to support its long-standing goal to reduce oil inventories globally. Non-OPEC member states in OPEC 2.0 led by Russia also will maintain lower output this year. The OPEC 2.0 coalition will meet July 1 - 2 in Vienna to determine whether it will extend production cuts. On the demand side, we lowered our expectation for this year and next, following the World Bank’s recent downgraded assessment of global GDP growth. Our expectation remains slightly above the EIA’s and the IEA’s. Globally, central bank easing will support demand. Following these adjustments, we are keeping our Brent forecast at $73/bbl this year and lowering our forecast for next year to $75/bbl from $77/bbl. We continue to expect WTI to trade $7/bbl and $5/bbl below those levels this year and next, respectively. The balance of risk is to the upside. The risk of hybrid warfare (see below) in the Persian Gulf -- and the wider region -- will increase, as Iranian and U.S. positions harden. Highlights Highlights Energy: Overweight. The U.S. Central Command released photos supporting an analysis claiming Iran was responsible for two attacks on commercial shipping in the Persian Gulf last week. The Pentagon deployed an additional 1,000 troops to the region, following this assessment. President Trump, meanwhile, downplayed the attacks, calling them a “very minor event.”1 Base Metals: Neutral. Copper speculators lifted their short position 6k lots to 51.7k lots on CME last week. This is a record short. But the cash market is getting tighter. Treatment and refining charges (TC/RCs) moved lower last week, as Fastmarkets MB’s TC/RC Asia – Pacific index hit $54.10/MT, $05.41/lb. This is the lowest level on record for the index, which was launched in June 2013. A low index reading means copper concentrate is in short supply, forcing refiners to lower the price of their services. We remain long the September 2019 $3.00/lb Calls vs. short the September 2019 $3.30/lb calls. Precious Metals: Neutral. Safe-haven demand continues to support gold prices, although news of a Trump – Xi meeting at the G20 in Japan to re-start trade talks reduced the urgency of buying earlier this week. We remain long gold as a portfolio hedge. Ags/Softs: Underweight. Rain continued to soak the U.S. Midwest this past week, putting a bid under grains – particularly corn – and beans. This week’s USDA Crop Progress report showed corn planting still behind schedule (at 92% vs. 100% on average in the 2014 – 18 period in the 18 states that accounted for 92% of total acres planted last year). Feature The information flows to oil markets are becoming internally contradictory. On the one hand, recent attacks on commercial oil-product tankers near the Strait of Hormuz – where close to 20% of the world’s oil supply transits daily – raised the ante in the U.S.-GCC-Iran stand-off. The attacks follow earlier aggression against shipping and pipelines in the region, and prompted KSA’s Energy Minister Khalid al-Falih to call for a collective response to keep Gulf sea lanes open to allow oil to flow freely worldwide.2 In the post-WWII era, the U.S. has willingly taken on the responsibility of keeping the world’s sea lanes open for the free flow of commodities and finished products. However, based on remarks U.S. President Donald Trump made to Time magazine this week, it would appear the U.S. no longer is willing to shoulder the burden of defending freedom of navigation in the Persian Gulf.3 The presidential sangfroid in the wake of last week’s attacks in the Gulf – which Pentagon analysts insist were launched by Iran – might be explained by the Trump administration’s belief the global oil market is “very well-supplied,” as U.S. Deputy Energy Secretary Dan Brouillette contended in an S&P Global Platts interview this past weekend.4 Indeed, this has become part of the narrative whenever the administration discusses oil markets. Brouillette said abundant crude availability prevented oil prices from spiking to $140/bbl in the wake of the attacks on the two commercial tankers. Will The U.S. Defend Gulf Sea Lanes? The global oil market is “well supplied” as long as the Strait of Hormuz – the most critical chokepoint in the world – stays open. Freedom of navigation on the open seas is the sine qua non of a well-functioning oil market – everything from getting supplies to refiners to getting products to consumers depends on it. Oil is a globally traded, waterborne commodity: ~ 60% of all crude exports are loaded on a ship and sent to refiners, directly or via trading companies.5 A liquid crude market requires an unimpeded shipping market, so that refiners can run their operations in a routine manner. In addition, a smoothly functioning shipping market allows refiners to pick and choose among various grades that can be arbitraged against each other, so they can optimize charging stocks. The market cannot absorb the loss of close to 20mm b/d of crude and refined products, which is what would happen if the Strait shut down. It is the most important choke point in the world (Map 1).
Chart
We’re sure the White House knows this. President Trump’s professed desire to leave the U.S. commitment to maintaining the free flow of oil out of the Gulf is a “question mark” that might be taken as a taunt to up the ante with Iran. Already, in response to the U.S. re-imposing sanctions on Iranian oil exports after unilaterally abrogating the Joint Comprehensive Plan of Action (JCPOA) agreement, Iran announced it will resume production of enriched uranium for its nuclear program on June 27.6 As the summer progresses, we expect a continued escalation in tensions in the Gulf, which, at the very least, will keep volatility in the oil markets elevated. The growing tension in this standoff increases the risk of hybrid warfare in the Persian Gulf, which, should it continue to escalate, increases the risk to global oil flows, as Anthony H. Cordesman at the Center For Strategic & International Studies in Washington recently noted: First, the military confrontation between Iran, the U.S., and the Arab Gulf states over everything from the JCPOA to Yemen can easily escalate to hybrid warfare that has far more serious forms of attack. And second, such attacks can impact critical aspects of the flow of energy to key industrial states and exporters that shape the success of the global economy as well as the economy of the U.S.7 There is a risk this hybrid warfare metastasizes into a full-on war in the Gulf, which would threaten the free flow of oil through the Strait of Hormuz. Should the Strait be closed, a global oil-price shock almost surely would occur, which most likely would send oil prices through $150/bbl. At that point either the warfare is contained and resolved quickly, or the world has to line up 20mm b/d of crude oil and refined products to replace the lost supply from the Gulf. As the summer progresses, we expect a continued escalation in tensions in the Gulf, which, at the very least, will keep volatility in the oil markets elevated (Chart of the Week). Chart of the WeekVolatility Will Remain High
Volatility Will Remain High
Volatility Will Remain High
OPEC 2.0 Will Maintain Production Discipline Even as tensions in the Persian Gulf escalate, we continue to expect OPEC 2.0 to maintain its production discipline. While the producer coalition agreed to remove 1.2mm b/d of production from the market last December, we estimate year-on-year (y/y) year-to-date (ytd) production of OPEC is down ~ 1.4mm b/d in the January-to-May period. For Russia, production over that period y/y is up 310k b/d ytd. For all of OPEC 2.0, we have the group increasing production in 2H19, but we have it ending 2019 with production 480k b/d lower than last month’s forecast. The increase is mainly from Saudi Arabia, which averages ~ 10.2mm b/d of production in 2H19, roughly 130k b/d below quota. We have Russian production averaging ~ 11.5mm b/d, which is close to quota, in 2H19 (Table 1). Table 1BCA Global Oil Supply - Demand Balances (MMb/d, Base Case Balances)
Supply – Demand Balances Consistent With Higher Oil Prices
Supply – Demand Balances Consistent With Higher Oil Prices
For the year as a whole, we are forecasting OPEC production will fall 1.6mm b/d this year versus 2018 levels, while Russia’s production grows slightly (~ 80k b/d). For next year, OPEC’s production will stay relatively flat (falling ~ 70k b/d), while we expect Russia’s production to increase 230k b/d (Table 1). Outside OPEC 2.0, the U.S. continues to dominate the production-growth story, led by increasing shale-oil output (Chart 2). We expect shale output to grow ~ 1.2mm b/d this year and just over 1mm b/d in 2020. Chart 2U.S. Shales Dominate Non-OPEC Production Growth
U.S. Shales Dominate Non-OPEC Production Growth
U.S. Shales Dominate Non-OPEC Production Growth
Global Demand Is Holding Up While we do expect somewhat lower demand this year and next versus where we were earlier this year, we still expect consumption to remain fairly robust. We expect demand to grow ~ 1.35mm b/d this year and 1.55mm b/d next year, down from 1.50mm and 1.60mm b/d, respectively, in our base case. As always this is led by non-OECD demand growth, which we expect will clock in with an increase of just over 1mm b/d this year versus last year, and 1.3mm b/d next year on average. EM commodity importers will dominate growth, as usual (Chart 3). Trade-war concerns will continue to dominate headlines, but even so, demand remains reasonably stout. While it always is possible the U.S. and China will be able to resolve their trade war – perhaps in dramatic fashion following the G20 meeting in Japan – our colleagues in BCA Research’s doubt it.8 Continuing Sino – U.S. and Iranian – U.S. tension could keep the USD relatively well bid, which will present a headwind to oil demand. That said, we believe central banks generally will feel compelled to remain accommodative so long as trade wars persist. This accommodation, coupled with fiscal stimulus in many of the systemically important economies, will be supportive of demand overall, EM demand in particular. Chart 3EM Oil Demand Growth Once Again Leads The World
EM Oil Demand Growth Once Again Leads The World
EM Oil Demand Growth Once Again Leads The World
Bottom Line: Supply – demand balances indicate crude oil prices still have room to run in 2H19 and next year. We are maintaining our forecast of $73/bbl for Brent this year. We are lowering our forecast for 2020 to $75/bbl (Chart 4). We expect WTI to trade $7/bbl and $5/bbl below those levels this year and next, respectively. The combination of stout demand growth, production discipline by OPEC 2.0 and capital discipline by U.S. shale producers will allow inventories to resume drawing this year (Chart 5). Chart 4Supply - Demand Balances Point To Higher Prices
Supply - Demand Balances Point To Higher Prices
Supply - Demand Balances Point To Higher Prices
Chart 5Stout Demand, Supply Discipline Will Allow Inventories To Draw
Stout Demand, Supply Discipline Will Allow Inventories To Draw
Stout Demand, Supply Discipline Will Allow Inventories To Draw
Robert P. Ryan, Chief Commodity & Energy Strategist rryan@bcaresearch.com Hugo Bélanger, Senior Analyst Commodity & Energy Strategy HugoB@bcaresearch.com Footnotes 1 Please see Analyst: New Photos Are ‘Smoking Gun’ Proving Iranian Involvement in Tanker Attack published by USNI News, and Exclusive: President Trump Calls Alleged Iranian Attack on Oil Tankers 'Very Minor' published by Time magazine on June 17, 2019. 2 Please see Saudi Energy Minister calls for collective effort to secure shipping lanes published by reuters.com June 17, 2019. 3 Please see Exclusive: President Trump Calls Alleged Iranian Attack on Oil Tankers 'Very Minor' published by Time magazine on June 17, 2019. Tessa Berenson reported: “Facing twin challenges in the Persian Gulf, President Donald Trump said in an interview with TIME Monday that he might take military action to prevent Iran from getting a nuclear weapon, but cast doubt on going to war to protect international oil supplies.“I would certainly go over nuclear weapons,” the president said when asked what moves would lead him to consider going to war with Iran, “and I would keep the other a question mark.” 4 Please see Interview: Abundant oil supply prevented spike to $140/b after ship attacks - US DOE deputy published by S&P Global Platts June 16, 2019. 5 Please see World Oil Transit Chokepoints published by the U.S. EIA. 6 Please see Iran nuclear deal: Enriched uranium limit will be breached on 27 June published by bbc.co.uk June 17, 2019. JCPOA agreement between Iran and the so-called P5+1 nations – China, France, Germany, Russia, the U.K. and the U.S. – allowed Iran to return to global markets in exchange for limiting its nuclear development. Please see The Joint Comprehensive Plan of Action (JCPOA) at a Glance published by Arms Control Association in May 2018. 7 Please see The Strategic Threat from Iranian Hybrid Warfare in the Gulf published by CSIS June 13, 2019. 8 Please see Policy Risk Restrains Oil Prices published by BCA Research’s Commodity & Energy Strategy May 30, 2019, where we reprise the different policy risks oil markets are contending with at present, particularly the trade war. It is available at ces.bcaresearch.com. Investment Views and Themes Recommendations Strategic Recommendations Tactical Trades TRADE RECOMMENDATION PERFORMANCE IN 2019 Q1
Image
Commodity Prices and Plays Reference Table Trades Closed in 2019 Summary of Closed Trades Closed
Image
The pressures in Hong Kong also highlight why we view Taiwan as a potential “Black Swan.” Similar political fissures are emerging as Beijing expands its economic and military dominance over Taiwan. Of course, the political backlash against Beijing has…
The current protests are part of a process going back to 2012 in which the disaffected and marginalized parts of Hong Kong society began speaking up against the political establishment. This emerged because of high income inequality, shortcomings in quality…
Highlights Bad news is still looming in the trade war. Public opinion polling in the U.S. gives President Trump more leeway to push the envelope on tariffs and sanctions against China than the consensus recognizes. Trump’s tendency to push the envelope is forcing China into a corner in which structural concessions become too risky. Unrest in Hong Kong reveals the city-state’s political woes as well as the tail-risk of a geopolitical incident in Taiwan. Tariffs on Mexico are still possible. Close long MXN/BRL. Maintain tactical safe-haven plays. Feature Judging by the S&P 500, the Federal Reserve has cut interest rates and the G20 summit between Presidents Donald Trump and Xi Jinping has been a success (Chart 1). Chart 1Trade War? Who Cares!
Trade War? Who Cares!
Trade War? Who Cares!
The problem is that there is not yet a compelling, positive, political catalyst on the trade front. And the Fed has an incentive to wait until after the June 28-29 G20 to make its decision on any cut. At least in the case of the December 1 G20 summit in Buenos Aires there was significant diplomatic preparation ahead of time. That is not yet the case for the summit in Osaka, Japan. And even Buenos Aires ended up being a flop given the subsequent tariff escalation. We are maintaining our tactical safe-haven recommendations – long gold, Swiss bonds, and Japanese yen – until we see a clearer pathway for the risk-on phase to resume amid a summer loaded with fair-probability geopolitical risks: Trump’s aggressive foreign policy, the Democratic primary, China’s domestic policy, the U.S. immigration crisis, and Brexit. Beyond this near-term caution, we agree with BCA’s House View in remaining overweight equities on a cyclical basis (12 months). China’s economic stimulus is likely to pick up further this summer and it still has the capacity to deliver positive surprises. Preparing For The G20 Over the course of this year we have argued for a 50% chance and then 40% chance that the U.S. and China would conclude a trade deal by the G20 summit. However, Commerce Secretary Wilbur Ross and other administration officials, including Chief of Staff Mick Mulvaney, have recently indicated that the best case at the G20 is for the leaders to have dinner and agree to a new timetable that aims to close the negotiations in the coming months. The Trump-Xi summit itself remains unconfirmed as we go to press. This suggests that we were too optimistic about even a barebones trade deal at the G20. We are now extending our time frame to the November 2020 election -- the only deadline that really matters. Diagram 1 presents a cogent and conservative decision tree that results in a 41% chance of a major, Cold War-style escalation in tensions; a 27% chance of a minor escalation that is contained but without a final trade agreement; and a 28% chance of a tenuous or short-term deal. It gives only a 4% chance of a “grand compromise” that initiates a new phase of re-engagement between the two economies. These outcomes clearly represent a large downside risk given where equities are positioned today. Diagram 1Trade War Decision Tree (Updated June 13, 2019)
Another Phony G20? And A Word On Hong Kong
Another Phony G20? And A Word On Hong Kong
Why such gloom when the two sides may be on the brink of a new tariff ceasefire? First, delaying the talks beyond the G20 is disadvantageous for Trump and will make him angry sooner or later. The Trump administration, unlike its predecessors, has made a point of opposing China’s traditional playbook of drawing out negotiations. China benefits in talks over the long run because it gains economic and strategic leverage. This has been the case in every major round of dialogue since the 1980s and it is specifically the case today, as China gradually stimulates its way out of the slowdown that afflicted it at the time of the last G20 (Chart 2). Chart 2China's Bargaining Leverage To Improve On Stimulus
China's Bargaining Leverage To Improve On Stimulus
China's Bargaining Leverage To Improve On Stimulus
Trump would not have called a ceasefire on Dec. 1, 2018 if the stock market had held up amid Fed rate hikes and the Sept. 24 implementation of the 10% tariff on $200 billion. This year the U.S. equity market has bounced back and the Fed has paused, but China’s economy has not yet fully recovered. This gives Trump an advantage that may not last if the talks extend through the rest of the year. And this reasoning explains why Trump raised the tariff rate and blacklisted China’s tech companies in May – to try to clinch a deal by the end of June. He is also threatening to impose tariffs on the remaining $300 billion worth of imports if Xi snubs him in Osaka. If the G20 fails to produce progress, we would bet that Trump will proceed with a sweeping tariff on the remaining $300 billion worth of Chinese imports, whether immediately after the summit or at some later point when he decides that the Chinese are indeed playing for time. How can we be confident of this? After all, Trump’s approval rating has fallen since he escalated the trade war in May and it remains well beneath the average post-World War II presidents at this stage in their first terms, including President Obama’s rating in the summer of 2011 (Chart 3). Recent opinion polls suggest that voters are getting wise to the negative impact of tariffs on their pocketbooks. The financial and political constraints on Trump are not very pressing.
Chart 3
We are confident because the financial and political constraints on Trump are not very pressing, at least not at the moment. First, the stock market has risen despite the tariff hikes, so Trump is likely emboldened. Second, Trump is less constrained in the use of tariffs than in other areas. He is bogged down with a Democratic Congress, investigations, and scandals at home. He cannot pursue policy through legislation – he shifted to the threat of tariffs on Mexico because he could not build his border wall. By turbo-charging his trade policy and foreign policy – against China, Iran, Mexico, Russia, most recently Germany … basically everyone except North Korea – he creates the option of turning 2020 into a “foreign policy election” rather than an election about the economy or social policy. A strong economy has not enabled him to break through his ceiling in public opinion thus far and he will lose a social policy election easily (see health care). The risk of his aggressive foreign policy is that it triggers an international crisis. But that would likely benefit him in the polls, given the natural inclination to defend America against foreign enemies. See George W. Bush, 2004 (Chart 4). Third, popular opposition to Trump’s trade war is not clear-cut – voters are ambivalent. In the past we have shown that President Trump’s 2020 run still depends on his ability to increase voter turnout among whites, specifically white males, low-income whites, and whites without college degrees. Recent polls suggest that voters have turned against tariffs and the trade war – namely the Quinnipiac and Monmouth University polls released in late May after the latest tariff hike. But it is essential to dig beneath the surface. These polls reveal that the key voting groups look more favorably than the rest of the country upon Trump’s policies on both trade and China (Chart 5).
Chart 4
Chart 5
These voters’ assessment of Trump’s performance overall, across a range of policies, is not disapproving, despite all of the unorthodox and disruptive decisions that Trump has made in his presidency thus far (Chart 6).
Chart 6
American voters are neither as enthusiastic about free trade nor as appalled by protectionism as the headline polling suggests. For instance, take the Monmouth University poll, which asked very specific questions about trade, tariffs, and retaliation. If we combine the group of voters who are clearly protectionist with those who are “not sure” or think the answer “depends,” the results do not suggest that Trump is heavily constrained (Table 1). Table 1Americans Are Not As Pro-Free Trade As It Seems
Another Phony G20? And A Word On Hong Kong
Another Phony G20? And A Word On Hong Kong
In swing counties 51% of voters think that free trade is either a bad idea or are undecided. And even 57% percent of voters in counties that voted for Hillary Clinton by more than a 10% margin are in favor of tariffs or unsure. And a majority of voters in the most relevant categories – independents, moderates, non-college graduates, low-income earners – believe that Trump’s tariffs will bring manufacturing back, a highly relevant point for an election that will likely swing on the Rust Belt yet again. This includes Clinton’s most secure districts (Chart 7)!
Chart 7
The point is not that Trump lacks political constraints on the trade war – after all, these voters are on the borderline in many cases and concerned about all-out trade war with China. Rather, his aggressive trade tactics enable him to reconnect with and energize his voter base at a time when his other signature policies are tied down. This is critical because his reelection prospects, which we have pegged at 55%, are in great peril, at least judging by his lag in the head-to-head polling against the top Democrats in swing states. Bottom Line: Going forward, Trump has more room to push the envelope than investors realize. A failed G20 summit poses the risk of another selloff in global equities. We are maintaining our tactical safe-haven trades. What About Xi Jinping’s Constraints? Xi is president for life and must be attentive to long-term ramifications. Chart 8Xi Jinping's Immediate Constraint
Xi Jinping's Immediate Constraint
Xi Jinping's Immediate Constraint
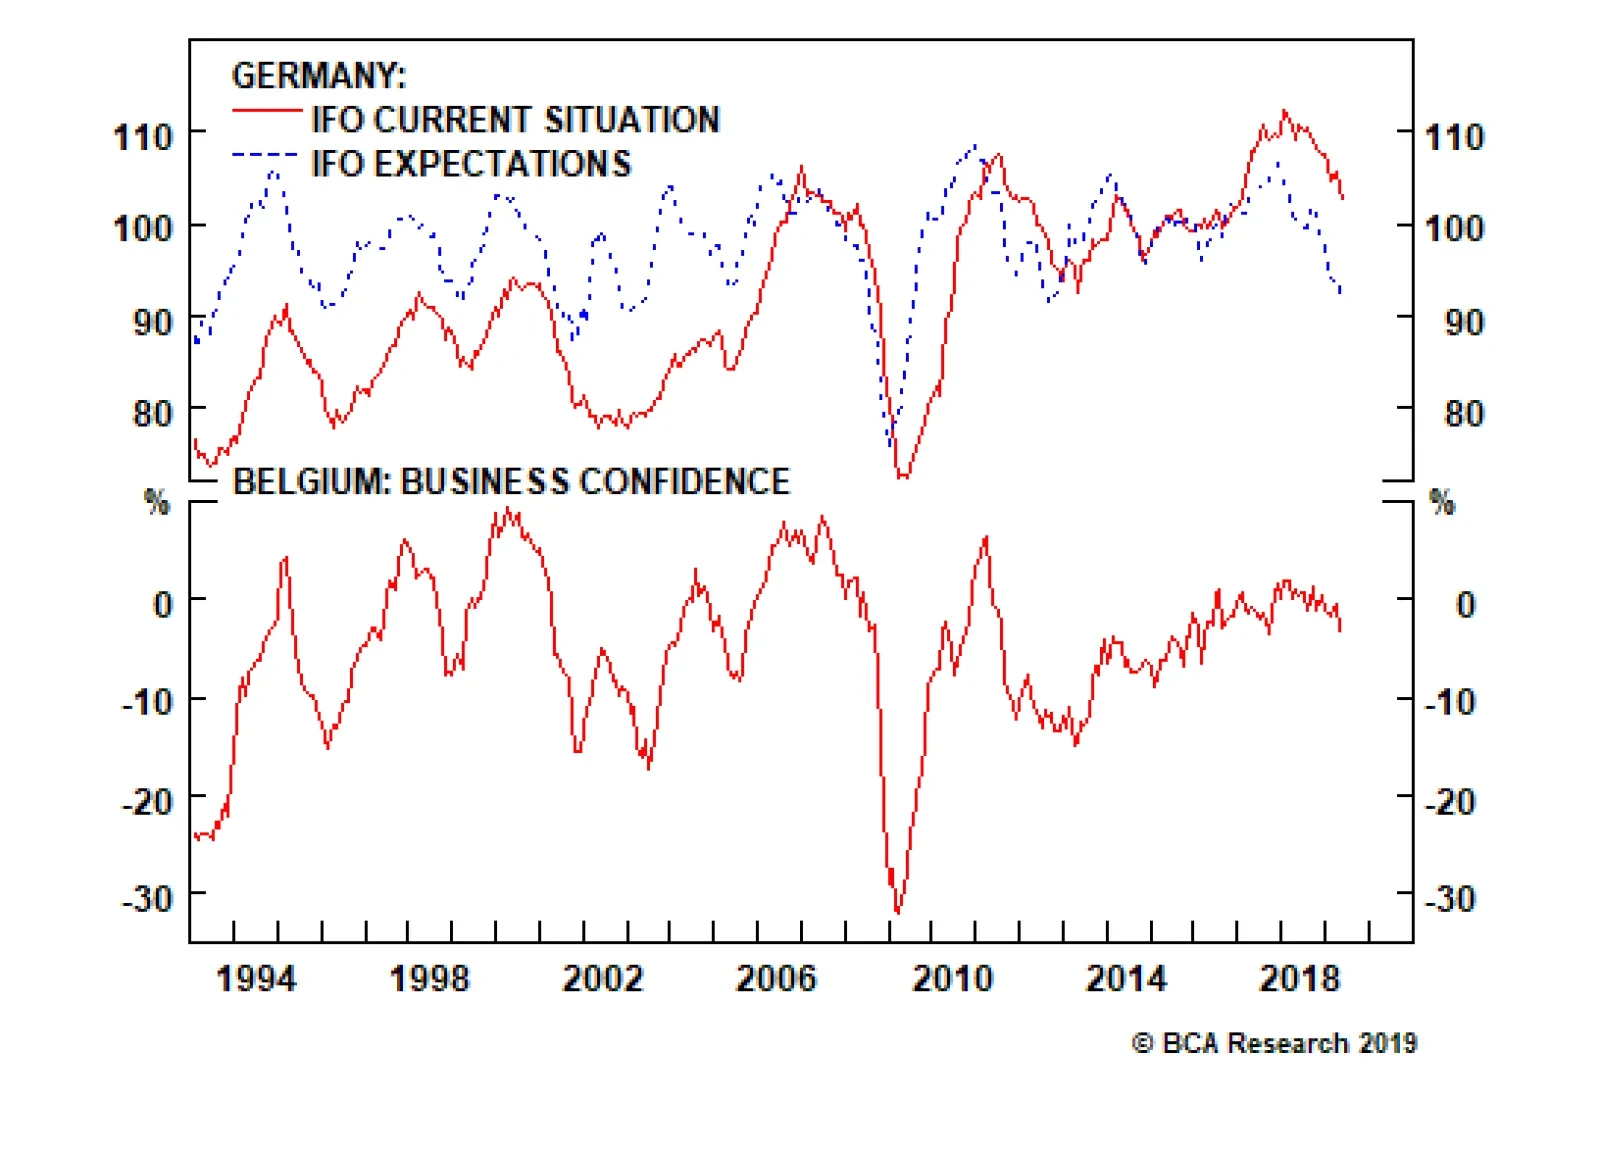
If Trump is tempted to continue pushing the envelope, will President Xi back down? While not constrained by the stock market or elections, he does face the prospect of instability in the manufacturing sector and large-scale unemployment (Chart 8), which Beijing has not had to deal with for 20 years. The point is not to claim that laid-off Chinese workers will turn around and protest against their own country in the face of gunboat diplomacy by capitalist imperialists – on the 70th anniversary of the regime, no less. Rather, Xi is president for life and must be attentive to the long-term ramifications of a disruptive transition in the excessively large manufacturing sector. This would cause economic and, yes, ultimately socio-political problems for him down the road. If Trump continues to move toward his 2016 campaign pledge of a 45% tariff on all Chinese imports, as the 2020 election approaches, China’s leaders have far less incentive to put their careers (and lives) on the line to produce structural concessions. A tariff covering all Chinese goods is an absolutist position that China can only address by doubling down on its demand for full tariff rollback. Yet Trump needs to retain some tariffs to enforce the implementation of any agreement. Thus slapping tariffs on all Chinese imports is almost, but not quite, an irreversible step. This is captured in Diagram 1 via the 29% chance that tensions are contained even if a deal falls through. Tensions are even less likely to be contained if the Trump administration follows through on its threats against China’s tech sector. On August 19, the Commerce Department will decide whether to renew the license for U.S. companies to sell key components to Huawei and other blacklisted companies. If the administration denies the license – and moves further ahead with export controls on emerging and foundational technologies – then Beijing faces an outright technological blockade. It will retaliate against U.S. companies – a process already beginning1 – and will likely act on other threats such as a rare earths embargo. In this case strategic tensions will escalate dramatically, including saber-rattling in the air, in cyberspace, or on the high seas. At the moment political frictions in Hong Kong are exacerbating U.S.-China distrust. Bottom Line: Since President Xi’s constraints are longer-term, he has the ability to deny structural concessions to Trump. But Trump’s ability to push the trade war further and further risks forcing China to a point of no return. There is not a clear basis for the geopolitical risk affecting the global trade and growth outlook to fall. Hong Kong: A New Front In The U.S.-China Struggle The large-scale protests that have erupted in Hong Kong – first on April 28 and most recently on June 9 –are important for several reasons: they highlight the immense geopolitical pressure in East Asia emanating from China’s “New Era” under Xi Jinping; they are rapidly becoming entangled in U.S.-China tensions, particularly over technological acquisition; and they foreshadow the political instability on the horizon in Taiwan. Tensions have been rising between Hong Kong and mainland China since the Great Recession and the shock to capitalist financial centers around the world. The tensions are symptomatic of the dramatic change in China over the past decade; the decline of the post-Cold War status quo; and the broader decline of the western world order (e.g. the British Empire). After all, the West is lacking tools to preserve the rights and privileges that Hong Kong was supposed to be guaranteed when the transfer of sovereignty occurred in 1997. More immediately, the current protests are part of a process going back to 2012 in which the disaffected and marginalized parts of Hong Kong society began speaking up against the political establishment. This emerged because of high income inequality (Chart 9), shortcomings in quality of life, excessive property prices (Chart 10), and the mainland’s reassertion of Communist Party rule and encroachments on Hong Kong’s autonomy.
Chart 9
Chart 10Another Source Of Hong Kong's Unrest
Another Source Of Hong Kong's Unrest
Another Source Of Hong Kong's Unrest
A simple comparison with Singapore, the other major East Asian city-state, shows that Hong Kong has trailed in GDP per capita and wage gains, while property price inflation has soared ahead (Chart 11). These structural economic factors contributed to the emergence of the “Occupy Central” protests in 2014, which were smaller than today’s protests but signaled the abrupt shift in the political sphere toward disenchantment and activism. Chart 11Why Hong Kong Is Not As Quiet As Singapore
Why Hong Kong Is Not As Quiet As Singapore
Why Hong Kong Is Not As Quiet As Singapore
The 2016 elections for the Legislative Council (LegCo) resulted in a fiasco by which a number of pro-democracy activists, known as “localists,” were squeezed out of the legislature through a combination of juvenile mistakes and heavy-handed intervention by Beijing and the pro-mainland Hong Kong authorities (Chart 12 A&B). Beijing exploited the occasion to extend its legal writ over Hong Kong society and curb some of the city’s freedoms.2 The democratic opposition and dissidents have been sidelined or repressed — and now they face the prospect of being extradited, given that the LegCo is highly likely to pass the “Fugitive Offenders and Mutual Legal Assistance in Criminal Matters” bill that sparked the protests this year.
Chart 12
Chart 12
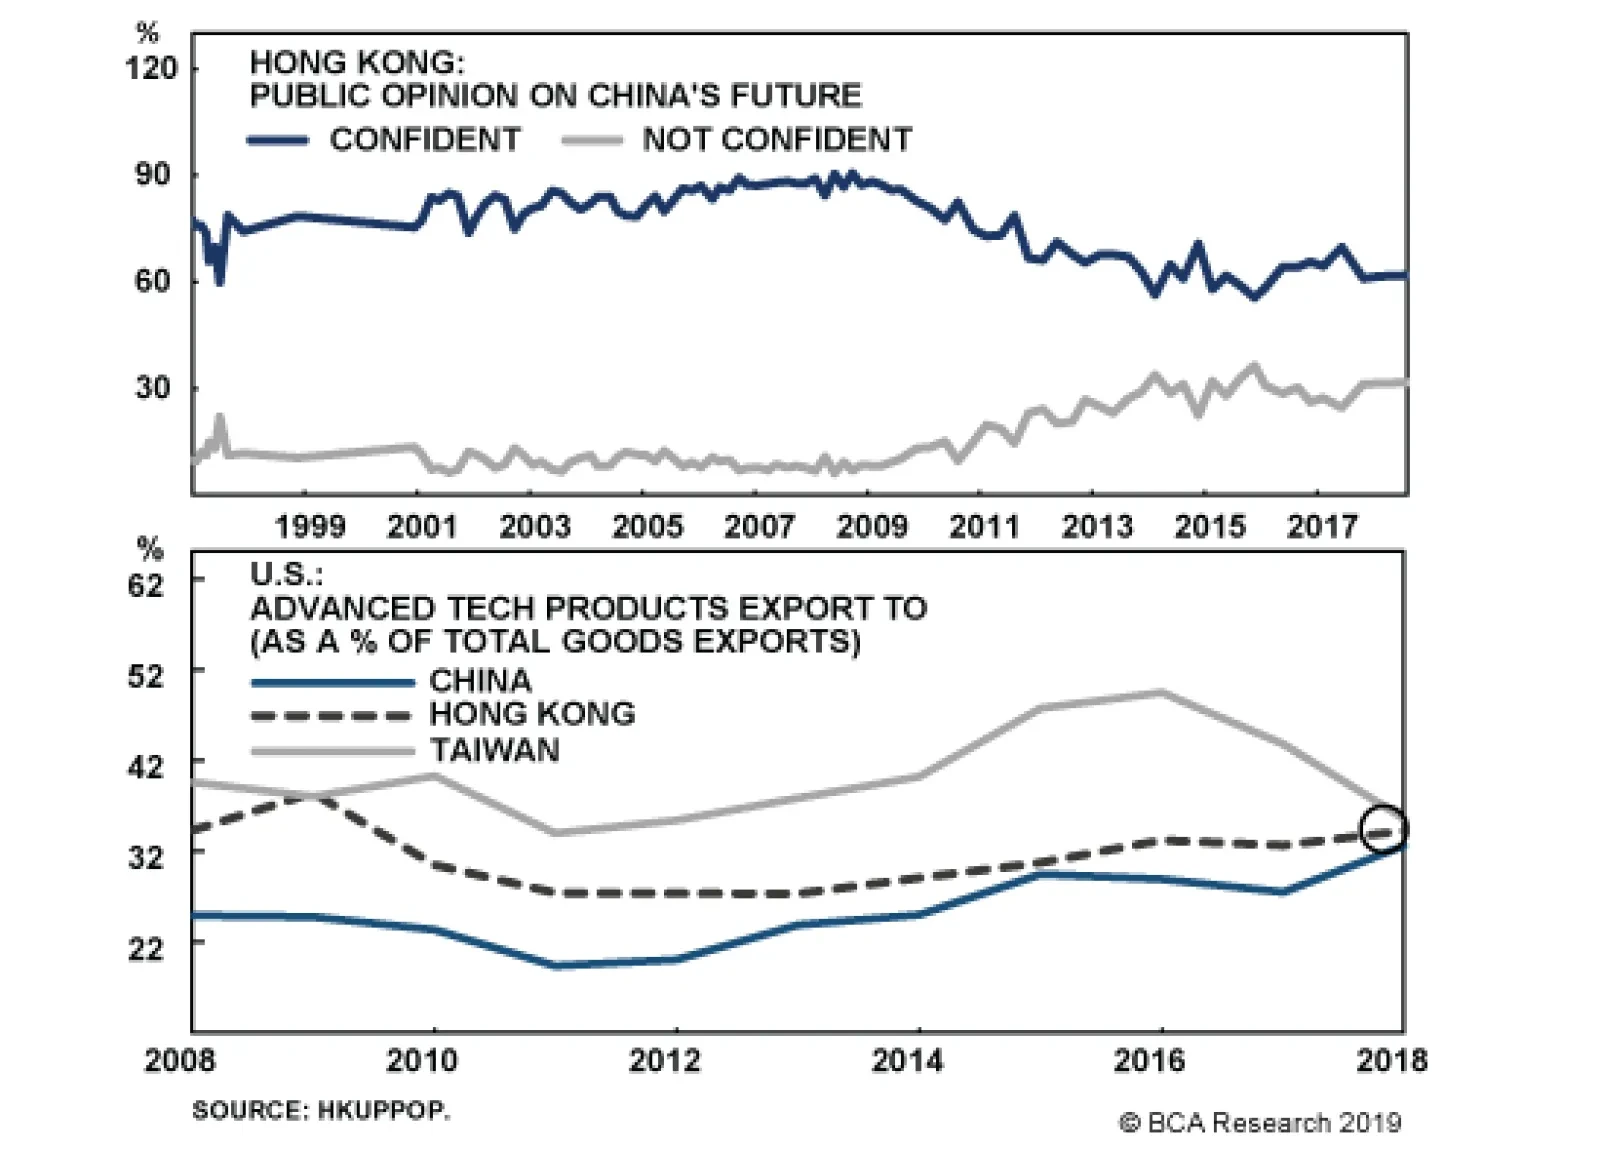
The exclusion of the localists from power runs the risk of radicalizing them and increasing disaffection, making mass protests likely to recur both in the near term and in future. Hong Kongers are losing confidence in the “One Country, Two Systems” arrangement (Chart 13). They are similarly becoming more disillusioned with mainland China, adding fuel to the fire over time (Chart 14). However, in the specific case of the city-state, there is no alternative to Beijing’s ultimate say – and the older generations will continue to support the political establishment.
Chart 13
Chart 14
Nevertheless Hong Kong’s discontents will become entangled in the broader Cold War emerging between the U.S. and China. Beijing is accusing the protesters of being lackeys of foreign powers. The U.S. Congress, on both sides of the aisle, is threatening to declare that Hong Kong is no longer sufficiently autonomous from Beijing and therefore no longer eligible for special privileges. Hong Kong faces rising political dependency on China and the potential for special relations with the United States to decline.
Chart 15
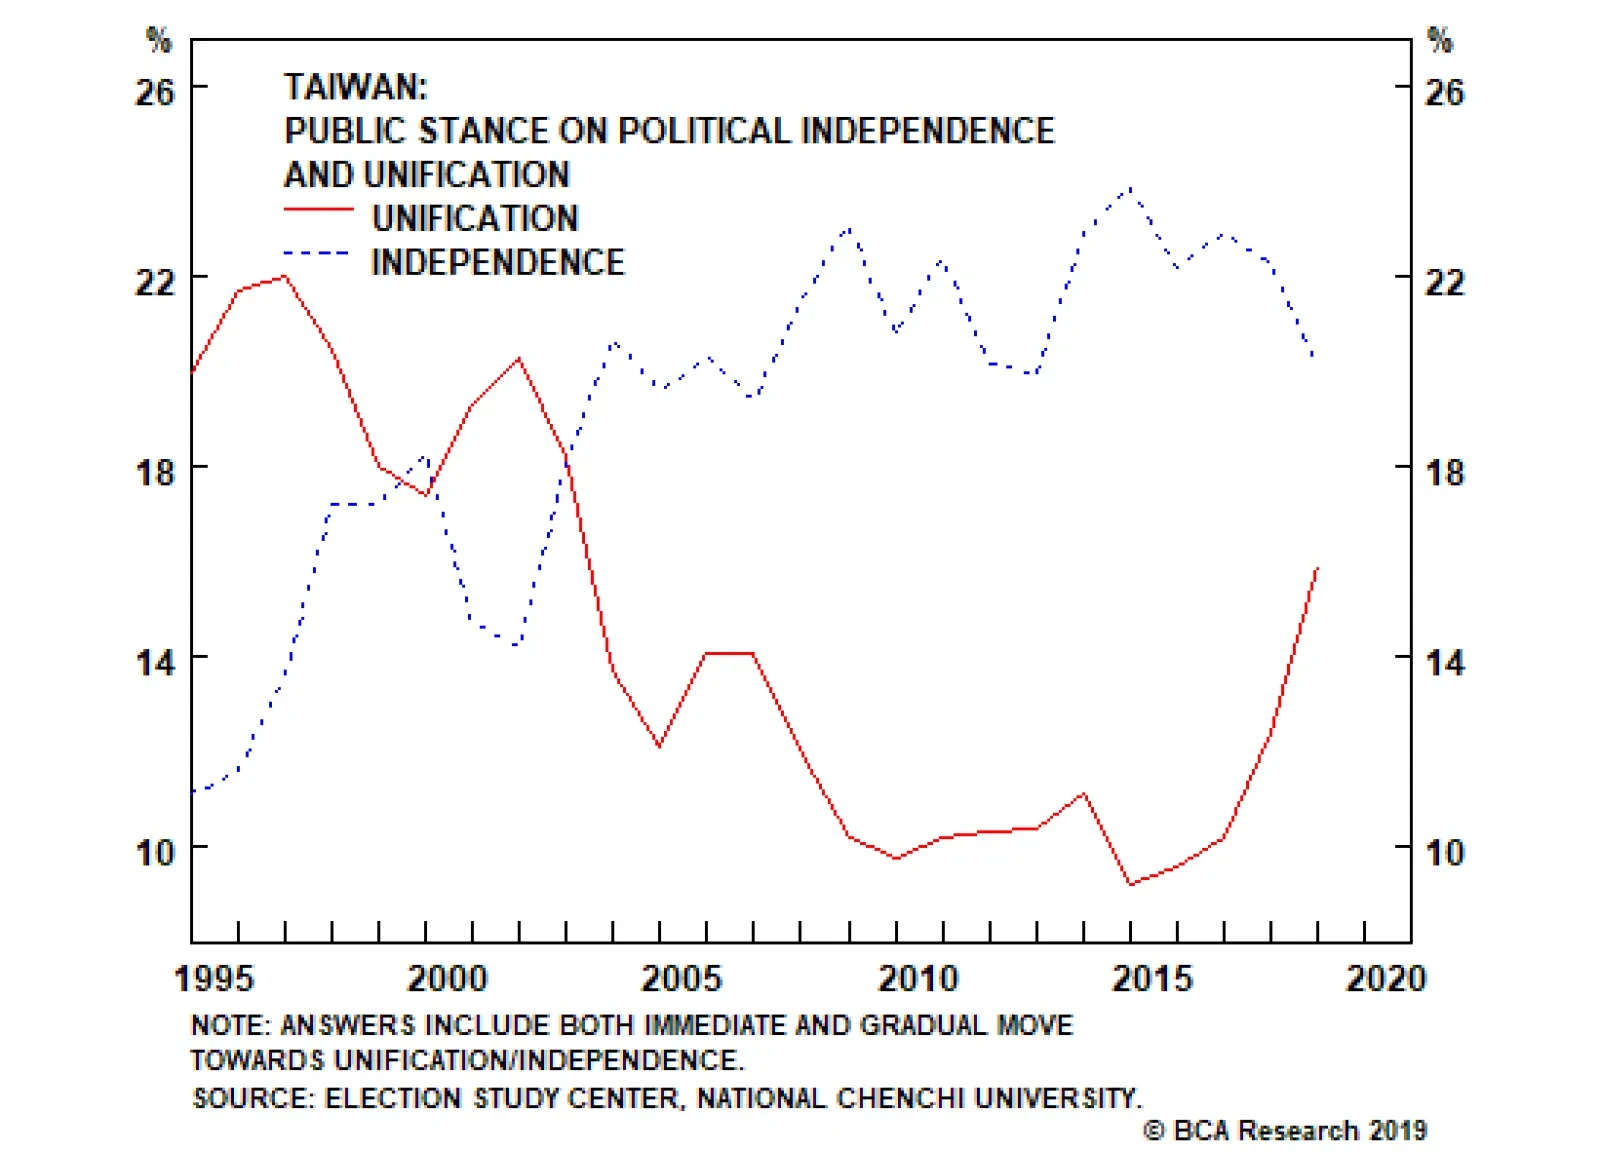
Part of Washington’s concern lies with Beijing’s aggressive technological acquisition program. Hong Kong has been able to import advanced dual-use technology products from the United States without Beijing’s restrictions. This is not apparent from the proportion of exports but it is important on the technological level (Chart 15). It introduces a backdoor for China to acquire these goods and has prompted a rethink in Washington. Hong Kong is also accused of facilitating the circumventing of sanctions on U.S. enemies. It thus faces rising political dependency on China and the potential for special relations with the United States to decline. These pressures also highlight why we view Taiwan as a potential “Black Swan.” Similar political fissures are emerging as Beijing expands its economic and military dominance over Taiwan. Of course, the political backlash against Beijing has recently been receding in Taiwanese opinion, due to the fact that the nominally pro-independence Democratic Progressive Party has lost most of the momentum it gained after the large-scale “Sunflower” student protests of 2014 (Chart 16). But there are still several reasons that the January 2020 election could become a geopolitical flashpoint: namely the developments in Hong Kong, China’s handling of them, Beijing’s tensions with Washington, and the Trump administration’s temptation to achieve some key goals with the Tsai Ing-wen administration before it leaves office (including arms sales). Even if the Taiwanese political winds shift to become less confrontational toward Beijing after January, the time between now and then is ripe for an “incident” of some kind. Beyond that, the pro-independence opposition will begin activating and marching against the next government if it proves obsequious to the mainland. Chart 16Taiwan: Pro-Mainland Forces Revive
Taiwan: Pro-Mainland Forces Revive
Taiwan: Pro-Mainland Forces Revive
Chart 17
Over the long run, Taiwan is far more autonomous than Hong Kong, harder for Beijing to control, and much more attractive for Beijing’s enemies to defend – namely the U.S. and Japan. Moreover, as the tech conflict with Washington heats up, Taiwan becomes vital for China’s technological self-sufficiency, putting it at higher risk (Chart 17). Beijing will also frown upon the role of Taiwanese companies like FoxConn for taking early steps to diversify the supply chain away from China. This regional strategic reality is not conducive to U.S.-China trade negotiations. And even aside from the U.S., Beijing’s growing power generates resistance from its periphery. This is true of Chinese ally North Korea, which is trying to broaden its options, as well as a historic enemy like Vietnam. Other countries at a bit more of a distance are trying to accommodate both Beijing and Washington, but are increasingly seeing their regimes vacillate based on their orientation toward China – this is true of Thailand in 2014, the Philippines in 2015, South Korea in 2017, and Malaysia in 2018. These changes inject economic policy uncertainty on the country level. Over the long run we see Southeast Asia as a beneficiary of the relocation of supply chains out of China. But at the moment, with the trade war escalating and unresolved and with China taking a heavier hand, we are only recommending holding relatively insulated countries like Thailand. Bottom Line: Our theme of U.S.-China conflict is intertwined with our theme of geopolitical risk rotation to East Asia. States that have domestic-oriented economies, limited exposure to China, or greater U.S. support – including Japan, Thailand, South Korea, Indonesia, and Malaysia – face less geopolitical risk than those heavily exposed to China (Taiwan) or that lack U.S. security guarantees (Hong Kong, Vietnam). Investment Recommendations In addition to our safe-haven tactical trades – long spot gold, long Swiss bonds, and long JPY-USD – we are maintaining our long recommendation for a basket of companies in the MVIS global rare earth and strategic metals index. The basket includes companies not based in mainland China that have seen their stock prices appreciate this year yet have a P/E ratio under 35 (Chart 18). Chart 18Go Long Rare Earth Firms Ex-China
Go Long Rare Earth Firms Ex-China
Go Long Rare Earth Firms Ex-China
We remain short the CNY-USD on the expectation that trade tensions will encourage Beijing to use depreciation as a countervailing tool, despite our expectation of increasing fiscal-and-credit stimulus. Over the long run, we would observe that trade escalation between the U.S. and China bodes poorly for China’s long-term productivity and efficiency. The basis for a reduction in trade tensions is a recommitment to the liberal structural reform agenda that Chinese state economists outlined at the beginning of Xi Jinping’s term in 2012-13. The current trajectory of “the New Long March,” in which Beijing pursues personalized power and uses stimulus to improve self-sufficiency and import-substitution, goes the opposite direction. It is not a pathway for innovation, openness, and technological progress. A simple comparison of China’s long-term equity total return highlights the market’s lack of enthusiasm about the current administration’s approach (Chart 19). The contexts were different, but the earlier outperformance grew from painful structural reforms and a grand compromise with the United States in the late 1990s and early 2000s. Chart 19The Market Wants Reforms And Trade Deal
The Market Wants Reforms And Trade Deal
The Market Wants Reforms And Trade Deal
We are closing our long MXN / short BRL trade for a gain of 4.6%. This trade has bounced back from the U.S.-Mexico deal to avert tariffs. The agreement was not entirely hollow compared to earlier agreements: it calls for Mexico to accelerate the deployment of the National Guard to stem the flow of refugees from Guatemala and central America and expand the Migrant Protection Protocols across the southern border. Trump’s reversal – under Senate pressure, entirely unlike the China dynamic – gave the peso a boost, benefiting our trade. However, one of the fundamental reasons for this trade – the improvement in Mexico’s relative current account balance – has now rolled over (Chart 20) and the tariff threat will reemerge if Mexico proves unable or unwilling to stem the inflow of asylum seekers into the United States (Chart 21). Chart 20Peso Has Outperformed The Real
Peso Has Outperformed The Real
Peso Has Outperformed The Real
Chart 21
As we go to press, the attacks on tankers in Oman highlight our view that oil prices will witness policy-induced volatility and a rising geopolitical risk premium as “fire and fury” shifts to the U.S. and Iran in the near-term. Our expectation of increasing Chinese stimulus helps underpin the constructive view on oil and energy-producing emerging markets. Matt Gertken, Vice President Geopolitical Strategist mattg@bcaresearch.com Footnotes 1 The American Chamber of Commerce in China and Shanghai released a survey on May 22, 2019 revealing that while 53% of companies have not yet experienced “non-tariff” retaliation by Chinese authorities, 47% had experienced it: 20.1% through increased inspections; 19.7% through slower customs clearance; 14.2% through slow license approvals; another 14.2% through bureaucratic and regulatory complications; and smaller numbers dealing with problems associated with American employees’ visas, increased difficulty closing investment deals, products rejected by customs, and rejections of licenses and applications. 2 We noted at the time, “Mainland forces will bring down the hammer on the pro-independence movement. The election of a new chief executive will appear to reinforce the status quo but in reality Beijing will tighten its legal, political, and security grip. Large protests are likely; political uncertainty will remain high.” See BCA Geopolitical Strategy, “Strategic Outlook 2017: We Are All Geopolitical Strategists Now,” December 14, 2016, available at www.bcaresearch.com.
The no-deal option is the default scenario if an agreement is not finalized by the Halloween deadline and no further extension is granted. However, Speaker of the House of Commons John Bercow recently stated that the prime minister will be unable to deliver a…
While the timeline for this process is straightforward, the impact on the Brexit process is not. The odds of a “no-deal Brexit” have increased but so has the prospect of parliament passing a soft Brexit prior to any new election or second referendum. Today…
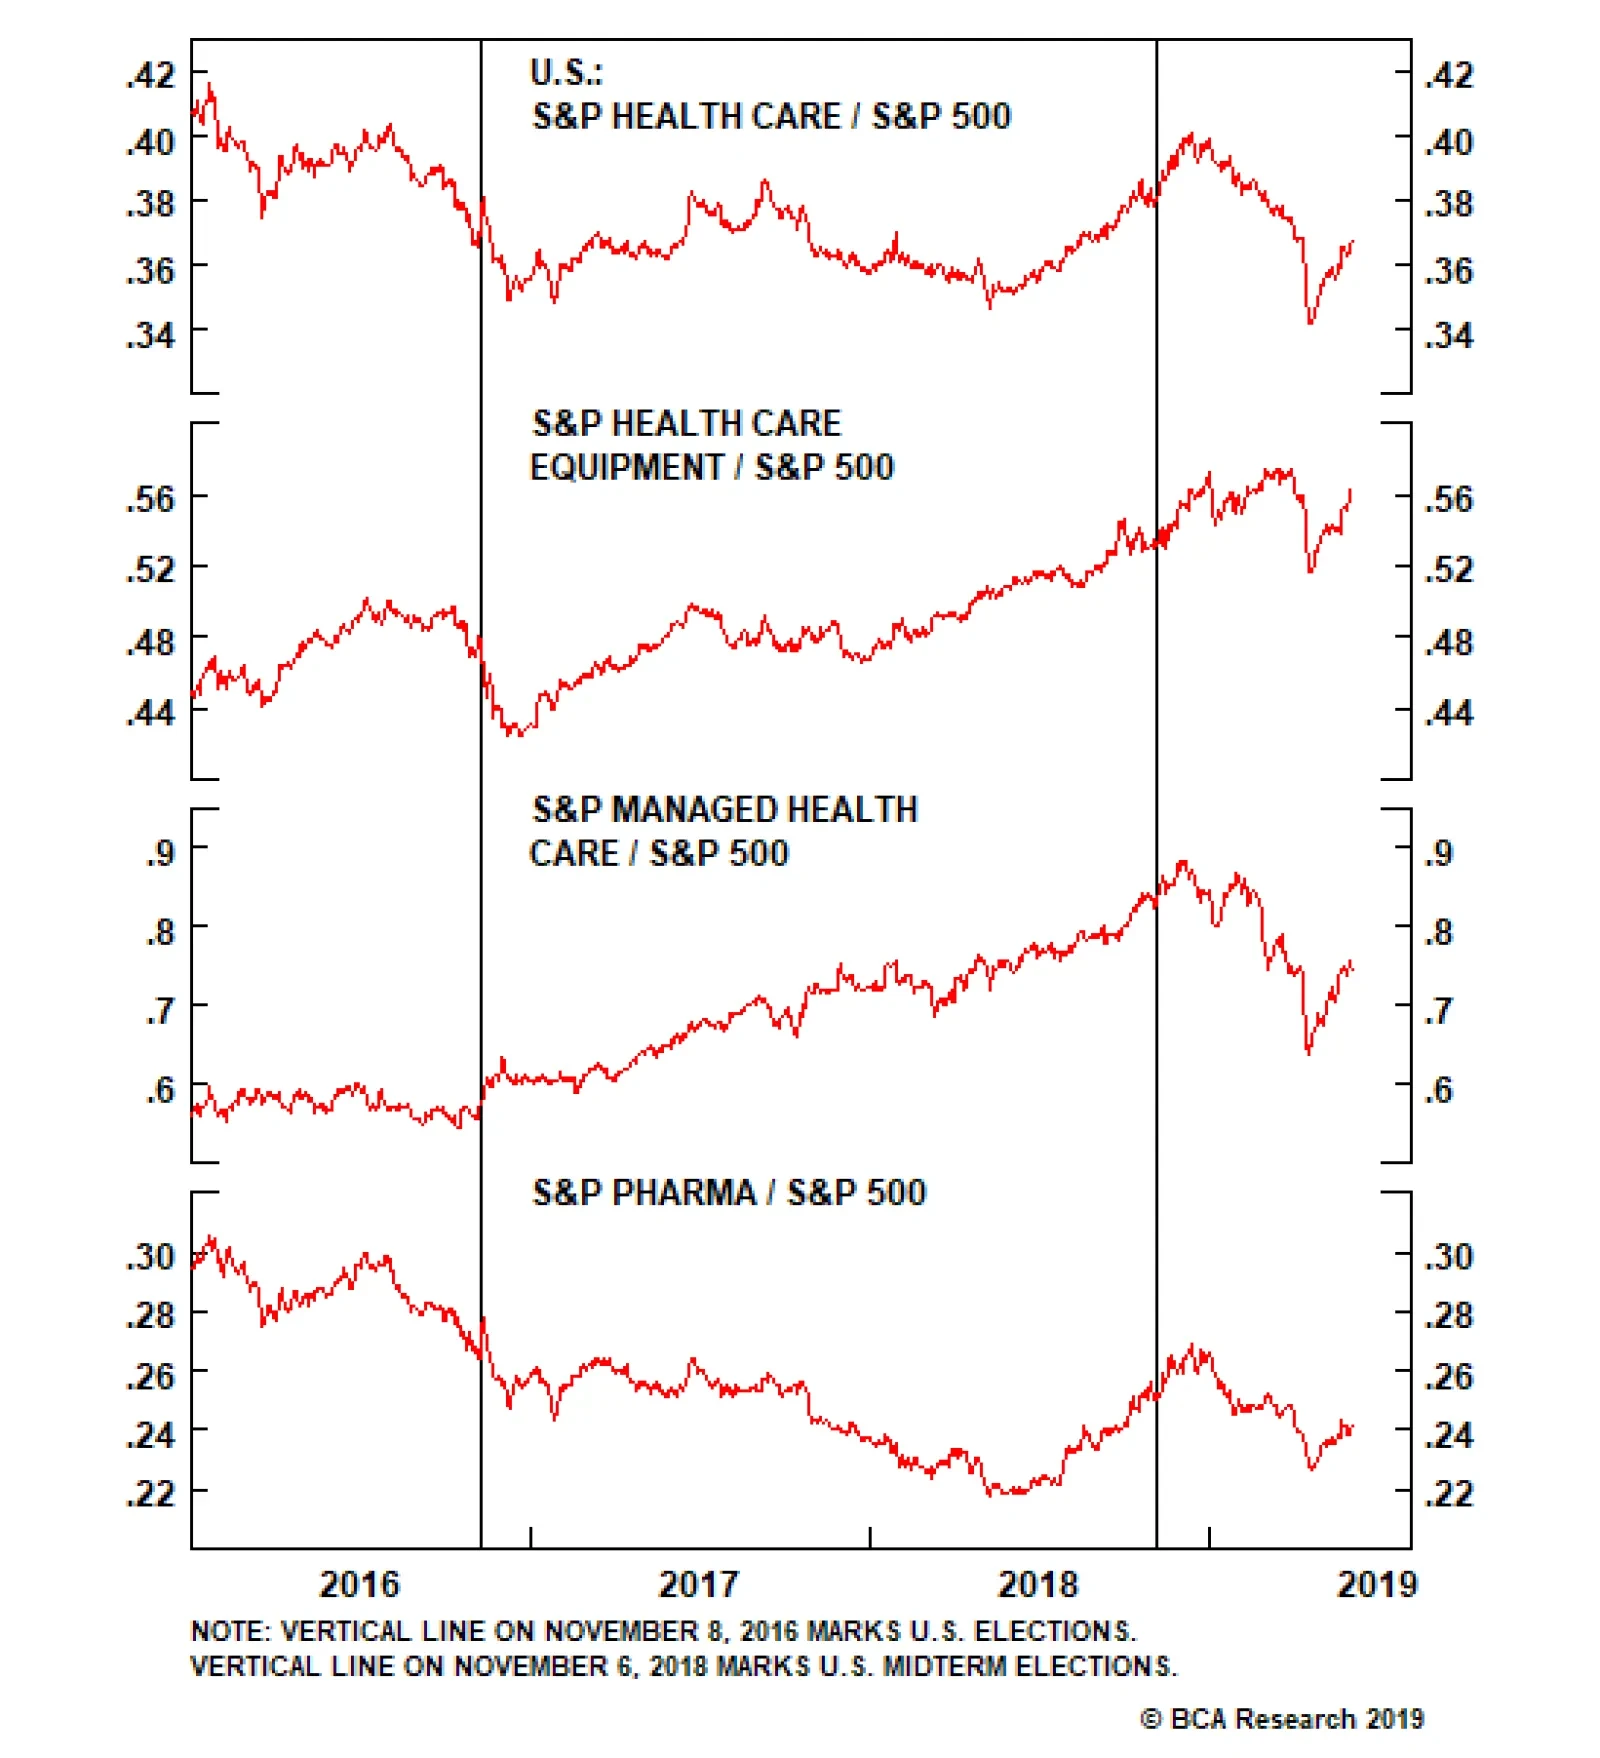
In the lead up to the 2016 U.S. presidential election, Hillary Clinton, a health care reformer (though importantly NOT a Medicare for All advocate) was polling well ahead of Donald Trump. Health care stocks underperformed the broad market in anticipation of…
Our Geopolitical Strategy service attempts a conservative, back-of-the-envelope method for estimating the probability of passage. It runs like this: There is a 50% chance a progressive wins the Democratic nomination. We assume that if Biden wins it is…