Geopolitics

Highlights The breakout in financial asset prices stands at odds with a deteriorating profit outlook. This suggests a high probability of a coiled-spring reversal in one of the two variables as we enter the thin summer trading months. We are maintaining a pro-cyclical currency stance, but are making a few portfolio tweaks in case we are caught offside during what could be a volatile summer. Maintain very tight stops on cable at 1.25, but look to sell EUR/GBP between 0.92 and 0.94. Our top pick for long positions are petrocurrencies, as geopolitical support is unlikely to ebb anytime soon. Buy a speculative basket of the Norwegian krone, Russian ruble, Mexican peso, and Colombian peso versus the euro. The latest RBA interest rate cut might be the ultimate insurance backstop needed to jumpstart the Australian economy. Remain long the Aussie dollar versus both the greenback and the kiwi, but with tight stops on the former. Any “flash crashes” are likely to favor the currencies of countries where tradeable bonds are in short supply. Remain short USD/JPY. Also, tactically sell gold bullion versus the yen. Feature Chart I-1The Markets And Data Diverge
The Markets And Data Diverge
The Markets And Data Diverge
Financial markets are at an important crossroads as we head into the thin summer trading months. Asset prices have been reflated by plunging bond yields, with the S&P 500 hitting fresh highs this week. On the other hand, incoming manufacturing data across the major economies continue to deteriorate, suggesting the profit cycle remains in a downtrend. Either markets get better visibility into an improving profit outlook, or stock prices will succumb to the pressure of incoming data weakness (Chart I-1). For currency strategy, this means fundamentals could be temporarily put to the wayside, as markets flip the switch towards risk aversion. Our recommendations this week are threefold. First, maintain tight stops on tactical positions, especially those susceptible to summer volatility. Topping this list is our long position in the British pound. Second, our top pick for long positions are petrocurrencies, as geopolitical support is unlikely to ebb anytime soon. Finally, maintain portfolio insurance by being short the USD/JPY. Also, sell gold against the yen, given that relative sentiment has shifted in extreme favor of the former. A Summer Attack On The Pound? The episodes leading to the collapse of the pound in 1992 have important lessons for today.1 Britain entered the Exchange Rate Mechanism (ERM) in October of 1990 in an attempt to find a stable nominal anchor. In the years preceding entry into the ERM, inflation in the U.K. had been high and rising, leading to an appreciation in the real exchange rate. The rationale was that by adopting German interest rates, inflation would finally be tempered, and the real exchange rate would eventually be realigned. Most of the adjustment in the pound happened quickly, but a key difference from today is that exit from the ERM was unanticipated, unlike Brexit. During the ensuing years, pressure on the pound was relatively short-lived and could be quickly reversed by foreign exchange interventions or modest increases in interest rates. Meanwhile, the prospect of a European Monetary Union (EMU) also provided an anchor for expectations, since it would allow for more sound domestic policies. Problems began to surface in June 1992, when the Danes voted no in a referendum on the Maastricht Treaty that included a chapter on the EMU. This led to severe doubts about the progress made towards a union, especially as the outcome of the French referendum in September was expected to be close. Investors began to question where the shadow exchange rate for ERM currencies lay, especially where the Italian lira or the Spanish peseta were concerned. In August of that year, Britain began to massively step up interventions in the foreign exchange market, having to borrow excessively through the Very Short Term Financing facility (VSTF) to increase reserves. It also promised to raise interest rates from 10% to 12%, and later to 15%. But as an overvalued exchange rate had generated extremely sluggish GDP growth going into the 1990s, markets were not convinced the U.K. would tap into its unlimited borrowing facility or raise interest rates sufficiently to defend the pound. On black Wednesday in September 1992, Britain suspended membership to the ERM. There are a few important lessons that stand in stark contrast to a hard Brexit: Most of the adjustment in the pound happened quickly, but a key difference from today is that exit from the ERM was unanticipated, unlike Brexit. Foreign exchange markets are extremely fluid and adjust to expectations quite quickly, usually with overshoots or undershoots. From its peak, GBP/USD depreciated by 24% by the end of October 1992. It subsequently fell to a low of 1.418 in February 1993 (Chart I-2). Peak to trough, cable has already fallen by 28%. Judging from the real effective exchange rate adjusted for consumer prices, the pound was overvalued as the U.K. entered the ERM. A persistent inflation differential between the U.K. and Germany had led to significant appreciation in the real rate. That gap is much narrower today (Chart I-3). Chart I-2The Pound Drop During ERM Was Quick And Violent
The Pound Drop During ERM Was Quick And Violent
The Pound Drop During ERM Was Quick And Violent
Chart I-3Not Much Misalignment In##br## U.K. Prices Today
Not Much Misalignment In U.K. Prices Today
Not Much Misalignment In U.K. Prices Today
The overvaluation of the pound meant that domestic growth was under tremendous pressure. Growth was already at recessionary levels entering into the ERM. Meanwhile, a bursting real estate bubble necessitated lower, not higher interest rates. This put to test the credibility of the peg. Today, U.K. growth is outpacing that of Germany, and will only improve if the pound drops further (Chart I-4). Productivity in the U.K. has kept pace with that of Germany over the last several years, suggesting the fall in the pound has been unwarranted. The Tory government runs a balanced budget and the Bank of England has much foreign exchange reserves to intervene in the market should confidence in the pound collapse. More importantly, the British currency is freely floating meaning there are less “hidden sins” compared to the fixed exchange rate period when it had to use the VSTF facility to boost reserves (Chart I-5). Chart I-4The U.K. Is Growing Faster Than The Eurozone's Engine
The U.K. Is Growing Faster Than The Eurozone's Engine
The U.K. Is Growing Faster Than The Eurozone's Engine
Chart I-5Britain Has Lots Of ##br##FX Reserves
Britain Has Lots Of FX Reserves
Britain Has Lots Of FX Reserves
A new conservative leadership is, at the margin, more negative for the pound (the assessment of our geopolitical strategists is that the odds of a hard Brexit have risen to 21% from 14%). However, our simple observation is that the pound is below where it was after the 2016 referendum results, yet more people are now in favor of staying in the union (Chart I-6). The pound is below where it was after the 2016 referendum results, yet more people are now in favor of staying in the union. This dichotomy might be the reason why in a speech this week, BoE Governor Mark Carney continued to highlight the growing divergence between market interest rate expectations (almost a 50% probability of a cut this year) and the central bank’s more hawkish bias. The experience of the ERM suggests it will be extremely destabilizing for the pound if the BoE is unable to anchor market interest rate expectations. This is especially true since the second quarter is likely to be a very weak one, leaving little time for data improvement until the October 31st Brexit deadline. Chart I-6More People In Favour Of The Union
More People In Favour Of The Union
More People In Favour Of The Union
Chart I-7Cable Valuation Reflects Brexit Risk
Cable Valuation Reflects Brexit Risk
Cable Valuation Reflects Brexit Risk
Putting it all together, our bias is that if there is a hard Brexit, the pound could easily drop to the 1.10-1.15 zone. Part of this move will be an undershoot. The real effective exchange rate of the pound is now lower than where it was after the U.K. exited the ERM in 1992, with a drawdown that has been of similar magnitude (24% in both episodes) (Chart I-7). In the case of a soft Brexit (or no Brexit), the pound should converge toward the mid-point of its (or above) historical real effective exchange rate range, which will pin it 15-20% higher, or at around 1.50. As for EUR/GBP, U.K. gilt yields stand at 108-basis-point over German bunds, an attractive spread should carry trades return in favor. Historically, such a spread has usually pinned the EUR/GBP much lower (Chart I-8). Yes, incoming data in the U.K. has softened, but employment growth has been holding up, wages are inflecting higher and the average U.K. consumer appears in decent shape. Investment and construction have been the weak spot in the U.K. economy, but may marginally improve on lower rates. Meanwhile, from a technical perspective, the pound is also oversold versus the euro (Chart I-9). Chart I-8EUR/GBP Is A Sell Long-Term
EUR/GBP Is A Sell Long-Term
EUR/GBP Is A Sell Long-Term
Chart I-9EUR/GBP Is Overbought
EUR/GBP Is Oversold
EUR/GBP Is Oversold
Bottom Line: Stay long the pound as we enter volatile summer trading, but maintain tight stops at 1.25. Sell EUR/GBP if 0.94 is touched. Buy A Speculative Basket Of Petrocurrencies Rising geopolitical tensions between the U.S. and Iran continue to support oil prices. Meanwhile, at its latest meeting, OPEC agreed to extend its production cuts to the first half of 2020. This will put upward pressure on forward curves, nudging oil near our Commodity & Energy Strategy service’s target of $75 per barrel.2 Should demand pick up later this year, it will supercharge the uptrend. More importantly, the risk of escalation between Iran and the U.S. is high, given that the former has been backed up into a corner on falling oil exports. Together with a weakening U.S. dollar, this will be categorically bullish for petrocurrencies. In our currency portfolio, we are long the NOK versus both the SEK and CAD as exposure to both crude oil prices and the Brent premium. This week, we are adding a speculative basket of the Colombian peso, Mexican peso and Russian ruble to benefit from any surge in the oil geopolitical risk premium. This basket is attractive for two reasons. First, the currencies are trading at a discount to what is implied by the oil price (Chart I-10). This discount could rapidly close if it becomes evident that oil supplies are at major risk. It is also beneficial that the shipping routes these supplies take categorically avoids the Straits of Hormuz, or the epicenter of the conflict. Second, the carry from the trade is attractive at 5%, which provides some cushion against downside risks. The risk of escalation between Iran and the U.S. is high. Together with a weakening U.S. dollar, this will be categorically bullish for petrocurrencies. The positive correlation between petrocurrencies and oil has been gradually eroded as the U.S. economy has become less and less of an oil importer. Meanwhile, Norwegian production has been falling for a few years. This is why it may be increasingly more profitable to be long a basket of petrocurrencies versus oil-consuming nations rather than the U.S. Going long versus the euro is also a cushion against a knee-jerk rally in the dollar. Also going long a basket of higher-yielding EM petrocurrencies versus DM ones is a good bet (Chart I-11). Chart I-10Petrocurrencies Are Attractive
Petrocurrencies Are Attractive
Petrocurrencies Are Attractive
Chart I-11EM Versus DM Oil Basket
EM Versus DM Oil Basket
EM Versus DM Oil Basket
Bottom Line: Buy a speculative basket of the Norwegian krone, Russian ruble, Mexican peso and Colombian peso versus the euro. Investors should also consider a basket of EM petrocurrencies versus DM ones. A Final Note On Gold The short-term technical picture for gold has become unfavorable. This suggests that investors could be caught offside in the interim holding gold as a hedge. We recommend swapping some gold bullion for yen to insure against this risk for three reasons: As both are safe-haven proxies, yen in gold terms has tended to mean revert since 2012, so as to maintain a stable ratio of 138,000 JPY per ounce of gold. Today, the yen is sitting at two standard deviations below this range (Chart I-12). Open interest for gold is surging towards new highs, while that of the yen is making fresh lows. In the case of a rush towards safe havens, the liquidity squeeze is likely to favor appreciation in the yen (Chart I-13). Chart I-12Sell Some Bullion For Yen Paper
Sell Some Bullion For Yen Paper
Sell Some Bullion For Yen Paper
Chart I-13A Liquidity Squeeze Could Favor The Yen
A Liquidity Squeeze Could Favor The Yen
A Liquidity Squeeze Could Favor The Yen
Speculators are long gold but short the yen, which is attractive from a contrarian standpoint (Chart I-14). Chart I-14Speculators Are Long Gold And Short Yen
Speculators Are Long Gold And Short Yen
Speculators Are Long Gold And Short Yen
Bottom Line: Remain short USD/JPY and sell a basket of gold versus some yen. Chester Ntonifor, Foreign Exchange Strategist chestern@bcaresearch.com Footnotes 1 Mathias Zurlinden, “The Vulnerability of Pegged Exchange Rates: The British Pound in the ERM,” Economic Research, Vol. 75, No. 5 (September/October 1993). 2 Please see Commodity & Energy Strategy Weekly Report, titled “Oil Volatility Will Abate As Financial Conditions Ease,” dated July 4, 2019, available at ces.bcaresearch.com Currencies U.S. Dollar Chart II-1USD Technicals 1
USD Technicals 1
USD Technicals 1
Chart II-2USD Technicals 2
USD Technicals 2
USD Technicals 2
Recent data in the U.S. have been soft: Headline PCE fell to 1.5% year-on-year in May. Core PCE was unchanged at 1.6% year-on-year. Personal income growth was unchanged at 0.5% month-on-month in May, while personal spending fell to 0.4% month-on-month. Markit composite and manufacturing PMI both increased to 51.5 and 50.6 in June. However, ISM manufacturing and non-manufacturing PMI both decreased to 51.7 and 55.1 in June. Chicago purchasing managers’ index fell to 49.7 in June. Trade deficit widened to $55.5 billion in May. Factory orders contracted by 0.7% month-on-month in May. Also, durable goods orders fell by 1.3% month-on-month in May. DXY index increased by 0.4% this week. Our bond-to-gold indicator continues to point towards a weaker dollar. We believe that the combination of Chinese stimulus and the lagged effects from easing financial conditions should lift the global growth later this year, which would be a headwind for the dollar. Report Links: On Gold, Oil And Cryptocurrencies - June 28, 2019 Battle Of The Central Banks - June 21, 2019 EUR/USD And The Neutral Rate Of Interest - June 14, 2019 The Euro Chart II-3EUR Technicals 1
EUR Technicals 1
EUR Technicals 1
Chart II-4EUR Technicals 2
EUR Technicals 2
EUR Technicals 2
Recent data in the euro area have been mixed: Headline inflation was unchanged at 1.2% year-on-year in June, while core inflation increased to 1.1% year-on-year in June. Money supply (M3) grew by 4.8% year-on-year in May. Markit composite PMI increased to 52.2 in June. Manufacturing PMI fell to 47.6, while services PMI increased to 53.6. Unemployment rate fell to 7.5% in May. Producer price inflation fell to 1.6% year-on-year in May. Retail sales growth fell to 1.3% year-on-year in May. EUR/USD fell by 0.8% this week. IMF managing director Christine Lagarde was nominated to replace Mario Draghi as European Central Bank president this week. Analysts believe that she will likely maintain the ECB’s accommodative stance. This was confirmed by the plunge in 10-year bund yields to -40bps. Report Links: Battle Of The Central Banks - June 21, 2019 EUR/USD And The Neutral Rate Of Interest - June 14, 2019 Take Out Some Insurance - May 3, 2019 Japanese Yen Chart II-5JPY Technicals 1
JPY Technicals 1
JPY Technicals 1
Chart II-6JPY Technicals 2
JPY Technicals 2
JPY Technicals 2
Recent data in Japan have been mixed: The Tankan survey for Q2 was a mixed bag. The index for large manufacturers fell from 12 to 7. That for non-manufacturers increased from 21 to 23. Importantly, capex intentions rose from 1.2% to 7.4%. Housing starts contracted by 8.7% year-on-year in May. Construction orders continue to fall by 16.9% year-on-year in May. Nikkei composite PMI increased to 50.8 in June. Manufacturing PMI fell to 49.3, while services PMI increased to 51.9. Consumer confidence fell to 38.7 in June. USD/JPY has been flat this week. While Trump and Xi agreed to delay the trade talks during the G20 summit last weekend, there is no real progress toward a final trade agreement that could alleviate the tariffs. We continue to recommend the yen as a safe-haven hedge. Report Links: Battle Of The Central Banks - June 21, 2019 Short USD/JPY: Heads I Win, Tails I Don’t Lose Too Much - May 31, 2019 Beware Of Diminishing Marginal Returns - April 19, 2019 British Pound Chart II-7GBP Technicals 1
GBP Technicals 1
GBP Technicals 1
Chart II-8GBP Technicals 2
GBP Technicals 2
GBP Technicals 2
Recent data in the U.K. have been negative: GDP growth was unchanged at 1.8% year-on-year in Q1. Current account deficit widened to £30 billion in Q1. Markit composite PMI fell to 49.7 in June. Manufacturing PMI decreased to 48; Construction PMI fell to 43.1; Services PMI fell to 50.2. Mortgage approvals fell to 65.4 thousand in May, while the Nationwide house price index was up 0.5% year-on-year. GBP/USD fell by 1% this week. BoE governor Carney warned in a speech this week that “a global trade war and a no deal Brexit remain growing possibilities not certainties.” Moreover, he stated that monetary policy must address the consequences of such uncertainty for the behavior of business, household, and financial markets. The probability of a BoE rate cut by the end of this year has thus increased from 21% to 46% following his speech. Report Links: Battle Of The Central Banks - June 21, 2019 A Contrarian View On The Australian Dollar - May 24, 2019 Take Out Some Insurance - May 3, 2019 Australian Dollar Chart II-9AUD Technicals 1
AUD Technicals 1
AUD Technicals 1
Chart II-10AUD Technicals 2
AUD Technicals 2
AUD Technicals 2
Recent data in Australia have been mostly positive: The Markit manufacturing PMI increased from 51.7 to 52.0 Terms of trade remain in a powerful uptrend. HIA new home sales increased by 28.8% month-on-month in May. This is beginning to put a floor under building approvals. Trade surplus increased to A$5.8 billion in May, the highest on record. Retail sales increased by 0.1% month-on-month in May. AUD/USD increased by 0.3% this week. Following the rate cut last month, the RBA again cut interest rates by another 25 basis points to a historical low of 1% this week. During the policy statement, Governor Philip Lowe stated that this should support employment growth and provide greater confidence to achieve the inflation target. We continue to favor the Australian dollar from a contrarian perspective. Report Links: A Contrarian View On The Australian Dollar - May 24, 2019 Beware Of Diminishing Marginal Returns- April 19, 2019 Not Out Of The Woods Yet - April 5, 2019 New Zealand Dollar Chart II-11NZD Technicals 1
NZD Technicals 1
NZD Technicals 1
Chart II-12NZD Technicals 2
NZD Technicals 2
NZD Technicals 2
Recent data in New Zealand have been positive: Consumer confidence increased by 2.8% month-on-month in June. Building permits increased by 13.2% month-on-month in May. NZD/USD fell by 0.3% this week. With its policy rate 50 basis points higher than its antipodean counterpart, the RBNZ is now under pressure to cut rates in the coming weeks. The market is currently pricing an 84% probability of a rate cut for the next policy meeting in August, and 94% chance rates will be cut before year-end. Should data disappoint in the interim, additional cuts could be priced in. Hold on to our long AUD/NZD and SEK/NZD positions. Report Links: Where To Next For The U.S. Dollar? - June 7, 2019 Not Out Of The Woods Yet - April 5, 2019 Balance Of Payments Across The G10 - February 15, 2019 Canadian Dollar Chart II-13CAD Technicals 1
CAD Technicals 1
CAD Technicals 1
Chart II-14CAD Technicals 2
CAD Technicals 2
CAD Technicals 2
Recent data in Canada have been positive: GDP growth increased to 1.5% year-on-year in Q1. Bloomberg Nanos confidence continues to rise to 58.3 last week. This tends to lead GDP growth by a quarter or two. Markit manufacturing PMI increased to 49.2 in June. Exports and imports both increased to C$53.1 billion and C$52.3 billion in May. The trade balance turned positive to C$0.8 billion on surging exports to the U.S. USD/CAD fell by 0.5% this week. The BoC Business Outlook Survey published last Friday highlighted that business sentiment has slightly improved, and that hiring intentions continue to be healthy. This should underpin the loonie in the near-term. Report Links: On Gold, Oil And Cryptocurrencies - June 28, 2019 Currency Complacency Amid A Global Dovish Shift - April 26, 2019 A Shifting Landscape For Petrocurrencies - March 22, 2019 Swiss Franc Chart II-15CHF Technicals 1
CHF Technicals 1
CHF Technicals 1
Chart II-16CHF Technicals 2
CHF Technicals 2
CHF Technicals 2
Recent data in Switzerland have been negative: KOF leading indicator fell to 93.6 in June. Real retail sales contracted by 1.7% year-on-year in May. Manufacturing PMI fell to 47.7 in June. Headline inflation was unchanged at 0.6% year-on-year in June, while core inflation increased to 0.7% year-on-year in June. USD/CHF increased by 0.4% this week. The CHF/NZD cross has been correcting in recent weeks, and could eventually trigger our limit buy order at 1.45. Stay tuned. Report Links: What To Do About The Swiss Franc? - May 17, 2019 Beware Of Diminishing Marginal Returns - April 19, 2019 Balance Of Payments Across The G10 - February 15, 2019 Norwegian Krone Chart II-17NOK Technicals 1
NOK Technicals 1
NOK Technicals 1
Chart II-18NOK Technicals 2
NOK Technicals 2
NOK Technicals 2
Recent data in Norway have been mixed: Manufacturing PMI fell from 54.1 to 51.9 in June. Registered unemployment was unchanged at 2.1% in June. House prices are inflecting higher, to the tune of 2.6% year-on-year in June. USD/NOK fell by 0.5% this week. This week’s OPEC meeting extended the production cuts into 1Q20. Easing global financial conditions and Chinese stimulus should help revive oil demand. Our Commodity & Energy Strategy team continues to expect Brent to average $75/bbl by the end of this year. Stay long NOK/SEK and short CAD/NOK. Report Links: On Gold, Oil And Cryptocurrencies - June 28, 2019 Currency Complacency Amid A Global Dovish Shift - April 26, 2019 A Shifting Landscape For Petrocurrencies - March 22, 2019 Swedish Krona Chart II-19SEK Technicals 1
SEK Technicals 1
SEK Technicals 1
Chart II-20SEK Technicals 2
SEK Technicals 2
SEK Technicals 2
Recent data in Sweden have been negative: Retail sales fell by 0.5% year-on-year in May. Composite PMI fell to 50.5 in June. Manufacturing and services PMI both fell to 52 and 49.9. USD/SEK increased by 0.4% this week. The Riksbank held its interest rate unchanged at -0.25% this week as widely expected. However, the tone in the communique was hawkish. That said, the trade disputes between U.S. and China, and the Brexit chaos remain downside risks to the European economy, and the Riksbank might push the planned rate hike further down the road. Report Links: Where To Next For The U.S. Dollar? - June 7, 2019 Balance Of Payments Across The G10 - February 15, 2019 A Simple Attractiveness Ranking For Currencies - February 8, 2019 Trades & Forecasts Forecast Summary Core Portfolio Tactical Trades Limit Orders Closed Trades
Highlights So What? U.S.-Iran risk is front-loaded, but U.S.-China is the greater risk overall. In the medium-to-long run the trade war with China should reaccelerate while the U.S. should back away from war with Iran. But for now the opposite is happening. A full-fledged cold war with China will put a cap on American political polarization, putting China at a disadvantage. By contrast, a U.S. war with Iran would exacerbate polarization, giving China a huge strategic opportunity. War with Iran or trade war escalation with China are both ultimately dollar bullish – even though tactically the dollar may fall. Feature Two significant geopolitical events occurred over the past week. First, U.S. President Donald Trump declared his third pause to the trade war with China. The terms of the truce are vague and indefinite, but it has given support to the equity rally temporarily. Second, Iran edged past the limits on uranium stockpiling, uranium enrichment, and the Arak nuclear reactor imposed by the 2015 nuclear pact. Trump instigated this move by walking away from the pact and re-imposing oil sanctions. If these events foreshadow things to come, global financial markets should position for lower odds of a deflationary trade shock and higher odds of an inflationary oil shock in the coming six-to-18 months. But is this conclusion warranted? Is the American “Pivot to Asia” about to shift into reverse? If the White House pursued a consistent strategy to contain China, it would bring Americans together and require forming alliances. In the short run, perhaps – but the conflict with China is ultimately the greater of the two geopolitical risks. We expect it to intensify again, likely in H2, but at latest by Q3 of 2020, ahead of the U.S. presidential election. Our highest conviction call on this matter, however, is that any trade deal before that date will be limited in scope. It will fall far short of a “Grand Compromise” that ushers in a new era of U.S.-China engagement – and hence it will be a disappointment to global equities. Our trade war probabilities, updated on June 14 to account for the expected resumption of negotiations at the G20, can be found in Diagram 1. The combined risk of further escalation is 68%. Diagram 1Trade War Decision Tree (Updated June 13, 2019 To Include G20 Tariff Pause)
The Polybius Solution
The Polybius Solution
The risk to the view? The U.S.-Iran conflict could spiral out of control and the Trump administration could get entangled in the Middle East. This would create a very different outlook for global politics, economy, and markets over the next decade than a concentrated conflict with China. The Missing Corollary Of The “Thucydides Trap” The idea of the “Thucydides Trap” has gone viral in recent years – for good reason. The term, coined by Harvard political scientist Graham Allison, refers to the ancient Greek historian Thucydides (460-400 BC), author of the seminal History of the Peloponnesian War. The “trap” is the armed conflict that most often develops when a dominant nation that presides over a particular world order (e.g. Sparta, the U.S.) faces a young and ambitious rival that seeks fundamental change to that order (e.g. Athens, China).1 This conflict between an “established” and “revisionist” power was highlighted by the political philosopher Thomas Hobbes in his translation of Thucydides in the seventeenth century; every student of international relations knows it. Allison’s contribution is the comparative analysis of various Thucydides-esque episodes in the modern era to show how today’s U.S.-China rivalry fits the pattern. The implication is that war (not merely trade war) is a major risk. We have long held a similar assessment of the U.S.-China conflict. It is substantiated by hard data showing that China is gaining on America in various dimensions of power (Chart 1). Assuming that the U.S. does not want to be replaced, the current trade conflict will metastasize to other areas. There is an important but overlooked corollary to the Thucydides Trap: if the U.S. and China really engage in an epic conflict, American political polarization should fall. Polarization fell dramatically during the Great Depression and World War II and remained subdued throughout the Cold War. It only began to rise again when the Soviet threat faded and income inequality spiked circa 1980. Americans were less divided when they shared a common enemy that posed an existential threat; they grew more divided when their triumph proved to benefit some disproportionately to others (Chart 2). Chart 1China Is Gaining On The U.S.
China Is Gaining On The U.S.
China Is Gaining On The U.S.
Chart 2U.S. Polarization Falls During Crisis
U.S. Polarization Falls During Crisis
U.S. Polarization Falls During Crisis
If the U.S. and China continue down the path of confrontation, a similar pattern is likely to emerge in the coming years – polarization is likely to decline. China possesses the raw ability to rival or even supplant the United States as the premier superpower over the very long run. Its mixed economy is more sustainable than the Soviet command economy was, and it is highly integrated into the global system, unlike the isolated Soviet bloc. As long as China’s domestic demand holds up and Beijing does not suppress its own country’s technological and military ambitions, Trump and the next president will face a persistent need to respond with measures to limit or restrict China’s capabilities. Eventually this will involve mobilizing public opinion more actively. Further, if the U.S.-China conflict escalates, it will clarify U.S. relations with the rest of the world. For instance, Trump’s handling of trade suggests that he could refrain from trade wars with American allies to concentrate attention on China, particularly sanctions on its technology companies. Meanwhile a future Democratic president would preserve some of these technological tactics while reinstituting the multilateral approach of the Barack Obama administration, which launched the “Pivot to Asia,” the Trans-Pacific Partnership, and intensive freedom of navigation operations in the South China Sea. These are all aspects of a containment strategy that would reinforce China’s rejection of the western order. Bottom Line: If the White House, any White House, were to pursue a consistent strategy to contain China, the result would be a major escalation of the trade conflict that would bring Americans together in the face of a common enemy. It would also encourage the U.S. to form alliances in pursuit of this objective. So far these things have not occurred, but they are logical corollaries of the Thucydides Trap and they will occur if the Thucydides thesis is validated. How Would China Fare In The Thucydides Trap? China would be in trouble in this scenario. The United States, if the public unifies, would have a greater geopolitical impact than it currently does in its divided state. And a western alliance would command still greater coercive power than the United States acting alone (Chart 3). External pressure would also exacerbate China’s internal imbalances – excessive leverage, pollution, inefficient state involvement in the economy, poor quality of life, and poor governance (Chart 4). China has managed to stave off these problems so far because it has operated under relative American and western toleration of its violations of global norms (e.g. a closed financial system, state backing of national champions, arbitrary law, censorship). This would change under concerted American, European, and Japanese efforts. Chart 3China Fears A Western 'Grand Alliance'
China Fears A Western 'Grand Alliance'
China Fears A Western 'Grand Alliance'
Chart 4China's Domestic Risks Underrated
China's Domestic Risks Underrated
China's Domestic Risks Underrated
How would the Communist Party respond? First, it could launch long-delayed and badly needed structural reforms and parlay these as concessions to the West. The ramifications would be negative for Chinese growth on a cyclical basis but positive on a structural basis since the reforms would lift productivity over the long run – a dynamic that our Emerging Markets Strategy has illustrated, in a macroeconomic context, in Diagram 2. This is already an option in the current trade war, but China has not yet clearly chosen it – likely because of the danger that the U.S. would exploit the slowdown. Diagram 2Foreign Pressure And Structural Reform = Short-Term Pain For Long-Term Gain
The Polybius Solution
The Polybius Solution
Alternatively the Communist Party could double down on confrontation with the West, as Russia has done. This would strengthen the party’s grip but would be negative for growth on both a cyclical and structural basis. The effectiveness of China’s fiscal-and-credit stimulus would likely decline because of a drop in private sector activity and sentiment – already a nascent tendency – while the lack of “reform and opening up” would reduce long-term growth potential. This option makes structural reforms look more palatable – but again, China has not yet been forced to make this choice. None of the above is to say that the West is destined to win a cold war with China, but rather that the burden of revolutionizing the global order necessarily falls on the country attempting to revolutionize it. Bottom Line: If the Thucydides Trap fully takes effect, western pressure on China’s economy will force China into a destabilizing economic transition. China could lie low and avoid conflict in order to undertake reforms, or it could amplify its aggressive foreign policy. This is where the risk of armed conflict rises. Introducing … The Polybius Solution The problem with the above is that there is no sign of polarization abating anytime soon in the United States. Extreme partisanship makes this plain (Chart 5). Rising polarization could prevent the U.S. from responding coherently to China. The Thucydides Trap could be avoided, or delayed, simply because the U.S. is distracted elsewhere. The most likely candidate is Iran.
Chart 5
A lesser known Greek historian – who was arguably more influential than Thucydides – helps to illustrate this alternative vision for the future. This is Polybius (208-125 BC), a Greek who wrote under Roman rule. He described the rise of the Roman Empire as a result of Rome’s superior constitutional system. Polybius explains domestic polarization whereas Thucydides explains international conflict. Polybius took the traditional view that there were three primary virtues or powers governing human society: the One (the king), the Few (the nobles), and the Many (the commons). These powers normally ran the country one at a time: a dictator would die; a group of elites would take over; this oligarchy would devolve into democracy or mob-rule; and from the chaos would spring a new dictator. His singular insight – his “solution” to political decay – was that if a mixture or balance of the three powers could be maintained, as in the Roman republic, then the natural cycle of growth and decay could be short-circuited, enabling a regime to live much longer than its peers (Diagram 3). Diagram 3Polybius: A Balanced Political System Breaks The Natural Cycle Of Tyranny And Chaos
The Polybius Solution
The Polybius Solution
In short, just as post-WWII economic institutions have enabled countries to reduce the frequency and intensity of recessions (Chart 6), so Polybius believed that political institutions could reduce the frequency and intensity of revolutions. Eventually all governments would decay and collapse, but a domestic system of checks and balances could delay the inevitable. Needless to say, Polybius was hugely influential on English and French constitutional thinkers and the founders of the American republic. Chart 6Orthodox Economic Policy Has Made Recessions Less Frequent And Less Acute
Orthodox Economic Policy Has Made Recessions Less Frequent And Less Acute
Orthodox Economic Policy Has Made Recessions Less Frequent And Less Acute
What is the cause of constitutional decay, according to Polybius? Wealth, inequality, and corruption, which always follow from stable and prosperous times. “Avarice and unscrupulous money-making” drive the masses to encroach upon the elite and demand a greater share of the wealth. The result is a vicious cycle of conflict between the commons and the nobles until either the constitutional system is restored or a democratic revolution occurs. Compared to Thucydides, Polybius had less to say about the international balance of power. Domestic balance was his “solution” to unpredictable outside events. However, states with decaying political systems were off-balance and more likely to be conquered, or to overreach in trying to conquer others. Bottom Line: The “Polybius solution” equates with domestic political balance. Balanced states do not allow the nation’s leader, the elite, or the general population to become excessively powerful. But even the most balanced states will eventually decline. As they accumulate wealth, inequality and corruption emerge and cause conflict among the three powers. Why Polybius Matters Today It does not take a stretch of the imagination to apply the Polybius model to the United States today. Just as Rome grew fat with its winnings from the Punic Wars and decayed from a virtuous republic into a luxurious empire, as Polybius foresaw, so the United States lurched from victory over the Soviet Union to internal division and unforced errors. For instance, the budget surplus of 2% of GDP in the year 2000 became a budget deficit of 9% of GDP after a decade of gratuitous wars, profligate social spending and tax cuts, and financial excesses. It is on track to balloon again when the next recession hits – and this is true even without any historic crisis event to justify it. The rise in polarization has coincided with a rise in wealth inequality, much as Polybius would expect (Chart 7). In all likelihood the Trump tax cuts will exacerbate both of these trends (Chart 8). Even worse, any attempts by “the people” to take more wealth from the “nobles” will worsen polarization first, long before any improvements in equality translate to a drop in polarization. Chart 7Polarization Unlikely To Drop While Inequality Rises
Polarization Unlikely To Drop While Inequality Rises
Polarization Unlikely To Drop While Inequality Rises
Chart 8Trump Tax Cuts Fuel Inequality
Trump Tax Cuts Fuel Inequality
Trump Tax Cuts Fuel Inequality
Most importantly, from a global point of view, U.S. polarization is contaminating foreign policy. Just as the George W. Bush administration launched a preemptive war in Iraq, destabilizing the region, so the Obama administration precipitously withdrew from Iraq, destabilizing the region. And just as the Obama administration initiated a hurried détente with Iran in order to leave Iraq, the Trump administration precipitously withdrew from this détente, provoking a new conflict with Iran and potentially destabilizing Iraq. Major foreign policy initiatives have been conducted, and revoked, on a partisan basis under three administrations. And a Democratic victory in 2020 would result in a reversal of Trump’s initiatives. In the meantime Trump’s policy could easily entangle him in armed conflict with Iran – as nearly occurred on June 21. Iranian domestic politics make it very difficult, if not impossible, to go back to the 2015 setting. Despite Trump’s recent backpedaling, his administration runs a high risk of getting sucked into another Middle Eastern quagmire as long as it enforces the sanctions on Iranian oil stringently. Persian Gulf risks are coming to the fore. But over the next six-to-18 months, U.S.-China conflict will be the dominant market-mover. China would be the big winner if such a war occurred, just as it was one of the greatest beneficiaries of the long American distraction in Afghanistan and Iraq. It would benefit from another 5-10 years of American losses of blood and treasure. It would be able to pursue regional interests with less Interference and could trade limited cooperation with the U.S. on Iran for larger concessions elsewhere. And a nuclear-armed Iran – which is a long-term concern for the U.S. – is not in China’s national interest anyway. Chart 9Will The Pivot To Asia Reverse?
Will The Pivot To Asia Reverse?
Will The Pivot To Asia Reverse?
Bottom Line: The U.S. is missing the “Polybius solution” of balanced government; polarization is on the rise. As a result, the grand strategy of “pivoting to Asia” could go into reverse (Chart 9). If that occurs, the conflict with China will be postponed or ineffective. Iran Is The Wild Card A war with Iran manifestly runs afoul of the Trump administration’s and America’s national interests, whereas a trade war with China does not. First, although an Iranian or Iranian-backed attack on American troops would give Trump initial support in conducting air strikes, the consequences of war would likely be an oil price shock that would sink his approval rating over time and reduce his chances of reelection (Chart 10). We have shown that such a shock could come from sabotage in Iraq as well as from attacks on shipping in the Strait of Hormuz. Iran could be driven to attack if it believes the U.S. is about to attack. Second, not only would Democrats oppose a war with Iran, but Americans in general are war-weary, especially with regard to the Middle East (Chart 11). President Trump capitalized on this sentiment during his election campaign, especially in relation to Secretary Hillary Clinton who supported the war in Iraq. Over the past two weeks, he has downplayed the Iranian-backed tanker attacks, emphasized that he does not want war, and has ruled out “boots on the ground.” Chart 10Carter Gained Then Lost From Iran Oil Shock
Carter Gained Then Lost From Iran Oil Shock
Carter Gained Then Lost From Iran Oil Shock
Chart 11
Third, it follows from the above that, in the event of war, the United States would lack the political will necessary to achieve its core strategic objectives, such as eliminating Iran’s nuclear program or its power projection capabilities. And these are nearly impossible to accomplish from the air alone. And U.S. strategic planners are well aware that conflict with Iran will exact an opportunity cost by helping Russia and China consolidate spheres of influence. The wild card is Iran. President Hassan Rouhani has an incentive to look tough and push the limits, given that he was betrayed on the 2015 deal. And the regime itself is probably confident that it can survive American air strikes. American military strikes are still a serious constraint, but until the U.S. demonstrates that it is willing to go that far, Iran can test the boundaries. In doing so it also sends a message to its regional rivals – Saudi Arabia, the Gulf Arab monarchies, and Israel – that the U.S. is all bark, no bite, and thus unable to protect them from Iran. This may lead to a miscalculation that forces Trump to respond despite his inclinations. The China trade war, by contrast, is less difficult for the Trump administration to pursue. There is not a clear path from tariffs to economic recession, as with an oil shock: the U.S. economy has repeatedly shrugged off counter-tariffs and the Fed has been cowed. While Americans generally oppose the trade war, Trump’s base does not, and the health of the overall economy is far more important for most voters. And a majority of voters do believe that China’s trade practices are unfair. Strategic planners also favor confronting China – unlike Trump they are not concerned with reelection, but they recognize that China’s advantages grow over time, including in critical technologies. Bottom Line: While short-term events are pushing toward truce with China and war with Iran, the Trump administration is likely to downgrade the conflict with Iran and upgrade the conflict with China over the next six-to-18 months. Neither politics nor grand strategy support a war with Iran, whereas politics might support a trade war with China and grand strategy almost certainly does. China Could Learn From Polybius Too China also lacks the Polybius solution. It suffers from severe inequality and social immobility, just like the Latin American states and the U.S., U.K., and Italy (Chart 12). But unlike the developed markets, it lacks a robust constitutional system. Political risks are understated given the emergence of the middle class, systemic economic weaknesses, and poor governance. Over the long run, Xi Jinping will need to step down, but having removed the formal system for power transition, a succession crisis is likely.
Chart 12
China’s imbalances could cause domestic instability even if the U.S. becomes distracted by conflict in the Middle East. But China has unique tools for alleviating crises and smoothing out its economic slowdown, so the absence of outside pressure will probably determine its ability to avoid a painful economic slump. This helps to explain China’s interest in dealing with the U.S. on North Korea. President Xi Jinping’s first trip to Pyongyang late last month helped pave the way for President Trump to resume negotiations with the North’s leader Kim Jong Un at the first-ever visit of an American president north of the demilitarized zone (DMZ). China does not want an unbridled nuclear North Korea or an American preventative war on the peninsula. If Beijing could do a short-term deal with the U.S. on the basis of assistance in reining in North Korea’s nuclear and missile programs, it could divert U.S. animus away from itself and encourage the U.S. to turn its attention toward the next rogue nuclear aspirant, Iran. It would also avoid structural economic concessions. Of course, a smooth transition today means short-term gain but long-term pain for Chinese and global growth. Productivity and potential GDP will decline if China does not reform (Diagram 4). But this kind of transition is the regime’s preferred option since Beijing seeks to minimize immediate threats and maintain overall stability. Diagram 4Stimulus And Delayed Reforms = Socialist Put = Stagflation
The Polybius Solution
The Polybius Solution
If Chinese internal divisions do flare up, China’s leaders will take a more aggressive posture toward its neighbors and the United States in order to divert public attention and stir up patriotic support. Bottom Line: China suffers from understated internal political risk. While U.S. political divisions could lead to a lack of coherent strategy toward China, a rift in China could lead to Chinese aggression in its neighborhood, accelerating the Thucydides Trap. Investment Conclusions Chart 13An Iran War Will Bust The Budget
An Iran War Will Bust The Budget
An Iran War Will Bust The Budget
If the U.S. reverses the pivot to Asia, attacks Iran, antagonizes European allies, and exhausts its resources in policy vacillation, its budget deficit will balloon (Chart 13), oil prices will rise, and China will be left to manage its economic transition without a western coalition against it. The implication is a weakening dollar, at least initially. But the U.S. is nearing the end of its longest-ever business expansion and an oil price spike would bring forward the next recession, both of which will push up the greenback. Much will depend on the extent of any oil shock – whether and how long the Strait of Hormuz is blocked. Beyond the next recession, the dollar could suffer severe consequences for the U.S.’s wild policies. If the U.S. continues the pivot to Asia, and the U.S. and China proceed with tariffs, tech sanctions, saber-rattling, diplomatic crises, and possibly even military skirmishes, China will be forced into an abrupt and destabilizing economic transition. The U.S. dollar will strengthen as global growth decelerates. Developed market equities will outperform emerging market equities, but equities as a whole will underperform sovereign bonds and other safe-haven assets. Over the past week, developments point toward the former scenario, meaning that Persian Gulf risks are coming to the fore. But over the next six-to-18 months, we think the latter scenario will prevail. We are maintaining our risk-off trades: long JPY/USD, long gold, long Swiss bonds, and long USD/CNY. Matt Gertken, Vice President Geopolitical Strategist mattg@bcaresearch.com Footnotes 1 See Graham Allison, “The Thucydides Trap: Are The U.S. And China Headed For War?” The Atlantic, September 24, 2015, and Destined For War: Can America and China Escape Thucydides’s Trap? (New York: Houghton Mifflin Harcourt, 2017).
For the remainder of the year, Our Global Investment Strategy team's baseline envisions a “muddle through” scenario for the Sino-U.S. trade negotiations, where some sort of deal is hatched that allows the U.S. to bring down existing tariffs over time in…
The latest data suggest that Iran’s exports have fallen to 300,000 barrels per day, a roughly 90% drop from 2018, when Trump walked away from the Iran deal. If this remains the case in the wake of the brinkmanship last week then it is clear that Iran is…
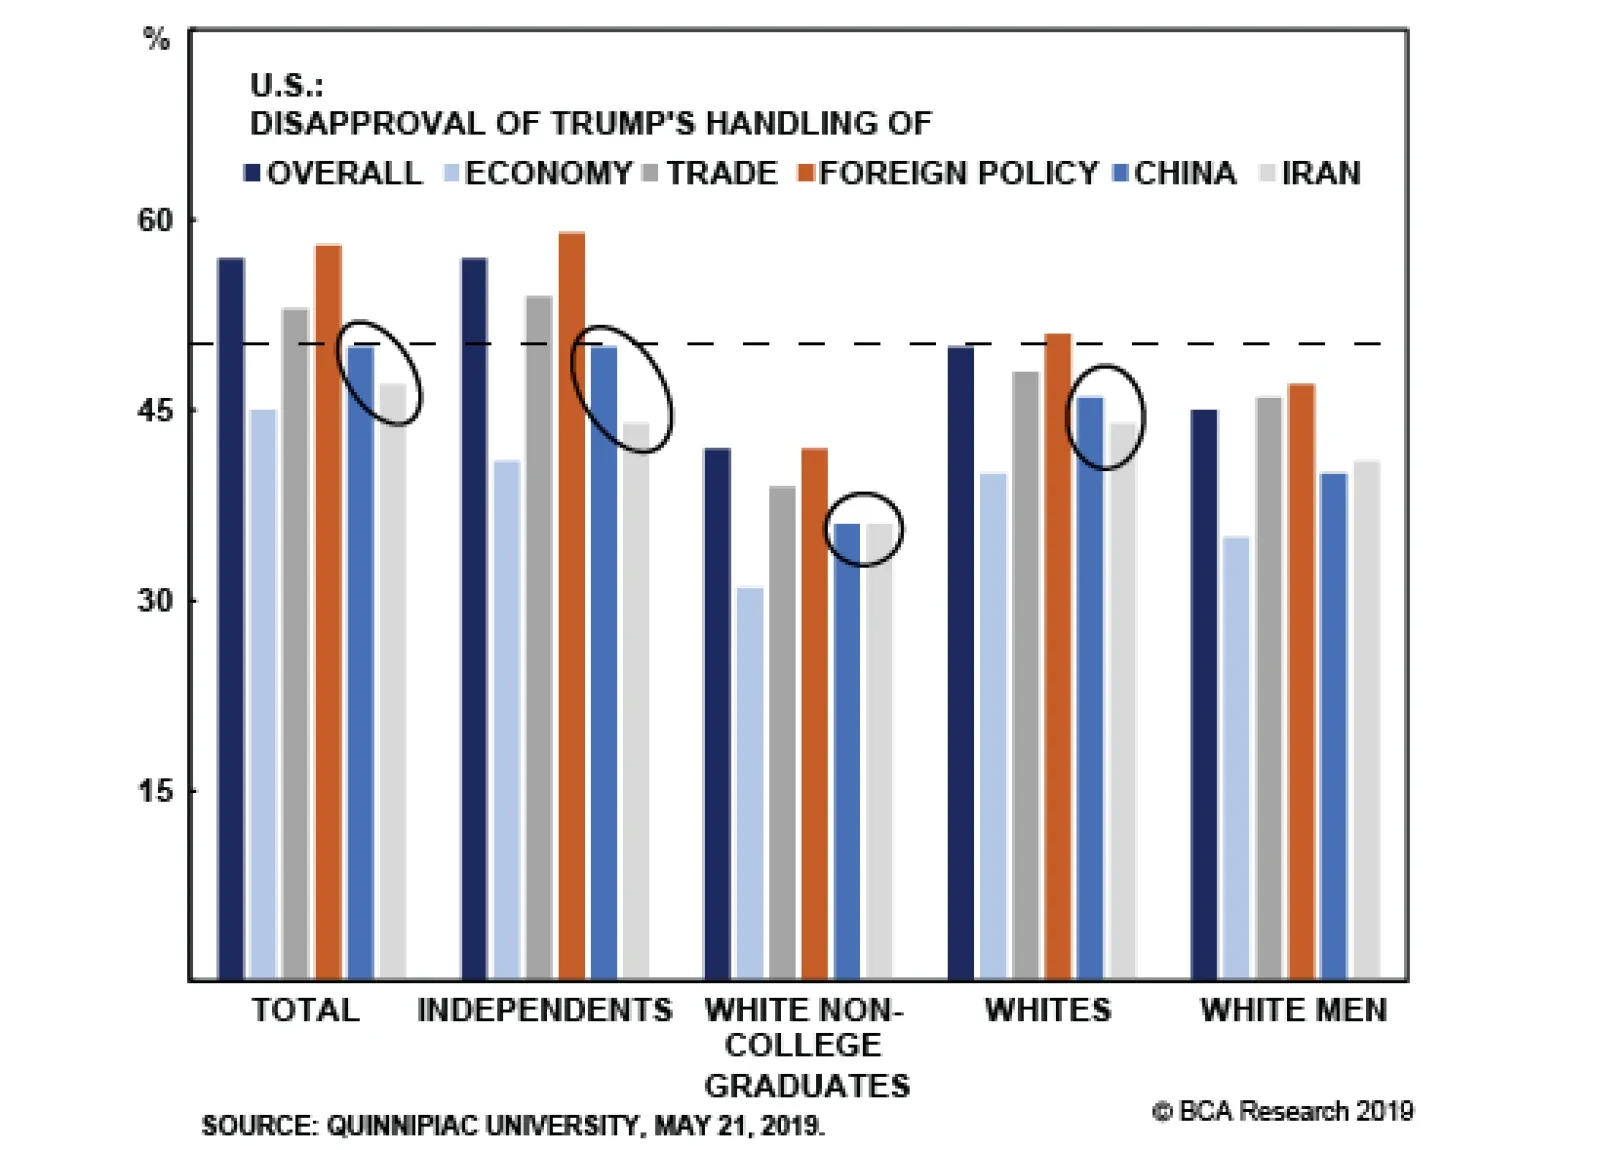
Despite the lack of a benefit to his polling, he does still have leeway to pursue his aggressive policies to a point. A breakdown of these opinions according to key voting blocs – a proxy for Trump’s ability to generate support in Midwestern swing states –…
Highlights So What? Economic stimulus will encourage key nations to pursue their self-interest – keeping geopolitical risk high. Why? The U.S. is still experiencing extraordinary strategic tensions with China and Iran … simultaneously. The Trump-Xi summit at the G20 is unlikely to change the fact that the United States is threatening China with total tariffs and a technology embargo. The U.S. conflict with Iran will be hard to keep under wraps. Expect more fireworks and oil volatility, with a large risk of hostilities as long as the U.S. maintains stringent oil sanctions. All of our GeoRisk indicators are falling except for those of Germany, Turkey and Brazil. This suggests the market is too complacent. Maintain tactical safe-haven positioning. Feature “That’s some catch, that Catch-22,” he observed. “It’s the best there is,” Doc Daneeka agreed. -Joseph Heller, Catch-22 (1961) One would have to be crazy to go to war. Yet a nation has no interest in filling its military’s ranks with lunatics. This is the original “Catch-22,” a conundrum in which the only way to do what is individually rational (avoid war) is to insist on what is collectively irrational (abandon your country). Or the only way to defend your country is to sacrifice yourself. This is the paradox that U.S. President Donald Trump faces having doubled down on his aggressive foreign policy this year: if he backs away from trade war to remove an economic headwind that could hurt his reelection chances, he sacrifices the immense leverage he has built up on behalf of the United States in its strategic rivalry with China. “Surrender” would be a cogent criticism of him on the campaign trail: a weak deal will cast him as a pluto-populist, rather than a real populist – one who pandered to China to give a sop to Wall Street and the farm lobby just like previous presidents, yet left America vulnerable for the long run. Similarly, if President Trump stops enforcing sanctions against Iranian oil exports to reduce the threat of a conflict-induced oil price shock that disrupts his economy, then he reduces the United States’s ability to contain Iran’s nuclear and strategic advances in the wake of the 2015 nuclear deal that he canceled. The low appetite for American involvement in the region will be on full display for the world to see. Iran will have stared down the Great Satan – and won. In both cases, Trump can back down. Or he can try to change the subject. But with weak polling and yet a strong economy, the point is to direct voters’ attention to foreign policy. He could lose touch with his political base at the very moment that the Democrats reconnect with their own. This is not a good recipe for reelection. More important – for investors – why would he admit defeat just as the Federal Reserve is shifting to countenance the interest rate cuts that he insists are necessary to increase his economic ability to drive a hard bargain with China? Why would he throw in the towel as the stock market soars? And if Trump concludes a China deal, and the market rises higher, will he not be emboldened to put more economic pressure on Mexico over border security … or even on Europe over trade? The paradox facing investors is that the shift toward more accommodative monetary policy (and in some cases fiscal policy) extends the business cycle and encourages political leaders to pursue their interests more intently. China is less likely to cave to Trump’s demands as it stimulates. The EU does not need to fear a U.K. crash Brexit if its economy rebounds. This increases rather than decreases the odds of geopolitical risks materializing as negative catalysts for the market. Similarly, if geopolitical risk falls then the need for stimulus falls and the market will be disappointed. The result is still more volatility – at least in the near term. The G20 And 2020 As we go to press the Democratic Party’s primary election debates are underway. The progressive wave on display highlights the overarching takeaway of the debates: the U.S. election is now an active political (and geopolitical) risk to the equity market. A truly positive surprise at the G20 would be a joint statement by Trump and Xi plus some tariff rollback. Whenever Trump’s odds of losing rise, the U.S. domestic economy faces higher odds of extreme policy discontinuity and uncertainty come 2021, with the potential for a populist-progressive agenda – a negative for financials, energy, and probably health care and tech.
Chart 1
Yet whenever Trump’s odds of winning rise, the world faces higher odds of an unconstrained Trump second term focusing on foreign and trade policy – a potentially extreme increase in global policy uncertainty – without the fiscal and deregulatory positives of his first term. We still view Trump as the favored candidate in this race (at 55% chance of reelection), given that U.S. underlying domestic demand is holding up and the labor market has not been confirmed to be crumbling beneath the consumer’s feet. Still Chart 1 highlights that Trump’s shift to more aggressive foreign and trade policy this spring has not won him any additional support – his approval rating has been flat since then. And his polling is weak enough in general that we do not assign him as high of odds of reelection as would normally be afforded to a sitting president on the back of a resilient economy. This raises the question of whether the G20 will mark a turning point. Will Trump attempt to deescalate his foreign conflicts? Yes, and this is a tactical opportunity. But we see no final resolution at hand. With China, Trump’s only reason to sign a weak deal would be to stem a stock market collapse. With Iran, Trump is no longer in the driver’s seat but could be forced to react to Iranian provocations. Bottom Line: Trump’s polling has not improved – highlighting the election risk – but weak polling amid a growing economy and monetary easing is not a recipe for capitulating to foreign powers. The Trump-Xi Summit On China the consensus on the G20 has shifted toward expecting an extension of talks and another temporary tariff truce. If a new timetable is agreed, it may be a short-term boon for equities. But we will view it as unconvincing unless it is accompanied with a substantial softening on Huawei or a Trump-Xi joint statement outlining an agreement in principle along with some commitment of U.S. tariff rollback. Otherwise the structural dynamic is the same: Trump is coercing China with economic warfare amid a secular increase in U.S.-China animosity that is a headwind for trade and investment. Table 1 shows that throughout the modern history of U.S.-China presidential-level summits, the Great Recession marked a turning point: since then, bilateral relations have almost always deteriorated in the months after a summit, even if the optics around the summit were positive. Table 1U.S.-China Leaders Summits: A Chronology
The G20 Catch-22 ... GeoRisk Indicators Update: June 28, 2019
The G20 Catch-22 ... GeoRisk Indicators Update: June 28, 2019
The last summit in Buenos Aires was no exception, given that the positive aura was ultimately followed by a tariff hike and technology-company blacklistings. Of course, the market rallied for five months in between. Why should this time be the same? First, the structural factors undermining Sino-American trust are worse, not better, with Trump’s latest threats to tech companies. Second, Trump will ultimately resent any decision to extend the negotiations. China’s economy is rebounding, which in the coming months will deprive Trump of much of the leverage he had in H2 2018 and H1 2019. He will be in a weaker position if they convene in three months to try to finalize a deal. Tariff rollback will be more difficult in that context given that China will be in better shape and that tariffs serve as the guarantee that any structural concessions will be implemented. Bottom Line: Our broader view regarding the “end game” of the talks – on the 2020 election horizon – remains that China has no reason to implement structural changes speedily for the United States until Trump can prove his resilience through reelection. Yet President Trump will suffer on the campaign trail if he accepts a deal that lacks structural concessions. Hence we expect further escalation from where we are today, knowing full well that the G20 could produce a temporary period of improvement just as occurred on December 1, 2018. The Iran Showdown Is Far From Over Disapproval of Trump’s handling of China and Iran is lower than his disapproval rating on trade policy and foreign policy overall, suggesting that despite the lack of a benefit to his polling, he does still have leeway to pursue his aggressive policies to a point. A breakdown of these opinions according to key voting blocs – a proxy for Trump’s ability to generate support in Midwestern swing states – illustrates that his political base is approving on the whole (Chart 2).
Chart 2
Yet the conflict with Iran threatens Trump with a hard constraint – an oil price shock – that is fundamentally a threat to his reelection. Hence his decision, as we expected, to back away from the brink of war last week (he supposedly canceled air strikes on radar and missile installations at the last minute on June 21). He appears to be trying to control the damage that his policy has already done to the 2015 U.S.-Iran equilibrium. Trump has insisted he does not want war, has ruled out large deployments of boots on the ground, and has suggested twice this week that his only focus in trying to get Iran back into negotiations is nuclear weapons. This implies a watering down of negotiation demands to downplay Iran’s militant proxies in the region – it is a retreat from Secretary of State Mike Pompeo’s more sweeping 12 demands on Iran and a sign of Trump’s unwillingness to get embroiled in a regional conflict with a highly likely adverse economic blowback. The Iran confrontation is not over yet – policy-induced oil price volatility will continue. This retreat lacks substance if Trump does not at least secretly relax enforcement of the oil sanctions. Trump’s latest sanctions and reported cyberattacks are a sideshow in the context of an attempted oil embargo that could destabilize Iran’s entire economy (Charts 3 and 4). Similarly, Iran’s downing of a U.S. drone pales in comparison to the tanker attacks in Hormuz that threatened global oil shipments. What matters to investors is the oil: whether Iran is given breathing space or whether it is forced to escalate the conflict to try to win that breathing space.
Chart 3
Chart 4Iran’s Rial Depreciated Sharply
Iran's Rial Depreciated Sharply
Iran's Rial Depreciated Sharply
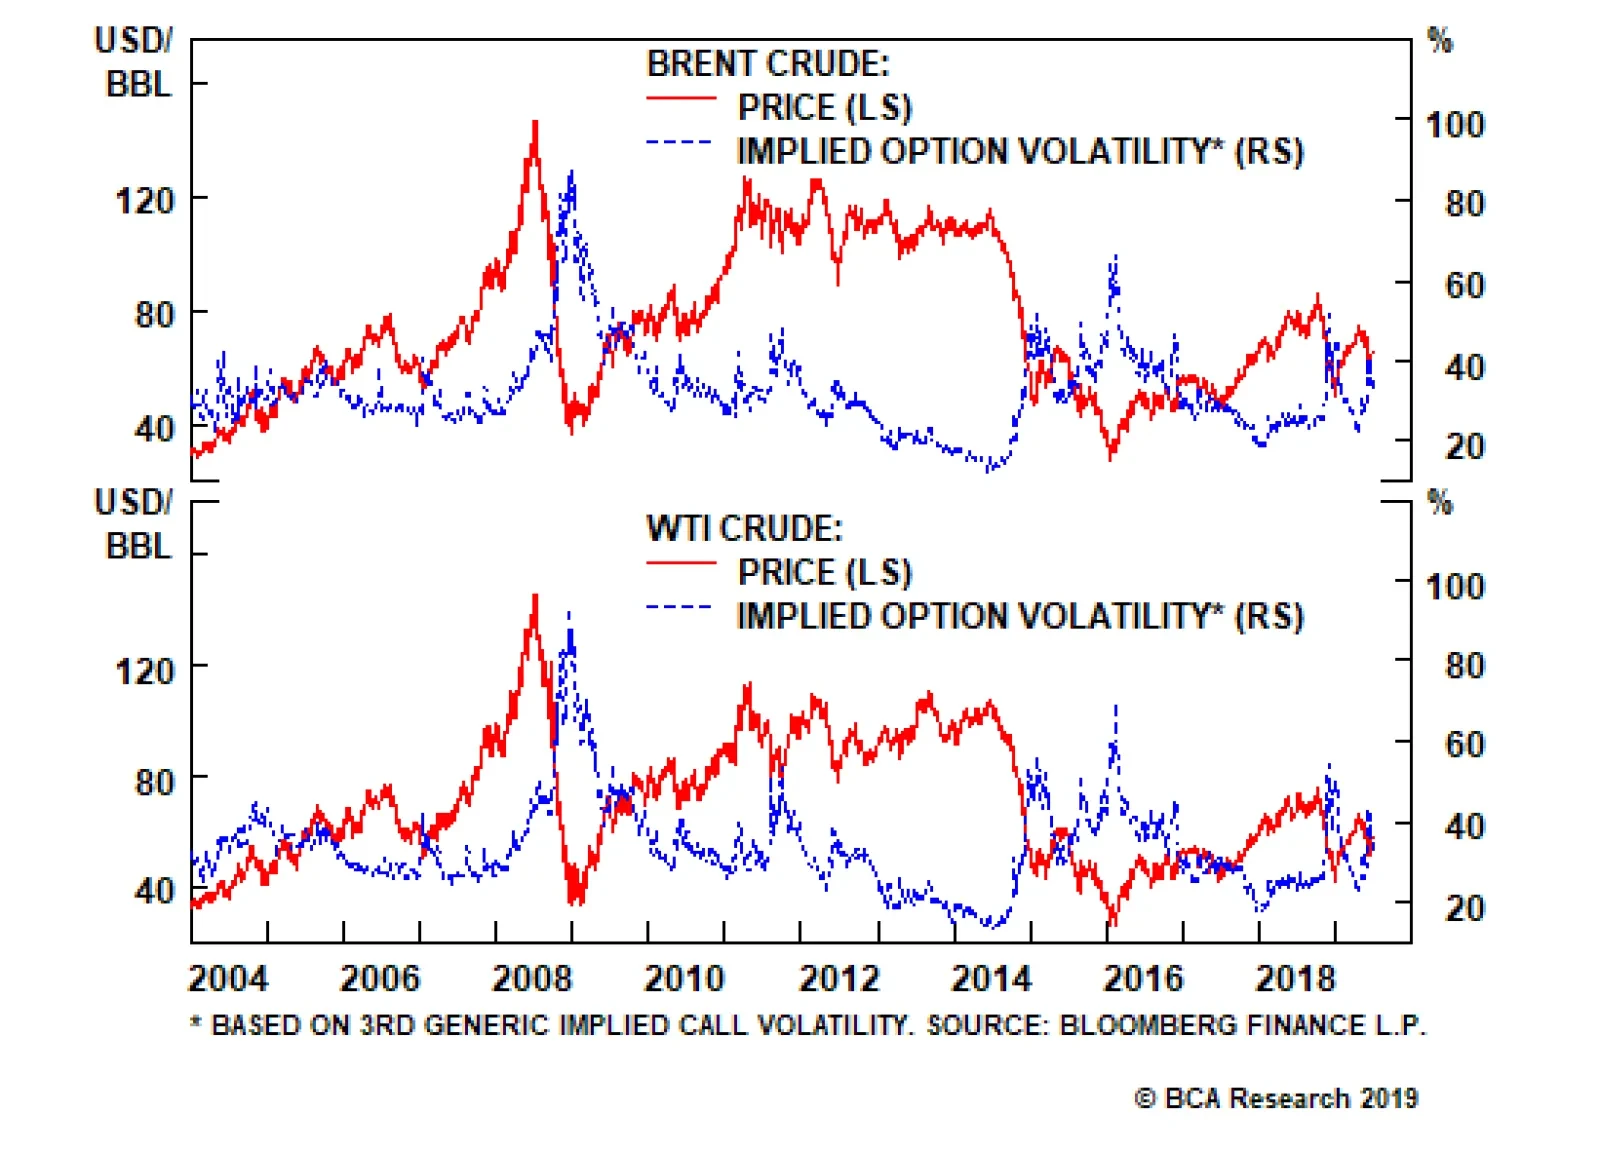
The latest data suggest that Iran’s exports have fallen to 300,000 barrels per day, a roughly 90% drop from 2018, when Trump walked away from the Iran deal. If this remains the case in the wake of the brinkmanship last week then it is clear that Iran is backed into a corner and could continue to snarl and snap at the U.S. and its regional allies, though it may pause after the tanker attacks. Chart 5More Oil Volatility To Come
More Oil Volatility To Come
More Oil Volatility To Come
Tehran also has an incentive to dial up its nuclear program and activate its regional militant proxies in order to build up leverage for any future negotiation. It can continue to refuse entering into negotiations with Trump in order to embarrass him – and it can wait until Trump’s approach is validated by reelection before changing this stance. After all, judging by the first Democratic primary debate, biding time is the best strategy – the Democratic candidates want to restore the 2015 deal and a new Democratic administration would have to plead with Iran, even to get terms less demanding than those in 2015. Other players can also trigger an escalation even if Presidents Trump and Rouhani decide to take a breather in their conflict (which they have not clearly decided to do). The Houthi rebels based in Yemen have launched another missile at Abha airport in Saudi Arabia since Trump’s near-attack on Iran, an action that is provocative, easily replicable, and not necessarily directly under Tehran’s control. Meanwhile OPEC is still dragging its feet on oil production to compensate for the Iranian losses, implying that the cartel will react to price rises rather than preempt them. The Saudis could use production or other means to stoke conflict. Bottom Line: Given our view on the trade war, which dampens global oil demand, we expect still more policy-induced volatility (Chart 5). We do not see oil as a one-way bet … at least not until China’s shift to greater stimulus becomes unmistakable. North Korea: The Hiccup Is Over Chart 6China Ostensibly Enforces North Korean Sanctions
China Ostensibly Enforces North Korean Sanctions
China Ostensibly Enforces North Korean Sanctions
The single clearest reason to expect progress between the U.S. and China at the G20 is the fact that North Korea is getting back onto the diplomatic track. North Korea has consistently been shown to be part of the Trump-Xi negotiations, unlike Taiwan, the South China Sea, Xinjiang, and other points of disagreement. General Secretary Xi Jinping took his first trip to the North on June 20 – the first for a Chinese leader since 2005 – and emphasized the need for historic change, denuclearization, and economic development. Xi is pushing Kim to open up and reform the economy in exchange for a lasting peace process – an approach that is consistent with China’s past policy but also potentially complementary with Trump’s offer of industrialization in exchange for denuclearization. President Trump and Kim Jong Un have exchanged “beautiful” letters this month and re-entered into backchannel discussions. Trump’s visit to South Korea after the G20 will enable him and President Moon Jae-In to coordinate for a possible third summit between Trump and Kim. Progress on North Korea fits our view that the failed summit in Hanoi was merely a setback and that the diplomatic track is robust. Trump’s display of a credible military threat along with Chinese sanctions enforcement (Chart 6) has set in motion a significant process on the peninsula that we largely expect to succeed and go farther than the consensus expects. It is a long-term positive for the Korean peninsula’s economy. It is also a positive factor in the U.S.-China engagement based on China’s interest in ultimately avoiding war and removing U.S. troops from the peninsula. From an investment point of view, an end to a brief hiatus in U.S.-North Korean diplomacy is a very poor substitute for concrete signs of U.S.-China progress on the tech front or opening market access. There has been nothing substantial on these key issues since Trump hiked the tariff rate in May. As a result, it is perfectly possible for the G20 to be a “success” on North Korea but, like the Buenos Aires summit on December 1, for markets to sell the news (Chart 7). Chart 7The Last Trade Truce Didn't Stop The Selloff
The Last Trade Truce Didn't Stop The Selloff
The Last Trade Truce Didn't Stop The Selloff
Chart 8China Needs A Final Deal To Solve This Problem
China Needs A Final Deal To Solve This Problem
China Needs A Final Deal To Solve This Problem
Bottom Line: North Korea is not a basis in itself for tariff rollback, but only as part of a much more extensive U.S.-China agreement. And a final agreement is needed to improve China’s key trade indicators on a lasting basis, such as new export orders and manufacturing employment, which are suffering amid the trade war. We expect economic policy uncertainty to remain elevated given our pessimistic view of U.S.-China trade relations (Chart 8). What About Japan, The G20 Host?
Chart 9
Japan faces underrated domestic political risk as Prime Minister Abe Shinzo approaches a critical period in his long premiership, after which he will almost certainly be rendered a “lame duck,” likely by the time of the 2020 Tokyo Olympics. The question is when will this process begin and what will the market impact be? If Abe loses his supermajority in the July House of Councillors election, then it could begin as early as next month. This is a real risk – because a two-thirds majority is always a tall order – but it is not extreme. Abe’s polling is historically remarkable (Chart 9). The Liberal Democratic Party and its coalition partner Komeito are also holding strong and remain miles away from competing parties (Chart 10). The economy is also holding up relatively well – real wages and incomes have improved under Abe’s watch (Chart 11). However, the recent global manufacturing slowdown and this year’s impending hike to the consumption tax in October from 8% to 10% are killing consumer confidence. Chart 10Japan's Ruling Coalition Is Strong
Japan's Ruling Coalition Is Strong
Japan's Ruling Coalition Is Strong
The collapse in consumer confidence is a contrary indicator to the political opinion polling. The mixed picture suggests that after the election Abe could still backtrack on the tax hike, although it would require driving through surprise legislation. He can pull this off in light of global trade tensions and his main objective of passing a popular referendum to revise the constitution and remilitarize the country. Chart 11Japanese Wages Up, But Consumer Confidence Diving
Japanese Wages Up, But Consumer Confidence Diving
Japanese Wages Up, But Consumer Confidence Diving
We would not be surprised if Japan secured a trade deal with the U.S. prior to China. Because Abe and the United States need to enhance their alliance, we continue to downplay the risk of a U.S.-Japan trade war. Bloomberg recently reported that President Trump was threatening to downgrade the U.S.-Japan alliance, with a particular grievance over the ever-controversial issue of the relocation of troops on Okinawa. We view this as a transparent Trumpian negotiating tactic that has no applicability – indeed, American military and diplomatic officials quickly rejected the report. We do see a non-trivial risk that Trump’s rhetoric or actions will hurt Japanese equities at some point this year, either as Trump approaches his desired August deadline for a Japan trade deal or if negotiations drag on until closer to his decision about Section 232 tariffs on auto imports on November 14. But our base case is that there will be either no punitive measures or only a short time span before Abe succeeds in negotiating them away. We would not be surprised if the Japanese secured a deal prior to any China deal as a way for the Trump administration to try to pressure China and prove that it can get deals done. This can be done because it could be a thinly modified bilateral renegotiation of the Trans-Pacific Partnership, which had the U.S. and Japan at its center. Bottom Line: Given the combination of the upper house election, the tax hike and its possible consequences, a looming constitutional referendum which poses risks to Abe, and the ongoing external threat of trade war and China tensions, we continue to see risk-off sentiment driving Japanese and global investors to hold then yen. We maintain our long JPY/USD recommendation. The risk to this view is that Bank of Japan chief Haruhiko Kuroda follows other central banks and makes a surprisingly dovish move, but this is not warranted at the moment and is not the base case of our Foreign Exchange Strategy. GeoRisk Indicators Update: June 28, 2019 Our GeoRisk indicators are sending a highly complacent message given the above views on China and Iran. All of our risk measures, other than our German, Turkish, and Brazilian indicators, are signaling a decrease geopolitical tensions. Investors should nonetheless remain cautious: Our German indicator, which has proven to be a good measure of U.S.-EU trade tensions, has increased over the first half of June (Chart 12). We expect Germany to continue to be subject to risk because of Trump’s desire to pivot to European trade negotiations in the wake of any China deal. The auto tariff decision was pushed off until November. We assign a 45% subjective probability to auto tariffs on the EU if Trump seals a final China deal. The reason it is not our base case is because of a lack of congressional, corporate, or public support for a trade war with Europe as opposed to China or Mexico, which touch on larger issues of national interest (security, immigration). There is perhaps a 10% probability that Trump could impose car tariffs prior to securing a China deal. Chart 12U.S.-EU Trade Tensions Hit Germany
U.S.-EU Trade Tensions Hit Germany
U.S.-EU Trade Tensions Hit Germany
Chart 13German Greens Overtaking Christian Democrats!
German Greens Overtaking Christian Democrats!
German Greens Overtaking Christian Democrats!
Germany is also an outlier because it is experiencing an increase in domestic political uncertainty. Social Democrat leader Andrea Nahles’ resignation on June 2 opened the door to a leadership contest among the SPD’s membership. This will begin next week and conclude on October 26, or possibly in December. The result will have consequences for the survivability of Merkel’s Grand Coalition – in case the SPD drops out of it entirely. Both Merkel and her party have been losing support in recent months – for the first time in history the Greens have gained the leading position in the polls (Chart 13). If the coalition falls apart and Merkel cannot put another one together with the Greens and Free Democrats, she may be forced to resign ahead of her scheduled 2021 exit date. The implication of the events with Trump and Merkel is that Germany faces higher political risk this year, particularly in Q4 if tariff threats and coalition strains coincide. Meanwhile, Brazilian pension reform has been delayed due to an inevitable breakdown in the ability to pass major legislation without providing adequate pork barrel spending. As for the rest of Europe, since European Central Bank President Mario Draghi’s dovish signal on June 18, all of our European risk indicators have dropped off. Markets rallied on the news of the ECB’s preparedness to launch another round of bond-buying monetary stimulus if needed, easing tensions in the region. Italian bond spreads plummeted, for instance. The Korean and Taiwanese GeoRisk indicators, our proxies for the U.S.-China trade war, are indicating a decrease in risk as the two sides moved to contain the spike in tensions in May. While Treasury Secretary Steve Mnuchin notes that the deal was 90% complete in May before the breakdown, there is little evidence yet that any of the sticking points have been removed over the past two weeks. These indicators can continue to improve on the back of any short-term trade truce at the G20. The Russian risk indicator has been hovering in the same range for the past two months. We expect this to break out on the back of increasing mutual threats between the U.S. and Russia. The U.S. has recently agreed to send an additional 1000 rotating troops to Poland, a move that Russia obviously deems aggressive. The Russian upper chamber has also unanimously supported President Putin’s decree to suspend the Intermediate Nuclear Forces treaty, in the wake of the U.S. decision to do so. This would open the door to developing and deploying 500-5500 km range land-based and ballistic missiles. According to the deputy foreign minister, any U.S. missile deployment in Europe will lead to a crisis on the level of the Cuban Missile Crisis. Russia has also sided with Iran in the latest U.S.-Iran tension escalation, denouncing U.S. plans to send an additional 1000 troops to the Middle East and claiming that the shot-down U.S. drone was indeed in Iranian airspace. We anticipate the Russian risk indicator to go up as we expect Russia to retaliate in some way to Poland and to take actions to encourage the U.S. to get entangled deeper into the Iranian imbroglio, which is ultimately a drain on the U.S. and a useful distraction that Russia can exploit. In Turkey, both domestic and foreign tensions are rising. First, the re-run of the Istanbul mayoral election delivered a big defeat for Turkey’s President Erdogan on his home turf. Opposition representative Ekrem Imamoglu defeated former Prime Minister Binali Yildirim for a second time this year on June 23 – increasing his margin of victory to 9.2% from 0.2% in March. This was a stinging rebuke to Erdogan and his entire political system. It also reinforces the fact that Erdogan’s Justice and Development Party (AKP) is not as popular as Erdogan himself, frequently falling short of the 50% line in the popular vote for elections not associated directly with Erdogan (Chart 14). This trend combined with his personal rebuke in the power base of Istanbul will leave him even more insecure and unpredictable.
Chart 14
Second, the G20 summit is the last occasion for Erdogan and Trump to meet personally before the July 31 deadline on Erdogan’s planned purchase of S-400 missile defenses from Russia. Erdogan has a chance to delay the purchase as he contemplates cabinet and policy changes in the wake of this major domestic defeat. Yet if Erdogan does not back down or delay, the U.S. will remove Turkey from the F-35 Joint Strike Fighter program, and may also impose sanctions over this purchase and possibly also Iranian trade. The result will hit the lira and add to Turkey’s economic woes. Geopolitically, it will create a wedge within NATO that Russia could exploit, creating more opportunities for market-negative surprises in this area. Finally, we expect our U.K. risk indicator to perk up, as the odds of a no-deal Brexit are rising. Boris Johnson will likely assume Conservative Party leadership and the party is moving closer to attempting a no-deal exit. We assign a 21% probability to this kind of Brexit, up from our previous estimate of 14%. It is more likely that Johnson will get a deal similar to Theresa May’s deal passed or that he will be forced to extend negotiations beyond October. Matt Gertken, Vice President Geopolitical Strategist mattg@bcaresearch.com Ekaterina Shtrevensky, Research Analyst ekaterinas@bcaresearch.com France: GeoRisk Indicator
France: GeoRisk Indicator
France: GeoRisk Indicator
U.K.: GeoRisk Indicator
U.K.: GeoRisk Indicator
U.K.: GeoRisk Indicator
Germany: GeoRisk Indicator
Germany: GeoRisk Indicator
Germany: GeoRisk Indicator
Italy: GeoRisk Indicator
Italy: GeoRisk Indicator
Italy: GeoRisk Indicator
Spain: GeoRisk Indicator
Spain: GeoRisk Indicator
Spain: GeoRisk Indicator
Russia: GeoRisk Indicator
Russia: GeoRisk Indicator
Russia: GeoRisk Indicator
Korea: GeoRisk Indicator
Korea: GeoRisk Indicator
Korea: GeoRisk Indicator
Taiwan: GeoRisk Indicator
Taiwan: GeoRisk Indicator
Taiwan: GeoRisk Indicator
Turkey: GeoRisk Indicator
Turkey: GeoRisk Indicator
Turkey: GeoRisk Indicator
Brazil: GeoRisk Indicator
Brazil: GeoRisk Indicator
Brazil: GeoRisk Indicator
What's On The Geopolitical Radar?
Chart 25
Section III: Geopolitical Calendar
Highlights U.S. consumption remains robust despite the recent intensification of global growth headwinds. The G-20 meeting will not result in an escalation nor a major resolution of Sino-U.S. tensions. Kicking the can down the road is the most likely outcome. China’s reflationary efforts will intensify, impacting global growth in the second half of 2019. Fearful of collapsing inflation expectations, global central banks are easing policy, which is supporting global liquidity conditions and growth prospects. Bond yields have upside, especially inflation expectations. Equities have some short-term downside, but the cyclical peak still lies ahead. The equity rally will leave stocks vulnerable to the inevitable pick-up in interest rates later this cycle. Gold stocks may provide an attractive hedge for now. A spike in oil prices creates a major risk to our view. Stay overweight oil plays. Feature Global growth has clearly deteriorated this year, and bond yields around the world have cratered. German yields have plunged below -0.3% and U.S. yields briefly dipped below 2%. Even if the S&P 500 remains near all-time highs, the performance of cyclical sectors relative to defensive ones is corroborating the message from the bond market. Bonds and stocks are therefore not as much in disagreement as appears at first glance. To devise an appropriate strategy, now more than ever investors must decide whether or not a recession is on the near-term horizon. Answering yes to this question means bond prices will continue to rise, the dollar will rally further, stocks will weaken, and defensive stocks will keep outperforming cyclical ones. Answering no, one should sell bonds, sell the dollar, buy stocks, and overweight cyclical sectors. The weak global backdrop can still capsize the domestic U.S. economy. We stand in the ‘no’ camp: We do not believe a recession is in the offing and, while the current growth slowdown has been painful, it is not the end of the business cycle. Logically, we are selling bonds, selling the dollar and maintaining a positive cyclical stance on stocks. We also expect international equities to outperform U.S. ones, and we are becoming particularly positive on gold stocks. Oil prices should also benefit from the upcoming improvement in global growth. Has The U.S. Economy Met Its Iceberg? Investors betting on a recession often point to the inversion of the 3-month/10-year yield curve and the performance of cyclical stocks. However, we must also remember Paul Samuelson’s famous quip that “markets have predicted nine of the five previous recessions.” In any case, these market moves tell us what we already know: growth has weakened. We must decide whether it will weaken further. A simple probit model based on the yield curve slope and the new orders component of the ISM Manufacturing Index shows that there is a 40% probability of recession over the next 12 months. We need to keep in mind that in 1966 and 1998, this model was flagging a similar message, yet no recession followed over the course of the next year (Chart I-1). This means we must go back and study the fundamentals of U.S. growth. Chart I-1The Risk Of A Recession Has Risen, But It Is Not A No Brainer
The Risk Of A Recession Has Risen, But It Is Not A No Brainer
The Risk Of A Recession Has Risen, But It Is Not A No Brainer
Chart I-2Lower Rates Will Help Residential Investment
Lower Rates Will Help Residential Investment
Lower Rates Will Help Residential Investment
On the purely domestic front, the U.S. economy is not showing major stresses. Last month, we argued that we are not seeing the key symptoms of tight monetary policy: Homebuilders remain confident, mortgage applications for purchases are near cyclical highs, homebuilder stocks have been outperforming the broad market for three quarters, and lumber prices are rebounding.1 Moreover, the previous fall in mortgage yields is already lifting existing home sales, and it is only a matter of time before residential investment follows (Chart I-2). Households remain in fine form. Real consumer spending is growing at a 2.8% pace, and despite rising economic uncertainty, the Atlanta Fed GDPNow model expects real household spending to expand at a 3.9% rate in the second quarter (Chart I-3). This is key, as consumers’ spending and investment patterns drive the larger trends in the economy.2 Chart I-3Consumers Are Spending
Consumers Are Spending
Consumers Are Spending
Chart I-4The Labor Market Is Still Doing Fine...
The Labor Market Is Still Doing Fine...
The Labor Market Is Still Doing Fine...
Going forward, we expect consumption to stay the course. Despite its latest dip, consumer confidence remains elevated, household debt levels have fallen from 134% of disposable income in 2007 to 99% today, and debt-servicing costs only represent 9.9% of after-tax income, a multi-generational low. In this context, stronger household income growth should support spending. The May payrolls report is likely to have been an anomaly. Layoffs are still minimal, initial jobless claims continue to flirt near 50-year lows, the Conference Board’s Leading Credit index shows no stress, and the employment components of both the manufacturing and non-manufacturing ISM are at elevated levels (Chart I-4). If these leading indicators of employment are correct, both the employment-to-population ratio for prime-age workers and salaries have upside (Chart I-5), especially as productivity growth is accelerating. Despite these positives, the weak global backdrop can still capsize the domestic U.S. economy, and force the ISM non-manufacturing PMI to converge toward the manufacturing index. If global growth worsens, the dollar will strengthen, quality spreads will widen and stocks will weaken, resulting in tighter financial conditions. Since economic and trade uncertainty is still high, further deterioration in external conditions will cause U.S. capex to collapse. Employment would follow, confidence suffer and consumption fall. Global growth still holds the key to the future.
Chart I-5
Following The Chinese Impulse As the world’s foremost trading nation, Chinese activity lies at the center of the global growth equation. The China-U.S. trade war remains at the forefront of investors’ minds. The meeting between U.S. President Donald Trump and Chinese President Xi Jinping over the next two days is important. It implies a thawing of Sino-U.S. trade negotiations. However, an overall truce is unlikely. An agreement to resume the talks is the most likely outcome. No additional tariffs will be levied on the remaining $300 billion of untaxed Chinese exports to the U.S., but the previous levies will not be meaningfully changed. Removing this $300 billion Damocles sword hanging over global growth is a positive at the margin. However, it also means that the can has been kicked down the road and that trade will remain a source of headline risk, at least until the end of the year. Chart I-6The Rubicon Has Been Crossed
The Rubicon Has Been Crossed
The Rubicon Has Been Crossed
Trade uncertainty will nudge Chinese policymakers to ease policy further. In previous speeches, Premier Li Keqiang set the labor market as a line in the sand. If it were to deteriorate, the deleveraging campaign could be put on the backburner. Today, the employment component of the Chinese PMI is at its lowest level since the Great Financial Crisis (Chart I-6). This alone warrants more reflationary efforts by Beijing. Adding trade uncertainty to this mix guarantees additional credit and fiscal stimulus. More Chinese stimulus will be crucial for Chinese and global growth. Historically, it has taken approximatively nine months for previous credit and fiscal expansions to lift economic activity. We therefore expect that over the course of the summer, the imports component of the Chinese PMI should improve further, and the overall EM Manufacturing PMI should begin to rebound (Chart I-7, top and second panel). More generally, this summer should witness the bottom in global trade, as exemplified by Asian or European export growth (Chart I-7, third and fourth panel). The prospect for additional Chinese stimulus means that the associated pick-up in industrial activity should have longevity. Global central banks are running a brand new experiment. We are already seeing one traditional signpost that Chinese stimulus is having an impact on growth. Within the real estate investment component of GDP, equipment purchases are growing at a 30% annual rate, a development that normally precedes a rebound in manufacturing activity (Chart I-8, top panel). We are also keeping an eye out for the growth of M1 relative to M2. When Chinese M1 outperforms M2, it implies that demand deposits are growing faster than savings deposits. The inference is that the money injected in the economy is not being saved, but is ready to be deployed. Historically, a rebounding Chinese M1 to M2 ratio accompanies improvements in global trade, commodities prices, and industrial production (Chart I-8, bottom panel). Chart I-7The Turn In Chinese Credit Will Soon Be Felt Around The World
The Turn In Chinese Credit Will Soon Be Felt Around The World
The Turn In Chinese Credit Will Soon Be Felt Around The World
Chart I-8China's Stimulus Is Beginning To Have An Impact
China's Stimulus Is Beginning To Have An Impact
China's Stimulus Is Beginning To Have An Impact
To be sure, China is not worry free. Auto sales are still soft, global semiconductor shipments remain weak, and capex has yet to turn the corner. But the turnaround in credit and in the key indicators listed above suggests the slowdown is long in the tooth. In the second half of 2019, China will begin to add to global growth once again. Advanced Economies’ Central Banks: A Brave New World Chart I-9The Inflation Expectations Panic
The Inflation Expectations Panic
The Inflation Expectations Panic
While China is important, it is not the only game in town. Global central banks are running a brand new experiment. It seems they have stopped targeting realized inflation and are increasingly focused on inflation expectations. The collapse in inflation expectations is worrying central bankers (Chart I-9). Falling anticipated inflation can anchor actual inflation at lower levels than would have otherwise been the case. It also limits the downside to real rates when growth slows, and therefore, the capacity of monetary policy to support economic activity. Essentially, central banks fear that permanently depressed inflation expectations renders them impotent. The change in policy focus is evident for anyone to see. As recently as January 2019, 52% of global central banks were lifting interest rates. Now that inflation expectations are collapsing, other than the Norges Bank, none are doing so (Chart I-10). Instead, the opposite is happening and the RBA, RBNZ and RBI are cutting rates. Moreover, as investors are pricing in lower policy rates around the world, G-10 bond yields are collapsing, which is easing global liquidity conditions. Indeed, as Chart I-11 illustrates, when the share of economies with falling 2-year forward rates is as high as it is today, the BCA Global Leading Indicator rebounds three months later. Chart I-10Central Banks Are In Easing Mode, Everywhere
Central Banks Are In Easing Mode, Everywhere
Central Banks Are In Easing Mode, Everywhere
The European Central Bank stands at the vanguard of this fight. As we argued two months ago, deflationary pressures in Europe are intact and are likely to be a problem for years to come.3 The ECB is aware of this headwind and knows it needs to act pre-emptively. Four months ago, it announced a new TLRTO-III package to provide plentiful funding for stressed banks in the European periphery. On June 6th, ECB President Mario Draghi unveiled very generous financing terms for the TLTRO-III. Last week, at the ECB’s Sintra conference in Portugal, ECB Vice President Luis de Guindos professed that the ECB could cut rates if inflation expectations weaken. The following day, Draghi himself strongly hinted at an upcoming rate cut in Europe and a potential resumption of the ECB QE program. These measures are starting to ease financial conditions where Europe needs it most: Italy. An important contributor to the contraction in the European credit impulse over the past 21 months was the rapid tightening in Italian financial conditions that followed the surge in BTP yields from May 2018. Now that the ECB is becoming increasingly dovish, Italian yields have fallen to 2.1%, and are finally below the neutral rate of interest for Europe. BTP yields are again at accommodative levels. Chart I-11This Much Of An Easing Bias Boosts Growth Prospects
This Much Of An Easing Bias Boosts Growth Prospects
This Much Of An Easing Bias Boosts Growth Prospects
With financial conditions in Europe easing and exports set to pick up in response to Chinese growth, European loan demand should regain some vigor. Meanwhile, the TLTRO-III measures, which are easing bank funding costs, should boost banks’ willingness to lend. The European credit impulse is therefore set to move back into positive territory this fall. European growth will rebound, and contribute to improving global growth conditions. The Fed’s Patience Is Running Out
Chart I-12
The Federal Reserve did not cut interest rates last week, but its intentions to do so next month were clear. First, the language of the statement changed drastically. Gone is the Fed’s patience; instead, there is an urgency to “act as appropriate to sustain the expansion.” Second, the fed funds rate projections from the Summary of Economic Projections were meaningfully revised down. In March, 17 FOMC participants expected the Fed to stay on hold for the remainder of 2019, while six foresaw hikes. Today, eight expect a steady fed funds rate, but seven are calling for two rate cuts this year. Only one member is still penciling in a hike. Moreover, nine out of 17 participants anticipate that rates will be lower in 2020 than today (Chart I-12). The FOMC’s unwillingness to push back very dovish market expectations signals an imminent interest rate cut. Like other advanced economy central banks, the Fed’s sudden dovish turn is aimed at reviving moribund inflation expectations (Chart I-13). In order to do so, the Fed will have to keep real interest rates at low levels, at least relative to real GDP growth. Even if the real policy rate goes up, so long as it increases more slowly than GDP growth, it will signify that money supply is growing faster than money demand.4 TIPS yields are anticipating these dynamics and will likely remain soft relative to nominal interest rates. Chart I-13...As Inflation Expectations Plunge
...As Inflation Expectations Plunge
...As Inflation Expectations Plunge
Since the Fed intends to conduct easy monetary policy until inflation expectations have normalized to the 2.3% to 2.5% zone, our liquidity gauges will become more supportive of economic activity and asset prices over the coming two to three quarters: Our BCA Monetary indicator has not only clearly hooked up, it is now above the zero line, in expansionary territory (see Section III, page 41). Excess money growth, defined as money-of-zero-maturity over loan growth, is once again accelerating. This cycle, global growth variables such as our Global Nowcast, BCA’s Global Leading Economic Indicator, or worldwide export prices have all reliably followed this variable (Chart I-14). After collapsing through 2018, our U.S. Financial Liquidity Index is rebounding sharply, and the imminent end of the Fed’s balance sheet runoff will only solidify this progress. This indicator gauges how cheap and plentiful high-powered money is for global markets. Its recovery suggests that commodities, globally-traded goods prices, and economic activity are all set to improve (Chart I-15). Chart I-14Excess Money Has Turned Up
Excess Money Has Turned Up
Excess Money Has Turned Up
Chart I-15Improving Liquidity Conditions Argue That Nominal Growth Will Pick Up...
Improving Liquidity Conditions Argue That Nominal Growth Will Pick Up...
Improving Liquidity Conditions Argue That Nominal Growth Will Pick Up...
The dollar is losing momentum and should soon fall, which will reinforce the improvement in global liquidity conditions. A trough in our U.S. Financial Liquidity Index is often followed by a weakening dollar (Chart I-16). Moreover, the Greenback’s strength has been turbocharged by exceptional repatriations of funds by U.S. economic agents (Chart I-17). The end of the repatriation holiday along with a more dovish Fed and the completion of the balance sheet runoff will likely weigh on the dollar. Once the Greenback depreciates, the cost of borrowing for foreign issuers of dollar-denominated debt will decline, along with the cost of liquidity, especially if the massive U.S. repatriation flows are staunched. This will further support global growth conditions. Chart I-16...And That The Dollar Will Turn Down...
...And That The Dollar Will Turn Down...
...And That The Dollar Will Turn Down...
Trade relations are unlikely to deteriorate further, China is likely to stimulate more aggressively; and easing central banks around the world, including the Fed, are responding to falling inflation expectations. This backdrop points to a rebound in global growth in the second half of the year. As a corollary, the deflationary patch currently engulfing the world should end soon after. As a result, this growing reflationary mindset should delay any recession until late 2021 if not 2022. However, as the business cycle extends further, greater inflationary pressures will build down the road and force the Fed to lift rates – even more than it would have done prior to this wave of easing. Chart I-17...Especially If Repatriation Flows Slow
...Especially If Repatriation Flows Slow
...Especially If Repatriation Flows Slow
Investment Implications Bonds BCA’s U.S. Bond Strategy service relies on the Golden Rule of Treasury Investing. This simple rule states that when the Fed turns out to be more dovish than anticipated by interest rate markets 12 months prior, Treasurys outperform cash. If the Fed is more hawkish than was expected by market participants, Treasurys underperform (Chart I-18). Today, the Treasury market’s outperformance is already consistent with a Fed generating a very dovish surprise over the next 12 months. However, the interest rate market is already pricing in a 98% probability of two rates cuts this year, and the December 2020 fed funds rate futures imply a halving of the policy rate. The Fed is unlikely to clear these very tall dovish hurdles as global growth is set to rebound, the fed funds rate is not meaningfully above neutral and the household sector remains resilient. Chart I-18Treasurys Already Anticipate Large Dovish Surprises
Treasurys Already Anticipate Large Dovish Surprises
Treasurys Already Anticipate Large Dovish Surprises
Reflecting elevated pessimism toward global growth, the performance of transport relative to utilities stocks is as oversold as it gets. The likely rebound in this ratio should push yields higher, especially as foreign private investors are already aggressively buying U.S. government securities (Chart I-19). As occurred in 1998, Treasury yields should rebound soon after the Fed begins cutting rates. Moreover, with all the major central banks focusing on keeping rates at accommodative levels, the selloff in bonds should be led by inflation breakevens, also as occurred in 1998 (Chart I-20), especially if the dollar weakens. Chart I-19Yields Will Follow Transportation Relative To Utilities Stocks
Yields Will Follow Transportation Relative To Utilities Stocks
Yields Will Follow Transportation Relative To Utilities Stocks
Chart I-201998: Yields Rebounded As Soon As The Fed Began Cutting
1998: Yields Rebounded As Soon As The Fed Began Cutting
1998: Yields Rebounded As Soon As The Fed Began Cutting
Equities A global economic rebound should provide support for equities on a cyclical horizon. The tactical picture remains murky as the stock market may have become too optimistic that Osaka will deliver an all-encompassing deal. However, this short-term downside is likely to prove limited compared to the cyclical strength lying ahead. This is particularly true for global equities, where valuations are more attractive than in the U.S. Chart I-21Easier Liquidity Conditions Lead To Higher Stock Prices
Easier Liquidity Conditions Lead To Higher Stock Prices
Easier Liquidity Conditions Lead To Higher Stock Prices
Even if the S&P 500 isn’t the prime beneficiary of the recovery in global growth, it should nonetheless generate positive absolute returns on a cyclical horizon. As Chart I-21 illustrates, a pickup in our U.S. Financial Liquidity Index often precedes a rally in U.S. stocks. Since the U.S. Financial Liquidity Index has done a superb job of forecasting the weakness in stocks over the past 18 months, it is likely to track the upcoming strength as well. A weaker dollar should provide an additional tailwind to boost profit growth, especially as U.S. productivity is accelerating. This view is problematic for long-term investors. The cheapness of stocks relative to bonds is the only reason why our long-term valuation index is not yet at nosebleed levels Chart I-22). If we are correct that the current global reflationary push will build greater inflationary pressures down the road and will ultimately result in even higher interest rates, this relative undervaluation of equities will vanish. The overall valuation index will then hit near-record highs, leaving the stock market vulnerable to a very sharp pullback. Long-term investors should use this rally to lighten their strategic exposure to stocks, especially when taking into account the risk that populism will force a retrenchment in corporate market power, an issue discussed in Section II. Gone is the Fed’s patience; instead, there is an urgency to “act as appropriate to sustain the expansion.” In this environment, gold stocks are particularly attractive. Central banks are targeting very accommodative policy settings, which will limit the upside for real rates. Moreover, generous liquidity conditions and a falling dollar should prove to be great friends to gold. These fundamentals are being amplified by a supportive technical backdrop, as gold prices have broken out and the gold A/D line keeps making new highs (Chart I-23). Chart I-22Beware What Will Happen To Valuations Once Rates Rise Again
Beware What Will Happen To Valuations Once Rates Rise Again
Beware What Will Happen To Valuations Once Rates Rise Again
Chart I-23Strong Technical Backdrop For The Gold
Strong Technical Backdrop For The Gold
Strong Technical Backdrop For The Gold
Structural forces reinforce these positives for gold. EM reserve managers are increasingly diversifying into gold, fearful of growing geopolitical tensions with the U.S. (Chart I-24). Meanwhile, G-10 central banks are not selling the yellow metal anymore. This positive demand backdrop is materializing as global gold producers have been focused on returning cash to shareholders instead of pouring funds into capex. This lack of investment will weigh on output growth going forward. Chart I-24EM Central Banks Are Diversifying Into Gold
EM Central Banks Are Diversifying Into Gold
EM Central Banks Are Diversifying Into Gold
This emphasis on returning cash to shareholders makes gold stocks particularly attractive. Gold producers are trading at a large discount to the market and to gold itself as investors remain concerned by the historical lack of management discipline. However, boosting dividends, curtailing debt levels and only focusing on the most productive projects ultimately creates value for shareholders. A wave of consolidation will only amplify these tailwinds. Our overall investment recommendation is to overweight stocks over bonds on a cyclical horizon while building an overweight position in gold equities. Our inclination to buy gold stocks transcends our long-term concerns for equities, as rising long-term inflation should favor gold as well. The Key Risk: Iran The biggest risk to our view remains the growing stress in the Middle East. BCA’s Geopolitical Strategy team assigns a less than 40% chance that tensions between the U.S. and Iran will deteriorate into a full-fledged military conflict. The U.S.’s reluctance to respond with force to recent Iranian provocations may even argue that this probability could be too high. Nonetheless, if a military conflict were to happen, it would involve a closing of the Strait of Hormuz, a bottleneck through which more than 20% of global oil production transits. In such a scenario, Brent prices could easily cross above US$150/bbl. Chart I-25Oil Inventories Are Set To Decline
Oil Inventories Are Set To Decline
Oil Inventories Are Set To Decline
To mitigate this risk, we recommend overweighting oil plays in global portfolios. Not only would such an allocation benefit in the event of a blow-up in the Persian Gulf, oil is supported by positive supply/demand fundamentals and Brent should end the year $75/bbl. After five years of limited oil capex, Wood Mackenzie estimates that the supply of oil will be close to 5 million barrels per day smaller than would have otherwise been the case. Moreover, OPEC and Russia remain disciplined oil producers, which is limiting growth in crude output today. Meanwhile, in light of the global growth deceleration, demand for oil has proved surprisingly robust. Demand is likely to pick up further when global growth reaccelerates in the second half of the year. As a result, BCA’s Commodity and Energy Strategy currently expects additional inventory drawdowns that will only push oil prices higher in an environment of growing global reflation (Chart I-25). A falling dollar would accentuate these developments. Mathieu Savary Vice President The Bank Credit Analyst June 27, 2019 Next Report: July 25, 2019 II. The Productivity Puzzle: Competition Is The Missing Ingredient Productivity growth is experiencing a cyclical rebound, but remains structurally weak. The end of the deepening of globalization, statistical hurdles, and the possibility that today’s technological advances may not be as revolutionary as past ones all hamper productivity. On the back of rising market power and concentration, companies are increasing markups instead of production. This is depressing productivity and lowering the neutral rate of interest. For now, investors can generate alpha by focusing on consolidating industries. Growing market power cannot last forever and will meet a political wall. Structurally, this will hurt asset prices. “We don’t have a free market; don’t kid yourself. (…) Businesspeople are enemies of free markets, not friends (…) businesspeople are all in favor of freedom for everybody else (…) but when it comes to their own business, they want to go to Washington to protect their businesses.” Milton Friedman, January 1991. Despite the explosion of applications of growing computing power, U.S. productivity growth has been lacking this cycle. This incapacity to do more with less has weighed on trend growth and on the neutral rate of interest, and has been a powerful force behind the low level of yields at home and abroad. In this report, we look at the different factors and theories advanced to explain the structural decline in productivity. Among them, a steady increase in corporate market power not only goes a long way in explaining the lack of productivity in the U.S., but also the high level of profit margins along with the depressed level of investment and real neutral rates. A Simple Cyclical Explanation The decline in productivity growth is both a structural and cyclical story. Historically, productivity growth has followed economic activity. When demand is strong, businesses can generate more revenue and therefore produce more. The historical correlation between U.S. nonfarm business productivity and the ISM manufacturing index illustrates this relationship (Chart II-1). Chart II-1The Cyclical Behavior Of Productivity
The Cyclical Behavior Of Productivity
The Cyclical Behavior Of Productivity
Chart II-2Deleveraging Hurts Productivity
Deleveraging Hurts Productivity
Deleveraging Hurts Productivity
Since 2008, as households worked off their previous over-indebtedness, the U.S. private sector has experienced its longest deleveraging period since the Great Depression. This frugality has depressed demand and contributed to lower growth this cycle. Since productivity is measured as output generated by unit of input, weak demand growth has depressed productivity statistics. On this dimension, the brief deleveraging experience of the early 1990s is instructive: productivity picked up only after 1993, once the private sector began to accumulate debt faster than the pace of GDP growth (Chart II-2). The recent pick-up in productivity reflects these debt dynamics. Since 2009, the U.S. non-financial private sector has stopped deleveraging, removing one anchor on demand, allowing productivity to blossom. Moreover, the pick-up in capex from 2017 to present is also helping productivity by raising the capital-to-workers ratio. While this is a positive development for the U.S. economy, the decline in productivity nonetheless seems structural, as the five-year moving average of labor productivity growth remains near its early 1980s nadir (Chart II-3). Something else is at play.
Chart II-3
The Usual Suspects Three major forces are often used to explain why observed productivity growth is currently in decline: A slowdown in global trade penetration, the fact that statisticians do not have a good grasp on productivity growth in a service-based economy, and innovation that simply isn’t what it used to be. Slowdown In Global Trade Penetration Two hundred years ago, David Ricardo argued that due to competitive advantages, countries should always engage in trade to increase their economic welfare. This insight has laid the foundation of the argument that exchanges between nations maximizes the utilization of resources domestically and around the world. Rarely was this argument more relevant than over the past 40 years. On the heels of the supply-side revolution of the early 1980s and the fall of the Berlin Wall, globalization took off. The share of the world's population participating in the global capitalist system rose from 30% in 1985 to nearly 100% today. The collapse in new business formation in the U.S. is another fascinating development. Generating elevated productivity gains is simpler when a country’s capital stock is underdeveloped: each unit of investment grows the capital-to-labor ratio by a greater proportion. As a result, productivity – which reflects the capital-to-worker ratio – can grow quickly. As more poor countries have joined the global economy and benefitted from FDI and other capital inflows, their productivity has flourished. Consequently, even if productivity growth has been poor in advanced economies over the past 10 years, global productivity has remained high and has tracked the share of exports in global GDP (Chart II-4). Chart II-4The Apex Of Globalization Represented The Summit Of Global Productivity Growth
The Apex Of Globalization Represented The Summit Of Global Productivity Growth
The Apex Of Globalization Represented The Summit Of Global Productivity Growth
This globalization tailwind to global productivity growth is dissipating. First, following an investment boom where poor decisions were made, EM productivity growth has been declining. Second, with nearly 100% of the world’s labor supply already participating in the global economy, it is increasingly difficult to expand the share of global trade in global GDP and increase the benefit of cross-border specialization. Finally, the popular backlash in advanced economies against globalization could force global trade into reverse. As economic nationalism takes hold, cross-border investments could decline, moving the world economy further away from an optimal allocation of capital. These forces may explain why global productivity peaked earlier this decade. Productivity Is Mismeasured Recently deceased luminary Martin Feldstein argued that the structural decline in productivity is an illusion. As the argument goes, productivity is not weak; it is only underestimated. This is pure market power, and it helps explain the gap between wages and productivity. A parallel with the introduction of electricity in the late 19th century often comes to mind. Back then, U.S. statistical agencies found it difficult to disentangle price changes from quantity changes in the quickly growing revenues of electrical utilities. As a result, the Bureau Of Labor Statistics overestimated price changes in the early 20th century, which depressed the estimated output growth of utilities by a similar factor. Since productivity is measured as output per unit of labor, this also understated actual productivity growth – not just for utilities but for the economy as a whole. Ultimately, overall productivity growth was revised upward. Chart II-5Plenty Of Room To Mismeasure Real Output Growth
Plenty Of Room To Mismeasure Real Output Growth
Plenty Of Room To Mismeasure Real Output Growth
In today’s economy, this could be a larger problem, as 70% of output is generated in the service sector. Estimating productivity growth is much harder in the service sector than in the manufacturing sector, as there is no actual countable output to measure. Thus, distinguishing price increases from quantity or quality improvements is challenging. Adding to this difficulty, the service sector is one of the main beneficiaries of the increase in computational power currently disrupting industries around the world. The growing share of components of the consumer price index subject to hedonic adjustments highlight this challenge (Chart II-5). Estimating quality changes is hard and may bias the increase in prices in the economy. If prices are unreliably measured, so will output and productivity. Chart II-6A Multifaceted Decline In Productivity
A Multifaceted Decline In Productivity
A Multifaceted Decline In Productivity
Pushing The Production Frontier Is Increasingly Hard Another school of thought simply accepts that productivity growth has declined in a structural fashion. It is far from clear that the current technological revolution is much more productivity-enhancing than the introduction of electricity 140 years ago, the development of the internal combustion engine in the late 19th century, the adoption of indoor plumbing, or the discovery of penicillin in 1928. It is easy to overestimate the economic impact of new technologies. At first, like their predecessors, the microprocessor and the internet created entirely new industries. But this is not the case anymore. For all its virtues, e-commerce is only a new method of selling goods and services. Cloud computing is mainly a way to outsource hardware spending. Social media’s main economic value has been to gather more information on consumers, allowing sellers to reach potential buyers in a more targeted way. Without creating entirely new industries, spending on new technologies often ends up cannibalizing spending on older technologies. For example, while Google captures 32.4% of global ad revenues, similar revenues for the print industry have fallen by 70% since their apex in 2000. If new technologies are not as accretive to production as the introduction of previous ones were, productivity growth remains constrained by the same old economic forces of capex, human capital growth and resource utilization. And as Chart II-6 shows, labor input, the utilization of capital and multifactor productivity have all weakened. Some key drivers help understand why productivity growth has downshifted structurally.
Chart II-7
Chart II-8Demographics Are Hurting Productivity
Demographics Are Hurting Productivity
Demographics Are Hurting Productivity
Let’s look at human capital. It is much easier to grow human capital when very few people have a high-school diploma: just make a larger share of your population finish high school, or even better, complete a university degree. But once the share of university-educated citizens has risen, building human capital further becomes increasingly difficult. Chart II-7 illustrates this problem. Growth in educational achievement has been slowing since 1995 in both advanced and developing economies. This means that the growth of human capital is slowing. This is without even wading into whether or not the quality of education has remained constant. Human capital is also negatively impacted by demographic trends. Workers in their forties tend to be at the peak of their careers, with the highest accumulated job know-how. Problematically, these workers represent a shrinking share of the labor force, which is hurting productivity trends (Chart II-8). The capital stock too is experiencing its own headwinds. While Moore’s Law seems more or less intact, the decline in the cost of storing information is clearly decelerating (Chart II-9). Today, quality adjusted IT prices are contracting at a pace of 2.3% per annum, compared to annual declines of 14% at the turn of the millennium. Thus, even if nominal spending in IT investment had remained constant, real investment growth would have sharply decelerated (Chart II-10). But since nominal spending has decelerated greatly from its late 1990s pace, real investment in IT has fallen substantially. The growth of the capital stock is therefore lagging its previous pace, which is hurting productivity growth.
Chart II-9
Chart II-10The Impact Of Slowing IT Deflation
The Impact Of Slowing IT Deflation
The Impact Of Slowing IT Deflation
Chart II-11A Dearth Of New Businesses
A Dearth Of New Businesses
A Dearth Of New Businesses
The collapse in new business formation in the U.S. is another fascinating development (Chart II-11). New businesses are a large source of productivity gains. Ultimately, 20% of productivity gains have come from small businesses becoming large ones. Think Apple in 1977 versus Apple today. A large decline in the pace of new business formation suggests that fewer seeds have been planted over the past 20 years to generate those enormous productivity explosions than was the case in the previous 50 years. The X Factor: Growing Market Concentration Chart II-12Wide Profit Margins: A Testament To The Weakness Of Labor
Wide Profit Margins: A Testament To The Weakness Of Labor
Wide Profit Margins: A Testament To The Weakness Of Labor
The three aforementioned explanations for the decline in productivity are all appealing, but they generally leave investors looking for more. Why are companies investing less, especially when profit margins are near record highs? Why is inflation low? Why has the pace of new business formation collapsed? These are all somewhat paradoxical. This is where a growing body of works comes in. Our economy is moving away from the Adam Smith idea of perfect competition. Industry concentration has progressively risen, and few companies dominate their line of business and control both their selling prices and input costs. They behave as monopolies and monopsonies, all at once.1 This helps explain why selling prices have been able to rise relative to unit labor costs, raising margins in the process (Chart II-12). Let’s start by looking at the concept of market concentration. According to Grullon, Larkin and Michaely, sales of the median publicly traded firms, expressed in constant dollars, have nearly tripled since the mid-1990s, while real GDP has only increased 70% (Chart II-13).2 The escalation in market concentration is also vividly demonstrated in Chart II-14. The top panel shows that since 1997, most U.S. industries have experienced sharp increases in their Herfindahl-Hirshman Index (HHI),3 a measure of concentration. In fact, more than half of U.S. industries have experienced concentration increases of more than 40%, and as a corollary, more than 75% of industries have seen the number of firms decline by more than 40%. The last panel of the chart also highlights that this increase in concentration has been top-heavy, with a third of industries seeing the market share of their four biggest players rise by more than 40%. Rising market concentration is therefore a broad phenomenon – not one unique to the tech sector.
Chart II-13
Chart II-14
This rising market concentration has also happened on the employment front. In 1995, less than 24% of U.S. private sector employees worked for firms with 10,000 or more employees, versus nearly 28% today. This does not seem particularly dramatic. However, at the local level, the number of regions where employment is concentrated with one or two large employers has risen. Azar, Marinescu and Steinbaum developed Map II-1, which shows that 75% of non-metropolitan areas now have high or extreme levels of employment concentration.4
Chart II-
Chart II-15The Owners Of Capital Are Keeping The Proceeds Of The Meagre Productivity Gains
The Owners Of Capital Are Keeping The Proceeds Of The Meagre Productivity Gains
The Owners Of Capital Are Keeping The Proceeds Of The Meagre Productivity Gains
This growing market power of companies on employment can have a large impact on wages. Chart II-15 shows that real wages have lagged productivity since the turn of the millennium. Meanwhile, Chart II-16 plots real wages on the y-axis versus the HHI of applications (top panel) and vacancies (bottom panel). This chart shows that for any given industry, if applicants in a geographical area do not have many options where to apply – i.e. a few dominant employers provide most of the jobs in the region – real wages lag the national average. The more concentrated vacancies as well as applications are with one employer, the greater the discount to national wages in that industry.5 This is pure market power, and it helps explain the gap between wages and productivity as well as the widening gap between metropolitan and non-metropolitan household incomes.
Chart II-16
Growing market power and concentration do not only compress labor costs, they also result in higher prices for consumers. This seems paradoxical in a world of low inflation. But inflation could have been even lower if market concentration had remained at pre-2000s levels. In 2009, Matthew Weinberg showed that over the previous 22 years, horizontal mergers within an industry resulted in higher prices.6 In a 2014 meta-study conducted by Weinberg along with Orley Ashenfelter and Daniel Hosken, the authors showed that across 49 studies ranging across 21 industries, 36 showed that horizontal mergers resulted in higher prices for consumers.7 While today’s technology may be enhancing the productive potential of our economies, this is not benefiting output and measured productivity. Instead, it is boosting profit margins. In a low-inflation environment, the only way for companies to garner pricing power is to decrease competition, and M&As are the quickest way to achieve this goal. After examining nearly 50 merger and antitrust studies spanning more than 3,000 merger cases, John Kwoka found that, following mergers that augmented an industry’s concentration, prices increased in 95% of cases, and on average by 4.5%.8 In no industry is this effect more vividly demonstrated than in the healthcare field, an industry that has undergone a massive wave of consolidation – from hospitals, to pharmacies to drug manufacturers. As Chart II-17 illustrates, between 1980 and 2016, healthcare costs have increased at a much faster pace in the U.S. than in the rest of the world. However, life expectancy increased much less than in other advanced economies.
Chart II-17
In this context of growing market concentration, it is easy to see why, as De Loecker and Eeckhout have argued, markups have been rising steadily since the 1980s (Chart II-18, top panel) and have tracked M&A activity (Chart II-18, bottom panel).9 In essence, mergers and acquisitions have been the main tool used by firms to increase their concentration. Another tool at their disposal has been the increase in patents. The top panel of Chart II-19 shows that the total number of patent applications in the U.S. has increased by 3.6-fold since the 1980s, but most interestingly, the share of patents coming from large, dominant players within each industry has risen by 10% over the same timeframe (Chart II-19, bottom panel). To use Warren Buffet’s terminology, M&A and patents have been how firms build large “moats” to limit competition and protect their businesses. Chart II-18Markups Rise Along With Growing M&A Activity
Markups Rise Along With Growing M&A Activity
Markups Rise Along With Growing M&A Activity
Chart II-19How To Build A Moat?
How To Build A Moat?
How To Build A Moat?
Why is this rise in market concentration affecting productivity? First, from an empirical perspective, rising markups and concentration tend to lead to lower levels of capex. A recent IMF study shows that the more concentrated industries become, the higher the corporate savings rate goes (Chart II-20, top panel).10 These elevated savings reflect wider markups, but also firms with markups in the top decile of the distribution display significantly lower investment rates (Chart II-20, bottom panel). If more of the U.S. output is generated by larger, more concentrated firms, this leads to a lower pace of increase in the capital stock, which hurts productivity.
Chart II-20
Chart II-
Second, downward pressure on real wages is also linked to a drag on productivity. Monopolies and oligopolies are not incentivized to maximize output. In fact, for any market, a monopoly should lead to lower production than perfect competition would. Diagram II-I from De Loecker and Eeckhout shows that moving from perfect competition to a monopoly results in a steeper labor demand curve as the monopolist produces less. As a result, real wages move downward and the labor participation force declines. Does this sound familiar? The rise of market power might mean that in some way Martin Feldstein was right about productivity being mismeasured – just not the way he anticipated. In a June 2017 Bank Credit Analyst Special Report, Peter Berezin showed that labor-saving technologies like AI and robotics, which are increasingly being deployed today, could lead to lower wages (Chart II-21).11 For a given level of technology in the economy, productivity is positively linked to real wages but inversely linked to markups – especially if the technology is of the labor-saving kind. So, if markups rise on the back of firms’ growing market power, the ensuing labor savings will not be used to increase actual input. Rather, corporate savings will rise. Thus, while today’s technology may be enhancing the productive potential of our economies, this is not benefiting output and measured productivity. Instead, it is boosting profit margins.12 Unsurprisingly, return on assets and market concentration are positively correlated (Chart II-22).
Chart II-21
Chart II-22
Finally, market power and concentration weighing on capex, wages and productivity are fully consistent with higher returns of cash to shareholders and lower interest rates. The higher profits and lower capex liberate cash flows available to be redistributed to shareholders. Moreover, lower capex also depresses demand for savings in the economy, while weak wages depress middle-class incomes, which hurts aggregate demand. Additionally, higher corporate savings increases the wealth of the richest households, who have a high marginal propensity to save. This results in higher savings for the economy. With a greater supply of savings and lower demand for those savings, the neutral rate of interest has been depressed. Investment Implications First, in an environment of low inflation, investors should continue to favor businesses that can generate higher markups via pricing power. Equity investors should therefore continue to prefer industries where horizontal mergers are still increasing market concentration. Second, so long as the status quo continues, wages will have a natural cap, and so will the neutral rate of interest. This does not mean that wage growth cannot increase further on a cyclical basis, but it means that wages are unlikely to blossom as they did in the late 1960s, even within a very tight labor market. Without too-severe an inflation push from wages, the business cycle could remain intact even longer, keeping a window open for risk assets to rise further on a cyclical basis. Third, long-term investors need to keep a keen eye on the political sphere. A much more laissez-faire approach to regulation, a push toward self-regulation, and a much laxer enforcement of antitrust laws and merger rules were behind the rise in market power and concentration.13 The particularly sharp ascent of populism in Anglo-Saxon economies, where market power increased by the greatest extent, is not surprising. So far, populists have not blamed the corporate sector, but if the recent antitrust noise toward the Silicon Valley behemoths is any indication, the clock is ticking. On a structural basis, this could be very negative for asset prices. An end to this rise in market power would force profit margins to mean-revert toward their long-term trend, which is 4.7 percentage-points below current levels. This will require discounting much lower cash flows in the future. Additionally, by raising wages and capex, more competition would increase aggregate demand and lift real interest rates. Higher wages and aggregate demand could also structurally lift inflation. Thus, not only will investors need to discount lower cash flows, they will have to do so at higher discount rates. As a result, this cycle will likely witness both a generational peak in equity valuations as well as structural lows in bond yields. As we mentioned, these changes are political in nature. We will look forward to studying the political angle of this thesis to get a better handle on when these turning points will likely emerge. Mathieu Savary Vice President The Bank Credit Analyst III. Indicators And Reference Charts Over the past two weeks, the ECB has made a dovish pivot, President Trump announced he would meet President Xi, and the Fed telegraphed a rate cut for July. In response, the S&P 500 made marginal new highs before softening anew. This lack of continuation after such an incredible alignment of stars shows that the bulls lack conviction. These dynamics increase the probability that the market sells off after the G-20 meeting, as we saw last December following the supposed truce in Buenos Aires. The short-term outlook remains dangerous. Our Revealed Preference Indicator (RPI) confirms this intuition. The RPI combines the idea of market momentum with valuation and policy measures. It provides a powerful bullish signal if positive market momentum lines up with constructive readings from the policy and valuation measures. Conversely, if stong market momentum is not supported by valuation and policy, investors should lean against the market trend. Cheaper valuations, a pick-up in global growth or an actual policy easing is required before stocks can resume their ascent. The cyclical outlook is brighter than the tactical one. Our Willingness-to-Pay (WTP) indicator for the U.S. and Japan continues to improve. However, it remains flat in Europe. The WTP indicator tracks flows, and thus provides information on what investors are actually doing, as opposed to sentiment indexes that track how investors are feeling. In aggregate, the WTP currently suggests that investors are still inclined to add to their stock holdings. Hence, we expect global investors will continue to buy the dips. Our Monetary Indicator is moving deeper into stimulative territory, supporting our cyclically constructive equity view. The Fed and the ECB are set to cut rates while other global central banks have been opening the monetary spigots. This will support global monetary conditions. The BCA Composite Valuation Indicator, an amalgamation of 11 measures, is in overvalued territory, but it is not high enough to negate the positive message from our Monetary Indicator, especially as our Composite Technical Indicator remains above its 9-month moving average. These dynamics confirm that despite the near-term downside, equities have more cyclical upside. According to our model, 10-year Treasurys are now expensive. Moreover, our technical indicator is increasingly overbought while the CRB Raw Industrials is oversold, a combination that often heralds the end of bond rallies. Additionally, duration surveys show that investors have very elevated portfolio duration, and both the term premium and Fed expectations are very depressed. Considering this technical backdrop, BCA’s economic view implies minimal short-term downside for yields, but significant downside for Treasury prices over the upcoming year. On a PPP basis, the U.S. dollar remains very expensive. Additionally, after forming a negative divergence with prices, our Composite Technical Indicator is falling quickly. Being a momentum currency, the dollar could suffer significant downside if this indicator falls below zero. Monitor these developments closely. EQUITIES: Chart III-1U.S. Equity Indicators
U.S. Equity Indicators
U.S. Equity Indicators
Chart III-2Willingness To Pay For Risk
Willingness To Pay For Risk
Willingness To Pay For Risk
Chart III-3U.S. Equity Sentiment Indicators
U.S. Equity Sentiment Indicators
U.S. Equity Sentiment Indicators
Chart III-4Revealed Preference Indicator
Revealed Preference Indicator
Revealed Preference Indicator
Chart III-5U.S. Stock Market Valuation
U.S. Stock Market Valuation
U.S. Stock Market Valuation
Chart III-6U.S. Earnings
U.S. Earnings
U.S. Earnings
Chart III-7Global Stock Market And Earnings: Relative Performance
Global Stock Market And Earnings: Relative Performance
Global Stock Market And Earnings: Relative Performance
Chart III-8Global Stock Market And Earnings: Relative Performance
Global Stock Market And Earnings: Relative Performance
Global Stock Market And Earnings: Relative Performance
FIXED INCOME: Chart III-9U.S. Treasurys And Valuations
U.S. Treasurys And Valuations
U.S. Treasurys And Valuations
Chart III-10Yield Curve Slopes
Yield Curve Slopes
Yield Curve Slopes
Chart III-11Selected U.S. Bond Yields
Selected U.S. Bond Yields
Selected U.S. Bond Yields
Chart III-1210-Year Treasury Yield Components
10-Year Treasury Yield Components
10-Year Treasury Yield Components
Chart III-13U.S. Corporate Bonds And Health Monitor
U.S. Corporate Bonds And Health Monitor
U.S. Corporate Bonds And Health Monitor
Chart III-14Global Bonds: Developed Markets
Global Bonds: Developed Markets
Global Bonds: Developed Markets
Chart III-15Global Bonds: Emerging Markets
Global Bonds: Emerging Markets
Global Bonds: Emerging Markets
CURRENCIES: Chart III-16U.S. Dollar And PPP
U.S. Dollar And PPP
U.S. Dollar And PPP
Chart III-17U.S. Dollar And Indicator
U.S. Dollar And Indicator
U.S. Dollar And Indicator
Chart III-18U.S. Dollar Fundamentals
U.S. Dollar Fundamentals
U.S. Dollar Fundamentals
Chart III-19Japanese Yen Technicals
Japanese Yen Technicals
Japanese Yen Technicals
Chart III-20Euro Technicals
Euro Technicals
Euro Technicals
Chart III-21Euro/Yen Technicals
Euro/Yen Technicals
Euro/Yen Technicals
Chart III-22Euro/Pound Technicals
Euro/Pound Technicals
Euro/Pound Technicals
COMMODITIES: Chart III-23Broad Commodity Indicators
Broad Commodity Indicators
Broad Commodity Indicators
Chart III-24Commodity Prices
Commodity Prices
Commodity Prices
Chart III-25Commodity Prices
Commodity Prices
Commodity Prices
Chart III-26Commodity Sentiment
Commodity Sentiment
Commodity Sentiment
Chart III-27Speculative Positioning
Speculative Positioning
Speculative Positioning
ECONOMY: Chart III-28U.S. And Global Macro Backdrop
U.S. And Global Macro Backdrop
U.S. And Global Macro Backdrop
Chart III-29U.S. Macro Snapshot
U.S. Macro Snapshot
U.S. Macro Snapshot
Chart III-30U.S. Growth Outlook
U.S. Growth Outlook
U.S. Growth Outlook
Chart III-31U.S. Cyclical Spending
U.S. Cyclical Spending
U.S. Cyclical Spending
Chart III-32U.S. Labor Market
U.S. Labor Market
U.S. Labor Market
Chart III-33U.S. Consumption
U.S. Consumption
U.S. Consumption
Chart III-34U.S. Housing
U.S. Housing
U.S. Housing
Chart III-35U.S. Debt And Deleveraging
U.S. Debt And Deleveraging
U.S. Debt And Deleveraging
Chart III-36U.S. Financial Conditions
U.S. Financial Conditions
U.S. Financial Conditions
Chart III-37Global Economic Snapshot: Europe
Global Economic Snapshot: Europe
Global Economic Snapshot: Europe
Chart III-38Global Economic Snapshot: China
Global Economic Snapshot: China
Global Economic Snapshot: China
Mathieu Savary Vice President The Bank Credit Analyst Footnotes 1 Please see The Bank Credit Analyst "June 2019," dated May 30, 2019, available at bca.bcaresearch.com 2 Please see Global Investment Strategy Special Report "Give Credit Where Credit Is Due," dated November 27, 2015, available at gis.bcaresearch.com 3 Please see The Bank Credit Analyst Special Report "Europe: Here I Am, Stuck In A Liquidity Trap," dated April 25, 2019, available at bca.bcaresearch.com 4 Money demand is mostly driven by the level of activity and wealth. If the price of money – interest rates – is growing more slowly than money demand, the most likely cause is that money supply is increasing faster than money demand and policy is accommodative. 5 A monopsony is a firm that controls the price of its input because it is the dominant, if not unique, buyer of said input. 6 G. Grullon, Y. Larkin and R. Michaely, “Are Us Industries Becoming More Concentrated?,” April 2017. 7 The Herfindahl-Hirschman Index (HHI) is calculated by taking the market share of each firm in the industry, squaring them, and summing the result. Consider a hypothetical industry with four total firm where firm1, firm2, firm3 and firm4 has 40%, 30%, 15% and 15% of market share, respectively. Then HHI is 402+302+152+152 = 2,950. 8 J. Azar, I. Marinescu, M. Steinbaum, “Labor Market Concentration,” December 2017. 9 J. Azar, I. Marinescu, M. Steinbaum, “Labor Market Concentration,” December 2017. 10 M. Weinberg, “The Price Effects Of Horizontal Mergers”, Journal of Competition Law & Economics, Volume 4, Issue 2, June 2008, Pages 433–447. 11 O. Ashenfelter, D. Hosken, M. Weinberg, "Did Robert Bork Understate the Competitive Impact of Mergers? Evidence from Consummated Mergers," Journal of Law and Economics, University of Chicago Press, vol. 57(S3), pages S67 - S100. 12 J. Kwoka, “Mergers, Merger Control, and Remedies: A Retrospective Analysis of U.S. Policy,” MIT Press, 2015. 13 J. De Loecker, J. Eeckhout, G. Unger, "The Rise Of Market Power And The Macroeconomic Implications," Mimeo 2018. 14 “Chapter 2: The Rise of Corporate Market Power and Its Macroeconomic Effects,” World Economic Outlook, April 2019. 15 Please see The Bank Credit Analyst Special Report "Is Slow Productivity Growth Good Or Bad For Bonds?"dated May 31, 2017, available at bca.bcaresearch.com. 16 Productivity can be written as:
Image
17 J. Tepper, D. Hearn, “The Myth of Capitalism: Monopolies and the Death of Competition,” Wiley, November 2018. EQUITIES:FIXED INCOME:CURRENCIES:COMMODITIES:ECONOMY:
Highlights A rare market trifecta – propelled by investors seeking safe-haven assets, inflation hedges in the wake of the Fed’s dovish turn this past week, and portfolio diversification – will continue to keep gold well bid. It would only be natural for gold to have an episode of profit taking in the short term, following its 6.4% jump from ~ $1,340/oz beginning in mid-June. That said, we would use any profit-taking episode to get long gold, following its decisive break through resistance at $1,365/oz to a six-year high of $1,423.44/oz in New York spot trading on Tuesday, according to Bloomberg. The next significant resistance we see is at $1,790/oz. Energy: Overweight. Iran’s oil exports have fallen to ~ 300k b/d so far in June, according to Refinitiv Eikon, a data provider owned by Blackrock and Thomson Reuters. In mid-2018, exports exceeded 2.5mm b/d. The Kingdom of Saudi Arabia (KSA) re-assured markets its spare capacity allows it to meet customer demand. Separately, the U.S. EIA reported commercial crude oil inventories in the fell 12.8mm bbl, during the week ended June 21, 2019. This likely reflects the end of the longer-than-usual refinery turn-around season in the U.S. Base Metals: Neutral. Reduced copper concentrate supplies on the back of strike action at Codelco’s Chuquicamata mine in Chile have clobbered the Fastmarkets MB Asia – Pacific treatment and refining index, which stood at $53.50/MT June 21, its lowest level since 2013. A low index level indicates tight physical supplies. We are taking profits on our long September $3.00/lb COMEX copper calls vs. short September $3.30/lb COMEX copper calls at tonight's close. The position was up 192% at Tuesday's close. Precious Metals: Neutral. Markets await a possible re-start of Sino – U.S. trade talks at this weekend’s meeting in Osaka between presidents Xi and Trump at the G20. Ags/Softs: Underweight. The USDA Crop Progress again showed corn planting behind schedule, clocking in at 96% vs. 100% on average this time of year. Corn emergence also is behind schedule, at 89% vs. an average 99% at this time of year. Only 56% of the crop was reported to be in good or excellent condition, vs. 77% last year at this time. We expect corn to remain well bid. Feature The three main drivers of gold demand – safe-haven buying, inflation hedging and portfolio diversification – will continue to sustain the metal’s powerful rally. Safe-haven demand propelled gold toward long-term resistance at $1,365/oz in mid-June, as the U.S. – Iran showdown in the Persian Gulf intensified. As U.S. messaging becomes more internally inconsistent – particularly the resolve of America to continue to safeguard freedom of navigation through the Strait of Hormuz – uncertainty as to how the showdown will resolve increases. In response to recent attacks on commercial oil-product tankers near the Strait of Hormuz – where close to 20% of the world’s oil supply transits daily – the U.S. has deployed close to 30,000 military personnel to the Persian Gulf region, the highest level of sailors deployed anywhere in the world. However, President Trump has said he is willing to leave the U.S.’s resolve to defend freedom of navigation through the Strait “a question mark.”1 This will continue to keep a safe-haven bid under gold, until markets receive clarity on the U.S.’s commitment to its historical role, and resolution in one form or another on the showdown in the Gulf. Fed’s Dovish Turn Bullish For Gold As unnerving to markets as the showdown in the Gulf is, it was the Fed’s unexpectedly dovish turn this past week that really turbo-charged gold prices, pushing them through $1,400/oz. Although inflation does not appear to be a huge risk to the U.S. economy, we do expect the U.S. CPI to move higher in 2H19. With the U.S. economy remaining at or close to full employment, investors realized the “insurance cut” telegraphed by the U.S. central bank for next month’s Board of Governors meeting stands a very good chance of finally goosing inflation higher, and re-anchoring inflation expectations later this year, which have been moving lower since 2H18 (Chart of the Week). Indeed, as Peter Berezin notes, “The fact that market-based inflation expectations have dropped sharply since last autumn has clearly influenced the Fed’s thinking.”2 The New York Fed’s Underlying Inflation Gauge (UIG) already is registering a build-up in U.S. inflationary pressures (Chart 2). Although inflation does not appear to be a huge risk to the U.S. economy, we do expect the U.S. CPI to move higher in 2H19, something we believe investors already are embedding in gold prices. Chart of the WeekThe Fed Wants Inflation Expectations Higher
The Fed Wants Inflation Expectations Higher
The Fed Wants Inflation Expectations Higher
Chart 2Underlying Inflation Trends Indicate Higher U.S. Inflation
Underlying Inflation Trends Indicate Higher U.S. Inflation
Underlying Inflation Trends Indicate Higher U.S. Inflation
USD Weakness Will Support Gold Chart 3Weaker USD Will Boost Gold Prices
Weaker USD Will Boost Gold Prices
Weaker USD Will Boost Gold Prices
The Fed’s more accommodative policy also will push the broad USD trade-weighted index (TWI) lower, which will be bullish for gold as well (Chart 3). U.S. CPI and the broad USD TWI are two of the strongest explanatory variables for gold prices we have found in our modeling, along with real U.S. interest rates.3 Expect Profit-Taking Technically, the sharp rally in gold prices over the short term is pushing gold prices toward “overbought” territory, which is why we are expecting a round of profit-taking in the near term (Chart 4). Our Gold Composite Indicator moved up half a standard deviation since the start of the year, thanks to the above-mentioned trifecta. This move took the metal from a neutral position at the beginning of the year into a relatively mild overbought level. With the sharp rally over the past two weeks, gold now appears to be mildly overbought.4 Gold’s price performance is outstripping our equity risk-premium indicator, which measures the difference between the S&P 500 earnings yield (i.e., the inverse of the forward price/earnings ratio) and real 10-year U.S. Treasury yields (Chart 5). This is not unexpected, and may be something of a catch-up following the strong gains put up by the equity index relative to gold last year. Chart 4Short-Term Profit-Taking Likely In Gold Market
Short-Term Profit-Taking Likely In Gold Market
Short-Term Profit-Taking Likely In Gold Market
Chart 5Gold Price Gain Outstrips Equity Risk Premium
Gold Price Gain Outstrips Equity Risk Premium
Gold Price Gain Outstrips Equity Risk Premium
Gold’s price performance is outstripping our equity risk-premium indicator. Bottom Line: Gold prices to remain well supported by a rare market trifecta – investors seeking safe-haven assets, inflation hedges following the Fed’s dovish turn this past week, and portfolio diversification. We are expecting a round of profit taking in gold over the short term. We would use these brief selloffs to get long gold. The next significant resistance we see is at $1,790/oz. Robert P. Ryan, Chief Commodity & Energy Strategist rryan@bcaresearch.com Footnotes 1 Please see the June 20, 2019 Commodity & Energy Strategy Weekly Report, "Supply – Demand Balances Consistent With Higher Oil Prices" – particularly the section entitled “Will The U.S. Defend Gulf Sea Lanes?” beginning on p. 3. It is available at ces.bcaresearch.com. See also More U.S. Navy Personnel Deployed to Middle East Than Anywhere Else published by usni.org June 24, 2019. 2 Please see BCA Research's Global Investment Strategy Weekly Report, "Gentle Jay," for BCA Research’s appraisal of last week Fed board of governors meeting. Published June 21, 2019. It is available at gis.bcaresearch.com. In it, our Chief Global Investment strategist Peter Berezin notes, “Right now, rising inflation is not much of a risk. However, the Fed’s dovish turn almost guarantees that the U.S. economy will overheat.” See also “The Fed’s Got Your Back,” published by BCA Research’s U.S. Bond Strategy and Global Fixed Income Strategy June 25, 2019. It is available at usbs.bcaresearch.com and gfis.bcaresearch.com. 3 We have found inflation and U.S. financial variables – particularly the USD broad trade-weighted index, and real U.S. interest rates – are the chief variables explaining gold prices. Please see BCA Research’s Commodity & Energy Strategy Weekly Report “Balance Of Risks Favors Holding Gold,” published by October 12, 2017. It is available at ces.bcaresearch.com. 4 Our Gold Composite Indicator combines sentiment, speculative-position levels, relative strength, and momentum gauges to characterize overbought and oversold conditions. Investment Views and Themes Recommendations Strategic Recommendations Tactical Trades Trade Recommendation Performance In 2019 Q1
The Gold Trifecta
The Gold Trifecta
Commodity Prices and Plays Reference Table Trades Closed in 2019 Summary of Closed Trades
The Gold Trifecta
The Gold Trifecta
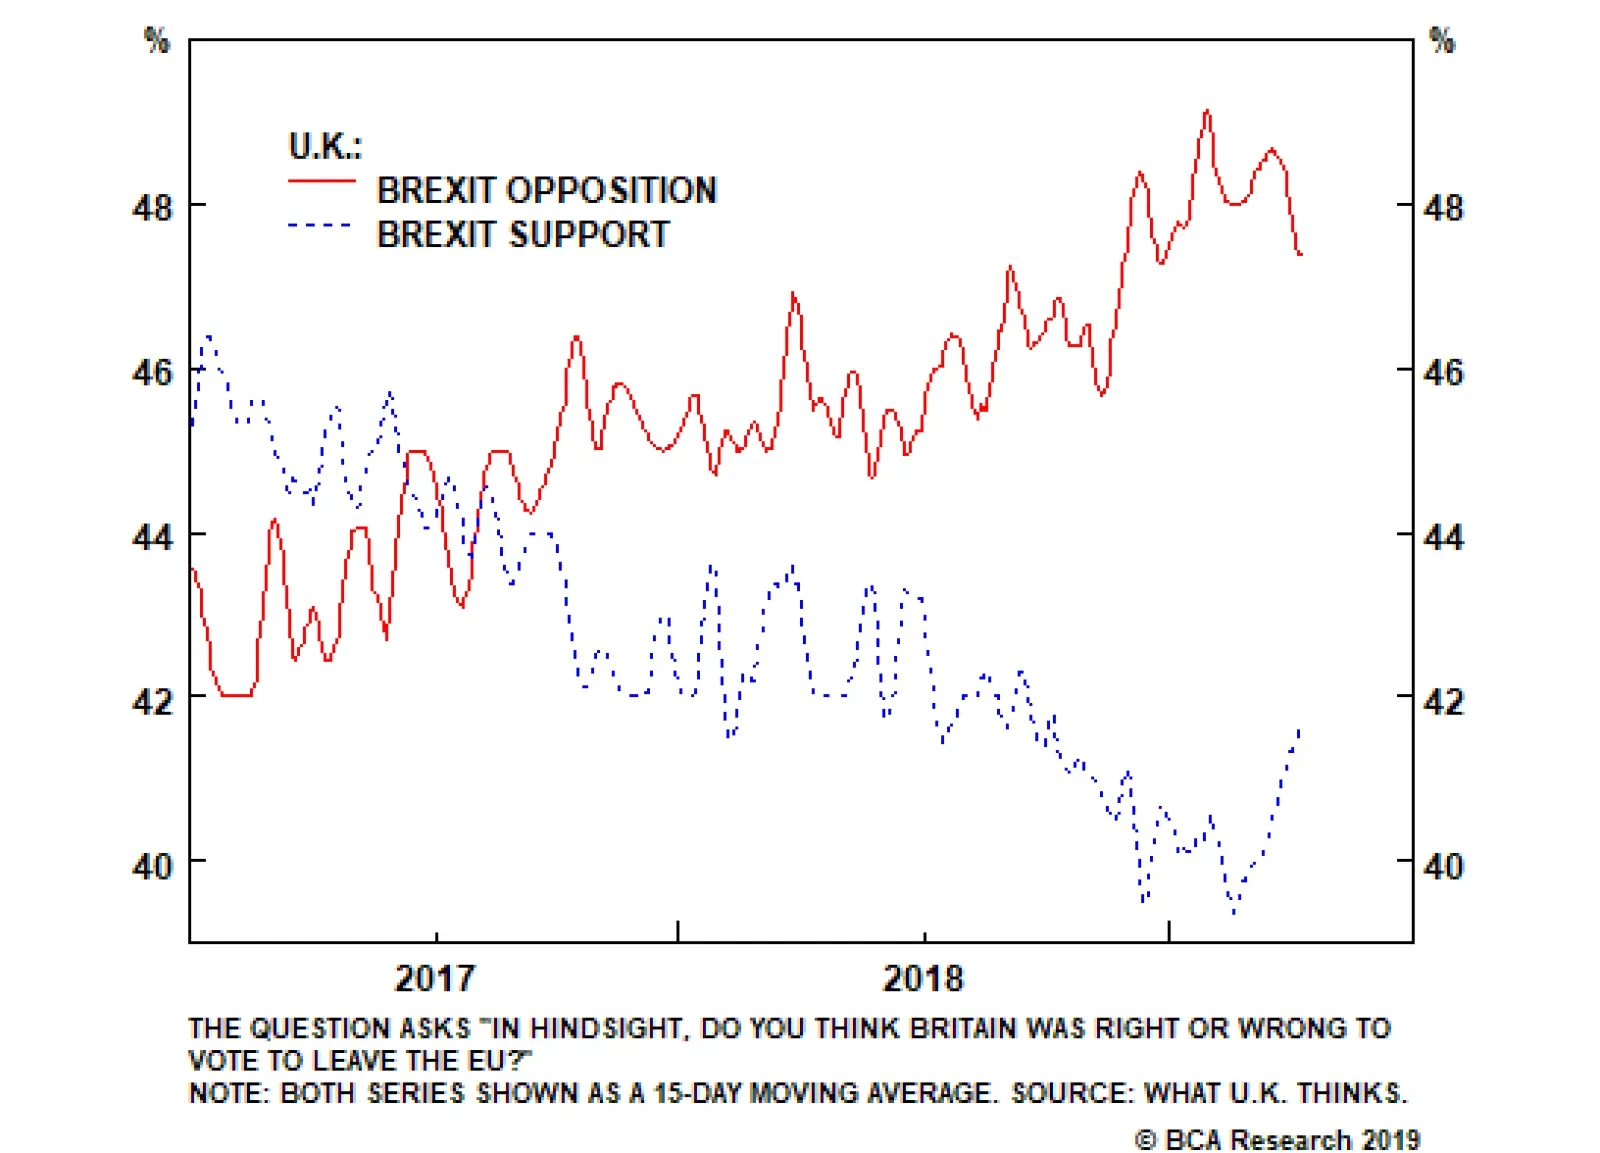
It is not yet a done deal, but the shift within the party in favor of accepting a “no deal” exit is clear. None of the remaining candidates is willing to forgo that option. The newest development advances us along our decision tree, altering the…
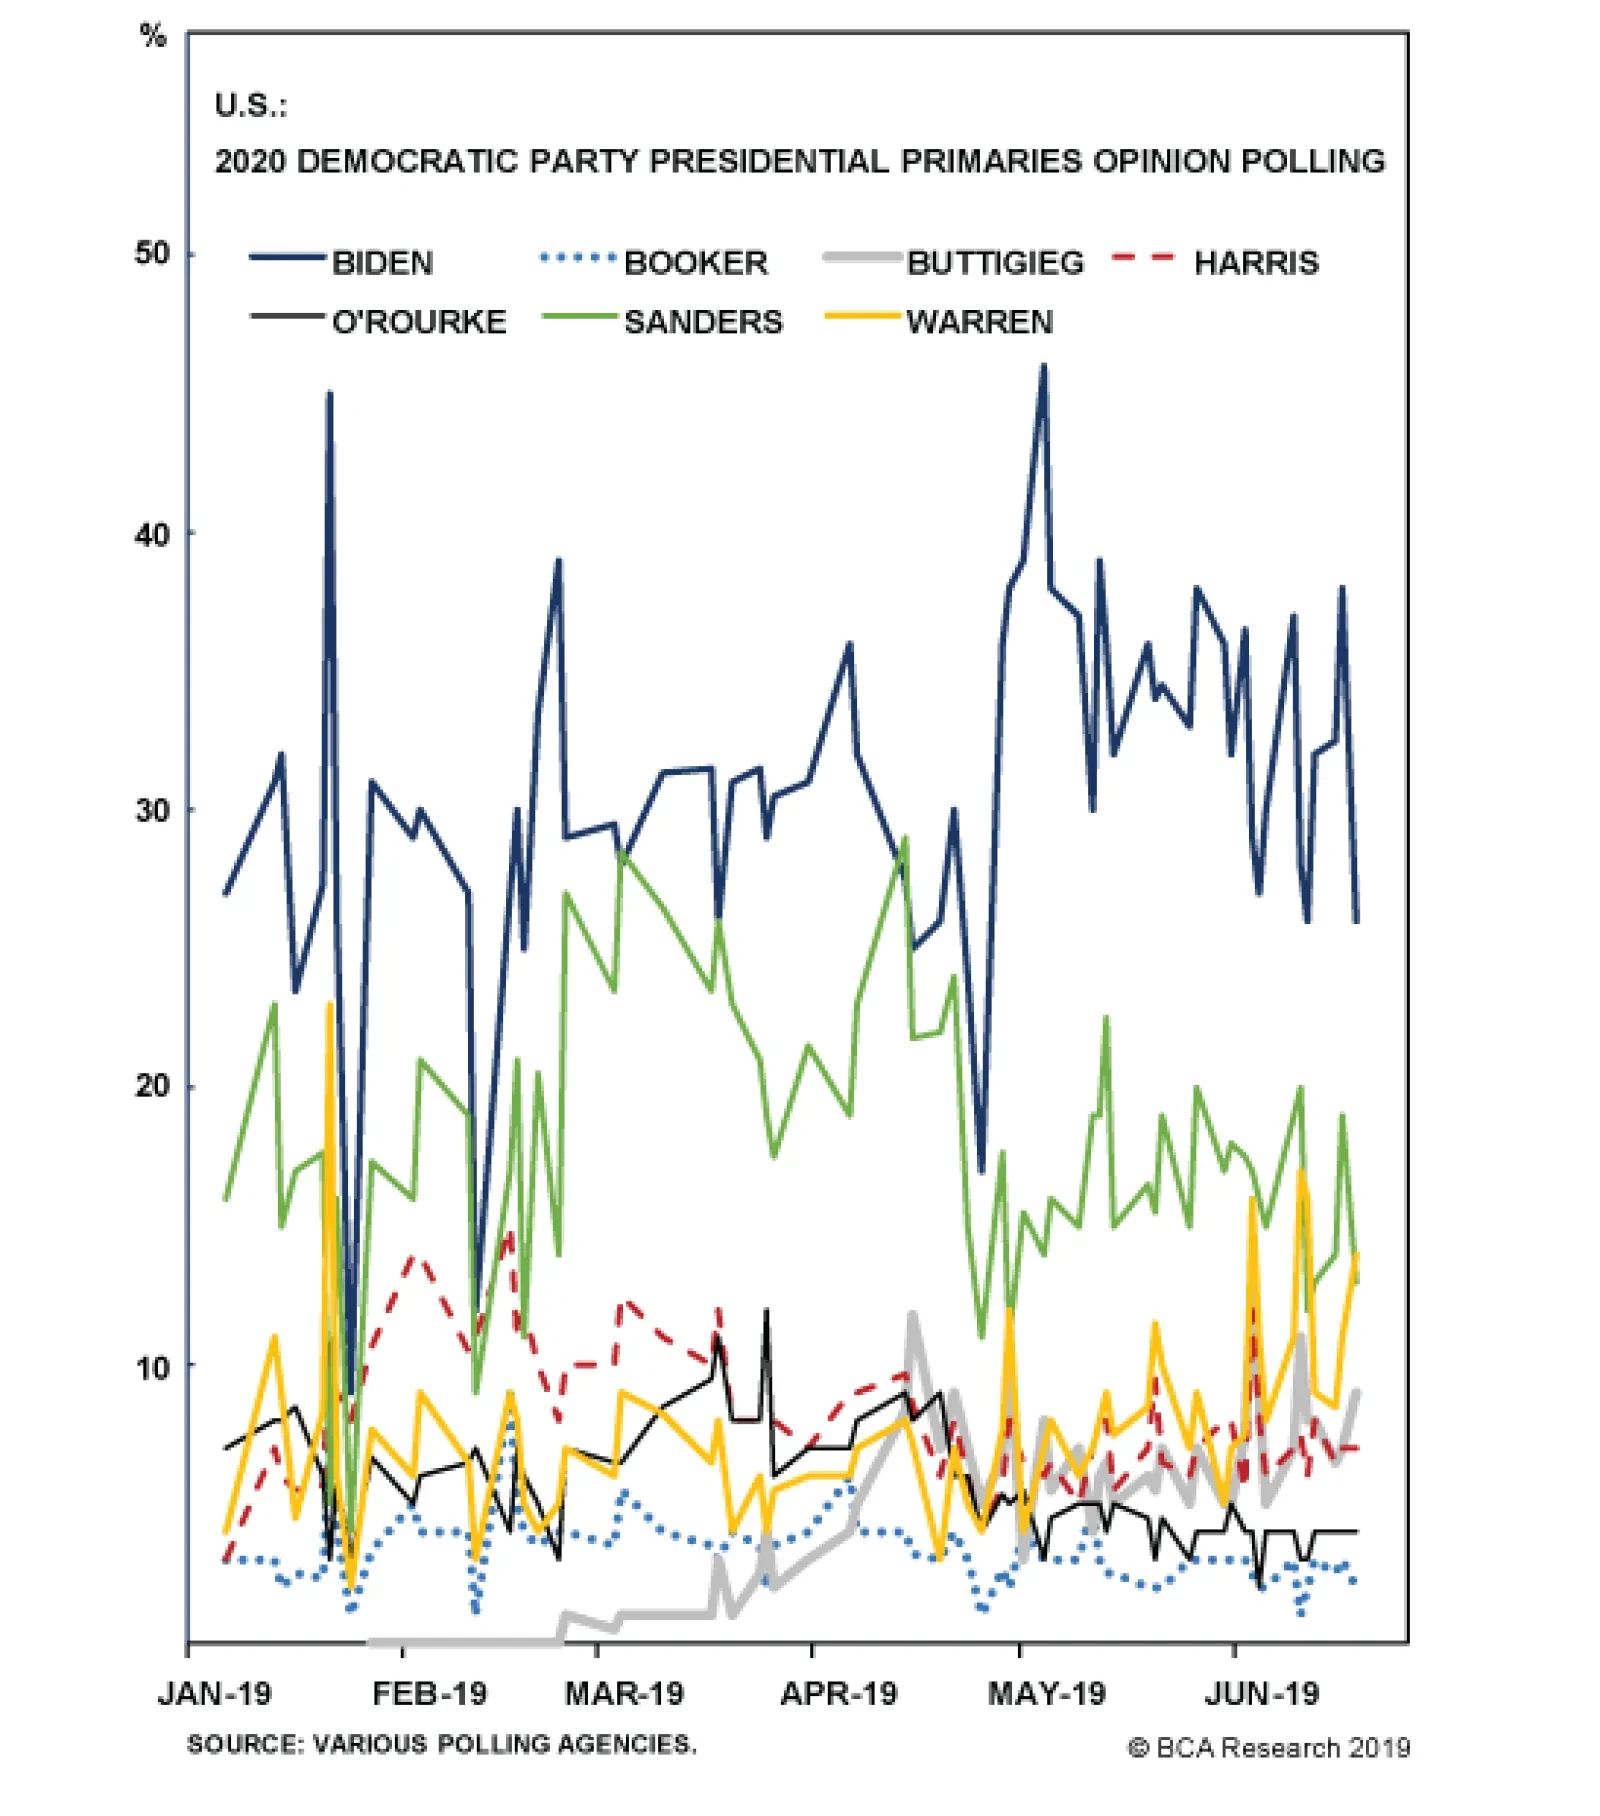
The uncertainty and negative impact on animal spirits will be modest if current trends persist through the debates. Former Vice President Joe Biden remains the frontrunner despite having naturally lost the bump to his polling support after announcing his…