Geopolitics

Dear Client, In addition to this week’s Global Investment Strategy report, I am sending you a Special Report on Japan written by Amr Hanafy, Research Associate of BCA’s Global Asset Allocation service. Best regards, Peter Berezin, Chief Global Strategist Highlights The trade war is likely to get worse before it gets better, implying some near-term downside risks to global equities and corporate credit. Nevertheless, both sides have a strong incentive to keep the conflict from spiraling out of control. Unlike in the earlier rounds, consumer goods represent the bulk of the imports subject to tariffs in the latest round. Many of these Chinese imports also do not have readily-available foreign or domestic alternatives. If U.S. retail prices start rising, voter attitudes – which are not that supportive of the trade war to begin with – will sour further, hurting President Trump’s re-election prospects. Investors should overweight global equities over a 12-month horizon. We intend to upgrade EM and European stocks. However, we are waiting for the trade war to simmer down and global growth to revive before we do so. Feature Tariffied Last week, we wrote that “Risk assets are likely to struggle over the next few weeks as investors grapple with both renewed trade war anxiety and the realization that the Fed’s “insurance cuts” may not be as generous as they had anticipated.”1 Stocks have been on a rollercoaster ride since then. S&P 500 futures were down almost 8% on Monday evening compared to last Thursday’s intraday highs before recovering much of their losses over the subsequent days (Chart 1).
Chart 1
Needless to say, the brewing trade war between China and the U.S. remains foremost in investors’ minds. In what has become a familiar pattern of events, China moved quickly to retaliate against President Trump’s decision to raise tariffs on the remaining $300 billion of Chinese imports. The Chinese government announced that state-owned enterprises would suspend purchases of U.S. agricultural goods. The People’s Bank of China also allowed the USD/CNY exchange rate to move above 7, long regarded as a key psychological level. This prompted the U.S. Treasury to officially label China a “currency manipulator.” In and of itself, the decision to label China a currency manipulator means little. The designation was applied to China based on the loose criteria for manipulation used in the 1988 Omnibus Trade And Competitiveness Act, rather than under the more stringent criteria that the U.S. Treasury has employed since 2015 (the latest Treasury report issued in May, using this more stringent criteria, did not find China guilty of currency manipulation). The Treasury statement self-servingly said that Secretary Mnuchin “will engage with the International Monetary Fund to eliminate the unfair competitive advantage created by China’s latest actions.” Given that the IMF indicated as late as three weeks ago that China’s “current account is broadly in line with fundamentals,” we doubt that much will come of this.2 Nevertheless, the designation further sours the atmosphere surrounding the trade talks, suggesting that the conflict will probably get worse before it gets better. Tough Luck, I Am Hitting Send The Chinese were apparently blindsided by President Trump’s decision to raise tariffs. According to media reports, Trump brushed off suggestions from his advisors during a tense Oval Office meeting last Thursday to notify the Chinese, as a courtesy, of the pending tariff announcement, choosing instead to send his tweet while everyone was still present in the room. (With Trump’s permission, Robert Lighthizer did try to place a phone call to Liu He, China’s Vice Premier and lead trade negotiator. The call went unanswered).3 Trump has reportedly become incensed that the Chinese, in his view, are stalling, secretly hoping that they will have a more conciliatory counterparty to deal with following next year’s presidential elections. From Trump’s perspective, a key goal of the tariffs is to make a strategy of running out the clock less appealing. Having successfully used the threat of tariffs to prompt Mexico to take stronger steps to curtail the flow of migrants to the U.S., Trump now feels emboldened to use strong-arm tactics to extract concessions from China. It’s a risky gambit. The Chinese will resist locking in any structural reforms that could weaken Beijing’s authority. The protests in Hong Kong have only added urgency for China’s leaders to look and act tough in the presence of what they describe as “foreign meddling.” All this means that a deal to prevent the latest tranche of tariffs from taking effect on September 1st is unlikely to be hatched. Mutually Assured Destruction? How bad could things get? The good news is that both sides have a strong incentive to keep the conflict from spiraling out of control. For the Chinese, it is not just a matter of losing access to the vast U.S. market. It’s also about losing access to vital technologies that China needs to further its ambitions in everything from robotics, to AI, to genomics. Chart 2Voters Are Not That Supportive Of Protectionism
Voters Are Not That Supportive Of Protectionism
Voters Are Not That Supportive Of Protectionism
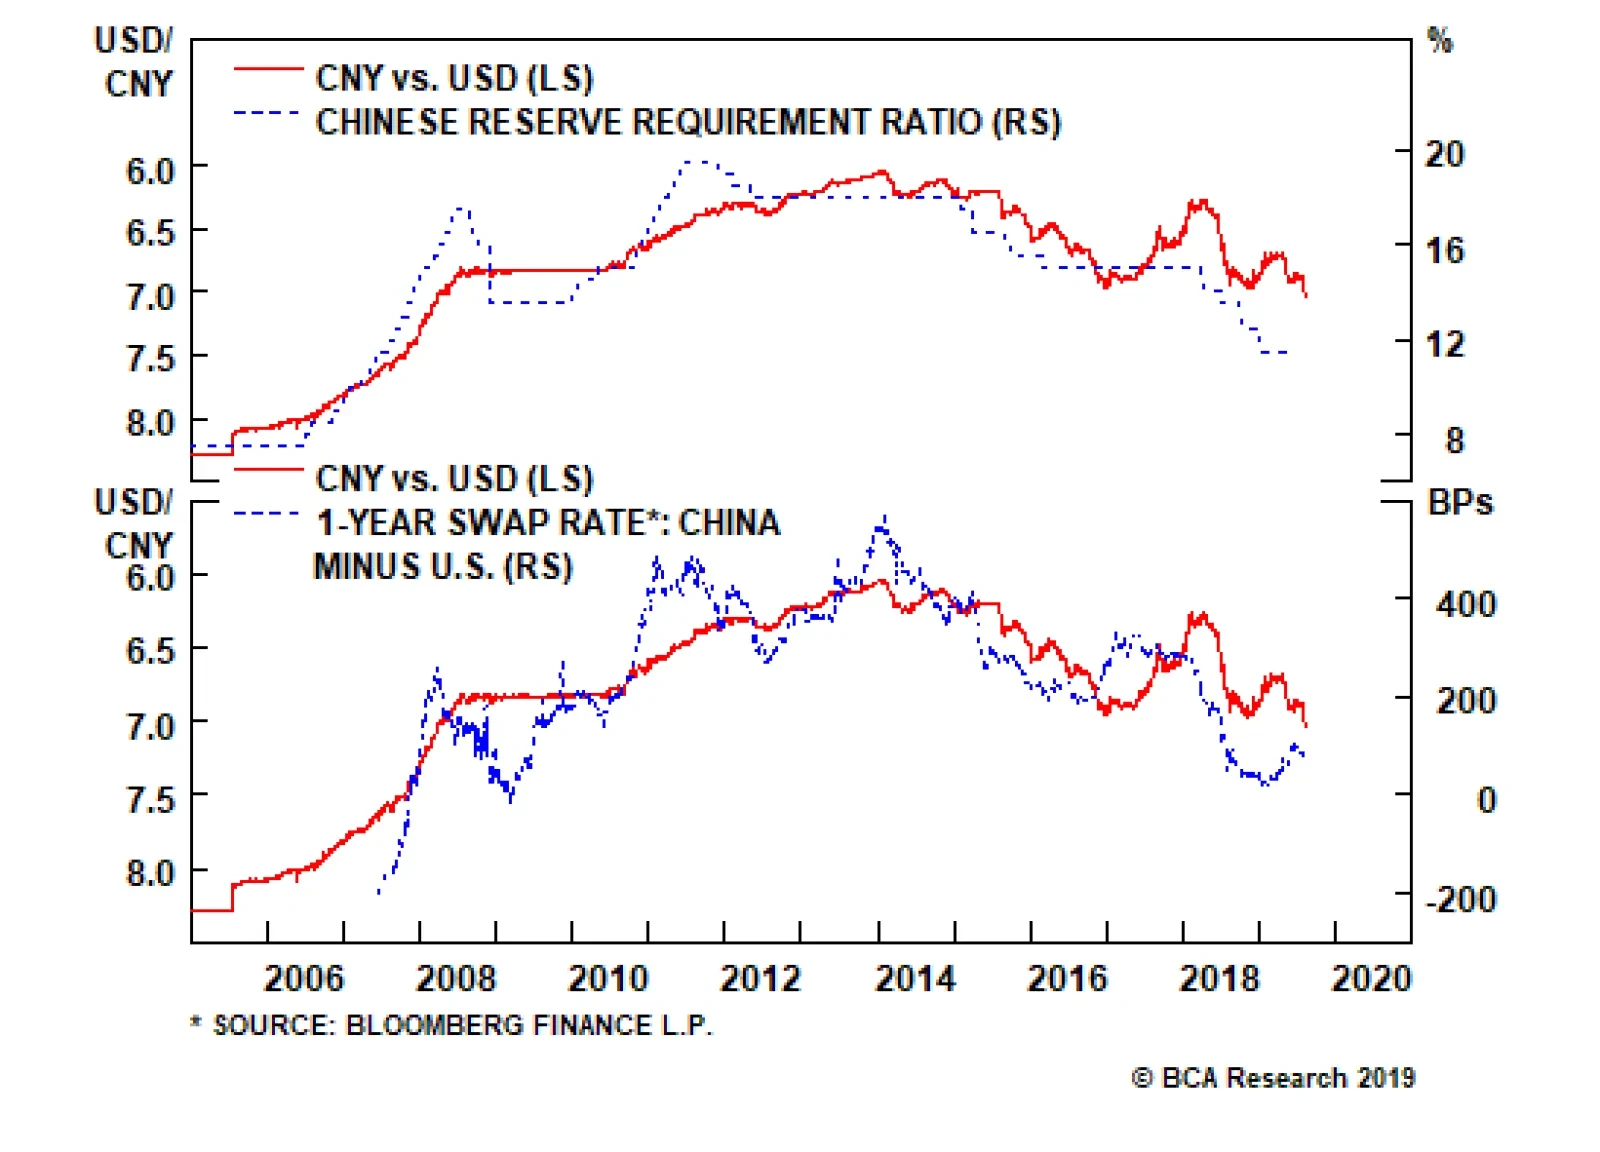
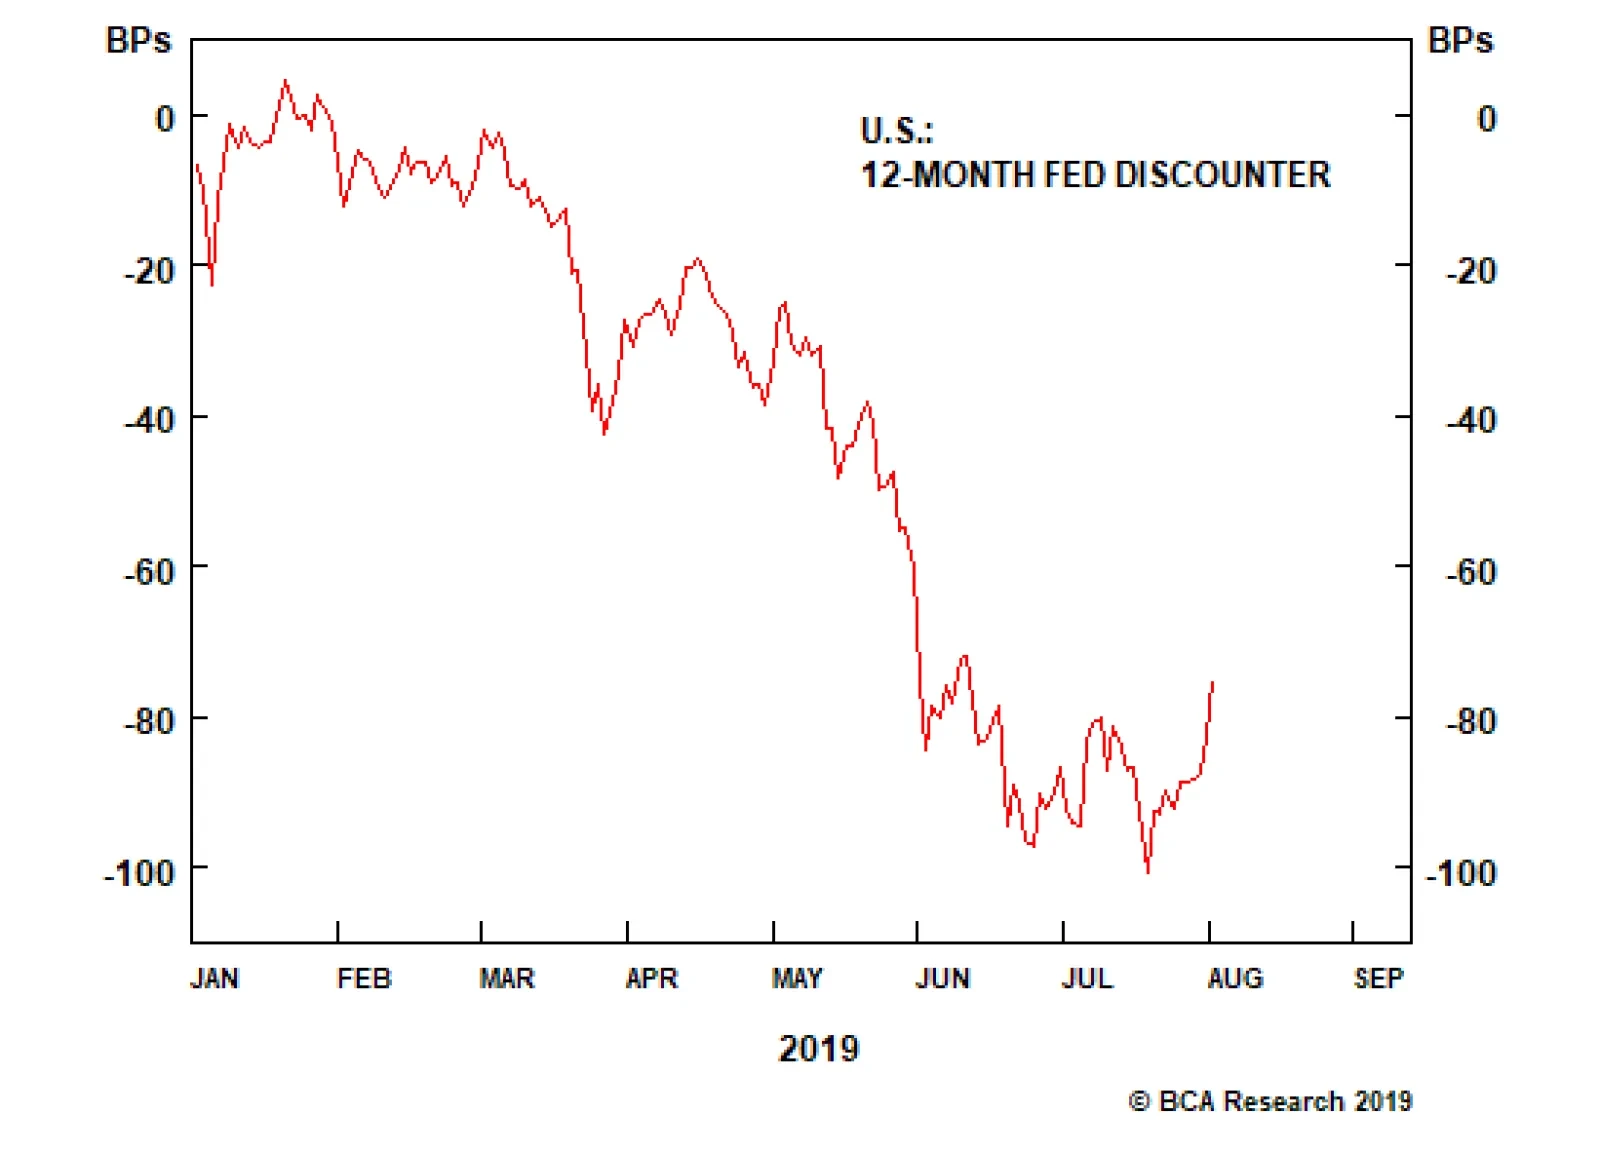
From Trump’s perspective, a severe trade war could hurt his re-election chances. Unlike late last year, the stock market’s recent plunge can be squarely attributed to the intensification of the trade war. If stocks keep falling, many voters with sagging 401(k) accounts will blame Trump. The initial rounds of U.S. tariffs focused on capital goods. In contrast, consumer goods represent the bulk of the imports subject to the latest tranche of duties. If retail prices start rising, voter attitudes – which are not that supportive of the trade war to begin with (Chart 2) – may sour further. It is also worth noting that Chinese goods account for a large fraction of overall imports in many of the categories subject to the latest round of tariffs. This will limit the ability of U.S. companies to source imports from other countries, thus putting further upward pressure on U.S. consumer prices. A Headwind, Not A Game Changer Neither the U.S. nor China would gain from a prolonged trade war. This does not mean that a “World War I” scenario, where all parties end up severely worse off from their actions, can be completely excluded. However, it does mean that powerful forces will probably kick in before the trade war gets out of hand. While global equities may struggle over the coming weeks as investors try to navigate every twist and turn in the trade war saga, they will be higher 12 months from now. In such a “moderate” trade war scenario, where tariffs rise but the global supply chain continues to function, the asset market consequences are likely to be smaller than many observers believe. There are two reasons for this: First, there is the issue of magnitude. In value-added terms, U.S. exports of goods to China account for 0.5% of U.S. GDP, while Chinese exports to the U.S. represent 2.7% of Chinese GDP. These are not infinitesimal numbers, but even in the latter case, they are not particularly large either. Second, both the U.S. and China have some ability to offset the impact of a moderate trade war with stimulus. In the case of the U.S., the stimulus would come mainly in the form of more accommodative monetary policy. Indeed, since Jay Powell’s “hawkish” press conference last week, the 2-year yield has fallen by 24 basis points, while the 10-year yield has dipped by 29 basis points, largely because the market has priced in more rate cuts (Chart 3). In China’s case, the stimulus will continue to consist of credit-driven investment spending, with some tax cuts for consumers thrown in for good measure. Yes, China can stimulate its economy by further weakening its currency. However, such a strategy risks backfiring. As we saw in 2015-16, when China lost almost $1 trillion in reserves, even a small devaluation can foster expectations of a bigger one, leading to large-scale capital outflows (Chart 4). The fact that dollar-denominated debt has risen among China corporates further reduces the incentive to allow the yuan to weaken significantly. As such, we do not expect the Chinese to weaponize the yuan as a tool in the trade war. Chart 3U.S. Yields Are Lower As Markets Are Pricing In More Rate Cuts
U.S. Yields Are Lower As Markets Are Pricing In More Rate Cuts
U.S. Yields Are Lower As Markets Are Pricing In More Rate Cuts
Chart 4China: A Devaluation Could Exacerbate Capital Outflows
China: A Devaluation Could Exacerbate Capital Outflows
China: A Devaluation Could Exacerbate Capital Outflows
Investment Conclusions As we discussed last week, the global manufacturing cycle tends to follow regular three-year periods – 18 months up, 18 months down (Chart 5). Given that the last downleg began in early 2018, we are due for another upturn in growth. The recent trade turbulence could delay the recovery for a bit, but ultimately, the manufacturing cycle will turn for the better. Central banks tend to be backward-looking. The weakness in both economic growth and inflation has prompted them to ease monetary policy. Just this week, central banks in Thailand, India, and New Zealand cut rates. The RBNZ shaved rates by 50 basis points, double what analysts were expecting. This brings to 16 the number of central banks which have lowered interest rates so far this year. Monetary policy affects the economy with a lag. Global growth is likely to start picking up just as the monetary stimulus is making its way through the system. Stocks will thrive in this environment. Thus, while global equities may struggle over the coming weeks as investors try to navigate every twist and turn in the trade war saga, they will be higher 12 months from now. As global growth recovers, bond yields will rise. Investors should favor stocks over bonds. We do not have a strong view on regional equity allocation for now, but intend to upgrade EM and European stocks once the trade war simmers down and leading indicators for global growth start to march higher. Chart 5The Global Manufacturing Cycle Has Likely Reached A Bottom
The Global Manufacturing Cycle Has Likely Reached A Bottom
The Global Manufacturing Cycle Has Likely Reached A Bottom
Peter Berezin, Chief Global Strategist Global Investment Strategy peterb@bcaresearch.com Footnotes 1 Please see Global Investment Strategy Weekly Report, “A One-Two Punch,” dated August 2, 2019. 2 Please see Gita Gopinath, “Rebalancing the Global Economy: Some Progress but Challenges Ahead,” IMF Blogs, July 17, 2019; and “2019 External Sector Report: The Dynamics of External Adjustment,” IMF External Sector Reports, July 2019. 3 Vivian Salama and Josh Zumbrun, “Trump Ordered New Chinese Tariffs Over Objections of Advisers,” The Wall Street Journal, August 7, 2019. Strategy & Market Trends MacroQuant Model And Current Subjective Scores
Chart 6
Tactical Trades Strategic Recommendations Closed Trades
The MSCI Hong Kong index has also significantly underperformed the global benchmark since late-July, in response to intensifying protests in the city. The protests have been driven by underlying socio-economic factors as well as Beijing’s encroachment on…
Just as it appeared the slowdown in global industrial activity had run its course, commodity markets face another test of demand resiliency brought on by exogenous political shocks (Chart Of The Week). As luck would have it, these shocks – arriving in the form of an unexpected escalation of Sino-U.S. trade tensions – came on the heels of reports of further weakness in global manufacturing activity, a less-dovish-than-expected Fed, and a breach of the 7.0 level of the RMB/USD cross. The fallout – a global risk-off event – raises the spectre of a deeper trade war damaging EM GDP growth, which would weaken commodity demand. We continue to expect global fiscal and monetary stimulus to revive commodity demand, albeit further out the curve – i.e., later this year, as opposed to earlier in 2H19. Given the trade-war escalation, we are recommending a tactical long position in spot silver to hedge portfolio risk. The metal has been tracking gold’s ups and downs post-GFC – more so than industrial demand for silver – indicating it may have some catching up to do. This will make us strategically long gold, and tactically long silver at tonight’s close. Chart Of The WeekRenewed Trade Tensions Threaten Industrial Commodities' Recovery
Renewed Trade Tensions Threaten Industrial Commodities' Recovery
Renewed Trade Tensions Threaten Industrial Commodities' Recovery
Highlights Energy: Overweight. U.S. President Trump informed Congress earlier this week he was imposing a total economic embargo on Venezuela, which freezes assets of the Maduro government and all business dealings with its representatives except for humanitarian aid. Venezuela’s oil production averaged ~ 750k b/d in 2Q19, and was supported by the assistance of Russian technicians, U.S.-based Chevron Corp., and four service companies that were granted 90-day waivers by the U.S. to continue to do business in the country.1 Our long Sept19 Brent vs. short Sept20 Brent position expired with a gain of 101.7%. We remain long 4Q19 Brent vs. short 4Q20 Brent. Base Metals: Neutral. Industrial metals, iron ore and steel came under renewed selling pressure this week, in the wake of heightened trade tensions between the U.S. and China. Precious Metals: Neutral. Safe-haven demand rallied gold 3% over the week ended Tuesday, following the escalation in Sino-U.S. trade tensions. We continue to favor gold as a strategic portfolio hedge, particularly if central banks are compelled to accelerate monetary accommodation as global trade tensions rise, and are adding a tactical long silver position to our recommendations. Ags/Softs: Underweight. China’s Commerce Ministry reported U.S. ag products no longer are being purchased by Chinese companies earlier this week.2 U.S. President Trump’s decision to impose tariffs on Chinese imports to the U.S. were occasioned by his claim China was not living up to an agreement to increase agricultural purchases. This broke the truce in the Sino-U.S. trade war that accompanied the resumption in negotiations last month. Feature A recovery in industrial-commodity demand – particularly for oil and base metals – could be stretched out longer than we expected just a week ago. It’s still too early to tell whether the escalation in Sino-U.S. trade tensions will throw a spanner into the revival of commodity demand we’ve been expecting, but it does give us pause. Prior to the political shocks and other disappointments hitting markets this past week, our commodity demand gauges were indicating the slowdown in demand had – or was close to – run its course, and that EM demand, in particular, was set to revive. EM GDP growth drives commodity demand growth globally, which is why it is so important in our analysis. Our Chart of the Week illustrates this point, showing three relationships we've developed that allow us to track the evolution of EM GDP growth in something close to real time: BCA’s Global Industrial Activity (GIA) index, which is highly sensitive to economic activity in EM generally and China in particular;3 BCA’s Global Commodity Factor (GCF), which condenses the information contained in 28 commodity price series to a common factor using principal components analysis; and BCA’s EM Import Volume model, which generates an expectation of EM import volumes using mainly FX values for countries highly exposed to global trade. To be precise, we find the output of these three models shown in the Chart of the Week and EM GDP growth are deeply entwined.4 As can be seen in the chart, these models appeared to have bottomed and were preparing to hook up. This is supported by current global activity indicators (CAIs), particularly for China and EM, which still is showing positive y/y growth, even if its rate is slowing. (Chart 2), and the recent upturn in EM Financial Conditions we track here at BCA Research (Chart 3). Chart 2Global CAIs Support EM Growth Expectation
Global CAIs Support EM Growth Expectation
Global CAIs Support EM Growth Expectation
Chart 3EM Financial Conditions Move To Easier Setting
EM Financial Conditions Move To Easier Setting
EM Financial Conditions Move To Easier Setting
However, the escalation of Sino-U.S. trade tensions, coming off a somewhat disappointing Fed rate cut of 25bps and weak manufacturing data, was enough to erase 6% and 3% from the GSCI and Bloomberg commodity indices over the week ended Tuesday (Chart 4), and to lift volatility in industrial commodities’ prices sharply (Chart 5).5 Chart 4Policy Shock, Disappointing Rate Cut Hammer Commodity Indices
Policy Shock, Disappointing Rate Cut Hammer Commodity Indices
Policy Shock, Disappointing Rate Cut Hammer Commodity Indices
Chart 5Crude Oil, Copper Vol Jump On Policy Shock
Crude Oil, Copper Vol Jump On Policy Shock
Crude Oil, Copper Vol Jump On Policy Shock
A Fraught Situation The Sino-U.S. trade standoff is fraught with risk for both sides. A full-blown trade war could devolve into domestic recessions (there is a non-trivial risk to the global economy, as well). In addition, a kinetic military confrontation between China and its allies and the U.S. and its allies cannot be ruled out, as tensions rise. The case for resolving the trade dispute is strong. Our colleague Peter Berezin notes that while an escalation in the Sino-U.S. trade war “would tip the scales towards recession, the risk of such an outcome remains low.”6 An all-out trade war could push the U.S. economy into a recession next year, just as President Trump faced re-election, which strongly suggests a goodwill gesture or two from the U.S. – e.g., the Commerce Department renewing the licenses allowing U.S. firms to deal with Huawei – could go a long way to getting trade talks back on track. Our commodity demand gauges were indicating the slowdown in demand had – or was close to – run its course, and that EM demand, in particular, was set to revive. That said, we cannot gainsay the conclusions of our colleague Matt Gertken, who runs our Geopolitical Strategy: “The U.S.-China trade negotiations are falling apart at the moment. … (B)ut with the latest round of tariffs we think it is more likely that we will get a major escalation of strategic tensions and even saber-rattling,” as U.S. and Chinese positions harden, particularly around North Korea, Hong Kong and Taiwan.7 Clearly, the outcome of this latest round of the Sino-U.S. dispute is uncertain, and the risks are elevated. Moving To A Safe Haven: Silver While we continue to expect global fiscal and monetary stimulus will revive commodity demand, the shocks and disappointments visited upon markets could incline firms, households and investors globally to scale back on risky investments and purchases until the dust settles.8 Over the near term – i.e., 3 months or so – seeking refuge in a safe haven is sensible. In particular, we believe silver offers near-term cover, and expect it will continue to follow the evolution of gold prices.9 We expect central banks generally – the Fed in particular – will err on the side of maintaining monetary accommodation while uncertainty over trade and global growth prospects remains elevated. Fed Chairman Jay Powell's description of the central bank's July rate cut of 25 bps as a mid-cycle adjustment – and not the beginning of a lengthy cutting cycle – was perceived as a hawkish surprise, but markets appear to be pricing in additional cuts this year, which will support precious metals until further guidance from the Fed arrives. An escalation of the trade war likely would increase the probability the Fed cuts rates further at its next meeting, which would push down recession fears. The outcome of this latest round of the Sino-U.S. dispute is uncertain, and the risks are elevated. On the supply side, silver typically is mined as a secondary metal, and usually is found with gold, copper and lead deposits, according to the Silver Institute.10 On the demand side, investment and electronics account for much of the usage. Prior to the Global Financial Crisis (GFC), silver traded like a base metal, owing to the high growth rates in EM economies undergoing rapid industrialization, which led to higher consumption. This resulted in a large supply-deficit in most industrial commodities, including silver (Chart 6). Following the GFC, the evolution of silver’s price more closely tracked gold prices, following the massive injections of money and credit by central banks globally. (Chart 7).11 Chart 6Silver Is Less Industrial, More Precious Now
Silver Is Less Industrial, More Precious Now
Silver Is Less Industrial, More Precious Now
Chart 7Post-GFC, Silver and Gold Are More Closely Aligned
Post-GFC, Silver and Gold Are More Closely Aligned
Post-GFC, Silver and Gold Are More Closely Aligned
We expect this to continue, given our view central banks are likely to either increase or accelerate monetary accommodation to offset Sino-U.S. trade tensions, should they worsen. The U.S. dollar outlook remains important for precious metals. The dollar is a counter-cyclical currency. Thus, the escalation in trade tensions risks delaying the rebound we expect in emerging markets. This could support the USD for longer than we expected. Bottom Line: We expect commodity demand to revive on the back of global fiscal and monetary stimulus. However, exogenous political shocks along the way toward that revival likely will force households, firms and investors to re-think spending and investment decisions. This could potentially lead to reduced aggregate demand, in the event uncertainty around manufacturing, which still accounts for significant employment and output in EM economies, and global trade becomes too high. Until this is sorted, taking refuge in a safe haven is prudent. To hedge against this, we are recommending spot silver as a tactical portfolio hedge. We already are long gold as a strategic portfolio hedge, and this position is up 20% this year. Robert P. Ryan, Chief Commodity & Energy Strategist rryan@bcaresearch.com Hugo Bélanger, Senior Analyst Commodity & Energy Strategy HugoB@bcaresearch.com 1 Please see U.S. sanctions waiver for Chevron signals Venezuela solution near: opposition ambassador, published by S&P Global Platts July 30, 2019. 2 Please see U.S. farmers suffer 'body blow' as China slams door on farm purchases published by reuters.com August 5, 2019. 3 Please see Expanded Sino – U.S. Trade War Could Be Bullish For Base Metals, published by BCA Research’s Commodity & Energy Strategy May 9, 2019, for a discussion of the GIA index. The index is a weighted average of selected trade, currency, manufacturing PMIs, and Chinese industrial sector variables. The article is available at ces.bcaresearch.com. 4 This is to say there is strong two-way Granger causality between EM GDP and the output of the models shown above in the Chart of the Week. Knowing the output of one of the models allows one to forecast EM GDP growth, and vice versa. We will be doing further research into using these models to estimate the change in EM GDP at a higher frequency than the stand-alone EM GDP data are reported – e.g., the World Bank’s most recent actual EM GDP data in constant 2010 USD is reported up to 1Q18, while the models shown in the chart can be updated daily (GCF and the EM Import Volume models); and monthly, as the components of the GIA index become available. 5 For a discussion of global fixed-income markets’ response to the escalation of the Sino-U.S. trade war and the outlook for more aggressive monetary policy accommodation globally, please see Trade War Worries: Once More, With Feeling, published by BCA Research’s Global Fixed Income Strategy August 6, 2019. It is available at gfis.bcaresearch.com. 6 Please see A One-Two Punch, published by BCA Research’s Global Investment Strategy August 2, 2019. It is available at gis.bcaresearch.com. 7 Please see Tariffs ... And The Last Prime Minister Of The United Kingdom?, published by BCA Research’s Geopolitical Strategy, August 2, 2019. It is available at gps.bcaresearch.com. Almost on cue, China warned the U.S. it would view its deployment of intermediate-range missiles in Asia following Russia’s revival of its intermediate-range missile development as “offensive in nature.” Please see China warns US against deploying missiles on its ‘doorstep’, published by the Financial Times August 6, 2019. 8 Our global macro expectation can be found in Oil Markets Await Lift From Global Stimulus, published by BCA Research’s Commodity & Energy Strategy August 1, 2019. It is available at ces.bcaresearch.com. 9 Please see "The Gold Trifecta," published June 27, 2019, by BCA Research's Commodity & Energy Strategy, for our most recent analysis of the gold market and of our long-held bullish gold view. It is available at ces.bcaresearch.com. 10 The Institute’s supply-demand annual supply-demand balances showed a 29.2mm-ounce deficit in 2018. 11 When we model silver returns as a function of gold and base metals’ returns, silver’s elasticity to gold prices more than doubles – from 0.68 over the 1999 - 2010 period, to 1.67 post-GFC (2010 to now). The elasticity to changes in base-metals prices was roughly cut in half over this period, to 0.28 post-GFC. Investment Views and Themes Recommendations Strategic Recommendations Tactical Trades TRADE RECOMMENDATION PERFORMANCE IN 2019 Q2
Image
Commodity Prices and Plays Reference Table Trades Closed in 2019 Summary of Closed Trades
Image
The move is not unprecedented - the U.S. accused China of currency manipulation from 1992-94 - but our Geopolitical Team argues that the U.S. and China have experienced a structural break in relations that is the fundamental driver of the tit-for-tat trade…
First, the Federal Reserve dashed investors’ hopes for an extended easing cycle. While the Fed did cut rates by 25 basis points and pledged to end its balance sheet runoff in August (two months earlier than previously indicated), Jay Powell’s characterization…
Politicians have to pay attention to the opinion polls as well as the referendum result, since opinion polls impact the next election. These show a plurality in favor of remaining in the EU and a strong trend against Brexit since 2017. While the evidence does…
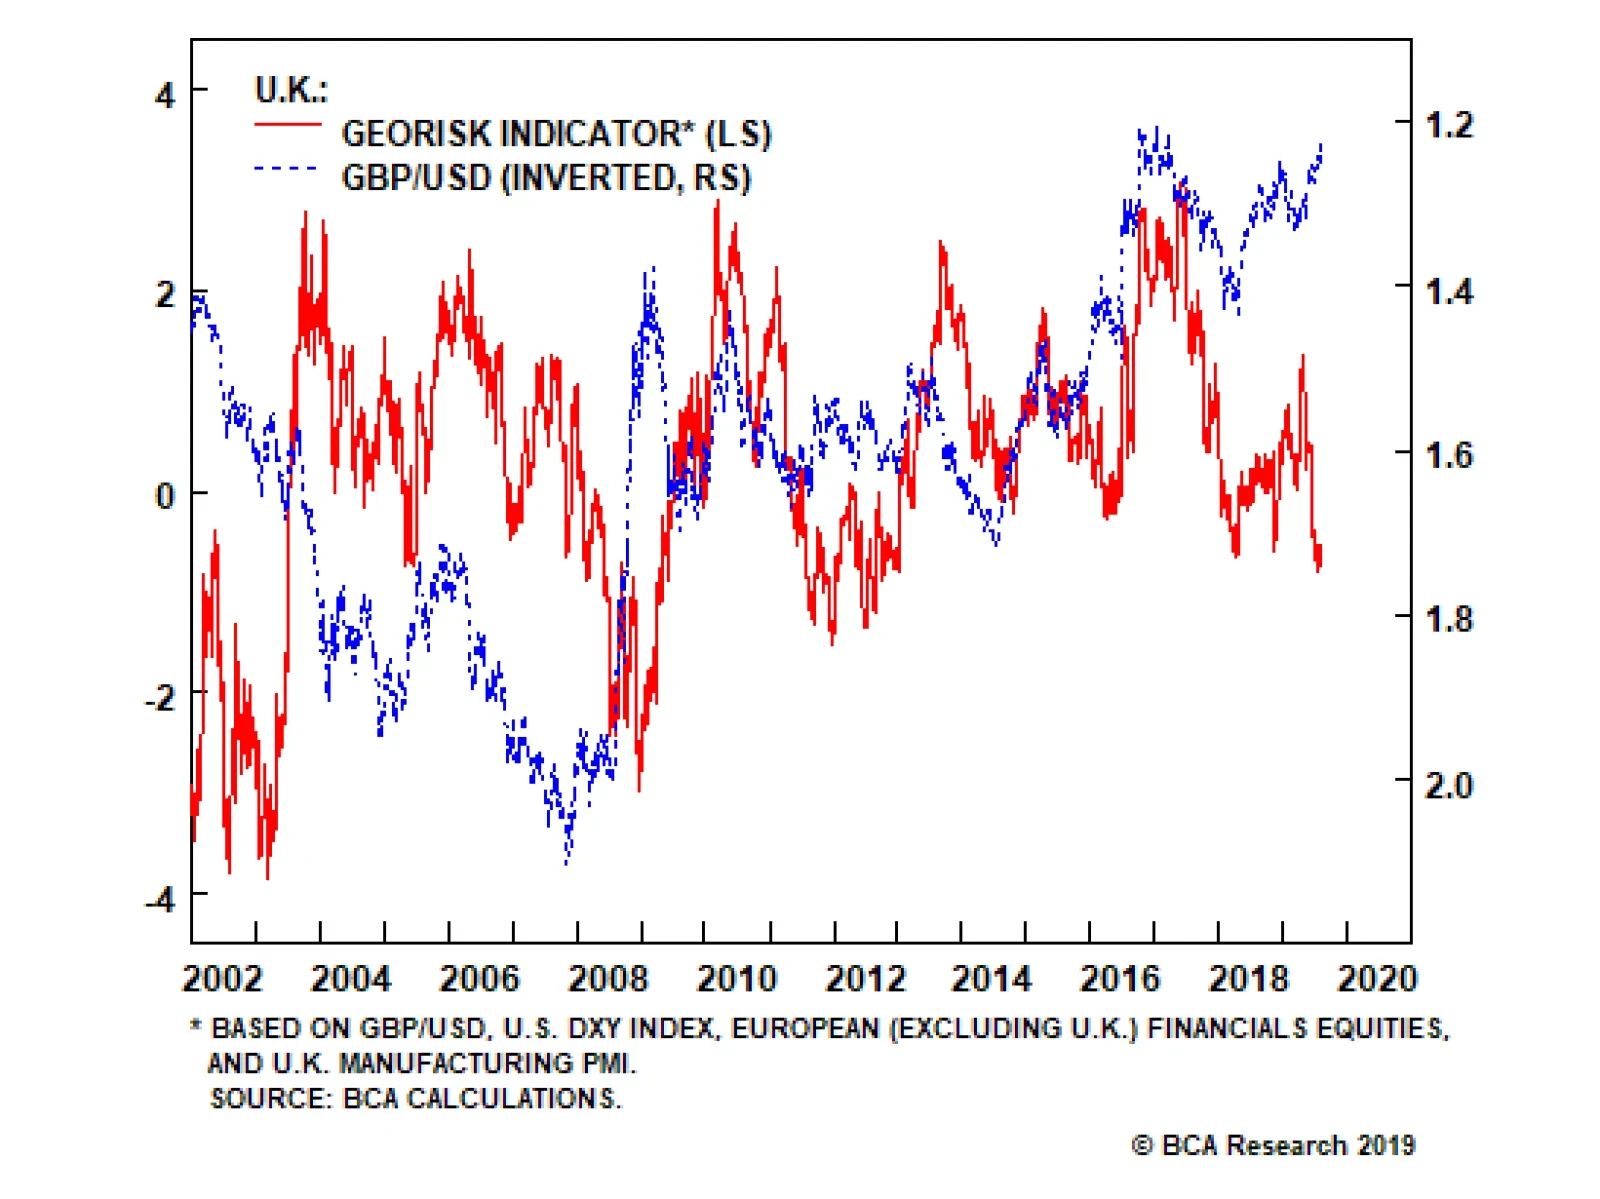
All of Boris Johnson's moves, since he took over, were anticipated – hence the decline in our Geopolitical Strategy Service's GeoRisk indicator – but the pound sterling is falling now that the confrontation is truly getting under way. Parliament is adjourned…
President Donald Trump was unhappy with the Federal Reserve’s somewhat hawkish interest rate cut on July 31. Chairman Jerome Powell emphasized that the cut should not be seen as the launch of a “lengthy rate cutting cycle” but rather as a “mid-cycle…
Highlights So What? Prime Minister Boris Johnson’s threat to take the U.K. out of the EU without a withdrawal deal in place is a substantial 21% risk. Why? The odds of a no-deal exit could range from today’s 21% to around 30%, depending on whether Johnson manages to obtain some concessions from the EU in forthcoming negotiations. It is far too early to go bottom-feeding for the pound sterling, as Brexit risks are asymmetrical. We maintain our tactically cautious positioning, despite some cyclical improvements, due to elevated geopolitical risks in the United States, East Asia, and the Middle East. Feature Thank you Mr. Speaker, and of course I should welcome the prime minister to his place … the last prime minister of the United Kingdom. – Ian Blackford, head of the Scottish National Party in Westminster, July 25, 2019 Chart 1No-Deal Brexit Would Come At A Very Bad Time
No-Deal Brexit Would Come At A Very Bad Time
No-Deal Brexit Would Come At A Very Bad Time
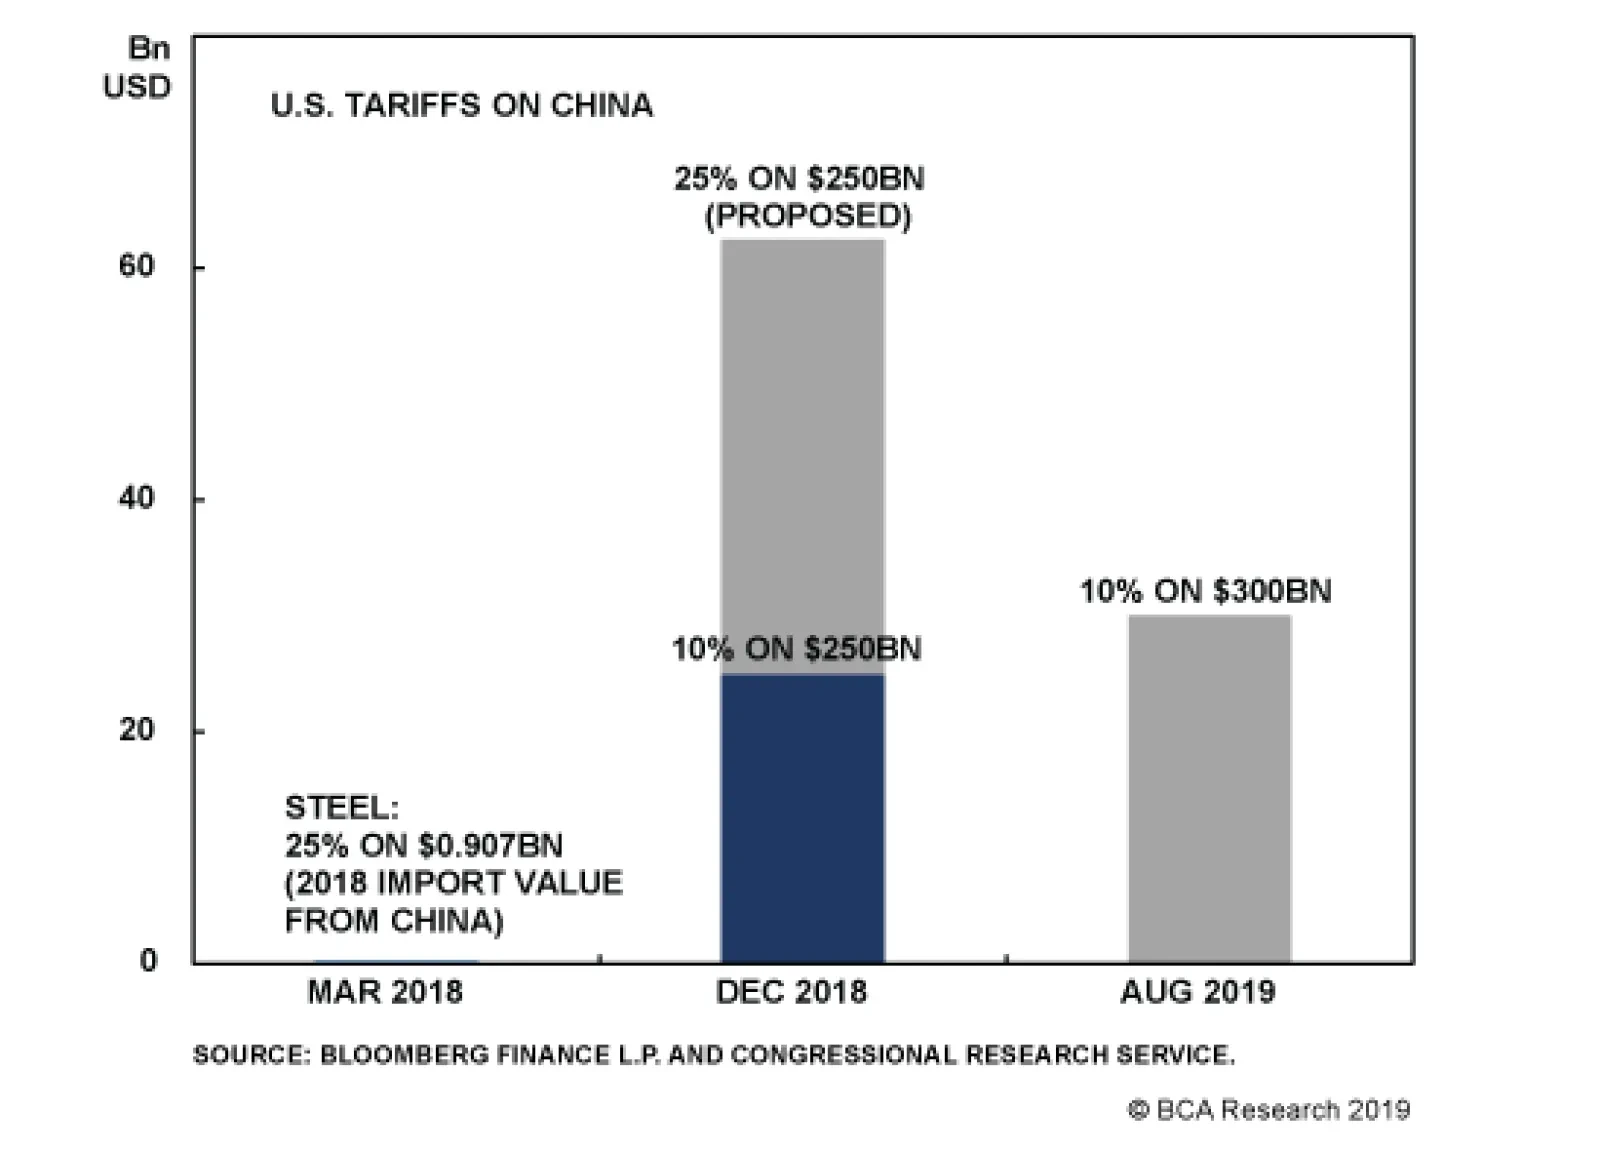
The Federal Reserve cut interest rates for the first time since the global financial crisis in 2008 on July 31. The Fed suggested that the door is open for future cuts, though Chairman Jerome Powell signaled that the cut should not be seen as the launch of a “lengthy rate cutting cycle” but rather as a “mid-cycle adjustment” comparable to cuts in 1995 and 1998. President Donald Trump responded by declaring a new 10% tariff on $300 billion worth of imports from China! He resumed criticizing Powell for insufficient dovishness – and Trump could in fact fire Powell, though the decision would be contested at the Supreme Court. The Fed’s move shows that Trump’s direct handle on interest rates comes from his ability to control trade policy and hence affect the “the external sector.” The trade war with China has exacerbated a global manufacturing slowdown that is keeping global growth and U.S. inflation weak enough to justify additional rate cuts with each future deterioration (Chart 1). Improvements in global monetary and fiscal policy suggest that the U.S. and global economic expansion will be extended to 2021 or beyond, which is positive for equities relative to government bonds or cash, but we remain defensively positioned in the near-term due to a range of geopolitical risks, highlighted by the new tariffs. The unconvincing U.S.-China tariff ceasefire agreed at the Osaka G20 has fallen apart as we expected; the period of “fire and fury” between the U.S. and Iran continues; and the U.S. is entering what we expect to be a period of socio-political instability in the lead up to the momentous 2020 presidential election. Moreover the risk of a “no deal” Brexit, in which the U.K. exits the European Union and reverts to basic World Trade Organization tariff levels, is rising and will create acute uncertainty over the next three months despite the world’s easy monetary policy settings (Charts 2A & 2B). In June we upgraded our odds of a no-deal Brexit to 21%, up from 7% this spring. While not our base case, the probability is too high for comfort and the critical timing for the rest of Europe warns against taking on additional risk. The risk of a “no deal” Brexit ... is rising and will create acute uncertainty. Chart 2AUncertainty And Sentiment Getting Worse ...
Uncertainty And Sentiment Getting Worse ...
Uncertainty And Sentiment Getting Worse ...
Chart 2B... Despite Easy Monetary Policy
... Despite Easy Monetary Policy
... Despite Easy Monetary Policy
BoJo’s Gambit Boris Johnson – aka “BoJo” – former mayor of London and foreign secretary, cemented his position as the U.K.’s 77th prime minister on July 24. He immediately launched a gambit to renegotiate the U.K.’s withdrawal. He is threatening not to pay the “divorce bill” (the U.K.’s outstanding budget contributions for the 2014-20 budget period and other liabilities in subsequent decades) of 39 billion pounds. He insists that the Irish backstop (which would keep Northern Ireland or the U.K. in the EU customs union to prevent a hard border between the two Irelands) must be abandoned. He has stacked his cabinet with pro-Brexit hardliners who share his “do or die” stance that Brexit must occur on October 31 regardless of whether an agreement for an orderly exit is in place. These developments were anticipated – hence the decline in our GeoRisk indicator – but the pound sterling is falling now that the confrontation is truly getting under way (Chart 3). Parliament is adjourned in August, so Johnson’s hardline negotiating tactics will get full play in the media cycle until early September, when the real showdown begins. Crunch time will likely run up to the eleventh hour, with Halloween marking an ominous deadline. There is plenty of room for the pound to fall further throughout this period, according to our European Investment Strategy’s handy measure (Chart 4), because the success of Boris’s gambit depends entirely upon creating a credible threat of crashing out of the EU in order to wring concessions that could conceivably pass through the British parliament. Chart 3Our Market-Based Indicator Suggests Still Some Complacency On Brexit Risks
Our Market-Based Indicator Suggests Still Some Complacency On Brexit Risks
Our Market-Based Indicator Suggests Still Some Complacency On Brexit Risks
Chart 4GBP-EUR Still Has Room To Fall Under BoJo's Gambit
GBP-EUR Still Has Room To Fall Under BoJo's Gambit
GBP-EUR Still Has Room To Fall Under BoJo's Gambit
Geopolitically, the United Kingdom is not prohibited from exiting the EU without a deal. Though the empire is a thing of the past, the U.K. remains a major world power. It has Europe’s second-largest economy, nuclear weapons, a blue-water navy, a leading voice in global political institutions, and is a close ally of the United States. It mints its own coin. It is a sovereign entity that can survive on its own just as Japan can survive on its own. This geopolitical foundation always supported our view that there was a 50% chance of the referendum passing in 2016, and today it supports the view that fears over a no-deal Brexit are not misplaced. Investors should therefore not confuse Johnson’s bluster with that of Alexis Tsipras in 2015. A British government dead-set on delivering this outcome – given the popular mandate from the 2016 referendum and the government’s constitutional handling of foreign affairs as opposed to parliament – can probably achieve it. However, the probability of a no-deal Brexit may become overstated in the next two-to-three months. Economically and politically, a no-deal exit is extremely difficult to follow through on – hence our 21% probability. Estimates of the negative economic impact range from a 2% reduction in GDP growth to an 11% reduction (Table 1). The 8% drop cited by Scottish National Party leader Ian Blackford in his denunciation of Prime Minister Johnson’s strategy is probably exaggerated. The U.K.’s recorded twentieth-century recessions range from 2%-7% (Chart 5). These offer as good of a benchmark as any. While a no-deal exit is probably not going to create a shock the same size as the Great Depression or the Great Recession, the recessions of 1979 and 1990 would be bad enough for any prime minister or ruling party. Table 1Wide Range Of Estimates For Impact Of No-Deal Brexit
Tariffs ... And The Last Prime Minister Of The United Kingdom?
Tariffs ... And The Last Prime Minister Of The United Kingdom?
Chart 5
A small recession could also spiral out of control – it could create a vicious spiral with the European continent, which is already on the verge of recession. And it could damage consumer confidence more than anticipated – as it would be accompanied by immediate social and political unrest due to the half of the population that opposes Brexit in all forms. Politicians have to pay attention to the opinion polls as well as the referendum result, since opinion polls impact the next election. These show a plurality in favor of remaining in the EU and a strong trend against Brexit since 2017 – a factor that the currency markets are ignoring at the moment (Chart 6). While the evidence does not prove that a second referendum would result in Bremain, it is highly likely that a majority opposes a no-deal exit, given that at least a handful of pro-Brexit voters do not want to leave without a deal. The results of the European parliamentary elections in May (Chart 7) and the public’s preferences for different political parties (Chart 8) both support this conclusion. Chart 6Plurality Of Voters Still Favors Bremain Over Brexit
Plurality Of Voters Still Favors Bremain Over Brexit
Plurality Of Voters Still Favors Bremain Over Brexit
Chart 7
Chart 8Voters Favor Bremain-Leaning Political Parties
Voters Favor Bremain-Leaning Political Parties
Voters Favor Bremain-Leaning Political Parties
Parliament is also opposed to a no-deal Brexit. Though the Cooper-Letwin bill that forbad a no-deal exit initially passed by one vote in April (Chart 9A), the final amended version passed with a majority of 309 votes. Further, in July, with the rise of Boris Johnson, parliament passed a measure by 41 votes that requires parliament to sit this fall (Chart 9B), thus attempting to prevent Boris from proroguing parliament and forcing a no-deal Brexit that way. Technically Queen Elizabeth II could still prorogue parliament, but we highly doubt she would intervene in a way that would divide the nation. Johnson himself will have to face the reality of parliament and public opinion.
Chart 9
Chart 9
Parliament has one crystal clear means of halting a no-deal exit: a vote of no confidence in Johnson’s government.1 Theresa May only survived her vote of no confidence by 19 seats. Yet Johnson is entering 10 Downing Street at a time when parliament is essentially hung. The Conservative Party’s coalition with Northern Ireland’s Democratic Union Party has been reduced to a majority of two, which is likely to fall to a single solitary seat after the Brecon and Radnorshire by-election, which is taking place as we go to press. Johnson has purged several Tories from his cabinet, and there are a handful of Conservatives who are firmly opposed to a no-deal Brexit. It would be an extremely tight vote as to whether these Tory rebels would be willing and able to bring down one of their own governments – a careful assessment suggests that there are about half a dozen swing voters on each side of the House of Commons.2 But 47 Conservatives contrived to block prorogation (see Chart 9B). The magnitude of the crisis members of parliament would face – an unpopular, self-inflicted no-deal exit and recession – is essential context that would motivate rebellious voting behavior. Parliament’s actions so far, the reality of the economic impact, and the popular polling suggest that MPs are likely to halt the Johnson government from forcing a no-deal exit if he makes a mad dash for it. More likely is that Johnson himself pushes to hold an election after securing some technical concessions from Brussels. He is galvanizing the Conservative vote and swallowing up the single-issue Brexit vote (UKIP and the Brexit Party), while the opposition remains divided between the Labour Party under the vacillating Jeremy Corbyn and the resurgent Liberal Democrats (Chart 10). In a first-past-the-post electoral system, this provides a window of opportunity for the Conservatives to improve their parliamentary majority – assuming that Johnson has renegotiated a deal with the EU and has something to show for it. Chart 10BoJo Could Call Election With Deal In Hand
BoJo Could Call Election With Deal In Hand
BoJo Could Call Election With Deal In Hand
Chart 11Ireland Can Compromise For Stability's Sake
Ireland Can Compromise For Stability's Sake
Ireland Can Compromise For Stability's Sake
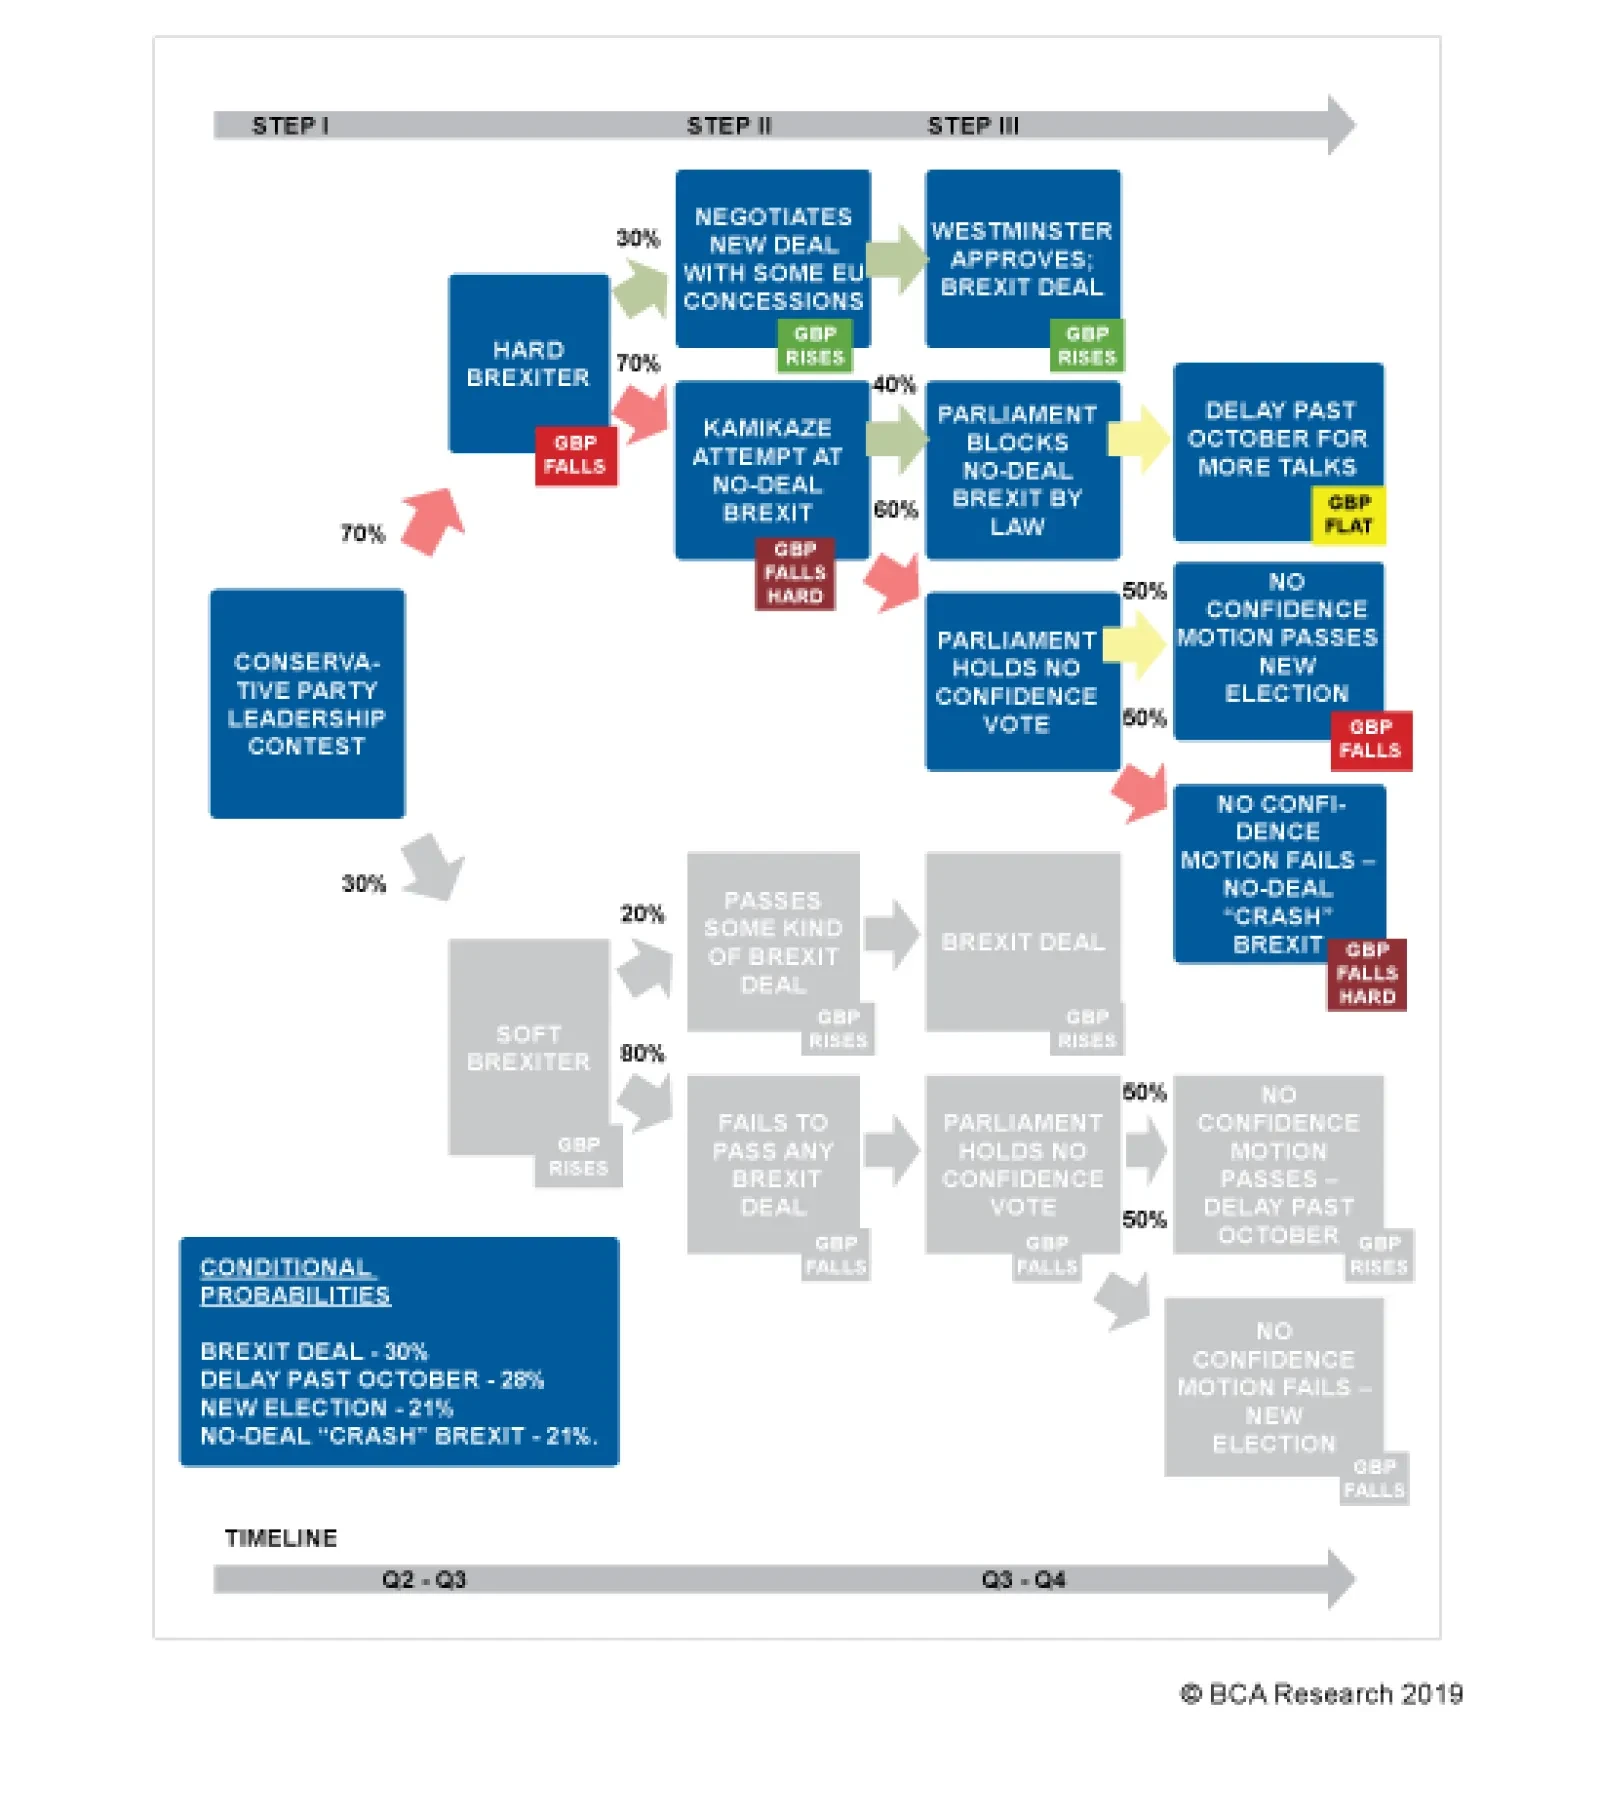
This would require the EU to delay the deadline yet again (September 3 is the last date for a non-confidence vote to force a pre-Brexit October 24 election). The European Union has a self-interest in preventing a no-deal Brexit, as it needs to maintain economic stability. It ultimately would prefer to keep the U.K. in the bloc, which means that delays can ultimately be granted, especially to accommodate a new election. As to what kind of compromises are available, the Irish backstop can suffer technical changes to its provisions, time frames, or application. In the end, the Irish Sea is already a different kind of border than the other borders in the U.K. and therefore it is possible to enact additional checks that nevertheless have a claim to retaining the integrity of the United Kingdom. The Democratic Unionists could find themselves outnumbered on this issue. Certainly the Republic of Ireland has an interest in preventing a no-deal Brexit as long as a hard border with Northern Ireland is avoided, and Boris Johnson maintains that it will be (Chart 11). The risk of a no-deal Brexit is around 21% Our updated Brexit Decision Tree in Diagram 1 provides the outcomes. Former Prime Minister Theresa May failed three times to pass her Brexit deal. We allot a 30% chance, higher than consensus, that Boris Johnson can do it through galvanizing the Conservative vote – given that he is operating with a hung parliament and is at odds with the median voter on Brexit. We give 21% odds to a no-deal Brexit based on the difficulty of parliament outright halting Johnson if his government is absolutely determined to follow through with it. This is clearly a large risk but not our base case. We would upgrade these odds to around 30% in the event that negotiations with the EU completely fail to produce tangible outcomes. It is far more likely that a delay occurs and leads to new elections (49%) – and these odds rise to 70% if Johnson fails to extract concessions from the EU that enable him to pass a deal through parliament. Diagram 1Brexit Decision Tree (Updated As Of June 21 For Boris Johnson)
Tariffs ... And The Last Prime Minister Of The United Kingdom?
Tariffs ... And The Last Prime Minister Of The United Kingdom?
A final constraint on Johnson comes from Scotland, as highlighted in the epigraph at the top of the report: the demand for a new Scottish independence referendum is reviving as a result of opposition to Brexit in general and specifically to Prime Minister Johnson’s hardline approach (Charts 12A & 12B). The SNP is also improving its favorability among Scottish voters relative to other parties (Chart 13). We have highlighted this risk in the past: support for Scottish independence does not have a clear ceiling amid the antagonism over Brexit, especially if an economic and political shock hits the union as a result of a forced no-deal exit.
Chart 12
Chart 12
Chart 13Scottish Nationals Resurgent
Scottish Nationals Resurgent
Scottish Nationals Resurgent
Bottom Line: The risk of a no-deal Brexit is around 21%, though a complete failure of negotiations with the EU could push it up to 30%. If it occurs it will induce a recession and eventually could result in the breakup of the union with Scotland. China And Investment Recommendations What can investors be certain of regardless of the different Brexit outcomes? The United Kingdom will reverse the fiscal austerity of recent years (Chart 14). Fiscal stimulus will be necessary either to offset the shock of a no-deal exit in the worst-case scenario, or to address the ongoing economic challenges and public grievances in a soft Brexit or no Brexit scenario. These grievances stem from the negative impact on the middle class of globalization, post-financial crisis deleveraging, low real wage growth, and the decline in productivity. Potential GDP growth is set to fall if immigration is curtailed and restrictions on trade with the EU go up. The government will have to offset this trend with spending to boost the social safety net and encourage investment. Chart 14Fiscal Austerity To Go Into Reverse
Fiscal Austerity To Go Into Reverse
Fiscal Austerity To Go Into Reverse
The pound is clearly weak on a long-term and structural basis (Chart 15). Based on our assessment of the British median voter – opposed to a no-deal Brexit – and the fact that parliament is also opposed to a no-deal Brexit Chart 15Deep Value In Sterling
Deep Value In Sterling
Deep Value In Sterling
and is the supreme lawgiving body in the British constitution, we expect that an enormous buying opportunity will emerge when Prime Minister Johnson’s gambit has reached its apex and he is either forced to accept what concessions the EU will give. But if forced out of office, election uncertainty due to a potential Prime Minister Jeremy Corbyn will prolong the pound’s weakness. Brexit is not the only risk affecting Europe this summer – a critical factor is Europe’s own economic status, which in great part hinges on our China view (Chart 16). The Chinese Communist Party’s mid-year Politburo meeting struck a more accommodative tone relative to the April meeting that sounded less dovish in the aftermath of the Q1 credit splurge. The emphasis of the remarks shifted back to the need to take additional measures to stabilize the economy, as in the October 2018 statement. This fits with our view since February that Chinese stimulus will surprise to the upside this year. Chart 16Chinese Reflation Positive For Europe
Chinese Reflation Positive For Europe
Chinese Reflation Positive For Europe
Policymakers’ efforts are working thus far, with signs of stabilization occurring in the all-important labor market (Chart 17). There is some evidence that Xi Jinping’s anti-corruption campaign is moderating, which also supports the view that policy settings in the broadest sense are becoming more supportive of growth (Chart 18). Chart 17China Will Reflate More
China Will Reflate More
China Will Reflate More
Chart 18Relaxing Anti-Corruption Campaign Another Form Of Easing
Relaxing Anti-Corruption Campaign Another Form Of Easing
Relaxing Anti-Corruption Campaign Another Form Of Easing
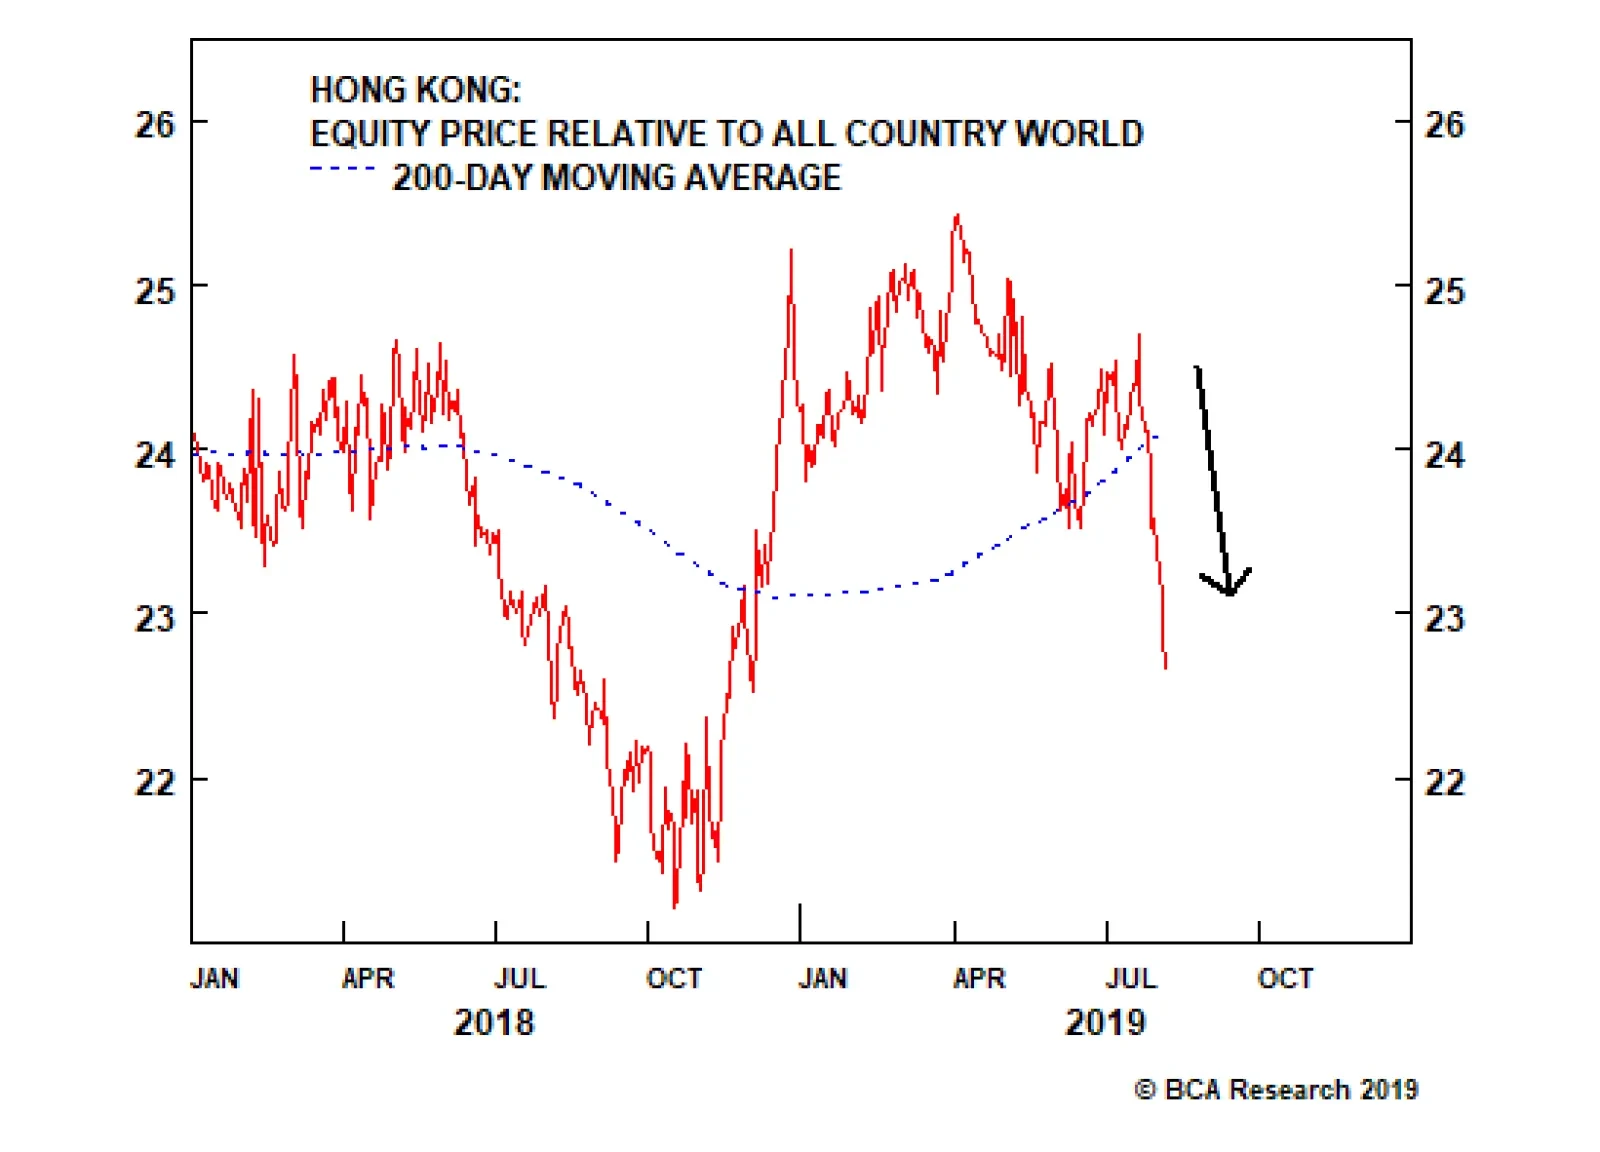
Chart 19Hong Kong Equities Have Farther To Fall
Hong Kong Equities Have Farther To Fall
Hong Kong Equities Have Farther To Fall
We still are long European equities versus Chinese equities and are short the CNY-USD. From a geopolitical point of view, the U.S.-China conflict is intensifying with President Trump’s threat to raise an additional 10% tariff on $300 billion of Chinese imports despite the resumption of talks. In addition, the Hong Kong protests are intensifying, with China’s People’s Liberation Army (PLA) warning that it may have to intervene. There is high potential for violence to erupt, leading to a more heavy-handed approach by Hong Kong security forces and even eventual PLA deployment. This suggests there is downside in the Hang Seng index (Chart 19) – and PLA intervention could lead to broader investor concerns about China’s internal stability and another reason for tensions with the United States and its allies. The U.S.-China conflict is intensifying. Our alarmist view on Taiwan in advance of the January 2020 election is finally taking shape. Not only has the Hong Kong unrest prompted a notable uptick in Taiwanese people’s view of themselves as exclusively Taiwanese (Chart 20), but Beijing has also announced additional restrictions on travel and tourism to Taiwan – an economic sanction that will harm the economy (Chart 21). These actions and escalation in Hong Kong raise the odds that the ruling Democratic Progressive Party will remain in power in Taiwan after January and hence that cross-strait relations (and by extension Sino-American relations) will remain strained and will require a higher risk premium to be built in. The latest trade war escalation could easily spill into strategic saber-rattling, as the U.S. blames China for North Korea’s return to bad behavior and China blames the U.S. for dissent in Hong Kong and likely Taiwan.
Chart 20
Chart 21Beijing To Sanction Taiwan Tourism Again
Beijing To Sanction Taiwan Tourism Again
Beijing To Sanction Taiwan Tourism Again
The U.S.-China trade negotiations are falling apart at the moment. We had argued that China’s stimulus and stabilization would create a negative reaction from President Trump, who would regret the Osaka ceasefire when he saw that China’s bargaining leverage had improved. This has come to pass, vindicating our 60% odds of an escalation post-G20. The U.S. Commerce Department could still conceivably renew the Temporary General License for U.S. companies to deal with Chinese tech firm Huawei on August 19, in order to create an environment conducive to progress for the next round of trade talks in September, but with the latest round of tariffs we think it is more likely that we will get a major escalation of strategic tensions and even saber-rattling. China’s new announcements regarding reforms to make local officials more accountable and to make it easier for companies to go bankrupt, including unprofitable “zombie” state-owned enterprises, could be a thinly veiled structural concession to the United States, but it remains to be seen whether these will be implemented and reinforced. Beijing rebooted structural reforms at the nineteenth national party congress but we expect stimulus to overwhelm reform amid trade war. We are converting our long non-Chinese rare earth producers recommendation to a strategic trade, after it hit our 5% stop-loss, as it is supported by our major theme of Sino-American strategic rivalry. The secular nature of this rivalry has been greatly confirmed by the fact that President Trump is now responding to American election dynamics. The U.S. Democratic Party’s primary debates have revealed that the candidates most likely to take on President Trump (Bernie Sanders and Elizabeth Warren) are adopting his hawkish foreign policy and trade policy stance toward China. The frontrunner former Vice President Joe Biden is the exception, as he is maintaining President Obama’s more dovish and multilateral approach. Trump’s clear response is to ensure that he still owns the trade and manufacturing narrative, to call Biden weak on trade, and to prevent the left-wing populists from outflanking him. Short the Hang Seng index as a tactical trade and close long Q1 2020 Brent futures versus Q1 2021 at the market bell tonight. Matt Gertken, Vice President Geopolitical Strategist mattg@bcaresearch.com Footnotes 1 See Maddy Thimont Jack, “A New Prime Minister Intent On No Deal Brexit Can’t Be Stopped By MPs,” May 22, 2019, www.instituteforgovernment.org.uk. 2 See Dominic Walsh, “Would MPs really back a no confidence motion to stop no-deal?” The New Statesman, July 15, 2019, www.newstatesman.com.
Image
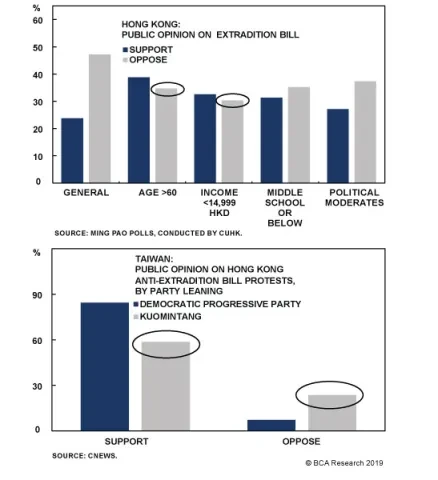
Even the groups that are least sympathetic to the protesters – political moderates, the elderly, low-income groups, and the least educated – are more or less divided over the controversial extradition bill that…