Geopolitics

Highlights Economic data suggest the current business cycle in China has not yet reached a bottom. Stimulus measures have not been forceful enough to fully offset a slowing domestic economy and weakening global demand. With possibly more U.S. tariffs to come, intensifying political unrest in Hong Kong and a currency set to depreciate further, the potential downside risks outweigh any potential upside over the near term. Investors who are already positioned in favor of Chinese equities should stay long. We are still early in a credit expansionary cycle, and we expect further economic weakness to pave the way for more policy support in China. However, we recommend investors who are not yet invested in Chinese assets to remain on the sidelines until clearer signs of materially stronger stimulus emerge. Feature Chart 1A Breakdown In Chinese Stocks
A Breakdown In Chinese Stocks
A Breakdown In Chinese Stocks
Financial market volatility surged in the first half of the month following U.S. President Donald Trump’s recent tweet, vowing to impose a 10% tariff on the remaining $300 billion of U.S. imports of Chinese goods by September 1st. By the end of last week, prices of China investable stocks relative to global equities had nearly wiped out all their 2019 year-to-date gains. (Chart 1) The extent of the decline has left some investors wondering whether the time has come to bottom-fish Chinese assets. In our view, the answer is no. In this week’s report we detail five reasons why the near-term outlook for China-related assets remains negative. We remain bullish on Chinese stocks over the cyclical (i.e. 6-12 month) horizon and recommend investors who are already positioned in favor of China-related assets stay long. However, we also recommend investors who are not yet invested to remain on the sidelines until surer signs of materially stronger stimulus emerge. As we go to press, the U.S. Trade Representative Office announced that the Trump administration would delay imposing the 10% tariff on a series of consumer goods imported from China — including laptops and cell phones — until December.1 Stocks in the U.S. surged on the news. Today’s rally in the equity market highlights our view, that short-term market performance can be dominated and distorted by news on the trade front. However, market rallies based on headline news will not sustain without the support of economic fundamentals. Reason #1: Chinese Economic Growth Has Not Yet Bottomed In a previous China Investment Strategy report,2 we presented some simple arithmetic to help investors formulate their outlook on the Chinese economy. We argued that in a full-tariff scenario, investors should focus on the likely outcome of one of the two following possibilities: Scenario 1 (Bullish): Effects of Stimulus – Impact of Tariff Shock > 0 Scenario 2 (Bearish): Effects of Stimulus – Impact of Tariff Shock ≤ 0 In scenario 1, the impact of China’s reflationary efforts more than offsets the negative shock to aggregate demand from the sharp decline in exports to the U.S. Scenario 2 denotes an outcome where China’s reflationary response is not larger than the magnitude of the shock. For now, we remain in scenario 2 due to Chinese policymakers’ continual reluctance to allow the economy to re-leverage. The magnitude of the credit impulse so far has been “half measured” relative to previous cycles.3 More than seven months into the current credit expansionary cycle, Chinese economic data have not yet exhibited a clear bottom. As a result, more than seven months into the current credit expansionary cycle, Chinese economic data have not yet exhibited a clear bottom, with the main pillars supporting China’s “old economy” still in the doldrums (Chart 2 and Chart 3). Chart 2No Clear Bottom, Yet
No Clear Bottom, Yet
No Clear Bottom, Yet
Chart 3Key Economic Drivers Struggling To Trend Higher
Key Economic Drivers Struggling To Trend Higher
Key Economic Drivers Struggling To Trend Higher
In addition to a weakening domestic economy, China’s external sector has been weighed down by U.S. import tariffs as well as slowing global demand. (Chart 4). The possibility of adding a 10% tariff by year end on the remaining $300 billion of Chinese goods exports to the U.S. may trigger another tariff “front-running” episode in the 3rd quarter. However, Chart 5 and Chart 6 highlight that any front-running would be against the backdrop of sluggish global demand. Therefore, not only the upside in Chinese export growth will be very limited in the subsequent months following the front-running, but export growth is also likely to fall deeper into contraction. Chart 4Domestic Demand More Concerning Than Exports
Domestic Demand More Concerning Than Exports
Domestic Demand More Concerning Than Exports
Chart 5Pickup In Global Demand Not Yet Visible
Pickup In Global Demand Not Yet Visible
Pickup In Global Demand Not Yet Visible
Chart 6Bottoming In Global Manufacturing Also Delayed
Bottoming In Global Manufacturing Also Delayed
Bottoming In Global Manufacturing Also Delayed
Reason # 2: A-Shares Are Not Yet Signaling A Sizeable Policy Response
Chart 7
In previous China Investment Strategy reports, we have written at length about how Chinese policymakers are reluctant to undo their financial deleveraging efforts and push for more stimulus. After incorporating July credit data, our credit impulse, at a very subdued 26% of nominal GDP, was in fact a pullback from June’s credit growth number (Chart 7). This confirms our view that the current stimulus is clearly falling short compared to the 2015-2016 credit expansionary cycle. It underscores Chinese policymakers’ commitment to keep their foot off the stimulus pedal. What’s more, the recent performance of China’s domestic financial markets has been consistent with a half-measured credit response, and is not yet signaling a meaningful change in China’s policy stance. The A-share market since last summer has been trading off of the likely policy response to the trade war. Chart 8Market Not Signaling Significant Policy Shift
Market Not Signaling Significant Policy Shift
Market Not Signaling Significant Policy Shift
Chart 8 (top panel) shows that the A-share market has closely tracked China’s domestic credit growth over the past year. Given this, we believe that the A-share market is reacting more to the likely policy response to the trade war, in contrast to the investable market which rises and falls in near-lockstep with trade-related news (middle panel). The fact that A-share stocks have been trending sideways underscores that China’s domestic equity market continues to expect “half measured” stimulus. This week’s sharp decline in China’s 10-year government bond yield is in part related to escalating political unrest in Hong Kong (bottom panel), and in our view does not yet signal any major change in the PBOC’s stance. Finally, our corporate earnings recession probability model provides another perspective on the equity market implications of the current path of stimulus. If the current size of stimulus holds through the end of 2019, our model suggests that the probability of an outright contraction in corporate earnings lasting through year end remains quite elevated, at close to 50% (first X in Chart 9). The July Politburo statement signaled a greater willingness to stimulate the economy; as a result, we are penciling in a slightly more optimistic scenario on forthcoming credit growth through the remainder of the year, by adding 300 billion yuan of debt-to-bond swaps4 and 800 billion yuan of extra infrastructure spending5 to our baseline estimate for the rest of 2019. However, this would only add a credit impulse equivalent of 1 percentage point of nominal GDP and would only marginally reduce the probability of an earnings recession to 40% (second X in Chart 9). A 40% chance of an earnings recession is well above “normal” levels that would be consistent with a durable uptrend in stock prices, and in previous cycles, Chinese stock prices picked up only after business cycles and corporate earnings had bottomed (Chart 10). In sum, the current pace of credit growth, signals from the domestic equity market, and our earnings recession model all suggest that it is too early to bottom fish Chinese stocks. Chart 9A "Measured" Pickup in Stimulus Will Not Be A Game Changer
A "Measured" Pickup in Stimulus Will Not Be A Game Changer
A "Measured" Pickup in Stimulus Will Not Be A Game Changer
Chart 10Too Early To Bottom Fish
Too Early To Bottom Fish
Too Early To Bottom Fish
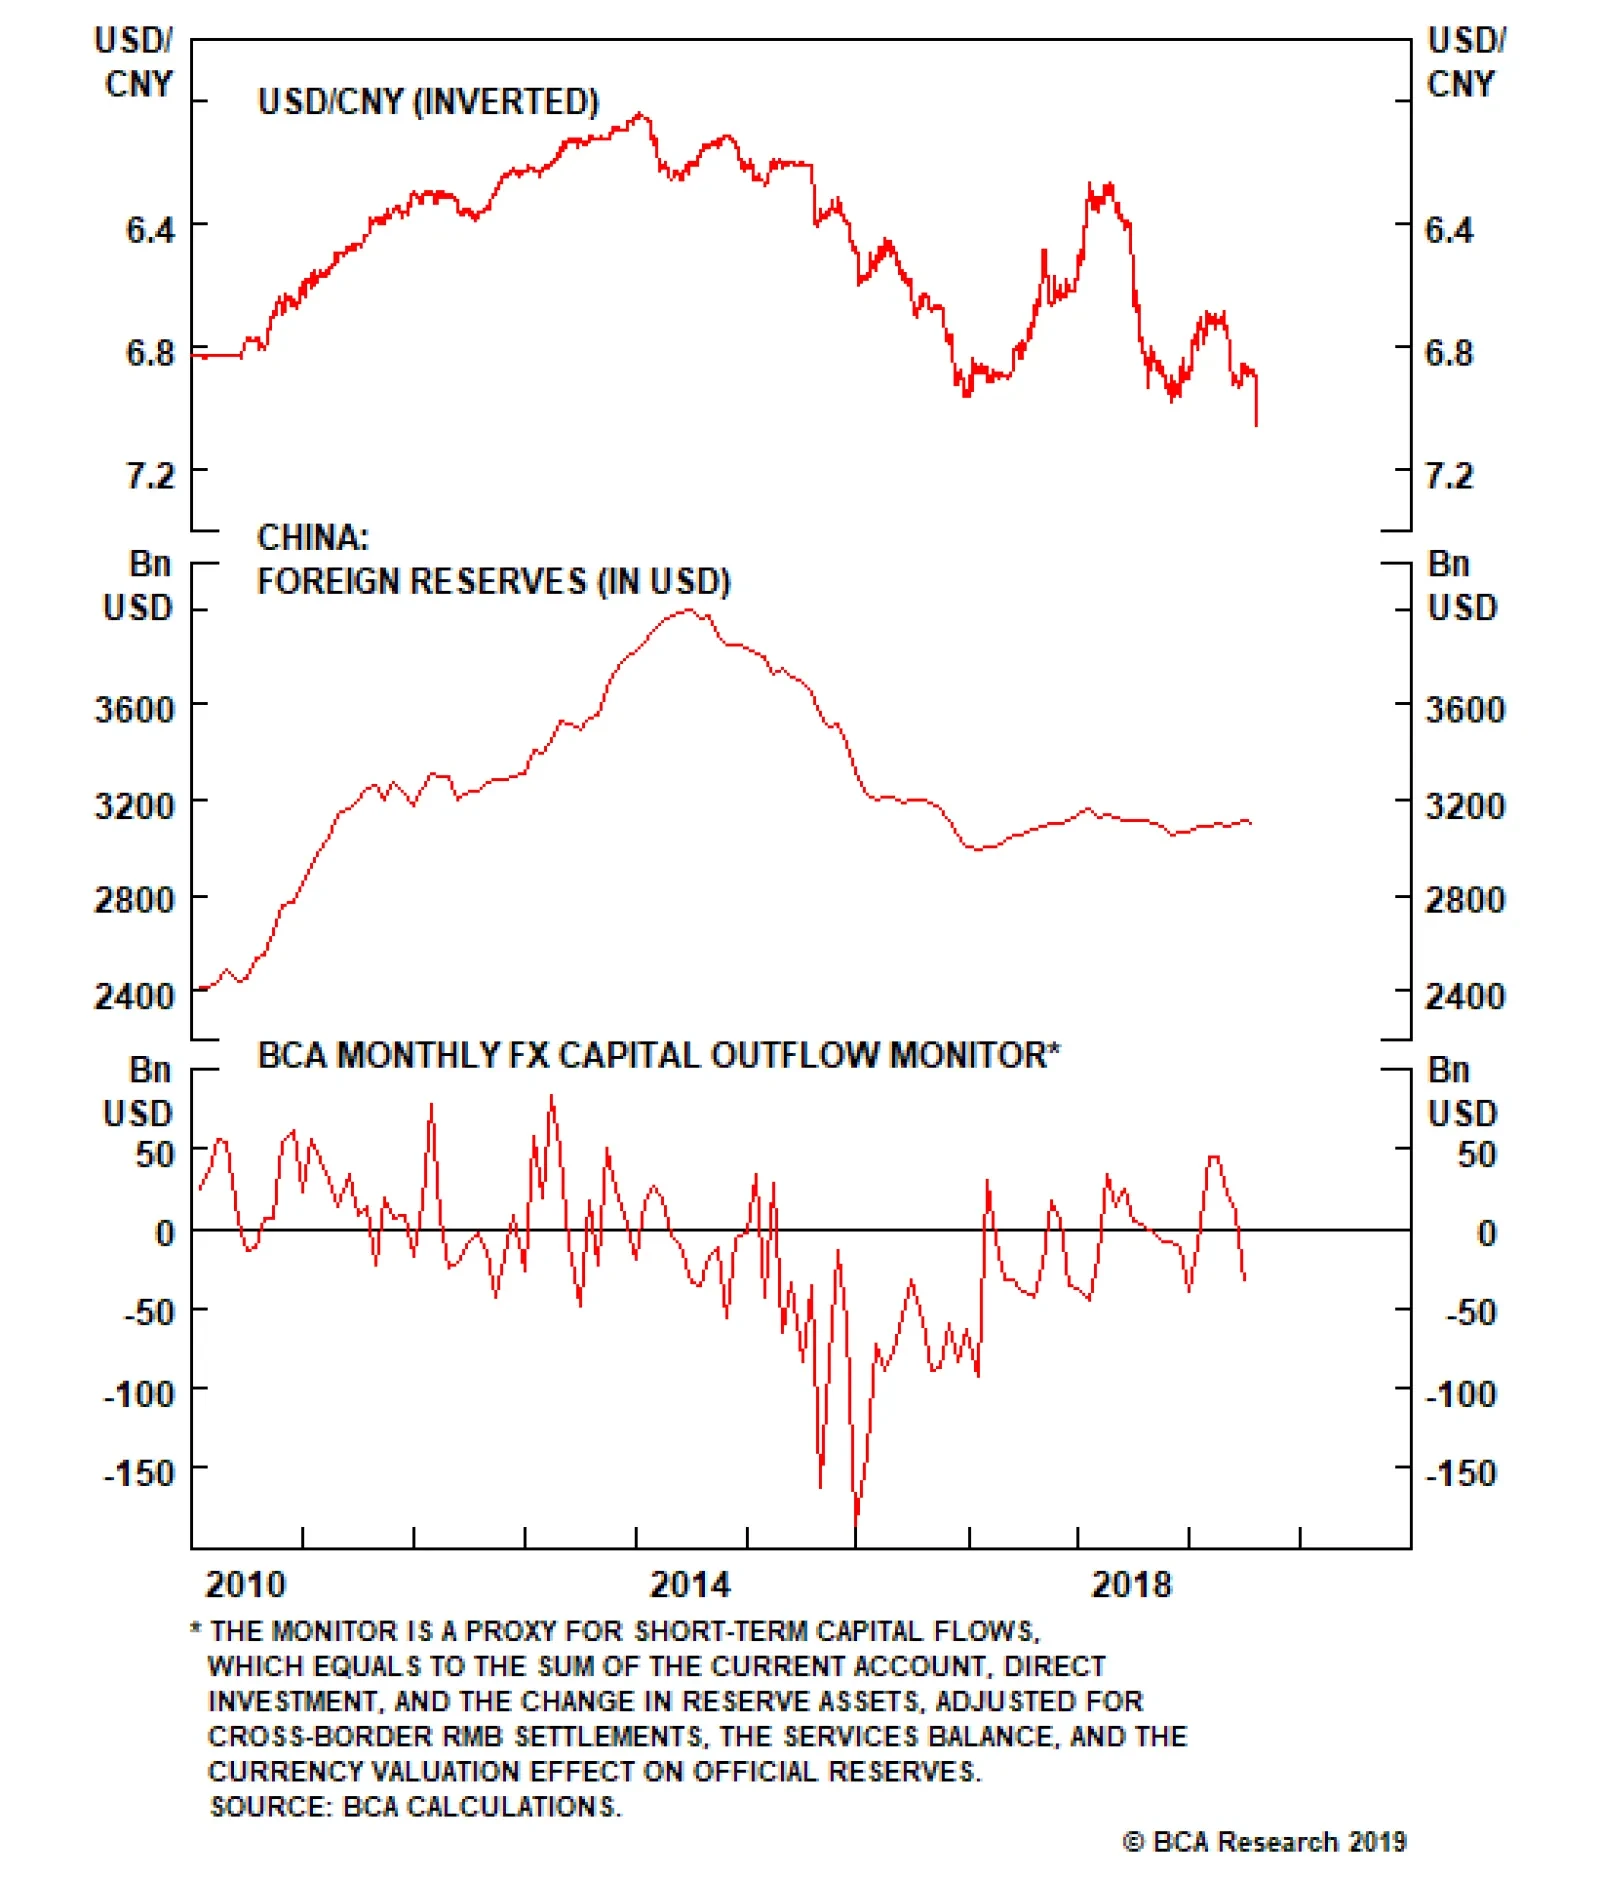
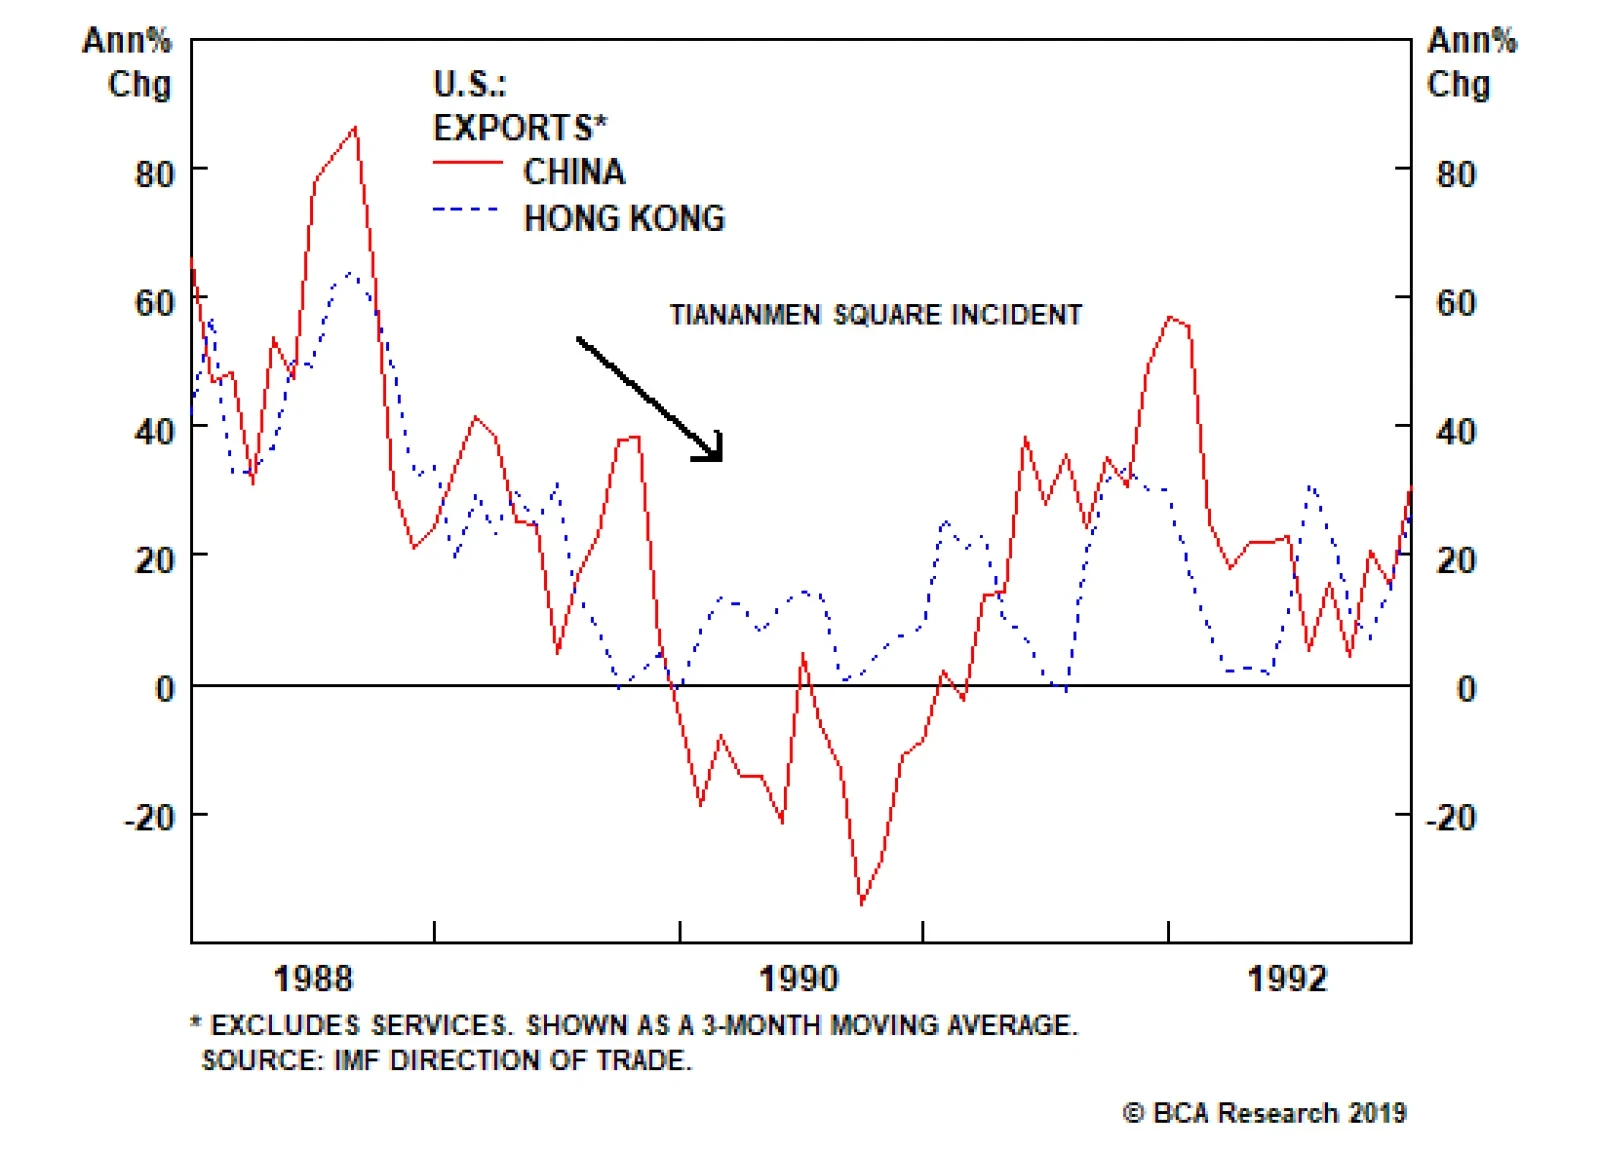
Reason #3: The Trade War Is Far From Over Our Geopolitical Strategy team maintains that the U.S. and China have only a 40% chance of concluding a trade agreement by November 2020, and that any trade truce is likely to be shallow.6 We agree with this assessment, which has clear negative near-term implications for Chinese investable stocks, even if temporary rallies such as what took place yesterday periodically occur. Since the onset of the trade war, Chinese investable stocks appear to have traded nearly entirely in reaction to trade-related events. Hence, until global investors are given proof that much stronger stimulus can and will offset the impact of the trade war on corporate earnings, Chinese stocks are likely to continue to underperform their global peers. Reason #4: The Hong Kong Crisis Is A Near-Term Risk Another near-term catalyst for financial market turbulence in China is the worsening situation in Hong Kong. For now, we hold the view that a full-blown crisis (i.e. China intervening with military force) can be avoided, but we are not ruling out the possibility of a severe escalation or its potential impact on market sentiment towards Chinese assets. On the surface, China investable stocks (the MSCI China Index, the predominantly investable index that now includes some mainland A-shares) are not directly linked to businesses in Hong Kong: Out of the top 10 constituents of the MSCI China Index, which account for roughly 50% of the index’s market capitalization, seven are headquartered in mainland China and do not appear to have significant revenue exposure to Hong Kong. By contrast, at least 30% of Hang Seng Index-listed companies have business operations in Hong Kong. The remaining three companies in the top 10 MSCI China Index are Tencent (the largest component of the index, with a weight of approximately 15%), Ping An Insurance (4% weight), and China Mobile (3% weight) – all of which registered large losses in the past week. Both Tencent and Ping An Insurance are headquartered in Shenzhen, a southeastern China metropolis that links Hong Kong to mainland China. China Mobile appears to have the most revenue exposure to Hong Kong of any top constituent through its CMHK subsidiary, which is the largest telecommunications provider in Hong Kong. It is true that there has been little evidence so far that Chinese investable stocks have been more impacted by the escalation in political unrest in Hong Kong than by the escalation in the trade war. Indeed, the fact that the two escalations were overlapping this past week makes it difficult to isolate their effects. But if unrest in Hong Kong spirals out of control, it could result in mainland China intervening. According to an analysis done by BCA’s Geopolitical Strategy team,6 the deployment of mainland troops would likely lead to casualties and could trigger sanctions from western countries. The 1989 Tiananmen Square incident shows that such an event could lead to a non-negligible hit to domestic demand and foreign exports under sanctions. Should this to occur, the near-term idiosyncratic risk to Chinese stocks in both onshore and offshore markets will be significant. Reason #5: Further RMB Depreciation May Weigh On Stock Prices Whether due to manipulation or market forces, last week’s depreciation in the Chinese currency (RMB) was economically justified and long overdue. Chart 11RMB Depreciation Long Overdue
RMB Depreciation Long Overdue
RMB Depreciation Long Overdue
Chart 11 shows the close relationship between the U.S.-China one-year swap rate differential and the USD/CNY exchange rate. The true source of the correlation shown in the chart remains somewhat of a mystery, given that Chinese capital controls, particularly following the 2015 devaluation episode, prevent the arbitrage activities that link rate differentials and exchange rates in economies with fully open capital accounts. However, Chart 11 clearly shows that China’s currency would have already weakened by now if it was fully market-driven, and we do not believe that the People’s Bank of China will be inclined to tighten monetary policy in order to reverse the recent devaluation. Hence, the path of least resistance for the CNY is further depreciation. If the threatened 10% tariff on all remaining U.S. imports from China is imposed this year, our back-of-the-envelope calculation based on Chart 12 suggests that a market-driven “equilibrium” USD/CNY exchange rate should be at around 7.6. We have high conviction, based on previous RMB devaluation episodes, that China’s central bank will not allow its currency to depreciate in a manner that invites speculation of meaningful further weakness – meaning we are not likely to see a straight-lined or rapid depreciation down to the 7.6 mark. Chart 12Market Driven 'Equilibrium' Provides Some Guidance On The Exchange Rate
Market Driven 'Equilibrium' Provides Some Guidance On The Exchange Rate
Market Driven 'Equilibrium' Provides Some Guidance On The Exchange Rate
A “managed” currency depreciation is in and of itself stimulative for the Chinese economy. At the same time, aggressive market intervention via the PBoC burning through its foreign exchange reserves is also unlikely: A “managed” currency depreciation is in and of itself stimulative for the economy. It improves Chinese export goods’ price competitiveness and helps mitigate some of the pain caused by increased tariffs. Therefore it is in the PBoC’s every interest to allow such depreciation. However, no matter how “orderly” RMB depreciation may be, the fact that the PBoC has signaled it is no longer defending a “line in the sand” exchange-rate mark is likely to trigger another round of “race to the bottom” currency devaluation from other regional, export-dependent economies.7 A weaker RMB and emerging market currencies will also contribute to USD strength. A strong dollar has been negatively correlated with global risky assets, implying that for a time, a weaker RMB will be a risk-off event for risky assets and thus presumably for Chinese and EM equity relative performance. Investment Implications Our analysis above highlights that the near-term outlook for Chinese stocks is fraught with risk, and it is for this reason that we recommended an underweight tactical position in Chinese stocks for the remainder of the year in our July 24 Weekly Report.8 However, by next summer (the tail-end of our cyclical investment horizon), it is our judgement that one of two things will have likely occurred: The trade war with the U.S. will have abated or been called off, and investors will have determined that a “half-strength” credit cycle is likely enough to stabilize Chinese domestic demand and the earnings outlook. In this scenario, Chinese stocks are likely to rise US$ terms over the coming year, relative to global stocks. The trade war with the U.S. will have continued, and Chinese policymakers will have acted on the need to stimulate aggressively further in order to stabilize domestic demand. In combination with an ultimately stimulative (although near-term negative) decline in the RMB, the relative performance of Chinese stocks versus the global benchmark will likely be higher in hedged currency terms. Because of the near-term risks to the outlook, we agree that investors who are not yet invested should remain on the sidelines until surer signs of materially stronger stimulus emerge. But investors who are already positioned in favor of Chinese equities should stay long, and should bet on the latter scenario: rising relative Chinese equity performance in local currency terms, alongside a falling CNY-USD / appreciating USD-CNY exchange rate. Jing Sima China Strategist JingS@bcaresearch.com Footnotes 1 “US to delay some tariffs on Chinese goods”, Financial Times, August 13, 2019. 2 Please see China Investment Strategy Weekly Report, “Simple Arithmetic”, dated May 15, 2019, available at cis.bcaresearch.com. 3 Please see China Investment Strategy Weekly Reports, “Threading A Stimulus Needle (Part 1): A Reluctant PBoC”, dated July 10, 2019, and “Threading A Stimulus Needle (Part 2): Will Proactive Fiscal Policy Lose Steam?”, dated July 24, 2019, available at cis.bcaresearch.com. 4 The remaining of 14 trillion debt-to-bond swap program rounds up to 315 billion yuan. 5 The relaxed financing requirement for infrastructure projects can add 800 billion yuan. 6 Please see Geopolitical Strategy Weekly Report, “The Rattling Of Sabers”, dated August 9, 2019, available at gps.bcaresearch. 7 Please see Emerging Markets Strategy Weekly Report, “The RMB: Depreciation Time?”, dated May 23, 2019, available at ems.bcaresearch.com. 8 Please see China Investment Strategy Weekly Report, Threading A Stimulus Needle (Part 2): Will Proactive Fiscal Policy Lose Steam?”, dated July 24, 2019, available at cis.bcaresearch.com. Cyclical Investment Stance Equity Sector Recommendations
Highlights Duration: Hawkish trade policy will continue to weigh on bond yields for at least the next few months, but a rebound in global economic growth should take hold before the end of the year. Ultimately, a growth rebound will lead to higher bond yields on a 12-month horizon, but the timing is difficult and investors should keep portfolio duration close to benchmark for the time being. High-Yield: The Fed’s accommodative policy stance and the likelihood of a global growth recovery argue for maintaining an overweight allocation to corporate credit. Within that allocation, junk bonds should outperform investment grade due to much more attractive valuations. 10-Year Treasury Yield: The current shock to global economic growth is of a similar magnitude to the one that occurred in 2015/16. However, wage and inflationary pressures are higher now than they were back then. This means that the 10-year Treasury yield will not re-visit the 2016 trough of 1.37%, and is probably already close to its floor. Feature Regular readers will be aware of our Fed Policy Loop framework for analyzing the wiggles in financial markets. The Loop works as follows: Step 1: A dovish shift in Fed policy leads to a favorable market reaction, easing financial conditions. Step 2: Easier financial conditions suggest to the Fed that economic growth will strengthen in the future. The Fed can therefore respond by adopting a more hawkish policy stance. Step 3: The Fed’s hawkish policy shift leads to a negative market reaction, tightening financial conditions. Step 4: Tighter financial conditions suggest to the Fed that economic growth will weaken in the future. The Fed is forced to ease monetary policy at the margin. Return to Step 1 But it appears that BCA readers aren’t the only ones aware of the Fed Policy Loop. President Trump has also been exploiting the two-way relationship between Fed policy and financial conditions as he escalates his trade war with China. Chart 1 illustrates how this has been working. Step 1 of the Fed policy loop continues to function exactly as described above. However, the last few times that financial conditions have eased, the President has seized the opportunity to ratchet up trade tensions. Much like the Fed, the President reasons that periods of easier financial conditions are when the economy and financial markets can best handle a negative shock. The fall-out is that financial conditions tighten in response to the hawkish trade announcement, and the Fed is forced to respond to tighter financial conditions by turning even more dovish.
Chart 1
The end result is that the part of the Fed Policy Loop labeled “Hawkish Fed” is by-passed. Without that step it is impossible for bond yields to rise (Chart 2). Chart 2The Back-Drop Of The Interrupted Fed Policy Loop
The Back-Drop Of The Interrupted Fed Policy Loop
The Back-Drop Of The Interrupted Fed Policy Loop
Our Geopolitical Strategy service provided a comprehensive breakdown of U.S./China trade negotiations in last week’s report.1 The overall message is that the 2020 election is the President’s main constraint. He views hawkish trade policy as a winning issue, but only insofar as it can be accomplished without a significant decline in the stock market or economic activity. Faced with that constraint, the President will continue to interrupt the Fed Policy Loop, and the Fed will continue to do its job by adopting a more dovish monetary policy to offset possible trade shocks. At present, this means that another rate cut is likely in September. Against the back-drop of the “interrupted” Fed Policy Loop, Treasury yields can only move higher if global economic growth strengthens. In that case, the policy loop will remain operative, but at an overall higher level of yields. With that in mind, while hawkish trade policy will continue to weigh on bond yields for at least the next few months, a rebound in global economic growth should take hold before the end of the year. This will lead to higher bond yields on a 12-month horizon. Still Tracking The 2015/16 Roadmap In our research, we have repeatedly pointed out the similarities between the 2015/16 episode of flagging global growth and the current period. Specifically, we continue to witness weak manufacturing data – both in the U.S. and abroad – but a resilient service sector and strong labor market. Much like in 2015/16, we expect that the shifts toward easier monetary policy in the U.S. and more accommodative credit conditions in China will eventually put a floor under the global manufacturing cycle. The Fed will continue to do its job by adopting a more dovish monetary policy to offset possible trade shocks. At present, this means that another rate cut is likely in September. Case in point, even as President Trump has tightened global financial conditions at the margin through his hawkish trade policy, overall global financial conditions have eased since the beginning of the year (Chart 3). In 2016, easier financial conditions eventually led to upturns in crucial measures of global growth such as the Goldman Sachs Current Activity Indicator (Chart 3, top panel), the Global Manufacturing PMI (Chart 3, panel 2), and the CRB Raw Industrials index (Chart 3, bottom panel). The same dynamic should play out this time around. It’s likely that the main reason why global growth has not responded as quickly as it did in 2016 is that Chinese policy easing has not been as rapid (Chart 4). Our China Investment Strategy service’s Li Keqiang Leading Indicator – a composite measure of money and credit indicators designed to lead Chinese economic activity – has clearly bottomed, but has not yet surged as it did in 2015/16. However, Chinese policy easing continues to ramp up, a process that will continue in the months ahead. The most recent indication of this trend was China’s decision to de-value its currency versus the U.S. dollar, causing the exchange rate to jump above the important psychological threshold of 7 yuan per dollar (Chart 4, bottom panel). China took similar measures to de-value its currency in August 2015, a move that initially roiled markets but eventually helped usher in a rebound in global growth. Chart 3The 2015/2016 Scenario Has Yet To Play Out...
The 2015/2016 Scenario Has Yet To Play Out...
The 2015/2016 Scenario Has Yet To Play Out...
Chart 4...As Long As China Does Not Stimulate More
...As Long As China Does Not Stimulate More
...As Long As China Does Not Stimulate More
When it comes to strategy, we remain confident that global growth is close to a trough, but admit that timing the rebound is difficult. One indicator that should help with timing is the ratio between the CRB Raw Industrials index and Gold (Chart 5). This ratio is tightly correlated with the 10-year Treasury yield, and will only rise when the perceived improvement in global growth – proxied by the CRB index – starts to outpace the perceived dovish tilt to Fed policy – proxied by the rising gold price. Chart 5Keep Tracking The CRB / Gold Ratio
Keep Tracking The CRB / Gold Ratio
Keep Tracking The CRB / Gold Ratio
In light of these difficulties with timing, we recommend that investors keep portfolio duration close to benchmark, but position for a rebound in global growth by maintaining an overweight allocation to credit risk and by running a heavily barbelled Treasury portfolio, overweighting the long and short ends of the curve while avoiding the 5-year and 7-year maturities. The barbell strategy increases average portfolio yield, and also avoids the part of the yield curve that will suffer the most when yields rise. Take Credit Risk In Junk As mentioned above, we recommend that investors maintain an overweight allocation to corporate credit versus Treasuries, despite our recent shift to benchmark duration.2 This is particularly true for high-yield bonds, where spreads are very attractive. Charts 6A and 6B show one of our favorite ways of looking at corporate bond spreads. The charts show the 12-month breakeven spread for each credit tier as a percentile rank relative to history.3 We show each credit tier individually to control for the time-varying average credit rating of the overall indexes. Similarly, we show breakeven spreads instead of the average option-adjusted spreads to control for the time-varying average duration of the bond indexes. Chart 6A shows the following valuation for investment grade credit tiers: Throughout history, Aaa credits have been more expensive than they are today only 13% of the time. Aa credits have been more expensive than they are today 19% of the time. A-rated credits have been more expensive 20% of the time. Baa credits have been more expensive 33% of the time. Chart 6B shows that the corresponding valuation for high-yield is much more compelling: Ba credits have been more expensive than today 55% of the time. B credits have been more expensive 81% of the time. Caa credits have been more expensive 84% of the time. Chart 6AInvestment Grade Breakeven Spreads
Investment Grade Breakeven Spreads
Investment Grade Breakeven Spreads
Chart 6BHigh-Yield Breakeven Spreads
High-Yield Breakeven Spreads
High-Yield Breakeven Spreads
In general, this way of looking at spreads shows that investment grade credits are quite expensive, while high-yield credits are either fairly valued or cheap. However, there is one more adjustment we can make to get an even better picture of corporate bond value. Adjusting For The Phase Of The Cycle A useful tool for cyclical portfolio allocation is to split the cycle into three phases based on the slope of the yield curve (Chart 7). We define the three phases as: Chart 7The Three Phases Of The Cycle
The Three Phases Of The Cycle
The Three Phases Of The Cycle
Phase 1: From the end of the last recession until the 3/10 Treasury slope flattens to below 50 bps. Phase 2: When the 3/10 slope is between 0 bps and +50 bps. Phase 3: From when the 3/10 slope inverts until the start of the next recession. We have previously discussed the implications of the different phases for bond portfolio allocation in more depth.4 This week, we simply want to point out that credit spreads tend to be tighter during Phase 2 of the cycle, when monetary policy has tightened, but not by enough to cause a surge in corporate defaults. The recent surge in investment grade net debt-to-EBITDA likely reflects the shift toward a greater concentration of Baa-rated issuers. With this cyclical decomposition in mind, we can calculate the median breakeven spread for each credit tier in past Phase 2 periods and use that as a spread target for this cycle. We then convert our breakeven spread targets into average option-adjusted spread targets using current index duration. Charts 8A and 8B show how far each credit tier’s spreads are from target. The message is quite clear. Outside of Aaa, investment grade credits are more or less fairly valued, while high-yield credits appear very cheap. Chart 8AInvestment Grade Spread Targets
Investment Grade Spread Targets
Investment Grade Spread Targets
Chart 8BHigh-Yield Spread Targets
High-Yield Spread Targets
High-Yield Spread Targets
One might reasonably challenge this approach to corporate bond valuation by noting that, outside of looking at credit tiers individually, we have not taken fundamental credit quality trends into account. That is, we have made no adjustment for the fact that the credit quality of a Ba-rated issuer might be worse today than in prior cycles. We are skeptical that fundamental credit metrics matter more than the phase of the monetary policy cycle when it comes to corporate bond spread forecasting.5 However, this point of view is still worth exploring, especially considering that net debt-to-EBITDA for the median corporate bond issuer is quite elevated compared to history (Chart 9). Note that we have not attempted to maintain consistent weightings between the different credit tiers in the bottom-up samples shown in Chart 9. This means that the recent surge in investment grade net debt-to-EBITDA likely reflects the shift toward a greater concentration of Baa-rated issuers. Nonetheless, the net debt-to-EBITDA ratio of the median junk issuer is clearly worse than during the past two recoveries. But even if we take this into account by looking at the ratio between the junk index 12-month breakeven spread and the median net debt-to-EBITDA, we see that the ratio is still close to its historical median (Chart 10). In other words, at current spread levels junk investors appear reasonably compensated for the elevated median net debt-to-EBITDA ratio Chart 9Elevated Corporate Leverage
Elevated Corporate Leverage
Elevated Corporate Leverage
Chart 10Favor Junk Bonds
Favor Junk Bonds
Favor Junk Bonds
Bottom Line: The Fed’s accommodative policy stance and the likelihood of a global growth recovery argue for maintaining an overweight allocation to corporate credit. Within that allocation, junk bonds should outperform investment grade due to much more attractive valuations. Close To The Floor Chart 11Now Vs. Mid-2016
Now Vs. Mid-2016
Now Vs. Mid-2016
In a prior report we walked through the process of creating a macroeconomic fair value model for the 10-year Treasury yield, with a focus on describing the different independent variables that might be included in such a model, and the rationale for each one.6 This week, we focus on two vital macroeconomic variables and use them to demonstrate why the 10-year Treasury yield is unlikely to re-visit its mid-2016 trough of 1.37%. The two main variables we focus on are (i) the pace of economic growth, and (ii) the size of the output gap. All else equal, a stronger pace of economic growth leads to expectations for a higher policy rate in the future and a higher 10-year Treasury yield today. However, it is not just the pace of growth that matters. The same rate of economic growth generates more inflationary pressure when the output gap is small than when it is large. This means that bond yields should be higher when the output gap is smaller (or more specifically, less negative). We have found that the Global Manufacturing PMI is probably the indicator of economic growth that correlates best with the 10-year Treasury yield. Similarly, measures of wage growth – and to a lesser extent core inflation – tend to give the best read on the output gap. With that in mind, we can see how these factors look today relative to when the 10-year yield troughed at 1.37% in mid-2016 (Chart 11). Global economic growth looks slightly worse, but not dramatically so. The Global Manufacturing PMI is at 49.3 today. It troughed at 49.9 in 2016. If this were the only variable that mattered, we might reason that the 10-year yield should be below 1.37% already. But we also need to consider that wage growth and inflation are both much higher than in 2016. Average hourly earnings are growing at a year-over-year rate of 3.2%, compared to a rate of 2.8% when the 10-year troughed in 2016. Similarly, the Atlanta Fed’s measure of median wage growth is up to 3.7% for the un-weighted sample and 3.9% for the sample that is weighted to more closely match the demographic characteristics of the overall population (Chart 11, panel 3). It’s true that core PCE inflation is running below where it was in mid-2016, but the trimmed mean measure is much higher (Chart 11, bottom panel). The core PCE inflation measure also has a strong track record of converging toward the trimmed mean, a process we expect is playing out again. The core PCE inflation measure also has a strong track record of converging toward the trimmed mean, a process we expect is playing out again. Bottom Line: The current shock to global economic growth is of a similar magnitude to the one that occurred in 2015/16. However, wage and inflationary pressures are higher now than they were back then. This means that the 10-year Treasury yield will not re-visit the 2016 trough of 1.37%, and is probably already close to its floor. Ryan Swift, U.S. Bond Strategist rswift@bcaresearch.com Footnotes 1 Please see Geopolitical Strategy Weekly Report, “The Rattling Of Sabers”, dated August 9, 2019, available at gps.bcaresearch.com 2 Please see U.S. Bond Strategy Portfolio Allocation Summary, “Underinsured”, dated August 6, 2019, available at usbs.bcaresearch.com 3 The 12-month breakeven spread is the basis point widening required on a 12-month horizon for each credit tier to break even with a duration-matched position in Treasuries. 4 Please see U.S. Bond Strategy Special Report, “2019 Key Views: Implications For U.S. Fixed Income”, dated December 11, 2018, available at usbs.bcaresearch.com 5 Please see U.S. Bond Strategy / Global Fixed Income Strategy Special Report, “The Risk From U.S. Corporate Debt: Theory And Evidence”, dated April 23, 2019, available at usbs.bcaresearch.com 6 Please see U.S. Bond Strategy Weekly Report, “Bond Kitchen”, dated April 9, 2019, available at usbs.bcaresearch.com Fixed Income Sector Performance Recommended Portfolio Specification
This Monday we published a Special Report by Matt Gertken, Chief Geopolitical Strategist where Matt takes a dive into implications of the U.S.-Iran hot and U.S.-China cold wars. What follows is a snipped of the investment conclusions and a road map for what to expect in the future: If the U.S. continues the pivot to Asia, and the U.S. and China proceed with tariffs, tech sanctions, saber-rattling, diplomatic crises, and possibly even military skirmishes, China will be forced into an abrupt and destabilizing economic transition. The U.S. dollar will strengthen as global growth decelerates. Developed market equities will outperform emerging market equities, but equities as a whole will underperform sovereign bonds and other safe-haven assets. Our highest conviction call on this matter is that any trade deal before the U.S. 2020 election will be limited in scope (see Diagram). It will fall far short of a “Grand Compromise” that ushers in a new era of U.S.-China engagement – and hence it will be a disappointment to global equities. Please refer to our most recent Special Report for a full discussion of the U.S.-China and U.S.-Iran tensions.
Chart 1
Neither the U.S. nor China would gain from a prolonged trade war. This does not mean that a “World War I” scenario, where all parties end up severely worse off from their actions, can be completely excluded. However, it does mean that powerful forces will…
For the Chinese, it is not just a matter of losing access to the vast U.S. market. It’s also about losing access to vital technologies that China needs to further its ambitions in everything from robotics, to AI, to genomics. From Trump’s perspective, a…
Dear Client, Instead of our regular report, this week we are sending you a Special Report penned by Matt Gertken, Chief Geopolitical Strategist of our sister Geopolitical Strategy service, titled “The Polybius Solution.” In this report Matt argues that a full-fledged cold war with China would put a cap on American political polarization, putting China at a disadvantage. By contrast, a U.S. war with Iran would exacerbate polarization, giving China a huge strategic opportunity. We trust that you will find this Special Report useful and insightful. Best regards, Anastasios Avgeriou, U.S. Equity Strategist Highlights So What? U.S.-Iran risk is front-loaded, but U.S.-China is the greater risk overall. A full-fledged cold war with China will put a cap on American political polarization, putting China at a disadvantage. By contrast, a U.S. war with Iran would exacerbate polarization, giving China a huge strategic opportunity. War with Iran or trade war escalation with China are both ultimately dollar bullish – even though tactically the dollar may fall. Feature The idea of the “Thucydides Trap” has gone viral in recent years – for good reason. The term, coined by Harvard political scientist Graham Allison, refers to the ancient Greek historian Thucydides (460-400 BC), author of the seminal History of the Peloponnesian War. The “trap” is the armed conflict that most often develops when a dominant nation that presides over a particular world order (e.g. Sparta, the U.S.) faces a young and ambitious rival that seeks fundamental change to that order (e.g. Athens, China).1 This conflict between an “established” and “revisionist” power was highlighted by the political philosopher Thomas Hobbes in his translation of Thucydides in the seventeenth century; every student of international relations knows it. Allison’s contribution is the comparative analysis of various Thucydides-esque episodes in the modern era to show how today’s U.S.-China rivalry fits the pattern. The implication is that war (not merely trade war) is a major risk. We have long held a similar assessment of the U.S.-China conflict. It is substantiated by hard data showing that China is gaining on America in various dimensions of power (Chart 1). Assuming that the U.S. does not want to be replaced, the current trade conflict will metastasize to other areas. If the U.S. and China really engage in an epic conflict, American political polarization should fall. There is an important but overlooked corollary to the Thucydides Trap: if the U.S. and China really engage in an epic conflict, American political polarization should fall. Polarization fell dramatically during the Great Depression and World War II and remained subdued throughout the Cold War. It only began to rise again when the Soviet threat faded and income inequality spiked circa 1980. Americans were less divided when they shared a common enemy that posed an existential threat; they grew more divided when their triumph proved to benefit some disproportionately to others (Chart 2). Chart 1China Is Gaining On The U.S.
China Is Gaining On The U.S.
China Is Gaining On The U.S.
Chart 2U.S. Polarization Falls During Crisis
U.S. Polarization Falls During Crisis
U.S. Polarization Falls During Crisis
If the U.S. and China continue down the path of confrontation, a similar pattern is likely to emerge in the coming years – polarization is likely to decline. China possesses the raw ability to rival or even supplant the United States as the premier superpower over the very long run. Its mixed economy is more sustainable than the Soviet command economy was, and it is highly integrated into the global system, unlike the isolated Soviet bloc. As long as China’s domestic demand holds up and Beijing does not suppress its own country’s technological and military ambitions, Trump and the next president will face a persistent need to respond with measures to limit or restrict China’s capabilities. Eventually this will involve mobilizing public opinion more actively. Further, if the U.S.-China conflict escalates, it will clarify U.S. relations with the rest of the world. For instance, Trump’s handling of trade suggests that he could refrain from trade wars with American allies to concentrate attention on China, particularly sanctions on its technology companies. Meanwhile a future Democratic president would preserve some of these technological tactics while reinstituting the multilateral approach of the Barack Obama administration, which launched the “Pivot to Asia,” the Trans-Pacific Partnership, and intensive freedom of navigation operations in the South China Sea. These are all aspects of a containment strategy that would reinforce China’s rejection of the western order. Bottom Line: If the White House, any White House, were to pursue a consistent strategy to contain China, the result would be a major escalation of the trade conflict that would bring Americans together in the face of a common enemy. It would also encourage the U.S. to form alliances in pursuit of this objective. So far these things have not occurred, but they are logical corollaries of the Thucydides Trap and they will occur if the Thucydides thesis is validated. How Would China Fare In The Thucydides Trap? China would be in trouble in this scenario. The United States, if the public unifies, would have a greater geopolitical impact than it currently does in its divided state. And a western alliance would command still greater coercive power than the United States acting alone (Chart 3). External pressure would also exacerbate China’s internal imbalances – excessive leverage, pollution, inefficient state involvement in the economy, poor quality of life, and poor governance (Chart 4). China has managed to stave off these problems so far because it has operated under relative American and western toleration of its violations of global norms (e.g. a closed financial system, state backing of national champions, arbitrary law, censorship). This would change under concerted American, European, and Japanese efforts. Chart 3China Fears A Western 'Grand Alliance'
China Fears A Western 'Grand Alliance'
China Fears A Western 'Grand Alliance'
Chart 4China's Domestic Risks Underrated
China's Domestic Risks Underrated
China's Domestic Risks Underrated
Concerted external pressure would make it harder for China to manage its internal imbalances. How would the Communist Party respond? First, it could launch long-delayed and badly needed structural reforms and parlay these as concessions to the West. The ramifications would be negative for Chinese growth on a cyclical basis but positive on a structural basis since the reforms would lift productivity over the long run – a dynamic that our Emerging Markets Strategy has illustrated, in a macroeconomic context, in Diagram 1. This is already an option in the current trade war, but China has not yet clearly chosen it – likely because of the danger that the U.S. would exploit the slowdown. Diagram 1Foreign Pressure And Structural Reform = Short-Term Pain For Long-Term Gain
The Polybius Solution
The Polybius Solution
Alternatively the Communist Party could double down on confrontation with the West, as Russia has done. This would strengthen the party’s grip but would be negative for growth on both a cyclical and structural basis. The effectiveness of China’s fiscal-and-credit stimulus would likely decline because of a drop in private sector activity and sentiment – already a nascent tendency – while the lack of “reform and opening up” would reduce long-term growth potential. This option makes structural reforms look more palatable – but again, China has not yet been forced to make this choice. None of the above is to say that the West is destined to win a cold war with China, but rather that the burden of revolutionizing the global order necessarily falls on the country attempting to revolutionize it. Bottom Line: If the Thucydides Trap fully takes effect, western pressure on China’s economy will force China into a destabilizing economic transition. China could lie low and avoid conflict in order to undertake reforms, or it could amplify its aggressive foreign policy. This is where the risk of armed conflict rises. Introducing … The Polybius Solution The problem with the above is that there is no sign of polarization abating anytime soon in the United States. Extreme partisanship makes this plain (Chart 5). Rising polarization could prevent the U.S. from responding coherently to China. The Thucydides Trap could be avoided, or delayed, simply because the U.S. is distracted elsewhere. The most likely candidate is Iran.
Chart 5
A lesser known Greek historian – who was arguably more influential than Thucydides – helps to illustrate this alternative vision for the future. This is Polybius (208-125 BC), a Greek who wrote under Roman rule. He described the rise of the Roman Empire as a result of Rome’s superior constitutional system. Polybius explains domestic polarization whereas Thucydides explains international conflict. Polybius took the traditional view that there were three primary virtues or powers governing human society: the One (the king), the Few (the nobles), and the Many (the commons). These powers normally ran the country one at a time: a dictator would die; a group of elites would take over; this oligarchy would devolve into democracy or mob-rule; and from the chaos would spring a new dictator. His singular insight – his “solution” to political decay – was that if a mixture or balance of the three powers could be maintained, as in the Roman republic, then the natural cycle of growth and decay could be short-circuited, enabling a regime to live much longer than its peers (Diagram 2). Diagram 2Polybius: A Balanced Political System Breaks The Natural Cycle Of Tyranny And Chaos
The Polybius Solution
The Polybius Solution
In short, just as post-WWII economic institutions have enabled countries to reduce the frequency and intensity of recessions (Chart 6), so Polybius believed that political institutions could reduce the frequency and intensity of revolutions. Eventually all governments would decay and collapse, but a domestic system of checks and balances could delay the inevitable. Needless to say, Polybius was hugely influential on English and French constitutional thinkers and the founders of the American republic. Chart 6Orthodox Economic Policy Has Made Recessions Less Frequent And Less Acute
Orthodox Economic Policy Has Made Recessions Less Frequent And Less Acute
Orthodox Economic Policy Has Made Recessions Less Frequent And Less Acute
What is the cause of constitutional decay, according to Polybius? Wealth, inequality, and corruption, which always follow from stable and prosperous times. “Avarice and unscrupulous money-making” drive the masses to encroach upon the elite and demand a greater share of the wealth. The result is a vicious cycle of conflict between the commons and the nobles until either the constitutional system is restored or a democratic revolution occurs. Compared to Thucydides, Polybius had less to say about the international balance of power. Domestic balance was his “solution” to unpredictable outside events. However, states with decaying political systems were off-balance and more likely to be conquered, or to overreach in trying to conquer others. Bottom Line: The “Polybius solution” equates with domestic political balance. Balanced states do not allow the nation’s leader, the elite, or the general population to become excessively powerful. But even the most balanced states will eventually decline. As they accumulate wealth, inequality and corruption emerge and cause conflict among the three powers. Why Polybius Matters Today It does not take a stretch of the imagination to apply the Polybius model to the United States today. Just as Rome grew fat with its winnings from the Punic Wars and decayed from a virtuous republic into a luxurious empire, as Polybius foresaw, so the United States lurched from victory over the Soviet Union to internal division and unforced errors. For instance, the budget surplus of 2% of GDP in the year 2000 became a budget deficit of 9% of GDP after a decade of gratuitous wars, profligate social spending and tax cuts, and financial excesses. It is on track to balloon again when the next recession hits – and this is true even without any historic crisis event to justify it. U.S. polarization is contaminating foreign policy. The rise in polarization has coincided with a rise in wealth inequality, much as Polybius would expect (Chart 7). In all likelihood the Trump tax cuts will exacerbate both of these trends (Chart 8). Even worse, any attempts by “the people” to take more wealth from the “nobles” will worsen polarization first, long before any improvements in equality translate to a drop in polarization. Chart 7Polarization Unlikely To Drop While Inequality Rises
Polarization Unlikely To Drop While Inequality Rises
Polarization Unlikely To Drop While Inequality Rises
Chart 8Trump Tax Cuts Fuel Inequality
Trump Tax Cuts Fuel Inequality
Trump Tax Cuts Fuel Inequality
Most importantly, from a global point of view, U.S. polarization is contaminating foreign policy. Just as the George W. Bush administration launched a preemptive war in Iraq, destabilizing the region, so the Obama administration precipitously withdrew from Iraq, destabilizing the region. And just as the Obama administration initiated a hurried détente with Iran in order to leave Iraq, the Trump administration precipitously withdrew from this détente, provoking a new conflict with Iran and potentially destabilizing Iraq. Major foreign policy initiatives have been conducted, and revoked, on a partisan basis under three administrations. And a Democratic victory in 2020 would result in a reversal of Trump’s initiatives. In the meantime Trump’s policy could easily entangle him in armed conflict with Iran – as nearly occurred on June 21. Iranian domestic politics make it very difficult, if not impossible, to go back to the 2015 setting. Despite Trump’s recent backpedaling, his administration runs a high risk of getting sucked into another Middle Eastern quagmire as long as it enforces the sanctions on Iranian oil stringently. China would be the big winner if such a war occurred, just as it was one of the greatest beneficiaries of the long American distraction in Afghanistan and Iraq. It would benefit from another 5-10 years of American losses of blood and treasure. It would be able to pursue regional interests with less Interference and could trade limited cooperation with the U.S. on Iran for larger concessions elsewhere. And a nuclear-armed Iran – which is a long-term concern for the U.S. – is not in China’s national interest anyway. Bottom Line: The U.S. is missing the “Polybius solution” of balanced government; polarization is on the rise. As a result, the grand strategy of “pivoting to Asia” could go into reverse (Chart 9). If that occurs, the conflict with China will be postponed or ineffective. Chart 9Will The Pivot To Asia Reverse?
Will The Pivot To Asia Reverse?
Will The Pivot To Asia Reverse?
Iran Is The Wild Card If the U.S. gets bogged down in the Middle East yet again, the “Pivot To Asia” will go into reverse and the “Thucydides Trap” with China will be delayed. A war with Iran manifestly runs afoul of the Trump administration’s and America’s national interests, whereas a trade war with China does not. First, although an Iranian or Iranian-backed attack on American troops would give Trump initial support in conducting air strikes, the consequences of war would likely be an oil price shock that would sink his approval rating over time and reduce his chances of reelection (Chart 10). We have shown that such a shock could come from sabotage in Iraq as well as from attacks on shipping in the Strait of Hormuz. Iran could be driven to attack if it believes the U.S. is about to attack. Second, not only would Democrats oppose a war with Iran, but Americans in general are war-weary, especially with regard to the Middle East (Chart 11). President Trump capitalized on this sentiment during his election campaign, especially in relation to Secretary Hillary Clinton who supported the war in Iraq. Over the past two weeks, he has downplayed the Iranian-backed tanker attacks, emphasized that he does not want war, and has ruled out “boots on the ground.” Chart 10Carter Gained Then Lost From Iran Oil Shock
Carter Gained Then Lost From Iran Oil Shock
Carter Gained Then Lost From Iran Oil Shock
Chart 11
Third, it follows from the above that, in the event of war, the United States would lack the political will necessary to achieve its core strategic objectives, such as eliminating Iran’s nuclear program or its power projection capabilities. And these are nearly impossible to accomplish from the air alone. And U.S. strategic planners are well aware that conflict with Iran will exact an opportunity cost by helping Russia and China consolidate spheres of influence. The wild card is Iran. President Hassan Rouhani has an incentive to look tough and push the limits, given that he was betrayed on the 2015 deal. And the regime itself is probably confident that it can survive American air strikes. American military strikes are still a serious constraint, but until the U.S. demonstrates that it is willing to go that far, Iran can test the boundaries. In doing so it also sends a message to its regional rivals – Saudi Arabia, the Gulf Arab monarchies, and Israel – that the U.S. is all bark, no bite, and thus unable to protect them from Iran. This may lead to a miscalculation that forces Trump to respond despite his inclinations. The China trade war, by contrast, is less difficult for the Trump administration to pursue. There is not a clear path from tariffs to economic recession, as with an oil shock: the U.S. economy has repeatedly shrugged off counter-tariffs and the Fed has been cowed. While Americans generally oppose the trade war, Trump’s base does not, and the health of the overall economy is far more important for most voters. And a majority of voters do believe that China’s trade practices are unfair. Strategic planners also favor confronting China – unlike Trump they are not concerned with reelection, but they recognize that China’s advantages grow over time, including in critical technologies. Bottom Line: While the media and market focus on China and Iran risks can alternate in the short run, the Trump administration is likely to continue downgrading the conflict with Iran and upgrading the conflict with China over the next six-to-18 months. Neither politics nor grand strategy support a war with Iran, whereas politics might support a trade war with China and grand strategy almost certainly does. China Could Learn From Polybius Too China also lacks the Polybius solution. It suffers from severe inequality and social immobility, just like the Latin American states and the U.S., U.K., and Italy (Chart 12). But unlike the developed markets, it lacks a robust constitutional system. Political risks are understated given the emergence of the middle class, systemic economic weaknesses, and poor governance. Over the long run, Xi Jinping will need to step down, but having removed the formal system for power transition, a succession crisis is likely.
Chart 12
China’s imbalances could cause domestic instability even if the U.S. becomes distracted by conflict in the Middle East. But China has unique tools for alleviating crises and smoothing out its economic slowdown, so the absence of outside pressure will probably determine its ability to avoid a painful economic slump. China also lacks the “Polybius solution” of balanced government – and it even lacks a robust constitutional system. This helps to explain China’s interest in dealing with the U.S. on North Korea. President Xi Jinping’s first trip to Pyongyang late last month helped pave the way for President Trump to resume negotiations with the North’s leader Kim Jong Un at the first-ever visit of an American president north of the demilitarized zone (DMZ). China does not want an unbridled nuclear North Korea or an American preventative war on the peninsula. If Beijing could do a short-term deal with the U.S. on the basis of assistance in reining in North Korea’s nuclear and missile programs, it could divert U.S. animus away from itself and encourage the U.S. to turn its attention toward the next rogue nuclear aspirant, Iran. It would also avoid structural economic concessions. Of course, a smooth transition today means short-term gain but long-term pain for Chinese and global growth. Productivity and potential GDP will decline if China does not reform (Diagram 3). But this kind of transition is the regime’s preferred option since Beijing seeks to minimize immediate threats and maintain overall stability. Diagram 3Stimulus And Delayed Reforms = Socialist Put = Stagflation
The Polybius Solution
The Polybius Solution
If Chinese internal divisions do flare up, China’s leaders will take a more aggressive posture toward its neighbors and the United States in order to divert public attention and stir up patriotic support. Bottom Line: China suffers from understated internal political risk. While U.S. political divisions could lead to a lack of coherent strategy toward China, a rift in China could lead to Chinese aggression in its neighborhood, accelerating the Thucydides Trap. Investment Conclusions If the U.S. reverses the pivot to Asia, attacks Iran, antagonizes European allies, and exhausts its resources in policy vacillation, its budget deficit will balloon (Chart 13), oil prices will rise, and China will be left to manage its economic transition without a western coalition against it. The implication is a weakening dollar, at least initially. But the U.S. is nearing the end of its longest-ever business expansion and an oil price spike would bring forward the next recession, both of which will push up the greenback. Much will depend on the extent of any oil shock – whether and how long the Strait of Hormuz is blocked. Beyond the next recession, the dollar could suffer severe consequences for the U.S.’s wild policies. Chart 13An Iran War Will Bust The Budget
An Iran War Will Bust The Budget
An Iran War Will Bust The Budget
Persian Gulf risks are coming to the fore. But over the next six-to-18 months, U.S.-China conflict will be the dominant marketmover. If the U.S. continues the pivot to Asia, and the U.S. and China proceed with tariffs, tech sanctions, saber-rattling, diplomatic crises, and possibly even military skirmishes, China will be forced into an abrupt and destabilizing economic transition. The U.S. dollar will strengthen as global growth decelerates. Developed market equities will outperform emerging market equities, but equities as a whole will underperform sovereign bonds and other safe-haven assets. Our highest conviction call on this matter is that any trade deal before the U.S. 2020 election will be limited in scope. It will fall far short of a “Grand Compromise” that ushers in a new era of U.S.-China engagement – and hence it will be a disappointment to global equities. Our trade war probabilities, updated on July 26, can be found in Diagram 4. The combined risk of further escalation is 60% -- meaning that the U.S. will either implement the final batch of tariffs or refuse to renew Huawei’s trade license, or both. We are maintaining our risk-off trades: long JPY/USD, long gold, long Swiss bonds, and long USD/CNY. Diagram 4U.S.-China Trade War Decision Tree (Updated July 26, 2019)
The Polybius Solution
The Polybius Solution
Matt Gertken, Vice President Geopolitical Strategist mattg@bcaresearch.com Footnotes 1 See Graham Allison, “The Thucydides Trap: Are The U.S. And China Headed For War?” The Atlantic, September 24, 2015, and Destined For War: Can America and China Escape Thucydides’s Trap? (New York: Houghton Mifflin Harcourt, 2017).
Chinese money and credit growth, especially forward-looking liquidity indicators such as M2 relative to GDP, have bottomed. Historically, this led the cycle by a few months. The drop in Chinese bond yields is also reflationary, and should soon stimulate…
Japan and the East China Sea: Japan’s top military official – General Koji Yamazaki – recently warned that Chinese military intrusions are increasing around the disputed Senkaku (Diaoyu) islands in the East China Sea. He called particular attention to China’s…
While the U.S. threatens to cut off Chinese tech companies like Huawei, Beijing has signaled that countermeasures would include an embargo on U.S. imports of rare earth elements and products. When China implemented a partial rare earth export ban on Japan,…
Highlights So What? Tariffs and currency depreciation will likely lead to military saber-rattling in Asia Pacific. Why? President Trump is not immune to the market’s reaction to his trade war escalation. Yet China’s currency depreciation is a major escalation and the near-term remains fraught with danger for investors. Military shows of force and provocations could crop up across Asia Pacific, further battering sentiment or delaying trade talks. Remain short CNY-USD, short the Hang Seng index, long JPY-USD, and long gold. Overweight the U.S. defense sector relative to global stocks. Feature The Osaka G20 tariff ceasefire has collapsed; U.S. President Donald Trump is threatening tariffs on all Chinese imports; the People’s Bank of China has allowed the renminbi to depreciate beneath the important 7.0 exchange rate to the dollar; and the United States has formally labeled China a “currency manipulator.” What a week! The spike in volatility is likely to be accompanied by a rise in credit risk, as measured by the TED spread (Chart 1). Safe havens like gold, treasuries, and the Japanese yen are rallying in a classic risk-off episode, while messengers of global growth like copper, the Australian dollar, and the CRB raw industrials index are stumbling (Chart 2). Only green shoots in Chinese trade and German manufacturing have kept the selloff in check this week by improving the cyclical outlook despite elevated near-term risks. Chart 1So Much For The Osaka G20 Tariff Ceasefire!
So Much For The Osaka G20 Tariff Ceasefire!
So Much For The Osaka G20 Tariff Ceasefire!
Chart 2Key Risk-On/Risk-Off Indicators Breaking Down
Key Risk-On/Risk-Off Indicators Breaking Down
Key Risk-On/Risk-Off Indicators Breaking Down
While we anticipated the re-escalation of U.S.-China tensions, now is the time to take stock and reassess. President Trump is a political animal. While he has demonstrated a voracious risk appetite throughout the year, he is ultimately focused on reelection in November 2020. The United States will survive without a trade deal by then, but Trump may not. Presumably, Trump’s reason for increasing pressure on China throughout 2019 is to secure a deal by the end of the year. This would be to see China’s concessions translate into trade perks for the U.S. markets and economy in 2020 by the time he hits the campaign trail. The experience of Q4 2018 suggests that Trump changed his negotiating tack after U.S. equities fell by only 4% from their peak – but we consider an equity correction a clear pain threshold (Chart 3). Trump is closely associated with the economic fortunes of the country, even more so than the average president. Bear markets tend to coincide with recessions. Trump – beset by controversy and scandal at home – must assume that a recession will be the coup de grâce. Chart 3Where Is President Trump's Pain Threshold?
Where Is President Trump's Pain Threshold?
Where Is President Trump's Pain Threshold?
Chart 4Will Huawei Ban Hit The Tech Sectors?
Will Huawei Ban Hit The Tech Sectors?
Will Huawei Ban Hit The Tech Sectors?
Investors will get some clarity next week when the Commerce Department decides whether to renew the general temporary license for American companies to trade with Chinese telecoms giant Huawei. A full denial of the license would signal that Trump is unconcerned with recession and reelection probabilities and focusing exclusively on the national security threat from China. It would send technology sectors and the broader equity market into a plunge on both sides of the Pacific (Chart 4) and could significantly increase the risk that the global economy begins a downturn. Positive signals are scarce as we go to press: New tariff is on track: The U.S. Trade Representative is preparing a final list of $300 billion in goods to fall under a new 10% tariff, despite reports that Trump overrode USTR Robert Lighthizer in announcing the new tariff. This does not guarantee that the tariff will go into effect on September 1 but it does make it more likely than not. Huawei is under pressure: Office of Management and Budget has disqualified Huawei from any U.S. government contracts as of August 13 – a ban to be extended to any third parties contracting Huawei as of the same date next year. This is not encouraging for Huawei but it is a separate and more limited determination from that of the Commerce Department. Still, we expect the Trump administration to take some moves to offset the ongoing trade escalation. While we are inclined to think the new tariff will take effect, Huawei will likely get a reprieve in the meantime. This will help to ensure that the September trade talks in Washington, DC go forward. The administration has an interest in keeping the trade negotiations alive. Furthermore, there is some evidence that President Trump is recognizing the need to calm other “trade wars” to mitigate the impact of the central China trade war. In September the administration will attempt ratification of the USMCA in Congress – we still think this is slightly favored to go through. We also expect a U.S.-Japan trade agreement to materialize rapidly – likely at the UN General Assembly from September 17-30. Another positive sign is that the European Union has agreed to expand beef imports from the United States. Real movement on agriculture, while China cancels U.S. ag imports, implies that President Trump is less likely to impose car tariffs on Europe for national security reasons on November 13-14.1 The problem is that the fallout from China’s currency depreciation and the new tariffs will hit the market before anything else, which means we remain tactically bearish. Heightened trade tensions are also likely to spill into the strategic sphere in the near term. Saber-rattling – military shows of force and provocations – will increase the geopolitical risk premium across the globe, especially in East Asia. A frightening U.S.-China clash may ultimately encourage real compromises in the trade negotiations, but the market would get the negative news first. If Washington does not make any reassuring moves but expands the current policy assault on China – including through a Huawei ban – then we will consider shifting to a defensive posture cyclically as well as tactically. Bottom Line: We recognize that President Trump may be forced by the risk of a recession to relax the trade pressure and accept some kind of China deal – we may upgrade this 40% chance if and when the U.S. veers toward an equity bear market. In the meantime we expect further negative fallout from the past week’s aggressive maneuvers by both sides. Currency War Assuming that an equity correction is inevitable at some point and that Trump goes crawling back to the Chinese for trade talks: How will they respond? Will Xi Jinping, the strongman general secretary of a resurgent Communist Party, return to talks and reassure global markets at Trump’s beck and call? Or will he refuse, let the market do what it will, and let Trump hang? By letting the currency drop … Beijing is expressing open defiance. The renminbi’s depreciation – through PBoC inaction on August 5, then through action on August 8 – is a warning that Trump is approaching the point of no return. His initial grievance has always been Chinese “currency manipulation” but until now he has refrained from formally leveling this accusation (only using it on Twitter). By letting the currency drop well beneath the level at which Trump was inaugurated (6.8 CNY-USD), and beyond the global psychological threshold, Beijing is expressing open defiance and threatening essentially to break off negotiations. Chart 5China Sends Warning Via Currency Depreciation
China Sends Warning Via Currency Depreciation
China Sends Warning Via Currency Depreciation
The effect of continued depreciation would be to offset the effect of tariffs and ease financial conditions in China. This is fully in keeping with our view that China has opted for stimulus over reform this year. China is likely to follow up with further cuts to banks’ reserve requirement ratios and a cut to the benchmark policy interest rate (Chart 5). The July Politburo statement showed a greater willingness to stimulate the economy and it occurred prior to Trump’s new volley of tariffs. Currency appreciation is the surest way to rebalance China’s economy toward household consumption and obviate a strategic conflict with the United States. By contrast, yuan depreciation will exacerbate the U.S. trade deficit and give Trump’s Democratic rivals convenient evidence that the “Art of the Deal” is counterfeit. How far will the renminbi fall? Chart 6 updates our back-of-the-envelope calculation of the implication from different tariff scenarios assuming that the equilibrium bilateral exchange rate depreciation will equal the tariffs collected as a share of total exports to the United States. (10% tariff on $259 billion = $25.9 billion, which is 5% of $509 billion total.) The yuan is now approaching Scenario D, 25% tariffs on the first half of imports and 10% on the second half, which points toward 7.6 CNY-USD. There are reasons to believe that this simple framework won’t apply, at least in terms of the magnitude of the impact, but it gives an indication of considerable downward pressure. Chart 6The Yuan Will Fall, But Not Freely
The Yuan Will Fall, But Not Freely
The Yuan Will Fall, But Not Freely
Chester Ntonifor of our Foreign Exchange Strategy sees the yuan falling to around 7.3-7.4 if the new tariffs are applied based on the fact that the 25% tariff on $250 billion worth of goods produced a roughly 10% decline in the bilateral exchange rate. Our Emerging Markets Strategy also expects about a 5% drop in the CNY-USD. Having tightened capital controls during the last bout of depreciation in 2015-16, China is probably capable of controlling the pace of depreciation, preventing capital outflows from becoming a torrent, by selling foreign exchange reserves, further tightening capital controls, or utilizing foreign currency forward swaps. But Asian currencies, global trade revenues in dollars, and EM currencies and risk assets will suffer – and they have more room to break down from current levels.2 Meanwhile even a modest drop in the renminbi – amid a return to dovish monetary policy in global central banks – has revived concerns about a global currency war. A rising dollar is anathema to President Trump, who aims to reduce the trade deficit, encourage the on-shoring of manufacturing, and maintain easy financial conditions for the U.S. economy. Table 1U.S. Demands On China In Trade Talks
The Rattling Of Sabers
The Rattling Of Sabers
Chart 7U.S. Allies' Share Of Treasuries Rises
U.S. Allies' Share Of Treasuries Rises
U.S. Allies' Share Of Treasuries Rises
Trump’s decision to slap a sweeping new tariff on China – reportedly at the objection of all of his trade advisers except the ultra-hawkish Peter Navarro (Table 1) – was at least partly driven by his desire to see the Fed cut rates beyond the 25 basis point cut on July 31 and weaken the dollar. Yet the escalation of the trade war weighs on global trade and growth, which will push the dollar up. This reinforces the above argument that Trump will probably seek to offset the recent trade war escalation with some mitigating moves. Beyond inducing the Fed to cut further, it is difficult for President Trump to drive the dollar down. The Treasury Department can intervene in foreign exchange markets, but direct intervention does not have a successful track record. Interventions usually have to be sterilized (expansion of the money supply externally must be addressed at home by mopping up the new liquidity), which in the context of free-moving global capital means that any depreciation will be short-lived. An unsterilized intervention would be extremely unorthodox and is unlikely short of a major crisis and breakdown in institutional independence. The U.S. could attempt to engineer an internationally coordinated currency intervention, as we have highlighted in the past. But it is highly unlikely to succeed this time around. The U.S. is less dominant of a military and economic power than it was when it orchestrated the Smithsonian Agreement of 1971 and the Plaza Accord of 1985. Neither the European nor the Japanese economies are in a position to tighten monetary policy or financial conditions through currency appreciation. While China weans itself off treasuries, U.S. allies and others fill the void. Indeed, after a long period in which American allies declined as a share total holders of treasuries – as China and emerging markets increased their forex reserves and treasury holdings momentously – allies are now taking a greater share (Chart 7). Chart 8China Diversifies While It Depreciates
China Diversifies While It Depreciates
China Diversifies While It Depreciates
China is driving down the yuan not by buying more treasuries but by buying other things – diversifying away from the USD into alternative reserve currencies and hard assets, such as gold and resources tied to the Belt and Road Initiative (Chart 8). As trade, globalization, and global growth have slowed down, and as China’s growth model and the U.S.-China special relationship expire, global dollar liquidity is shrinking. Dollar liquidity is the lifeblood of the global financial system and the consequence is to tighten financial conditions, including via equity markets (Chart 9). The solution would be a trade deal in which China agrees to reforms to pacify the U.S., including an appreciation renminbi, while the U.S. abandons tariffs, enabling global trade, growth, commodity prices, and dollar liquidity to recover. Yet China was never likely to agree to a new Plaza Accord because it is delaying reform to its economy in order to maintain overall political stability – and the financial turmoil of 2015-16 only hardened this position. Chart 9Dollar Liquidity A Risk To Global Equities
Dollar Liquidity A Risk To Global Equities
Dollar Liquidity A Risk To Global Equities
Moreover Japan in 1985 was already a subordinate ally and had a security guarantee from the United States that was not in question. By contrast, China today is asserting its “equality” as a nation with the U.S., and has no guarantee that Americans are not demanding economic reforms so as to debilitate China’s political stability and strategic capability. After tariffs and currency war comes saber-rattling. Comparing China to Japan in the decades leading up to the Plaza Accord shows how remote of a possibility this solution is: China’s currency has been moving in precisely the opposite direction (Chart 10). Chart 10So Much For Plaza Accord 2.0
So Much For Plaza Accord 2.0
So Much For Plaza Accord 2.0
The Plaza Accord is a useful analogy for another reason: it marked the peak in Japanese market share in the U.S. economy. In Japan’s case, currency appreciation was the primary mover, while Japan also relocated production to the United States. Chart 11The Real Analogy With The Plaza Accord
The Real Analogy With The Plaza Accord
The Real Analogy With The Plaza Accord
In China’s case, if currency appreciation is ruled out and production is not relocated due to a failure to secure a trade agreement, then U.S. protectionism will remain the primary means of capping China’s share of the market (Chart 11). The dollar will remain strong and this will continue to weigh on global markets. Bottom Line: China’s recent currency depreciation is a warning signal to the U.S. that the trade negotiations could be broken off. There is further downside if the U.S. implements the new tariffs or hikes tariff rates further. The renminbi is unlikely to enter a freefall, however, because China maintains tight capital controls and is stimulating its economy. It is doubtful that the Trump administration can engineer a depreciation of the dollar through a multilateral agreement. It lacks the geopolitical heft of the 1970s-80s, and it does not have a strategic understanding with China that would enable Beijing to make the same degree of concessions that Tokyo made in 1985. Saber-Rattling After tariffs and currency depreciation, the next likeliest manifestation of strategic tensions lies in the military sphere.
Chart 12
While the U.S. threatens to cut off Chinese tech companies like Huawei, Beijing has signaled that countermeasures would include an embargo on U.S. imports of rare earth elements and products.3 When China implemented a partial rare earth export ban on Japan (Chart 12), the context was a maritime-territorial dispute in the East China Sea in which military and strategic tensions were also escalating. The threat to industry only amplified these tensions. There are several locations in East Asia where conditions are ripe for clashes and incidents that could add to negative global sentiment. Indeed, saber-rattling has already begun in Hong Kong, Taiwan, the Koreas, and the East and South China Seas. The following areas are the most likely to darken the outlook for U.S.-China negotiations: Direct U.S.-China tensions: The U.S. and China have experienced several minor clashes since the beginning of the Trump administration. The near-collision of a Chinese warship with the USS Decatur occurred in October 2018, after the implementation of the first sweeping tariff on $200 billion worth of goods – a period of tensions very similar to that of today.4 October 1 marks the 70th anniversary of the People’s Republic of China, an event that will be marked by outpourings of nationalism and a flamboyant military parade displaying advanced new weapons. The government in Beijing will be extremely sensitive in the lead-up to this anniversary, leading to tight domestic controls of news and media, hawkish rhetoric, and the potential for provocations on the high seas. Hong Kong and Taiwan: Chinese officials, including the People’s Liberation Army garrison commander in Hong Kong, the director of the Office of Hong Kong and Macao Affairs, and the city’s embattled Chief Executive Carrie Lam have warned in various ways that if unrest spirals out of control, it could result in mainland China’s intervention. A large-scale police exercise in Shenzhen, Guangdong, just across the water, has highlighted Beijing’s willingness to take forceful action. The deployment of mainland troops would likely lead to casualties and could trigger sanctions from western countries that would have common cause on this issue. The Tiananmen Square incident shows that such an event could lead to a non-negligible hit to domestic demand and foreign exports under sanctions (Chart 13). Hong Kong is obviously a much smaller share of total exports to China these days, but when combined with Taiwan – where there could also be a hit to sentiment from Hong Kong unrest and possibly separate economic sanctions – the impact could be substantial (Chart 14). Chart 13Mainland Intervention In Hong Kong Could Prompt Sanctions
Mainland Intervention In Hong Kong Could Prompt Sanctions
Mainland Intervention In Hong Kong Could Prompt Sanctions
Chart 14HK/Taiwan A Significant Share Of Greater China Trade
HK/Taiwan A Significant Share Of Greater China Trade
HK/Taiwan A Significant Share Of Greater China Trade
Why would Taiwan get worse as a result of Hong Kong? Unrest in Hong Kong has already galvanized opposition to the mainland’s policies in Taiwan, where the presidential election polling has shifted in incumbent President Tsai Ing-wen’s favor (Chart 15). Beijing has imposed new travel restrictions and held a number of intimidating military exercises, while the U.S. has increased freedom of navigation operations in the Taiwan Strait. These trends could worsen over the next year. Japan and the East China Sea: Japan’s top military official – General Koji Yamazaki – recently warned that Chinese military intrusions are increasing around the disputed Senkaku (Diaoyu) islands in the East China Sea. He called particular attention to China’s change of the Coast Guard from civilian to military control, which he said posed new risks of escalation in disputed waters. Japan itself may have an interest in a more confrontational stance over the coming year. The Japanese government has seen a rise in public opposition to its plan to revise the constitution to enshrine the Self-Defense Forces and thus move toward a more “normal” Japanese military and security posture (Chart 16).
Chart 15
Chart 16
A revival of trouble in the South China Sea: China has not reduced its assertive foreign policy in order to win regional allies amid its conflict with the United States. On the contrary, it has continued asserting itself to the point of alienating governments that have largely sought to warm up to the Xi administration, including both Vietnam and the Philippines. The Vietnamese have engaged in a month-long standoff over alleged Chinese encroachments in its Exclusive Economic Zone. And a clash near Sandy Cay in the Spratly Islands is forcing Philippine President Rodrigo Duterte, who has otherwise avoided confrontation with China, to address President Xi over the international court decision in 2016 that ruled out China’s claims of sovereignty over the disputed islands. The South China Sea is important because it is a vital supply line for all of the countries in the region. Even if the United States washed its hands of Beijing’s efforts to control the sea lanes, U.S. allies would still face a security threat that would drive tensions in these waters. This is a formidable group of Asian nations that China fears will seek to undermine it (Chart 17). And of course the Americans are not washing their hands of the region but actually reasserting their interest in maintaining a western Pacific defense perimeter. The Korean peninsula: North Korea has resumed testing short-range missiles, causing another hiccup in U.S. attempts at diplomacy (Chart 18). These tensions have the potential to flare as the U.S.-China trade talks deteriorate, since Beijing has offered cooperation on North Korea’s missile and nuclear program as a concession. Chart 17U.S. Asian Allies Formidable
U.S. Asian Allies Formidable
U.S. Asian Allies Formidable
Chart 18North Korean Provocations Still Low-Level
North Korean Provocations Still Low-Level
North Korean Provocations Still Low-Level
Ultimately North Korea needs to be part of the U.S.-China solution, so as long as tensions rise it sends a negative signal regarding the status of talks. And vice versa. South Korea is another case in which China is not reducing its foreign policy aggressiveness in order to win friends. On July 23, a combined Russo-Chinese bomber exercise over the disputed Dokdo (Takeshima) islands in the Sea of Japan led to interception by both Korean and Japanese fighter jets and the firing of hundreds of warning shots. The incident reveals that South Korean President Moon Jae-in is not seeing an improvement in relations with these countries despite his more pro-China orientation and his attempt to engage with North Korea. It also shows that while South Korea’s trade spat with Japan can persist for some time, it may take a back seat to these rising security challenges. As long as North Korean tensions rise it sends a negative signal regarding U.S.-China talks. Chart 19Russia May Need To Distract From Domestic Unrest
Russia May Need To Distract From Domestic Unrest
Russia May Need To Distract From Domestic Unrest
Russia, like China, is feeling immense domestic political pressure, including large protests, that may result in greater foreign policy aggression (Chart 19). And as China and Russia tighten their informal alliance in the face of a more aggressive U.S., American allies face new operational pressures and the potential for geopolitical crises will rise. Bottom Line: The whole panoply of East Asian geopolitical risks is heating up as U.S.-China tensions escalate. While the U.S. and China may engage in direct provocations or miscalculations, their East Asian neighbors are implicated in the breakdown of the regional strategic order. A crisis in any of these hotspots could jeopardize the already unfavorable context for any U.S.-China trade deal over the next year, especially during rough patches like the very near term. Investment Implications Chart 20A Strategic Investment
A Strategic Investment
A Strategic Investment
The potential for saber-rattling in the near term – on top of a series of critical U.S. decisions that could mitigate or exacerbate the increase in tensions surrounding the new tariff hike – argues strongly against altering our tactically defensive positioning at the moment. In this environment we advise clients to stick with our two strategic defense plays – long the BCA global defense basket in absolute terms, and long S&P500 Aerospace and Defense equities relative to global equities. The U.S. Congress’s newly agreed bipartisan budget deal provides a substantially improved fiscal backdrop for American defense stocks, which are already breaking out amid positive fundamentals. A host of non-negligible geopolitical risks speaks to the long-term nature of this trade (Chart 20). Our U.S. Equity Strategy recently reaffirmed its bullish position on this sector. We maintain that the U.S. and China have a 40% chance of concluding a trade agreement by November 2020. Note, however, that even a “no deal” scenario does not entail endless escalation. Presidents Trump and Xi could agree to another tariff ceasefire; negotiations could even lead to some tariff rollback in 2020. That would be, after all, Trump’s easiest way to “ease” trade policy amid recession risks. Nevertheless, our highest conviction call is not about whether there will be a deal, but that any trade truce that is reached will be shallow – an attempt to mitigate the trade war’s damage, save face, and bide time for the next round in U.S.-China conflict. We give only a 5% chance of a “Grand Compromise” by November 2020 that greatly expands the U.S.-China economic and corporate earnings outlook over the long haul. In this sense the ultimate trade deal will be a disappointment for markets. Matt Gertken, Vice President Geopolitical Strategist mattg@bcaresearch.com Footnotes 1 At the signing ceremony President Trump reminded his European interlocutors that the risk of car tariffs is not yet off the table. He concluded the celebration saying, “Congratulations. And we’re working on deal where the European Union will agree to pay a 25 percent tariff on all Mercedes-Benz’s, BMWs, coming into our nation. So, we appreciate that. I’m only kidding. (Laughter.) They started to get a little bit worried. They started — thank you. Congratulations. Best beef in the world. Thank you very much.” 2 See Emerging Markets Strategy Weekly Report, “EM: Into A Liquidation Phase?” August 8, 2019, ems.bcaresearch.com. 3 The national rare earth association holding a special working meeting and pledging to support any countermeasures China should take against U.S. tariffs. See Tom Daly, “China Rare Earths Group Supports Counter-Measures Against U.S. ‘Bullying,’” Reuters, August 7, 2019. 4 Military tensions are already heating up as Beijing criticizes the U.S. over the new Defense Secretary Mark Esper’s claim during his Senate confirmation hearings that new missile defense may be installed in the region in the coming years. This comes in the wake of the U.S. withdrawal from the 1987 Intermediate-Range Nuclear Forces Treaty, partly due to China’s not being a signatory of the agreement. Missile defense is a long-term issue but these developments feed into the current negative atmosphere.