Fiscal

Highlights Global equity markets have managed to recoup some of last year’s plunge since we upgraded stocks to overweight in late December. The equity rally has been tentative, however, and so far feels more like a technical bounce from oversold levels than a resumption of the bull market. One driving factor behind last year’s market swoon was that policy uncertainty spiked at a time when the last pillar of global growth, the U.S., was showing signs of cracking. Investors thus welcomed the Fed’s signal that it would pause in March. Nonetheless, shrinkage in the Fed’s balance sheet is proving to be troublesome. Quantitative tightening does not necessarily imply permanently higher risk premia, but it will be a source of volatility. There are hopeful but tentative signs that a U.S. slowdown is not the precursor to a recession. The hit to GDP from the U.S. government shutdown will be reversed next quarter. The FOMC has also signaled that policymakers are attuned to the economic risks associated with tightening financial conditions, and that the calm inflation backdrop provides room to maneuver. The FOMC will stand pat in March, but should restart rate hikes in June as the economic soft patch ends. We still see only a modest risk of a U.S. recession this year. In contrast, our outlook for growth outside the U.S. remains downbeat for at least the first half of the year. Among the advanced economies, Japan and Europe are being the most affected by the Chinese economic slowdown and global trade tensions. This means that monetary policy divergence will continue to be a tailwind for the dollar. China continues to stimulate at the margin, but efforts so far have been insufficient to put a floor under growth. The contraction in Chinese exports has just begun. It is still too early to upgrade EM assets or base metals. Despite the cloud still surrounding Brexit, sterling is beginning to look attractive as a long-term punt. Our decision to upgrade corporate bonds to overweight this month, similar to our reasoning for upgrading equities in December, is based on improved value and a sense that investor pessimism had become excessive. Just as the selloff in risk assets was overdone, so too was the rally in government bonds. It is highly unlikely that the Fed is done tightening, as is currently discounted in the money market curve. A resumption of Fed rate hikes around mid-year means that the 10-year Treasury yield will move back above 3% by year end. Feature Global equity markets have managed to recoup some of last year’s plunge since we upgraded the asset class back to overweight in the latter half of December. A decline in the VIX and high-yield bond spreads are also positive signs that global risk appetite is recovering, following an overdone investor ‘panic attack’ last quarter. The equity rally has been tentative, however, and so far feels more like a simple technical bounce from oversold levels than a resumption of the bull market. One problem is that policy uncertainty has spiked at a time when the last pillar of global growth, the U.S., is showing signs of cracking (Chart I-1). Investors are skittish while they await a clear de-escalation of U.S./China trade tensions, an end to the U.S. economic soft patch, an end to the U.S. government shutdown, and signs that global growth is bottoming (especially in China). There has only been some modestly positive news on a couple of these issues. Chart I-1Policy Uncertainty Has Spiked
Policy Uncertainty Has Spiked Watch Policy Uncertainty
Policy Uncertainty Has Spiked Watch Policy Uncertainty
Another factor that appeared to play a role in last quarter’s market swoon is the fear that the end of asset purchases by the European Central Bank and the normalization of the Fed’s balance sheet necessarily imply a structural de-rating for all risk assets. A related worry is that the de-rating might intensify the global economic slowdown, resulting in a self-reinforcing negative feedback loop. Does QT Imply Lower Multiples? The question of balance sheet normalization is a difficult one because there is widespread disagreement on how, or even whether, quantitative easing (QE) works. We have always maintained that QE was not about creating a wave of central bank liquidity that flowed into asset prices. Central banks did not “print money” – they created bank reserves. These reserves did not result in a major acceleration in broader measures of money growth, including M1 and M2, largely because there was little demand for loans and because banks tightened lending standards. In other words, the credit channel of monetary policy was broken. The implication is that investors should not worry that quantitative tightening (QT) implies a withdrawal of central bank liquidity that must mechanically come from the sale of risk assets. Rather, we believe that QE operates mostly through the portfolio balance effect. There are two ways to think about this channel. First, the central bank forced investors to move into riskier assets by purchasing large amounts of “safe” assets, such as government bonds. Investors had little choice but to redeploy the capital into other riskier areas, pushing up asset prices. The second perspective is that central bank purchases of government bonds depressed both the yield curve and bond volatility. Volatility fell because investors could forecast the policy rate with certainty – it would be glued to zero (or negative) for the foreseeable future in most of the advanced economies. This is akin to strong forward guidance that flattened the yield curve. Aggressive monetary stimulus, such as QE, also helped to reduce the perceived risk that the economy would succumb to secular stagnation or fall back into recession. Reduced bond volatility, lower bond yields, and less economic risk all increased the attractiveness of the riskier asset classes. These explanations represent two sides of the same coin. Either way, QE boosted a broad array of asset prices. If this is true, then unwinding QE must be bearish for risk assets, all else equal. In the case of the U.S., the fed funds rate is much more difficult to forecast than was the case when the Fed was buying bonds. Higher yields and bond volatility imply a lower equilibrium multiple in the equity market and wider equilibrium corporate bond spreads. Nonetheless, all else is not equal. If interest rates and bond volatility are rising in the context of healthy economic and profit growth, then it is likely that the perceived risk of secular stagnation is falling. It would be a sign that the economy has finally put the financial crisis firmly in the rear-view mirror. It could be the case that the upgrade in economic confidence overwhelms the negative impact of the reverse portfolio balance effect related to quantitative tightening, allowing risk assets to rise. No one can prove this thesis one way or the other and we are not making the case that unwinding the Fed’s balance sheet will necessarily go smoothly, especially since interest rates are rising at the same time. The problem is that both investors and the Fed are trying to figure out where the neutral fed funds rate lies. If the so-called level of R-star is still very low, then the Fed might have already made a policy mistake by raising rates too far. We discussed in last month’s Overview the market implications of four scenarios for the level of R-star and the Fed’s success in correctly guessing it. If the economy holds up and the economic soft patch ends in the coming months as we expect, then investors will revise their estimate of the neutral rate higher and risk assets will rally even as bond yields rise. The Doom Loop One risk to our base-case scenario is the so-called financial conditions “doom loop”. Irrespective of whether or not QT is playing a role, the doom loop scenario involves a shock to investor confidence that leads to a tightening in financial conditions and market liquidity as stock prices fall and credit spreads widen. More onerous financial conditions, in turn, undermine economic activity, which then feeds back into even tighter financial conditions. One could make the argument that risk assets are even more exposed to this type of negative feedback loop today than in past monetary tightening cycles because of program trading, the Fed’s balance sheet shrinkage and investors’ lingering shell shock from the Great Recession and financial crisis. Nonetheless, there are a few mitigating factors to consider. We believe that a doom loop is more likely to unfold when economic growth becomes very sensitive to changes in financial conditions. This normally happens when economic and financial imbalances are elevated. On a positive note, unlike in the lead-up to the last two recessions, the U.S. private sector is a net saver whose income outstrips spending by 2.1% of GDP (Chart I-2). The highly cyclical parts of the U.S. economy are not stretched to the upside as a share of GDP, reducing the risk that overspending in one part of the economy will required a deep contraction to correct the imbalance (Chart I-3). Chart I-2U.S. Private Sector: A New Saver
U.S. Private Sector: A New Saver The U.S. Private Sector Is A Net Saver
U.S. Private Sector: A New Saver The U.S. Private Sector Is A Net Saver
Chart I-3U.S. Cyclical Spending Not Extended
U.S. Cyclical Spending Not Extended
U.S. Cyclical Spending Not Extended
In terms of financial excesses, the good news is that the U.S. household sector is in its best shape in decades. Our main concern is debt accumulation in the corporate sector. We reviewed the related risks in a Special Report published in the November 2018 issue.1 We concluded that corporate leverage will not cause the next U.S. recession, because high levels of debt will only become a problem when profits begin to contract (i.e. when the economic downturn is already underway). Nonetheless, when a recession does occur, corporate spreads will widen by more than in the past for any given degree of economic contraction (see below). ‘Fed Put’ Still In Play Another factor that tempers the risk of a doom loop is that the so-called ‘Fed Put’ is still operating. The December FOMC Minutes and comments by various FOMC members communicated to investors that the Fed is attuned to the economic risks associated with tightening financial conditions, and that the calm inflation backdrop provides policymakers with room to maneuver. Chair Powell even said he was willing to adjust the Fed’s balance sheet run-off if necessary. One important reason for policymakers’ willingness to be flexible is that the fed funds rate is still not far from the zero-lower-bound, making it potentially more difficult for the FOMC to respond adequately in the event of a recession this year because the fed funds rate can only be cut by 250 basis points. Several U.S. data releases have been delayed due the government shutdown, but what has been released has been mixed. The downdraft in the January reading of the manufacturing ISM was eye-opening, highlighting that the global manufacturing slowdown has reached U.S. shores. The good news is that the non-manufacturing ISM and the small business survey, although off their peaks, remain consistent with solid underlying growth. The December U.S. payroll report revealed that wage growth continued to accelerate on the back of gangbusters job creation at the end of the year. There have also been some recent hints that the soft patch in capital spending and housing is ending (Chart I-4). Existing home sales fell sharply in December, but extremely low inventories suggest that it is more of a supply than a demand problem. The impressive bounce in home mortgage applications for purchases is a hopeful sign. U.S. commercial and industrial loan growth is also accelerating. Chart I-4Some Tentative Signs
Some Tentative Signs
Some Tentative Signs
These tentative signs that the economic soft patch is close to an end will not be enough to get the FOMC to tighten in March, after so many members have gone out of their way to signal a pause in recent weeks. Nonetheless, we believe the economy will remain strong enough for the Fed to resume hiking in June. The U.S. government shutdown will complicate interpreting incoming economic data. Ultimately, while its impact on Q1 real GDP growth will be non-trivial, it will be reversed the following quarter and we do not expect any permanent damage to be done. U.S. inflation should edge higher by mid-year, supporting our view that the Fed will resume tightening in June. The decline in oil prices will continue to feed into a lower headline inflation rate in the coming months, but that does not mean that the core rate will fall. Indeed, core CPI has increased by roughly 0.2% in each of the past three months, translating into an annualized rate of approximately 2.4%. Base effects will depress annual core inflation in February but, thereafter, this effect will begin to reverse. The acceleration in wage growth according to measures such as average hourly earnings and the Employment Cost Index highlights that underlying inflationary pressures continue to percolate (Chart I-5). The implication is that the Treasury bond market is overly complacent in discounting that the fed funds rate has peaked for the cycle. Chart I-5U.S. Wage Pressure Is Percolating
U.S. Wage Pressure Is Percolating
U.S. Wage Pressure Is Percolating
Looking further ahead, our base case remains that the next U.S. recession will not occur until 2020, and will be the result of tighter fiscal policy and further Fed tightening that takes short-term rates a step too far. No Bottom Yet For Global Growth Our outlook for growth outside the U.S. remains downbeat for at least the first half of the year. Our global economic indicators still show no sign of a turnaround, except for a bottoming in the diffusion index based on BCA’s Global Leading Economic Indicator (Chart I-6). The global ZEW economic sentiment index continued to fall in January, while business and consumer confidence readings in the advanced economies eroded heading into year end. Chart I-6Global Leading Indicators Still Deteriorating
Global Leading Indicators Still Deteriorating Global Growth Is Still Moderating...
Global Leading Indicators Still Deteriorating Global Growth Is Still Moderating...
A better global growth dynamic awaits more serious policy stimulus in China. Real GDP growth decelerated further to 6.4% year-over-year in the last quarter of 2018. This is no disaster, but the point is that there are still no signs of stabilization. The Chinese authorities continue to tweak the policy dials at the margin, most recently providing some tax cuts and a liquidity injection into the banking system. Nonetheless, the central government has so far abstained from stimulating the property market due to existing speculative excesses. This is very different from the previous two policy easing episodes, including 2015/16 (Chart I-7). Chart I-7China: No Property Market Stimulus...
China: No Property Market Stimulus...
China: No Property Market Stimulus...
The stimulus undertaken so far has been insufficient in terms of putting a floor under growth according to our 12-month Credit Impulse (Chart I-8). It is a hopeful sign that broad money growth is trying to bottom, but this does not guarantee that the credit impulse is about to turn. The latter is required to confirm that Chinese import demand will accelerate, providing a lift to EM exporters, EM asset prices and commodity prices. Without a positive credit impulse, China’s investment and construction activity will continue to moderate, leading to lower imports of machinery and raw materials. Chart I-8...And No Credit Impulse
...And No Credit Impulse
...And No Credit Impulse
The economic situation in China is likely to get worse before it gets better. Dismal trade figures in December confirmed that the trade war is beginning to bite. The period of export ‘front-running’ related to higher U.S. tariffs is over as total exports fell by 4.4% year-over-year. Last year’s collapse in export orders indicates that the woes are just beginning. In turn, moderating production related to the Chinese export sector will bleed into domestic consumption and imports, suggesting that it is too early to expect a durable rally in EM assets or commodity prices. Lackluster Chinese demand and growing trade concerns have weighted on global business confidence, contributing to the pullback in capital goods orders, manufacturing PMIs and industrial production in the advanced economies (Chart I-9). Even the average service sector PMI and consumer confidence index in the advanced economies have fallen in recent months, although both remain at a high level. Chart I-9The Fallout From Trade
The Fallout From Trade
The Fallout From Trade
Europe and Japan, in particular, are feeling the pinch. German GDP only grew 1.5% in 2018, implying that Q4 GDP growth was in the vicinity of just 0.2% QoQ. Meanwhile, European industrial production contracted by 3.3% year-over-year in December. The German Ifo and ZEW surveys do not point to any significant improvements in this trend. A few idiosyncratic factors explain some of this poor performance, including new emissions testing standards that have weighted on the German auto industry, a tightening in financial conditions in Italy, and the ‘gilets jaunes’ protests in France. Nonetheless, the euro area slowdown cannot be fully explained by one-off factors. The economy is highly sensitive to global trade fluctuations given that 18% of the euro area’s gross value added is generated in the manufacturing sector. Hence, China’s poor economic health has been painful for Europe, and the trend in Chinese credit does not bode well for the near term (Chart I-10). The European Central Bank (ECB) is likely to stay on the defensive as a result, especially as euro area core inflation, which has been stuck near 1% for three years, is unlikely to pick up if growth remains on the back foot. The ECB stuck with the view that the economic soft patch is temporary after the January policy meeting, but policymakers will consider providing more stimulus in March if the economy does not pick up (using forward guidance or a new TLTRO). This will weigh on the euro. Chart I-10China's Woes Are Infecting Europe
China's Woes Are Infecting Europe
China's Woes Are Infecting Europe
Japan is suffering from similar ills. Exports are no longer growing, and foreign machinery and factory orders are contracting at a 4.1% and 4.3% pace, respectively. This weakness is not mimicked in domestic growth, but the disproportionate contribution of the external sector to Japan’s overall economic health means that this country is also falling victim to the malaise witnessed in China and emerging markets, the destination of 19% and 45% of Japanese shipments, respectively (Chart I-11). Collapsing oil prices and a firming trade-weighted yen have amplified this deflationary backdrop. It is therefore far too early to bet that the Bank of Japan will tighten the monetary dials. Chart I-11Japan Hit By The Chinese Cold As Well
Japan Hit By The Chinese Cold As Well
Japan Hit By The Chinese Cold As Well
If we are correct that the U.S. economic soft patch will soon end, then the dollar will once again look to be the best of a bad lot. Interest rate expectations will move in favor of the dollar. We expect the dollar to rise by about 6% this year on a trade-weighted basis, appreciating most strongly against the AUD and SEK. As for sterling, it is beginning to look attractive as a long-term punt. Brexit Deadlock We are a month closer to the end-March deadline and a Brexit deal seems even farther out of reach. It could play out in one of three ways: (1) a “no deal” where the U.K. leaves the EU with no alternative in place; (2) a “soft Brexit” involving an agreement to form a permanent customs union or some sort of “Norway plus” arrangement; or (3) a decision to reverse the results of the original referendum and stay in the EU. There is no support for the “no deal” option in Parliament, which means that it won’t happen. We do not have a strong view on which of the latter two scenarios will occur. The odds of another referendum are rising and the polls are swinging away from any sort of Brexit, suggesting that the original referendum result may be over-turned via another referendum (Chart I-12). Nonetheless, for investors, it does not matter much whether it is scenario 2 or 3; either outcome would be welcomed by markets. Overweight sterling positions are attractive as a long-term play, although it could be some time before the final solution emerges. Chart I-12Brexit Result May Be Overturned
Brexit Result May Be Overturned
Brexit Result May Be Overturned
Upgrade Corporate Bonds To Overweight Given the recent global economic dynamics, it is perhaps surprising that U.S. corporate financial health actually improved in 2018 according to our Corporate Health Monitors (CHM). We highlighted in the aforementioned Special Report the risks facing U.S. corporate bonds when the economic expansion ends. High levels of corporate leverage mean that the interest coverage ratio for the median corporation in the Barclays-Bloomberg index will plunge to near or below all-time historic lows. The potential for a large wave of fallen angels implies that downgrade activity will be particularly painful for corporate bond investors. The surge in lower-quality issuance has led to a downward trend in the average credit rating and has significantly raised the size of the BBB-rated bonds relative to the IG index and relative to the broader universe of corporate bonds. Moreover, poor market liquidity and covenant erosion will intensify pressure for corporate spreads to widen when the bear market arrives. Rapid debt accumulation is reflected in our bottom-up Corporate Health Monitors (CHM) for the U.S. investment-grade and high-yield sectors (Chart I-13). The CHMs are constructed from six financial ratios that the rating agencies use when rating individual companies. The companies in our bottom-up sample were chosen so as to mimic the sector and quality distribution in the Bloomberg-Barclay’s corporate bond index. Chart I-13U.S. Corporate Health
U.S. Corporate Health
U.S. Corporate Health
The debt-to-book-value of equity ratio for both the U.S. IG and HY sample of companies has risen to nose-bleed levels, although the ratio appears to have flattened off for the latter. Despite rising leverage, the HY CHM has shifted into “improved health” territory and the IG CHM is on the verge of doing the same. Last year’s upturn in the profitability measures, such as the return on capital, overwhelmed the deteriorating leverage trend. In Europe, where we distinguish between domestic and foreign issuers, rising leverage has been concentrated among the latter until recently (Chart I-14). In any event, the CHM for both types of issuers is close to the neutral zone. Chart I-14Euro Area Corporate Health
Euro Area Corporate Health
Euro Area Corporate Health
Improving U.S. corporate health on its own would not justify increasing exposure to corporate bonds within balanced portfolios or moving down in quality. Profit growth is likely to moderate this year, especially in Europe, such that last year’s improvement in corporate health is likely to reverse. And, as previously discussed, the economic cycle is well advanced and this sector is particularly vulnerable to a recession. Nonetheless, value has improved enough to warrant a tactical upgrade to overweight within fixed-income portfolios, at a time when the FOMC has signaled a pause and the next recession is at least a year away. Implied volatility should continue to moderate and spreads should narrow, similar to dynamics in 2016, the last time that the Fed signaled patience following a period of market turmoil (Chart I-15). Chart I-15Fed Patience To Narrow Spreads
Fed Patience To Narrow Spreads
Fed Patience To Narrow Spreads
Spreads have already narrowed from the peak in late December, but 12-month breakeven spreads for most credit tiers are all still close to or above their historical means, except for AA-rated issues (Chart I-16). For example, the 12-month breakeven spread2 for the Baa credit tier is 46%. This means that the spread has been tighter than its current level 46% of the time since 1988 and wider than its current level 54% of the time. Historically, spreads tend to hover within the tight-end of their historical range during this phase of the credit cycle, and only cheapen significantly when the yield curve inverts and the default rate moves higher. Chart I-16Value Restored In IG Corporates...
Value Restored In IG Corporates...
Value Restored In IG Corporates...
For U.S. high yield, our estimate of the spread adjusted for expected defaults has risen to 237 bps (Chart I-17). This implies that investors are discounting a 2019 default rate of 3.2%, in line with Moody's forecast. Since we do not foresee recession this year, high-yield bonds are not expensive enough to be avoided within a portfolio. Chart I-17...And In HY Too
...And In HY Too
...And In HY Too
Value has also improved in the European corporate bond market, but our global fixed-income team still recommends favoring the U.S. market for global credit investors. Leverage is higher in the U.S., especially relative to domestic issuers in Europe, but the U.S. economic and profit outlook for 2019 is better. Conclusions Our decision to upgrade corporate bonds this month, similar to our reasoning for upgrading equities to overweight in December, is based on improved value and a sense that investor pessimism had become excessive. For the equity market, the S&P 12-month forward P/E is an attractive 15.4 as we go to press, and bottom-up estimates for 2019 EPS have been slashed to a very reasonable 8%. Just as the selloff in risk assets late last year was overdone, so too was the rally in government bonds. It is highly unlikely that the Fed is done tightening. A resumption of Fed rate hikes, probably in June, means that the 10-year Treasury yield will move back above 3% by year end. Across the major countries, market expectations for yields 5-10 years from now are close to current levels, which is extremely complacent (Chart I-18). Investors should keep duration short of benchmark. Chart I-18Forward Rates Far Too Low
Forward Rates Far Too Low
Forward Rates Far Too Low
Our shift to overweight in both equities and corporate bonds is tactical in nature. We fully expect to move back to neutral and then to underweight later this year or into 2020, as the peak in U.S. GDP draws nearer. Timing will be difficult as always, which means that investors should be prepared to trim risk exposure earlier than implied by our base-case economic timeline. The tactical upgrade does not imply that we have become more sanguine on the economic and geopolitical risks for 2019. We do not believe that quantitative tightening or U.S. corporate leverage will truncate the U.S. expansion prematurely. Nonetheless, there is a plethora of other risks to keep us up at night. These include a Fed policy mistake, a hard economic landing in China, a full-blown financial crisis in Italy and an escalation in U.S./China trade tensions. The last one has diminished marginally in probability. We have a sense that the recent equity market downdraft unnerved President Trump, such that he now has a diminished appetite for upsetting investors with talk of an escalating trade war ahead of next year’s election. Outside of these well-known risks, our geopolitical team has recently published its “Black Swans” report for 2019. These are deemed to be risks that are off of most investors’ radar screens, but that would have profound implications if they were to occur: It is premature to expect armed conflict over Taiwan, but an outbreak of serious tensions between China and Taiwan is possible as Sino-American strategic distrust continues to build. Russia and Ukraine may have a shared incentive to renew hostilities this year. Saudi Arabia has received a “blank cheque” from Donald Trump, and thus it may continue to be provocative. This could boost the geopolitical risk premium in oil prices. Tensions are building in the Balkans. A renewed conflict on Europe’s doorstep could be the next great geopolitical crisis. A “Lame Duck” Trump could stage a military intervention in Venezuela. We encourage interested readers to see our Special Report for details.3 As for emerging market assets and base metals, we continue to shy away until we receive confirmation that China is aggressively stimulating. We expect better news on this front by mid-year, but watch our China Credit Impulse indicator for timing. In contrast, investors should be overweight oil and related assets now because our commodity specialists still see the price of Brent rising above US$80/bbl sometime this year. Recent political turmoil in Venezuela buttresses our bullish oil view. Finally, this month’s fascinating Special Report, penned by BCA’s Chief Global Strategist, Peter Berezin, examines the long-term implications of the peaking in the average IQ in the advanced economies. Average intelligence is falling for both demographic and environment reasons. The impact will be far from benign, potentially leading to lower productivity growth, lower equity multiples, larger budget deficits and higher equilibrium bond yields. The report begins on page 20. Mark McClellan Senior Vice President The Bank Credit Analyst Mathieu Savary Vice President Foreign Exchange Strategy January 31, 2019 Next Report: February 28, 2019 II. The Most Important Trend In The World Has Reversed And Nobody Knows Why After rising for thousands of years, human intelligence has begun to decline in developed economies. This can be seen in falling IQ scores and a decline in math and science test scores. Environmental factors appear to account for the bulk of this decline, but no one knows what these factors are. If left unchecked, falling intelligence will severely undermine productivity growth. This could lead to lower equity multiples, larger budget deficits, and ultimately, much higher government bond yields. Technological advances, particularly in the genetic realm, promise to radically raise IQs. In a complete abandonment of its one-child policy, China will combine these controversial technologies with pro-natal measures in order to boost sagging birth rates. The coming Eugenic Wars will be one of the most important economic and geopolitical developments of the 21st century. Part 1: What The Tame Fox Says In 1959, a Soviet scientist named Dmitry Belyaev embarked on an ambitious experiment: to domesticate the silver fox. A geneticist by training, Belyaev wanted to replicate the process by which animals such as cats and dogs came to live side-by-side with humans. It was a risky endeavor. The Soviets had essentially banned the study of Mendelian genetics in favor of the blank slate ideology that is popular in progressive circles today. Belyaev persevered. Working under the guise of studying vulpine physiology, he selected foxes based on only one trait – tamability. Less than 10% of foxes made it to the subsequent generation, with the other 90% being sent off to fur farms. By the fourth generation, the changes were undeniable. Rather than fleeing humans, the foxes sought out their attention with no prompting whatsoever. They even wagged their tails and whined and whimpered like dogs do. The tame foxes also displayed physical changes. Their ears flopped over. Their snouts became shorter and their tails stood upright. "By intense selective breeding, we have compressed into a few decades an ancient process that originally unfolded over thousands of years," wrote Lyudmila Trut, who began as Belyaev’s assistant and took over the project when her boss died in 1985. Genetically Capitalist? Evolution can broadly proceed in two ways. The first way is through random mutations. This form of evolution, which scientists sometimes refer to as genetic drift, can take thousands of years to yield any discernable changes. The second way is through natural selection, a process that exploits existing variations in genetic traits. As the Russian fox experiment illustrates, evolution driven by selective pressures (either natural or artificial) can occur fairly quickly. Did selective pressures manifest themselves in human evolution in the lead up to the Industrial Revolution? Did humans, in some sense, domesticate themselves? In his book, A Farewell To Alms, economic historian Gregory Clark argued in the affirmative. Clark documented that members of skilled professions in Medieval England had twice as many surviving children as unskilled workers (Chart II-1). Indeed, the fledgling middle class of the time had even more surviving children than the aristocracy, who were often out fighting wars. As a result, the wages of craftsmen declined by a third relative to laborers between 1200 and 1800, implying that the supply of skilled labor was growing more quickly than the demand for skilled workers over this period.
The Most Important Trend In The World Has Reversed And Nobody Knows Why
The Most Important Trend In The World Has Reversed And Nobody Knows Why
In subsequent work, Clark and Neil Cummins argued that the spread of bourgeois values across pre-industrial England was more consistent with a model of genetic transmission than a cultural one (see Box II-1 for details). Similar developments occurred in other parts of the world. For example, in China, the gateway into the bureaucracy for a thousand years was the highly competitive imperial exam. Xi Song, Cameron Campbell, and James Lee showed that high-status men had more surviving children during the eighteenth- and nineteenth-centuries (Chart II-2).4
The Most Important Trend In The World Has Reversed And Nobody Knows Why
The Most Important Trend In The World Has Reversed And Nobody Knows Why
The 10,000 Year Explosion Stephen Jay Gould famously said that “There’s been no biological change in humans in 40,000 or 50,000 years. Everything we call culture and civilization we’ve built with the same body and brain.” Gould was wrong. Data from the International HapMap Project show that human evolution accelerated by 100-fold starting around 10,000 years ago (Chart II-3).
The Most Important Trend In The World Has Reversed And Nobody Knows Why
The Most Important Trend In The World Has Reversed And Nobody Knows Why
In their book The 10,000 Year Explosion: How Civilization Accelerated Human Evolution, Gregory Cochran and the late Henry Harpending explained why evolution sped up so rapidly.5 The advent of agriculture led to a surge in population levels. This, in turn, increased the absolute number of potentially beneficial genetic mutations that could be subject to selection effects. Farming and the rise of city states also completely reshaped the environment in which people lived. Basic biology teaches us that environmental dislocations of this kind tend to generate selective pressures that cause evolution to accelerate. John Hawks, professor of anthropology and genetics at the University of Wisconsin-Madison, put it best: “We are more different genetically from people living 5,000 years ago than they were different from Neanderthals.” Many of the changes to our genomes relate to diet and diseases. The various genetic resistances that people have built up to malaria are all less than 10,000 years old. Mutations to the LCT gene, which confers lactose tolerance into adulthood, occurred independently in three different geographical locations: one in East Asia, one in the Middle East, and one in Africa. The Middle Eastern variant was probably responsible for the rapid enlargement of the Indo-European language group, which now stretches from India to Ireland. The African variant likely facilitated the Bantu expansion, which started near the present-day border of Nigeria and Cameroon, and then spread out across almost all of sub-Saharan Africa. Evolution Of The Human Brain About half of the genes in the human genome regulate some aspect of brain function. Given the rapid acceleration in evolution, it would be rather surprising if our own brains had not been affected. And indeed, there is plenty of evidence that they were. The frontal lobe of the brain has increased in size over the past 10,000 years. This is the part of the brain that regulates such things as language, memory, and long-term planning. Testosterone levels have also declined. That may explain the steady reduction in violent crime rates (Chart II-4).
The Most Important Trend In The World Has Reversed And Nobody Knows Why
The Most Important Trend In The World Has Reversed And Nobody Knows Why
We know that certain genes that are associated with higher intelligence have been under recent selective pressure. For example, the gene that leads to torsion dystonia – a debilitating movement disorder – appears to have increased in frequency. Why would a gene that causes a known disease become more widespread? The answer is that individuals who have this particular mutation tend to have IQs that are around 10-to 20-points above the population average. Why IQ Matters IQ has a long and contentious history. Yet, despite numerous efforts to jettison the concept, it has endured for one simple reason: It has more predictive power than virtually anything else in the psychological realm. A simple 30-minute IQ test can help predict future educational attainment, job performance, income, health, criminality, and fertility choices (Table II-1 and Chart II-5). IQ even predicts trader performance!6
The Most Important Trend In The World Has Reversed And Nobody Knows Why
The Most Important Trend In The World Has Reversed And Nobody Knows Why
The Most Important Trend In The World Has Reversed And Nobody Knows Why
The Most Important Trend In The World Has Reversed And Nobody Knows Why
Like most physiological traits, IQ is highly heritable.7 The genetic contribution to IQ increases from 20% in early childhood to as high as 80% by one’s late teens and remains at that level well into adulthood.8 This makes IQ almost as heritable as height (Chart II-6).
The Most Important Trend In The World Has Reversed And Nobody Knows Why
The Most Important Trend In The World Has Reversed And Nobody Knows Why
Although there is a great deal of variation among individuals, on average, more intelligent people earn higher incomes (Chart II-7). If the same relationship existed in the pre-industrial era, as seems likely, then human intelligence probably increased in a way that facilitated the economic explosion that we associate with the Industrial Revolution. The stunning implication is that the emergence of the modern era was a question of “when, not if.”
The Most Important Trend In The World Has Reversed And Nobody Knows Why
The Most Important Trend In The World Has Reversed And Nobody Knows Why
Part 2: The Flynn Effect By the late-19th century, it had become clear that the rich were no longer having as many children as the poor. This realization, together with the growing popularity of Darwin’s theories, helped galvanize the eugenics movement. Contrary to popular belief, this movement was not a product of the far-right. In fact, the most vocal proponents of eugenics were among the progressive left. John Maynard Keynes, for example, served as the Director of the British Eugenics Society between 1937 and 1944. Yet, a funny thing happened on the road to idiocracy: The concerns of eugenicists did not come to pass. Rather than becoming dimmer, people became smarter. This phenomenon is now known as the Flynn Effect, named after James Flynn, a psychologist who was among the first to document it. Chart II-8 shows the evolution of IQ scores in a sample of countries between 1940 and 1990. The average country recorded IQ gains of three points per decade over this period, a remarkably large increase over such a relatively short period of time.
The Most Important Trend In The World Has Reversed And Nobody Knows Why
The Most Important Trend In The World Has Reversed And Nobody Knows Why
Explaining The Flynn Effect The Flynn Effect must have been entirely driven by environmental factors since genetic factors – namely the tendency of less-educated people to have more children, and to have them at an earlier age – would have reduced average IQs over the past two hundred years. But how could environmental factors have played the dominant role in light of the strong role of genes discussed above? The answer was proposed by geneticist Richard Lewontin in the 1970s. Lewontin suggested imagining a genetically-diverse sack of seed corn randomly distributed between two large identical fields. One field had fertilizer added to it while the other did not. Genetic variation would explain all of the differences in the height of corn stalks within each field, while environmental factors (the addition of fertilizer) would explain all of the difference in the average height of corn stalks between the two fields. This logic explains why genes can account for the bulk of the variation in IQs within any demographic group, while environmental effects may explain most of the variation across groups, as well as why average scores have changed over time. And what environmental effects are these? The truth is that no one really knows. Plenty of theories have been advanced, but so far there is still little consensus on the matter. Bigger, Healthier Brains It has long been known that learning increases the amount of grey matter in the brain. For example, a recent study showed that the hippocampi of London taxi drivers tend to be larger due to the need for drivers to memorize and navigate complex routes.9 The emergence of modern societies likely kicked off a virtuous circle where the need to solve increasingly complex tasks forced people to hone their learning skills, leading to higher IQs and further technological progress. The introduction of universal primary education amplified this virtuous circle. Better health undoubtedly helped as well. Early childhood diseases reduce IQ by diverting the body’s resources away from mental development towards fighting off infections. There is a strong correlation between measured IQ and disease burden across countries (Chart II-9). A number of studies have documented a strong relationship between the timing of malaria eradication in the U.S. and other parts of the world and subsequent observed gains in childhood IQs.10
The Most Important Trend In The World Has Reversed And Nobody Knows Why
The Most Important Trend In The World Has Reversed And Nobody Knows Why
Brain size and IQ are positively correlated. Forensic evidence from the U.S. suggests that the average volume of adult human skulls has increased by 7% since the late 1800s, or roughly the size of a tennis ball.11 Part 3: The End Of A 10,000 Year Trend The problem with environmental effects is that they eventually run into diminishing returns. This appears to have happened with the Flynn Effect. In fact, not only does the recent evidence suggest that the Flynn Effect has ended, but the data suggest that IQs are starting to decline. Chart II-10 shows that average math and science test scores fell in the OECD’s Program For International Scholastic Achievement (PISA) between 2009 and 2015, the latest year of the examination. The drop in math and science test scores has been mirrored in falling IQ scores. Flynn observed a decade ago that IQs of British teenagers were slipping.12 Similar results have been documented in France, the Netherlands, Germany, Denmark, and most recently, Norway.
The Most Important Trend In The World Has Reversed And Nobody Knows Why
The Most Important Trend In The World Has Reversed And Nobody Knows Why
The Norwegian results, published last year, are particularly noteworthy.13 Bernt Bratsberg and Ole Rogeberg examined three-decades worth of data on IQ tests of Norwegian military conscripts. Military duty has been mandatory for almost all men in Norway since 1814, which means that the study’s authors were able to collect comprehensive data on most Norwegian men and their fathers. Their paper clearly shows that IQ peaked with the generation born in the mid-1970s and declined by about five points, or one-third of a standard deviation, for the one born in 1990 (Chart II-11). For the first time in recorded history, Norwegian kids today are not scoring as well as their parents.
The Most Important Trend In The World Has Reversed And Nobody Knows Why
The Most Important Trend In The World Has Reversed And Nobody Knows Why
A Mystery What caused the sudden reversal of the Flynn Effect in Norway and most other developed economies? Nobody knows. We can, however, offer three possible theories: New Technologies For much of human history, rising intelligence and technological innovation were complementary processes, meaning that the smartest people were the ones who could best exploit the new technologies that were coming their way. Moreover, as noted above, even those who were less gifted benefited from the mental stimulation that a technologically advanced society provided. It remains to be seen how future technological advances such as generalized AI will affect human intelligence, but recent technological advances seem to have had a dumbing down effect.14 For example, the GPS has obviated the need for people to navigate unfamiliar locations, thus blunting the development of their visuospatial skills. Modern word processors have made spelling skills less important. Having all the information in the world just a click away is a wonderful thing, but it has reduced the need for our brains to retain and codify what we learn. Meanwhile, the constant bombardment of information to which we are subject has made it difficult to concentrate on anything for long. How many youth today can read a report of this length without checking their Facebook feed multiple times? My guess is not many. Diminishing Returns To Education The ability to take young bright minds, who would have otherwise spent their lives doing menial labor, and provide them with an education was probably the greatest tailwind to growth that the 20th century enjoyed. There is undoubtedly still scope to continue this process, but the low-hanging fruits have been picked. Educational attainment has slowed dramatically in most of the world (Chart II-12). Economist James Heckman estimates that U.S. high-school graduation rates, properly measured, peaked over 40 years ago.15
The Most Important Trend In The World Has Reversed And Nobody Knows Why
The Most Important Trend In The World Has Reversed And Nobody Knows Why
Despite billions of dollars spent, efforts to improve school performance have generally fallen flat. A recent high-level report by the U.S. Department of Education concluded that “The panel did not find any empirical studies that reached the rigor necessary to determine that specific turnaround practices produce significantly better academic outcomes.”16 This gets to a point that most parents already know, which is that when people talk about “bad schools," they are really talking about “bad students.” Deteriorating Health Better health probably contributed to the Flynn Effect. But is it possible to have too much of a good thing? More calories are welcome when people are starving, but today’s calorie-rich, nutrient-poor diets have led to a surge in obesity rates. A clean environment reduces the spread of germs, but it also makes children hypersensitive to foreign substances. Following German reunification, researchers observed that allergies were much more common among West German children than their Eastern peers, presumably because of the West’s more salubrious environment.17 All sorts of weird and concerning physiological changes are occurring. Sperm counts have fallen by nearly 60% since the early 1970s.18 Testosterone levels in young men are dropping. Among girls, the age of first menarche has declined by two years over the past century.19 Are chemical agents in the environment responsible? If they are, what impact are they having on cognitive development? Nobody knows. Reported mental illness is also on the rise. The share of U.S. teenagers with a reported major depressive episode over the prior year surged by over 60% between 2010 and 2017 (Chart II-13). The fraction of young adults that made suicide plans nearly doubled.20 More than 20% of U.S. women over the age of 40 are on antidepressants.21 Five percent of U.S. children are receiving ADHD medication.22
The Most Important Trend In The World Has Reversed And Nobody Knows Why
The Most Important Trend In The World Has Reversed And Nobody Knows Why
Implications For Economic Growth And Asset Markets So far, the reversal of the Flynn Effect has been largely confined to the developed economies. Test scores are still rising in the developing world, albeit from fairly low levels. For example, two recent studies have documented significant IQ gains in Kenya and Brazil.23 In the poorest countries, opportunities for improving health abound. Even small steps such as fortifying salt with iodine (which costs about five cents per person per year) have been shown to boost IQ by nearly one standard deviation.24 Measures to reduce inbreeding are also likely to boost IQ scores.25 Yet, we should not underestimate the importance of falling cognitive skills in developed economies. Chart II-14 shows that there is a clear positive correlation between student score on math and science and per capita incomes.
The Most Important Trend In The World Has Reversed And Nobody Knows Why
The Most Important Trend In The World Has Reversed And Nobody Knows Why
Most technological innovation still takes place in developed economies. There is an extremely tight relationship between visuospatial IQ and the likelihood of becoming an inventor (Chart II-15). Since IQ is distributed along a bell curve, a 0.1 standard deviation drop in IQs across the entire distribution will result in an 8% decline in the share of people with IQs over 100, a 14% decline in those with IQs over 115, and a 21% decline in those with an IQ over 130 (by convention, each standard deviation on an IQ test is worth 15 points).
The Most Important Trend In The World Has Reversed And Nobody Knows Why
The Most Important Trend In The World Has Reversed And Nobody Knows Why
Falling IQs could result in slower productivity growth, which could further strain fiscal balances. Lower IQs are also associated with decreased future orientation.26 People who live for the moment tend to save less. A decline in savings would push up real rates, leading to less capital accumulation. History suggests that a deceleration in productivity growth and higher real rates will put downward pressure on equity multiples (Chart II-16).
The Most Important Trend In The World Has Reversed And Nobody Knows Why
The Most Important Trend In The World Has Reversed And Nobody Knows Why
Part 4: Generation E For 200 years, the environmentally-driven Flynn Effect disguised the underlying genetically-driven decline in IQs that began not long after the dawn of the Industrial Revolution. Flynn has acknowledged this himself, noting at the 2017 International Society For Intelligence Research Conference that “I have no doubt that there has been some deterioration of genetic quality for intelligence since the late Victorian times.”27 Now that the Flynn Effect has reversed, both genes and the environment are working together to reduce cognitive abilities in developed economies. This means that the most important trend in the world – a trend that allowed the human population to increase during the Malthusian era and later allowed output-per-worker to soar following the Industrial Revolution – has broken down. Yet, there may be another twist in the story – one that began just a few months ago: the first members of Generation E were born. E Is For Edited ... Or Eugenics Lulu and Nana will be like most other children, but with one key difference: They will be the first humans ever to have their genomes edited through a procedure know as CRISPR-Cas9. Rogue Chinese scientist He Jiankui deactivated their CCR5 gene, which the HIV virus uses as a gateway into the body. His actions were rightfully condemned around the world for endangering the twins’ health by using a procedure that has not yet been fully vetted in animal studies, let alone in human trials (Lulu and Nana’s father is HIV+ but it is debatable whether the children were at an elevated risk of infection). He Jiankui remains under house arrest at the university where he worked. But whatever his fate, the dam has been broken. For better or for worse, the era of personal eugenics has arrived. The Return Of The Silver Fox It is easier to delete a gene than to add one. It is even more difficult to swap out a large number of genes in a way that achieves a predictable outcome. Thus, the successful manipulation of highly polygenic traits such as intelligence — traits that are linked to hundreds of different genes – may still be decades away.28 Predicting a trait is much simpler than modifying it, however. The cost of sequencing a human genome has fallen by more than 99% since 2001 (Chart II-17). Start-up company Genomic Prediction has already developed a test for fertilized embryos for IVF users that predicts height within a few centimetres and IQ with a correlation of 0.3-to-0.4, roughly as accurate as standardized tests such as the SAT or ACT.29 Other companies are following suit.30
The Most Important Trend In The World Has Reversed And Nobody Knows Why
The Most Important Trend In The World Has Reversed And Nobody Knows Why
Some will recoil in horror at the prospect of selecting prospective children in this manner. They will argue that such technologies, beyond being simply immoral, will widen social inequality between those who can afford them and those who cannot. Others will counter that screening embryos for certain traits is not that dissimilar to what people already do with prospective romantic partners. They will also point out that mass usage of these technologies will drive down prices to the point that even poor people will be able to access them, thus giving low IQ parents the chance to have high IQ kids. They might also note that such technologies may be the only way to reverse the ongoing accumulation of deleterious mutations within the human germline that has been the unintended by-product of the proliferation of life-saving medicines.31 We will not wade into this thorny debate, other than to note that there will be huge incentives for people to avail themselves of these technologies. The Coming Eugenic Wars And not just individuals either – governments too. While the initial impact of eugenic technologies will be small, the effects will compound over time. Carl Shulman and Nick Bostrom estimate that genetic screening could boost average IQs by up to 65 points in five generations (Table II-2).
The Most Important Trend In The World Has Reversed And Nobody Knows Why
The Most Important Trend In The World Has Reversed And Nobody Knows Why
China has been investing heavily in genetic technologies. As Geoffrey Miller has argued, China’s infatuation with eugenics spans into the modern day.32 Like most other countries, fertility in China is negatively correlated with IQ. Mingrui Wang, John Fuerst, and Jianjun Ren estimate that China is currently losing nearly one-third of a point in generalized intelligence per decade, with the loss having accelerated rapidly between the 1960s and mid-1980s.33 The decline in the genetic component of Chinese IQs is coming at a time when the population itself is about to shrink. According to the UN’s baseline forecast, China will lose 450 million working-age people by the end of the century (Chart II-18). Meanwhile, the country is saddled with debt, the result of an economic model that has, for decades, recycled copious household savings into debt-financed fixed-investment spending in an effort to shore up domestic demand.
The Most Important Trend In The World Has Reversed And Nobody Knows Why
The Most Important Trend In The World Has Reversed And Nobody Knows Why
The authorities may be tempted to tackle all three problems simultaneously by adopting generous pro-natal measures – call it the “at least one-child policy”– which increasingly harnesses emerging eugenic technologies. The resulting baby boom would strengthen domestic demand, thus making the economy less dependent on exports, while ensuring China’s long-term geopolitical viability. The Eugenic Wars are coming, and they will be unlike anything the world has seen before. BOX II-1 The Diffusion Of Bourgeois Values: Culture Or Genes? Higher-income people had more surviving children in the centuries leading up to the Industrial Revolution. Real per capita income was broadly stable during this period. This implies that there must have been downward social mobility, with sons, on average, being less wealthy than their fathers. This downward mobility, in turn, spread the characteristics of higher-income people across the broad swathe of society. What were these characteristics? Cultural values that emphasized thrift, diligence, and literacy were undoubtedly part of what was passed on to future generations. But surprisingly, it also appears that genetic transmission played an important, and perhaps pivotal, role. Models of genetic transmission make very concrete predictions about the correlations in economic status that one would expect to see among relatives. Biological brothers share 50% of their genes, as do fathers and sons. Likewise, first cousins share 25% of their genes, the same as grandfathers and sons. These facts yield two testable predictions: The first is that the correlation coefficient on status measures such as wealth, occupation, and education should be the same for relatives that share the same fraction of genes such as sibling pairs and father-son pairs. Box Chart II-1 shows that this is borne out by the data. The second prediction is that the correlation between status and genetic distance should follow a linear trend so that, for example, the correlation in wealth among brothers is twice that of first cousins and four times that of second cousins. Box Chart II-2 shows that this is also borne out by the data.
Image
Image
Other evidence supports the importance of genes in the transmission of status across generations. The correlation in measures such as wealth, education, and occupation is much higher among identical twins than fraternal twins. Adopted children turn out to be more similar to their biological parents on these measures when they reach adulthood than their adopted parents, even when the children have never met their biological parents. The parent-child correlation also remains the same regardless of family size, suggesting that spreading the same resources over more children may not harm life outcomes to any discernible degree, at least on the measures listed above. Peter Berezin Chief Global Strategist Global Investment Strategy III. Indicators And Reference Charts Our tactical equity upgrade to overweight last month has still not been confirmed by most of our proprietary indicators. Our Willingness-to-Pay (WTP) indicator for the U.S. is falling fast. It is also eroding for Europe, although it has ticked higher in Japan. The WTP indicators track flows, and thus provide information on what investors are actually doing, as opposed to sentiment indexes that track how investors are feeling. Investors have clearly moved funds away from the U.S. equity market and there is no sign yet that this is reversing. Our Revealed Preference Indicator (RPI) for stocks continued to issue a ‘sell’ signal in January. The RPI combines the idea of market momentum with valuation and policy measures. It provides a powerful bullish signal if positive market momentum lines up with constructive signals from the policy and valuation measures. Conversely, if constructive market momentum is not supported by valuation and policy, investors should lean against the market trend. While the RPI is still cautious, value has improved significantly according to BCA’s composite valuation indicator. It is a composite of 11 different valuation measures. This indicator almost reached the fair value line in December. Moreover, our Monetary Indicator has suddenly shifted out of negative territory for stocks, rising to the neutral line in December. Calming words from the Fed has improved the monetary backdrop by removing expected rate hikes from the money market curve. Given the improvement in both value and the monetary backdrop, the RPI could generate a ‘buy’ signal next month. Our Composite Technical indicator for stocks broke down last month, providing a clear ‘sell’ signal, and has not yet delivered a ‘buy’. However, sentiment is now washed out and earnings expectations have been revised heavily downward. These signals are bullish from a contrary perspective. The 10-year Treasury yield is in the neutral range according to our valuation model. Bonds are not overbought, despite the rally in December, because they were still working off oversold conditions. Contrary to the bond valuation model, the 10-year term premium moved further into negative territory in January, suggesting that yields are unsustainably low. Our bond-bearish bias is consistent with the view that the Fed rate hike cycle is not over. The U.S. dollar is somewhat overbought and very expensive on a PPP basis. Nonetheless, we believe it will become more expensive in the first half of 2019, before its structural downtrend resumes in broad trade-weighted terms. EQUITIES: Chart III-1U.S. Equity Indicators
U.S. Equity Indicators
U.S. Equity Indicators
Chart III-2Willingness To Pay For Risk
Willingness To Pay For Risk
Willingness To Pay For Risk
Chart III-3U.S. Equity Sentiment Indicators
U.S. Equity Sentiment Indicators
U.S. Equity Sentiment Indicators
Chart III-4Revealed Preference Indicator
Revealed Preference Indicator
Revealed Preference Indicator
Chart III-5U.S. Stock Market Valuation
U.S. Stock Market Valuation
U.S. Stock Market Valuation
Chart III-6U.S. Earnings
U.S. Earnings
U.S. Earnings
Chart III-7Global Stock Market And Earnings: Relative Performance
Global Stock Market And Earnings: Relative Performance
Global Stock Market And Earnings: Relative Performance
Chart III-8Global Stock Market And Earnings: Relative Performance
Global Stock Market And Earnings: Relative Performance
Global Stock Market And Earnings: Relative Performance
FIXED INCOME: Chart III-9U.S. Treasurys And Valuations
U.S. Treasurys And Valuations
U.S. Treasurys And Valuations
Chart III-10Yield Curve Slopes
Yield Curve Slopes
Yield Curve Slopes
Chart III-11Selected U.S. Bond Yields
Selected U.S. Bond Yields
Selected U.S. Bond Yields
Chart III-1210-Year Treasury Yield Components
10-Year Treasury Yield Components
10-Year Treasury Yield Components
Chart III-13U.S. Corporate Bonds And Health Monitor
U.S. Corporate Bonds And Health Monitor
U.S. Corporate Bonds And Health Monitor
Chart III-14Global Bonds: Developed Markets
Global Bonds: Developed Markets
Global Bonds: Developed Markets
Chart III-15Global Bonds: Emerging Markets
Global Bonds: Emerging Markets
Global Bonds: Emerging Markets
CURRENCIES: Chart III-16U.S. Dollar And PPP
U.S. Dollar And PPP
U.S. Dollar And PPP
Chart III-17U.S. Dollar And Indicator
U.S. Dollar And Indicator
U.S. Dollar And Indicator
Chart III-18U.S. Dollar Fundamentals
U.S. Dollar Fundamentals
U.S. Dollar Fundamentals
Chart III-19Japanese Yen Technicals
Japanese Yen Technicals
Japanese Yen Technicals
Chart III-20Euro Technicals
Euro Technicals
Euro Technicals
Chart III-21Euro/Yen Technicals
Euro/Yen Technicals
Euro/Yen Technicals
Chart III-22Euro/Pound Technicals
Euro/Pound Technicals
Euro/Pound Technicals
COMMODITIES: Chart III-23Broad Commodity Indicators
Broad Commodity Indicators
Broad Commodity Indicators
Chart III-24Commodity Prices
Commodity Prices
Commodity Prices
Chart III-25Commodity Prices
Commodity Prices
Commodity Prices
Chart III-26Commodity Sentiment
Commodity Sentiment
Commodity Sentiment
Chart III-27Speculative Positioning
Speculative Positioning
Speculative Positioning
ECONOMY: Chart III-28U.S. And Global Macro Backdrop
U.S. And Global Macro Backdrop
U.S. And Global Macro Backdrop
Chart III-29U.S. Macro Snapshot
U.S. Macro Snapshot
U.S. Macro Snapshot
Chart III-30U.S. Growth Outlook
U.S. Growth Outlook
U.S. Growth Outlook
Chart III-31U.S. Cyclical Spending
U.S. Cyclical Spending
U.S. Cyclical Spending
Chart III-32U.S. Labor Market
U.S. Labor Market
U.S. Labor Market
Chart III-33U.S. Consumption
U.S. Consumption
U.S. Consumption
Chart III-34U.S. Housing
U.S. Housing
U.S. Housing
Chart III-35U.S. Debt And Deleveraging
U.S. Debt And Deleveraging
U.S. Debt And Deleveraging
Chart III-36U.S. Financial Conditions
U.S. Financial Conditions
U.S. Financial Conditions
Chart III-37Global Economic Snapshot: Europe
Global Economic Snapshot: Europe
Global Economic Snapshot: Europe
Chart III-38Global Economic Snapshot: China
Global Economic Snapshot: China
Global Economic Snapshot: China
Mark McClellan Senior Vice President The Bank Credit Analyst Footnotes 1 Please see The Bank Credit Analyst Special Report "The Long Shadow Of The Financial Crisis," dated October 25, 2018, available at bca.bcaresearch.com 2 The amount of spread widening required for corporate returns to break-even with duration-matched U.S. Treasuries on a one-year horizon. 3 Please see Geopolitical Strategy Special Report "Five Black Swans In 2019," dated January 16, 2019, available at gps.bcaresearch.com 4 Xi Song, Cameron Campbell, and James Lee, "Descent Line Growth and Extinction From A Multigenerational Perspective, Extended Abstract," American Sociological Review 80:3, (April 21, 2015): 574-602. 5 Gregory Cochran and Henry Harpending, "The 10,000 Year Explosion: How Civilization Accelerated Human Evolution," Basic Books, (2009). 6 Mark Grinblatt, Matti Keloharju, and Juhani T. Linnainmaa, “IQ, Trading Behavior, and Performance,” Journal of Financial Economics, 104:2, (May 2012): 339-362. 7 Thomas Bouchard, "Genetic Influence On Human Psychological Traits - A Survey," Current Directions in Psychological Science 13:4, (August 2004): 148-151. 8 The tendency for the genetic contribution to IQ to increase until early adulthood and then to remain at high levels until old age is known as the Wilson Effect. There is no consensus on what causes it, but it probably reflects a number of factors: 1) It may take some children longer than normal to reach full intellectual maturity. Testing their IQs at a young age will result in scores that are lower than those expected based on their parents’ IQs. The opposite is true for children whose IQs increase relatively quickly in young age, but possibly top out earlier; 2) Environmental effects are probably more important in young age when a child’s brain is still quite malleable; 3) Self-reinforcing gene-environment interactions tend to increase with age. Children do not have much control over their environment, but as they get older, they will seek out activities that are more in keeping with their genetic predispositions. For example, a studious child may pursue a career that reinforces their love of learning. 9 "Cache Cab: Taxi Drivers' Brains Grow to Navigate London's Streets," Scientific American, (December 2011). 10 Atheendar Venkataramani, "Early Life Exposure to Malaria and Cognition in Adulthood: Evidence from Mexico," Journal of Health Economics 31:5, (July 2012): 767-780; Hoyt Bleakley, "Health, Human Capital and Development," Annual Review of Economics 2, (March 2010): 283-310; Hoyt Bleakley, "Malaria Eradication in the Americas: A Retrospective Analysis of Childhood Exposure," American Economic Journal: Applied Economics 2, (April 2010): 1-45. 11 "Anthropologists Find American Heads Are Getting Larger," ScienceDaily, (May 2012). 12 "British Teenagers Have Lower IQs Than Their Counterparts Did 30 Years Ago," The Telegraph, (February 2009). 13 Bernt Bratsberg and Ole Rogeberg, "Flynn Effect And Its Reversal Are Both Environmentally Caused," Proceedings of the National Academy of Sciences 115:26, (June 2018): 6674-6678. 14 On the face of it, artificial intelligence would appear to be a substitute for human intelligence. Many applications of AI would undoubtedly have this feature, especially those that allow computers to perform complex mental tasks that humans now must do. However, there are several ways that AI may eventually come to complement human intelligence. First, and most obviously, AI could be used to augment human capabilities either directly by hardwiring it into our brains, or indirectly through the development of drugs or genetic techniques which improve cognition. Second, looking further out, the benefits of highly intelligent AI systems would be limited if humans did not possess the requisite intelligence to understand certain concepts that are currently beyond our mental reach. No matter how well intentioned, trying to explain string theory to a mouse is not going to succeed. There are probably a multitude of ideas that AI could reveal that we simply cannot comprehend at current levels of human intelligence. 15 James Heckman and Paul La Fontaine, "The American High School Graduation Rate: Trends and Levels," The Review of Economics and Statistics 92:2, (May 2010): 244–262. 16 "Turning Around Chronically Low-Performing Schools," The Institute of Education Sciences (IES), (May 2008). 17 E. von Mutius, F.D. Martinez, C. Fritzsch, T. Nicolai, G. Roell, and H. H. Thiemann, "Prevalence Of Asthma And Atopy In Two Areas Of West Germany And East Germany," American Journal of Respiratory and Critical Care Medicine 149:2, (February 1994): 358-64. 18 "Sperm Counts In The West Plunge By 60% In 40 Years As ‘Modern Life’ Damages Men’s Health," Independent, (July 2017). 19 Kaspar Sørensen, Annette Mouritsen, Lise Aksglaede, Casper P. Hagen, Signe Sloth Mogensen, and Anders Juul, "Recent Secular Trends in Pubertal Timing: Implications for Evaluation and Diagnosis of Precocious Puberty," Hormone Research in Paediatrics 77:3, (May 2012): 137-145. 20 “Results from the 2017 National Survey On Drug Use And Health: Detailed Tables,” Substance Abuse and Mental Health Services Administration, Center for Behavioral Health Statistics and Quality, Rockville (Maryland), (September, 2018). 21 Laura A. Pratt, Debra J. Brody, and Qiuping Gu, "Antidepressant Use Among Persons Aged 12 and Over: United States, 2011–2014," NCHS Data Brief No. 283, Centers for Disease Control and Prevention, (August 2017). 22 Some, but not all, of the increase in reported rates of mental illness may be due to more aggressive diagnosis by health practitioners. For example, a recent study revealed that children born in August were 30% more likely to receive an ADHD diagnosis than those born in September, simply because they were less mature compared to other kids in the first few years of elementary school. See: Timothy J. Layton, Michael L. Barnett, Tanner R. Hicks, and Anupam B. Jena, "Attention Deficit-Hyperactivity Disorder and Month of School Enrollment," New England Journal of Medicine 379:22, (November 2018): 2122-2130. 23 Tamara C. Daley, Shannon E. Whaley, Marian D. Sigman, Michael P. Espinosa, and Charlotte Neumann, "IQ On The Rise: The Flynn Effect In Rural Kenyan Children," Psychological Science 14:3, (June 2003): 215-9; Jakob Pietschnig and Martin Voracek, "One Century of Global IQ Gains: A Formal Meta-Analysis of the Flynn Effect (1909-2013)," Perspectives on Psychological Science 10:3, (May 2015): 282-306. 24 N. Bleichrodt and M. P. Born, “Meta-Analysis of Research on Iodine and Its Relationship to Cognitive Development,” In: ed. J. B. Stanbury, "The Damaged Brain of Iodine Deficiency," Cognizant Communication Corporation, New York, (1994): 195-200; "Iodine status worldwide: WHO Global Database on Iodine Deficiency," World Health Organization, Geneva, (2004). 25 Mohd Fareed and Mohammad Afzal, "Estimating the Inbreeding Depression on Cognitive Behavior: A Population Based Study of Child Cohort," PLOS ONE 9:12, (October 2015): e109585. 26 H. de Wit, J. D. Flory, A. Acheson, M. McCloskey, and S. B. Manuck, "IQ And Nonplanning Impulsivity Are Independently Associated With Delay Discounting In Middle-Aged Adults," Personality and Individual Differences 42:1, (January 2007): 111-121; W. Mischel and R. Metzner, "Preference For Delayed Reward As A Function Of Age, Intelligence, And Length Of Delay Interval," Journal of Abnormal and Social Psychology 64:6, (July 1962): 425-31. 27 James Flynn, “IQ decline and Piaget: Does the rot start at the top?” Lifetime Achievement Award Address, 18th Annual meeting of ISIR, (July 2017). 28 For a good discussion of these issues, please see Richard J. Haier, “The Neuroscience of Intelligence,” Cambridge Fundamentals of Neuroscience in Psychology, (December 2016). 29 "The Future of In-Vitro Fertilization and Gene Editing," Psychology Today, (December 2018). 30 "DNA Tests For IQ Are Coming, But It Might Not Be Smart To Take One," MIT Technology Review, (April 2018). 31 Michael Lynch, "Rate, Molecular Spectrum, And Consequences Of Human Mutation," Proceedings of the National Academy of Sciences 107:3, (January 2010): 961-968. 32 Geoffrey Miller, "What *Should* We Be Worried About?" Edge, (2013). 33 Mingrui Wang, John Fuerst, and Jianjun Ren, "Evidence Of Dysgenic Fertility In China," Intelligence 57, (April 2016): 15-24. EQUITIES:FIXED INCOME:CURRENCIES:COMMODITIES:ECONOMY:
Highlights So What? A 70% tax on Americans with income over $10 million is not far-fetched. Why? The median U.S. voter wants higher taxes on the wealthy; Both populism and geopolitics make it impossible to cut spending; The next recession, no matter how shallow, will elicit unconventional policy. Feature The New Year has brought a chill to the investment community. No, it is not the weather, but rather a proposal by U.S. Congresswoman Alexandria Ocasio-Cortez (AOC) to create a new top-income bracket, starting at $10,000,000, that would be taxed at 70%. The reaction to the self-described Democratic Socialist has been swift. Her strategy of soaking the rich would not work, would cause an exodus of job-creators out of the U.S., and would slow down the pace of growth. A CNBC headline screamed: “The super rich at Davos are scared of Alexandria Ocasio-Cortez’s proposal to hike taxes on the wealthy.”1 In these pages, we are not going to discuss the merits of the proposal, although it would not raise enough revenue to fund the Democrats’ other policy proposals. Instead, we are going to forecast that Representative Ocasio-Cortez will get what she wants. Within our investment horizon. Probably following the next recession, which is nigh. However, how she gets what she wants will ultimately matter more than what the tax rate is on every dollar over $10,000,000 of income. The Median American Voter Since before the 2016 U.S. election and the Brexit vote, we have argued that the Median Voter is moving to the Left, particularly in the laissez-faire economies of the U.S. and the U.K. These two Anglo-Saxon economies swerved most enthusiastically to the right of the economic spectrum during the 1980 supply-side revolutions. They embraced both neo-liberal economic policy and globalization. While these reforms allowed them to outperform their less enthusiastically capitalist peers on a number of measures of economic performance, they also produced higher income inequality and a slower pace of social mobility (Chart 1). Over time, and particularly following the 2008 Great Recession, this pernicious mix of factors produced a surge in populism.
Chart 1
There has been plenty of evidence that our view is on track. Take for example the performance of the über-left leaning Labour Party in the U.K.’s 2017 election or the breakdown of the Washington Consensus on global trade. Still, many clients have resisted our thesis. This is because President Trump did manage to push a sweeping supply-side tax cut through Congress in 2017. Given that we forecast that Republicans would get their way on tax cuts, our clients were left wondering how our thesis of a shift to the left could coexist with a Reagan-esque lowering of tax rates? The answer is that the move of the Median Voter to the left is a structural geopolitical view. A tax cut policy in 2017 was a tactical/cyclical view that deviated from the long-term trend. Trump was a candidate who promised faster economic growth while the Republican Party was a political machine that sought a low tax regime as a matter of policy and ideology. We expected the GOP, and House leader Paul Ryan, to use the Trump presidency as a way to get one last tax cut while they had control. However, since the tax cuts were passed, much has gone awry for America’s center-right party. First, the Democrats campaigned enthusiastically against the tax cuts in the midterm elections. On the other side of the aisle, Republican members of Congress quickly found out that they got no applause from constituents for their signature piece of legislation. The tax cut therefore disappeared from GOP messaging ahead of the November 2018 election. Steve Bannon, Trump’s political strategist, had apparently predicted this outcome when he cautioned against cutting tax rates for the top income bracket. He suggested a hike on taxes for the wealthy to boost Trump’s populist credentials. (Bannon’s proposal was for a 44% rate on those who earn income over $5,000,000, mathematically on the path towards Ocasio-Cortez’s end-point!).2 Second, the Republicans went on to lose their majority in the House. Granted, presidents usually lose their first midterm. However, with unemployment at 3.7% last November and the economy clocking in at a 3% clip, the GOP had a clear upper hand on economic messaging. And yet it did not avert major losses. The commentary from the right is that the Democrats are going to dig their own grave with their increasingly “Socialist” talk. But will they? We present three reasons that suggest that Ocasio-Cortez (and, ironically, Steve Bannon) are going to get what they want. Income taxes in America will rise over the next decade. Reason #1: The Median Voter Wants Higher Taxes On The Wealthy There is nothing sacred in politics. A society’s volonté générale swings like a pendulum between thesis and antithesis. The idea that Americans embody the laissez-faire spirit, while the French are socialists, is simply a product of linear extrapolation based on the timeline of a single generation.3 Chart 2 suggests a different story. As recently as the early 1970s, the U.S. and France were like peas in a pod when it came to income distribution, while the U.K. – the epicenter of the supply-side revolution — was the most redistributive Western economy. Chart 2France Was Once Less Socialist Than America!
France Was Once Less Socialist Than America!
France Was Once Less Socialist Than America!
Today, Americans are much more in line with AOC than with Paul Ryan, which is why only one of the two has a job in the U.S. Congress. Ryan knew when to take his winnings and go home. According to a poll published merely weeks after AOC’s proposal, 59% of Americans support the 70% marginal tax rate. Democrats support the idea at a 71% clip, which suggests that Ocasio-Cortez is not on the fringes of the party. Independents support it at 60% and even 45% of registered Republicans support the idea. One could argue that the much-cited poll above is merely a flash in the pan, that it signifies nothing. We disagree for two reasons. First, if 60% of Americans – including 45% of Republicans – support a 70% tax rate now, when the economy is firing on all cylinders, GDP growth is above potential, and unemployment is at 3.9%, what will they support 12-36 months from now, when the inevitable recession hits? Or when America’s indebted corporations begin to deleverage by shedding jobs because they took on massive debts in order to buy back equities and return value to shareholders (which, completely coincidentally, includes senior management)? Second, there is evidence that a majority of Americans has thought that “upper-income people” have not been paying their fair share for some time now. A Gallup poll run since the early 1990s shows that the sentiment for higher taxes on upper-income individuals is off its lows in 2010 (Chart 3). We are still far from the early 1990s highs, but the trajectory of the public opinion is clearly going in the Left’s direction and has always hovered around the 60% mark.
Chart 3
Bottom Line: It seems like ages ago that Grover Norquist, the anti-tax advocate, dominated the hallways of Congress, prodding legislators into pledging to “oppose any and all efforts to increase the marginal tax rate for individuals and businesses.” As recently as the 2012 election, 238 out of 242 House Republicans and 41 out of 47 Senate Republicans signed Norquist’s “Taxpayer Protection Pledge.” We subscribe to the theory that the median voter is the price maker in the political marketplace, the politician is the price taker. Trump and Ocasio-Cortez are merely vessels for the expression of the volonté générale, the median voter’s policy preference. And that preference runs counter to Norquist’s activism and the GOP’s tax cut policy in 2017. Reason #2: History Is On Ocasio-Cortez’s Side Chart 4 has already made the rounds, suggesting that Ocasio-Cortez is not making a ludicrous proposal given that the U.S. already had much higher marginal tax rates on top incomes in the past. Critics accuse her of simplifying history without considering context.
Chart 4
This is an important point. First, defense spending as a percent of GDP was at 37.5% in 1945 and still at an elevated 7.4% in 1965, twenty years later. The U.S. exited World War II and then almost immediately stumbled into two major conflicts, one on the Korean Peninsula and one in Vietnam. Meanwhile, the Cold War competition with the Soviet Union created an existential threat that had to be resisted on land, sea, and space, justifying higher tax rates. Second, while the U.S. did indeed cut its top marginal rates throughout the second half of the century, so did everyone else! Chart 5 shows that the rest of the Western world was largely in lock-step with the U.S. In fact, it was the U.S. that came down to French levels of taxation (!!!) throughout 1960s and 1970s (again, remember Chart 2).
Chart 5
As such, Chart 4 by itself is not a reason to excuse higher marginal rates. Of course we are completely disinterested in the merits of the policy. We are merely trying to forecast it. And Chart 4 does help us do so for two reasons. First, the key achievement of the Tax Cuts And Jobs Act of 2017 was the corporate tax cut to 21%. There is some bipartisan support for this policy, at least in the center of the Democratic Party (President Obama tried to cut the corporate tax rate from 35% to 28% in 2012). The last time corporate tax rates were this low, however, the top marginal income tax rate was at 79%. As such, we think that a bipartisan consensus could emerge on keeping corporate tax cuts at or below the OECD average of 24%, but at the cost of higher marginal tax rates for high-income earners. Second, it has been a key structural view of BCA’s Geopolitical Strategy, since inception, that the defining geopolitical feature of the twenty-first century will be the Sino-American conflict. If we are right on this issue, then perhaps an “existential conflict” to justify higher taxes on elites is already here. In other words, it is a fact that global challenges have required the U.S. to tax households and corporations at a higher rate in the past. It is also a fact that the U.S. faces greater global challenges today, specifically with China and Russia, than at anytime since the Cold War. Thus, while AOC may not be motivated by geopolitics, she may represent one aspect of a growing public policy consensus nonetheless. Simply put, with the U.S. facing both populism and geopolitical multipolarity, there is simply no political option for cutting either defense or non-defense spending. The only question is whether the U.S. will simultaneously shore up its ability to service its debts and maintain a reliable currency. AOC may find unlikely allies as geopolitical competition heats up. Reason #3: Policymakers Will Overreact To The Next Recession President Trump was elected in November 2016, with the recession having ended 88 months prior, with the unemployment rate down 5.6%, and the economy on the path to recovery. But his economic populist message resonated with a lot of voters who did not participate in that recovery. Our concern is that the next recession is close at hand. BCA’s House View is that the next recession will be relatively shallow in the U.S., in part because there aren’t any obvious bubbles. For one, cyclical spending as a percent of GDP is at mid-cycle levels (Chart 6). Corporate debt is elevated, but not by international standards (Chart 7). U.S. banks are in a much sounder position than in 2007. So, from a macroeconomic perspective, the next recession is nothing to fear. Chart 6Are We Even Mid-Cycle Yet?
Are We Even Mid-Cycle Yet?
Are We Even Mid-Cycle Yet?
Chart 7Corporate Debt Load Is Not Excessive
Corporate Debt Load Is Not Excessive
Corporate Debt Load Is Not Excessive
Policymakers, however, don’t care about macroeconomics. They care about the policy preferences of the Median Voter. And if that Median Voter elected an anti-establishment populist during relatively good times, who will he or she support when unemployment is high? Whoever is running the U.S. when the next recession happens, they will not wait around to find out. Unorthodox monetary, fiscal, and yes tax policy will overshoot norms and conventions regardless of how shallow the recession is. All bets are off at that point since policymakers will have a “recency bias” due to the trauma of 2008. While the recession may be shallow, the budget deficit will likely be at an elevated level. The U.S. is currently engaged in the first pro-cyclical economic stimulus since the late 1960s (Chart 8). This means that the recession will likely hit with the budget deficit already at around 5%-6% of GDP, compared to just 3%-4% when the last recession occurred. Given that the last four recessions raised the U.S. budget deficit by an average of 5% of GDP, it is safe to say that the U.S. budget deficit may rise to 2010 levels after the next downturn, regardless of how shallow the recession is. Chart 8Budget Deficits Will Be Very High In The Next Recession
Budget Deficits Will Be Very High In The Next Recession
Budget Deficits Will Be Very High In The Next Recession
As with the Great Recession, the public will demand that the government deals with the deficit. Unlike in the post-2008 environment, however, we think that the Median Voter will abandon the Norquist and Tea Party thesis of cutting spending and adopt the view that higher income brackets should see their taxes increased. That said, extremely high marginal rates at $10,000,000 will impact very few individuals and thus have a negligible revenue impact. What about higher marginal rates across the board? Chart 9 illustrates the evolution of marginal tax rates, using 2012 dollars for income brackets, across decades. The 1950s, 1960s, and 1970s saw multiple tax brackets, all with progressively higher marginal tax rates. In the 1970s, the 70% tax rate started at $460,000 in 2012 dollars, but a 50% rate began at $100,000 in 2012 dollars.
Chart 9
The question for investors is whether Ocasio-Cortez’s proposal is merely a branding exercise. A 70% tax rate that begins at $10,000,000 – Option 1 on Diagram 1 – is largely irrelevant, macroeconomically and politically. But if that is an end point of a curve, that is something that investors will want to know. This is because policymakers could draw those curves either by cutting lower-class and middle-class marginal rates – such as in Option 2 – or by simply replicating the 1970s curve, such as in Option 3. The impact of new taxes on the part of society with a higher marginal propensity to consume is an important consideration for policymakers recovering from a recession. Diagram 1Is Ocasio-Cortez’s Proposal An End Point Of A Curve Or Just A Branding Exercise?
Why Ocasio-Cortez Will Get What She Wants
Why Ocasio-Cortez Will Get What She Wants
At the moment, investors are probably not overly concerned about these issues. Options 2 and 3 look unlikely in the current political environment. But, again, they have been acceptable policy options in the past and could be revived if the Democratic Party decides to make income inequality the central issue of the 2020 election. Which makes the 2020 election the most significant U.S. election in a generation. Will Trump-style populism succeed or will Democratic Socialism emerge in the United States? At the moment, most of our clients would likely guess that trade and immigration – policy issues from 2016 – will dominate the debate again in 2020. This is likely incorrect linear extrapolation. Rarely do the same issues carry over from one election to another. As such, a left-leaning presidential candidate could push the Trump administration on its tax reform package and the continued growing income inequality, despite a falling unemployment rate. Throw in a potential recession and you have a witch’s brew. Not only would the rhetoric alarm the markets, but so would the electoral math. Democrats have a solid House majority while Republicans are clinging to a small Senate majority in a year when the electoral math clearly works in Democrats’ favor (20 out of 33 Senate seats up for reelection are held by the GOP). We are not ready to give a high conviction forecast on the presidential election – other than to say that a recession will virtually ensure Trump’s loss – but we do have a high conviction that whoever wins the White House in 2020 will also carry the Senate. As such, a Democratic sweep of both the White House and Congress is a possible scenario. At that point, the Options from Diagram 1 will no longer be an academic question. Finally, even if Trump emerges victorious, he may still have to agree with a Democratic Congress to modify his tax cuts in order to pay for his border wall, immigration reform, and a national infrastructure package. In that case, the median voter would have established the long-term bottom of U.S. tax rates even without a change in political parties. Marko Papic, Senior Vice President Chief Geopolitical Strategist marko@bcaresearch.com Footnotes 1 Please see CNBC Markets, “The super rich at Davos are scared of Alexandria Ocasio-Cortez’s proposal to hike taxes on the wealthy,” dated January 22, 2018, available at cnbc.com. 2 Please see “Steve Bannon’s Plan to Raise Taxes on the Rich? Not Happening,” Fortune, dated July 31, 2017, available at fortune.com. 3 Also known as stereotyping.
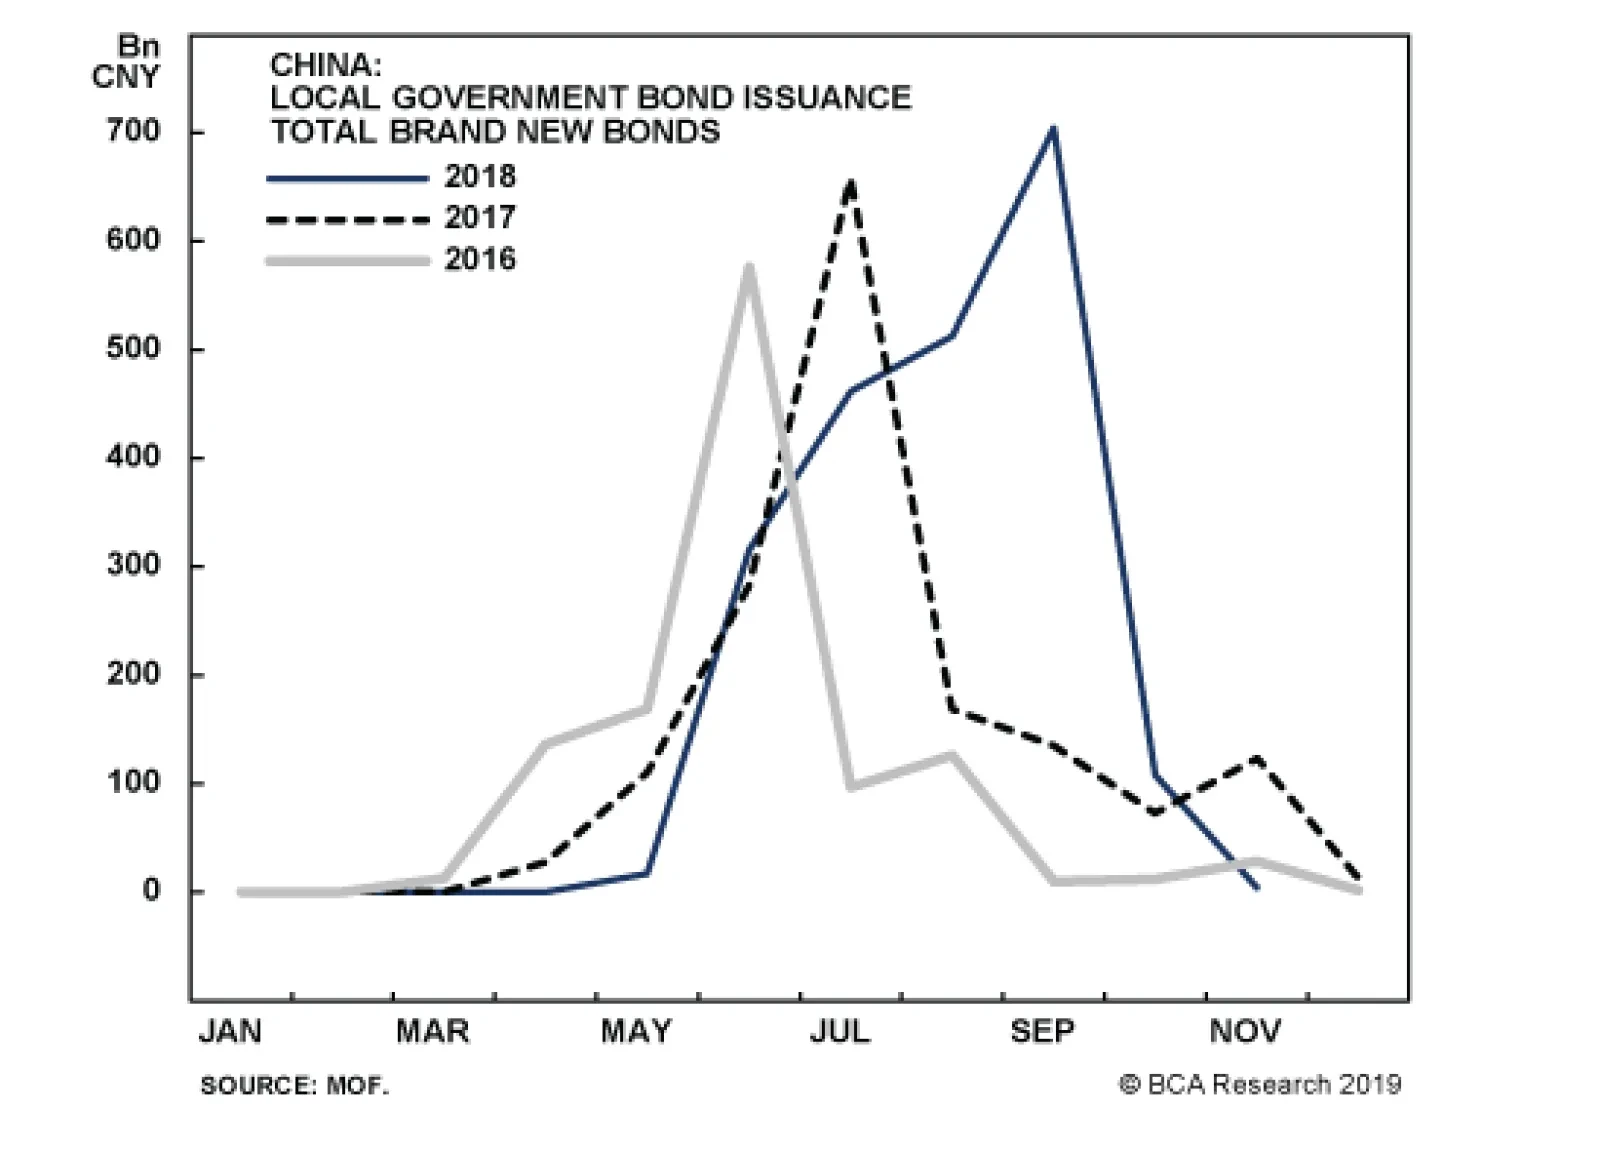
The immediate question for investors in 2019 is whether the downside economic risk has become so pressing that President Xi will shift the policy gear from growth stabilization to total reflation. The evidence suggests that the policy stance has not…
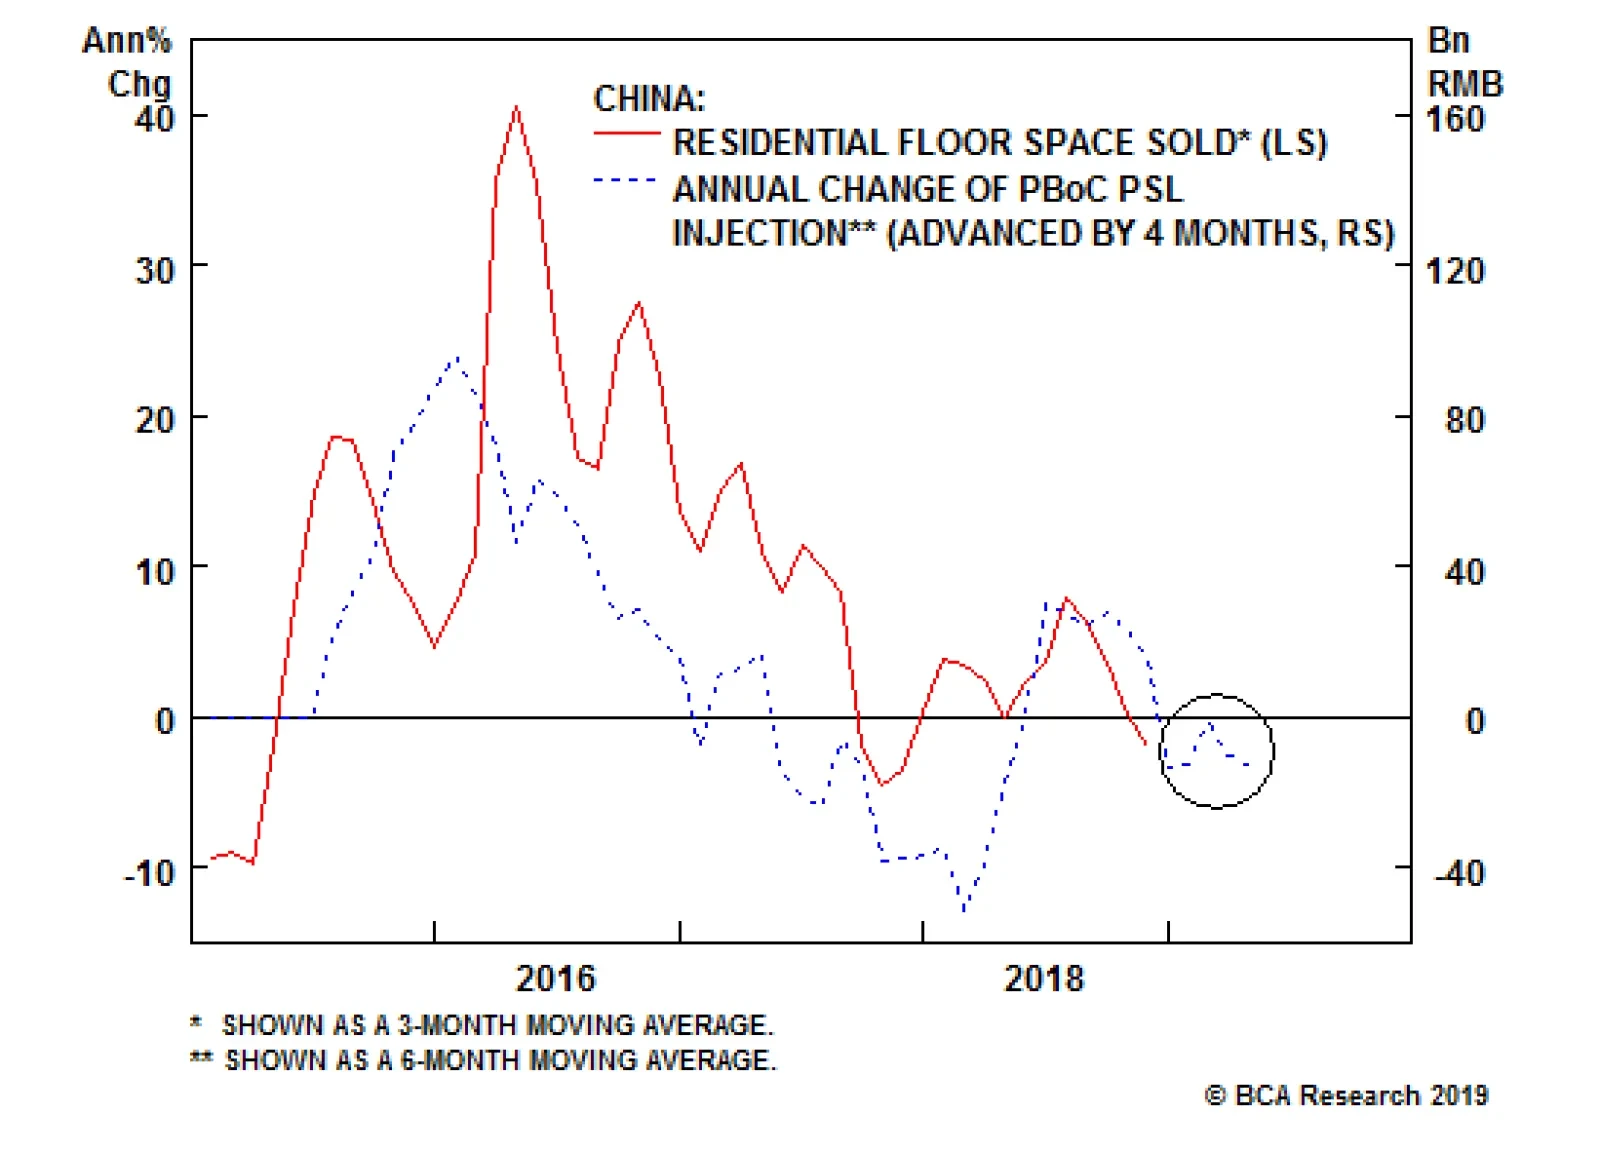
The central government has so far abstained from stimulating the property market due to already existing speculative excesses there. This is very different from the policy easing that took place in 2008-‘09, 2012 and 2015-’16, when the authorities boosted…
Highlights Please note that country sections on Mexico and Colombia published below. The policy stimulus in China could produce a growth revival in the second half of 2019, but there are no signs of an imminent bottom in China’s growth over the next several months. The lack of policy support for real estate is the key difference between the current stimulus program and previous ones. Crucially, the property market holds the key to consumer and business sentiment and hence, their willingness to spend. Continue to overweight Mexico within EM currency, fixed-income and equity portfolios. Colombia warrants a neutral weighting. A new trade: bet on yield curve flattening. Feature China has been undertaking both fiscal and monetary stimulus since last summer. A key question among investors is: At what point will the cumulative effects of these efforts become sufficient to revive the mainland’s business cycle and produce a rally in China-related plays akin to 2016-’17? This report helps investors dissect China’s stimulus, and reviews the indicators that will likely help identify the turning point in the mainland’s business cycle, as well as in China-exposed financial markets. Chart I-1 conveys the main message: Our credit and fiscal spending impulse is still falling, indicating that the slump in the Chinese industrial sector will persist for now with negative ramifications for EM corporate profits and other segments of the global economy that are leveraged to China.
Chart I-1
Looking forward, odds are reasonably high that the credit and fiscal spending impulse will bottom sometime in the first half of 2019. Yet, a bottom in China-plays in global financial markets is likely be several months away from now and potential downside could still be substantial. Monetary Stimulus On the monetary policy front, there has been multifaceted easing: Several cuts to banks’ reserve requirement ratios (RRRs) have been implemented; Lower interest rates for SME borrowers and a reduction in funding costs for the banks that originate these loans; The use of preferential liquidity provisions to encourage banks to purchase bonds issued by private companies. Monetary easing in of itself is not a sufficient condition to produce an economic revival. There are two variables standing between easing liquidity/lower borrowing costs, on the one hand, and the performance of the economy on the other: The first one is the money multiplier, which is calculated as a ratio of broad money supply (or banks assets) to excess reserves. It measures the willingness of banks to expand their balance sheets at a given level of excess reserves, assuming there is loan demand. Chart I-2 shows that China’s money multiplier has risen substantially since 2008 but has recently rolled over. A further drop in the money multiplier could offset the positive effect of monetary easing. Chart I-2China: Money Multiplier Is Falling
China: Money Multiplier Is Falling
China: Money Multiplier Is Falling
In other words, the central bank is injecting more liquidity into the banking system and interbank rates are falling, but commercial banks may be unwilling or unable to originate more loans due to financial regulations, lack of loan demand or for other reasons. Notably, the growth rate of bank assets (including policy banks) remains lackluster, while non-bank (shadow) credit is decelerating (Chart I-3). Chart I-3China: Bank Credit And Non-Bank Credit
China: Bank Credit And Non-Bank Credit
China: Bank Credit And Non-Bank Credit
The second variable is the willingness of companies and households to spend. This is captured by our proxies for marginal propensity to spend by companies and consumers. Chart I-4 denotes that both propensity measures are dropping, signifying a diminishing willingness to spend among these two sectors. Chart I-4China: Diminishing Propensity To Spend By Consumers And Companies
China: Diminishing Propensity To Spend By Consumers And Companies
China: Diminishing Propensity To Spend By Consumers And Companies
If economic sentiment among businesses and households remains downbeat – which has been the case in China over the past six to nine months – their reduced expenditures could offset any positive impulse from increased credit origination. Economists think of nominal GDP (aggregate spending) as money supply times the velocity of money (Nominal GDP = Money Supply x Velocity of Money). New lending activity among banks increases money supply, while economic agents’ spending raises the velocity of money. If the velocity of money drops more than the rise in money supply, aggregate expenditure (nominal GDP growth) will decline. Chart I-5 illustrates that the velocity of money rose in 2017, supporting robust growth during this period, despite very lackluster money growth. The opposite phenomenon – a decline in the velocity of money offsetting faster money expansion – could be a risk to the positive view on Chinese growth in 2019. Chart I-5Velocity Of Money: Will It Resume Its Decline?
Velocity Of Money: Will It Resume Its Decline?
Velocity Of Money: Will It Resume Its Decline?
Bottom Line: There is so far no clear evidence that the credit cycle has bottomed. Besides, a bottom in the credit impulse is not in and of itself sufficient to herald an economic recovery. Fiscal Stimulus Unlike in previous easing episodes, policymakers this time around have prioritized fiscal over monetary stimulus because of the already high leverage. In the past six months or so, the government has announced the following fiscal measures: A reduction in the personal income tax rate; Subtraction of certain household expenses from taxable personal income; A reduction in taxes and fees paid by small businesses; A potential VAT cut. These measures will certainly have a positive impact on small businesses and consumer spending. This is why we do not foresee a deepening slump in consumer spending. Nevertheless, the tax reductions and other policies benefiting small businesses and households are unlikely to boost industrial output and construction in China. The latter two are crucial for global investors because many countries are leveraged to China’s industrial and construction activity. For the industrial part of the economy, the most pertinent stimulus measure announced so far has been the issuance of local government special bonds. These bonds are used for infrastructure/public welfare projects. Chart I-6A shows the growth rates of aggregate fiscal spending and its components, which are expenditures by central and local governments as well as by government managed funds (GMFs). GMF spending – a form of quasi-government (off-balance sheet) spending – has surged in recent years and now accounts for 8.5% of GDP, which is more than twice larger than central government spending (Chart I-6B). Chart I-6AChina: Fiscal Spending Annual Growth...
China: Fiscal Spending Annual Growth...
China: Fiscal Spending Annual Growth...
Chart I-6B…And As % Of Nominal GDP
chart 6b
...And As % Of Nominal GDP
...And As % Of Nominal GDP
Although the 2019 budget has not yet been released – it will be announced in March during the National People's Congress – there have been some announcements that we can use to gauge the potential fiscal spending impulse in 2019. On the positive side, Beijing has recently authorized local governments to begin issuing bonds in early 2019 before the overall budget is released in March. Local governments are sanctioned to issue RMB 810 trillion of special bonds, which is 60% of their 2018 quotas. This contrasts with the previous years' practice, when local governments only started to issue bonds in April after obtaining directives from Beijing. The earlier-than-usual quota authorization will allow local governments to issue bonds from the beginning of the year. There is no timeline as to when these bonds will be issued, but it is safe to assume that their issuance will occur in the first half of 2019. This, in turn, should boost infrastructure investments throughout 2019. On the negative side, government managed funds (GMFs) derive 85% of their revenues from land sales. Land sales are tumbling due to previous credit tightening and scarce access to financing among property developers. Chart I-7 demonstrates that land sales lag the credit cycle by nine months. As developers are no longer acquiring land, GMF revenues and spending are set to shrink over the next 12 months. This will, to a certain degree, offset the augmented special bonds issuance. Chart I-7China: Credit Leads Land Sales And Quasi-Fiscal Spending
China: Credit Leads Land Sales And Quasi-Fiscal Spending
China: Credit Leads Land Sales And Quasi-Fiscal Spending
We performed a simulation on what would be the aggregate fiscal impulse in 2019 using the following assumptions: Central and local government spending growth rates are held constant at 2018 levels. Local government special bond issuance is RMB 1.62 trillion. This is twice the recently authorized quota. Hence, our simulation assumes a 20% increase in local government special bond issuance in 2019 over 2018, respectively. GMF land revenues drop by 25% – a comparable drop in land sales occurred in 2015. Table I-1 reveals that using these assumptions, the fiscal spending impulse in 2019 will be 0.1% of GDP down from 4% in 2018 (Chart I-8, bottom panel).
Chart I-
Chart I-8China: Credit And Fiscal Spending Impulse
China: Credit And Fiscal Spending Impulse
China: Credit And Fiscal Spending Impulse
The next step is to combine this with our credit impulse forecast. We assume the 2019 year-end growth rate of credit to companies and households will be 9% in our pessimistic scenario, 10% in our baseline scenario and 11% in our optimistic scenario, compared with the December 2018 recorded rate of 10%. This entails no deleveraging at all. Under these assumptions, our forecasts for aggregate credit and fiscal impulses are 0.2% of GDP (pessimistic), 2.3% (baseline) and 4.4% (optimistic) (Table I-1). Presently, the credit and fiscal impulse is close to zero (Chart I-8). Bottom Line: China’s credit and fiscal spending impulse will bottom in the first half of 2019 (Chart I-8). However, this does not mean that EM/China plays have already bottomed and investors should chase the latest rebound in China-plays worldwide. We discuss the historical correlation between the credit and fiscal impulse and China-related financial markets below. What Is Different From Previous Stimulus Programs? The lack of stimulus targeting the real estate sector is the key difference between the current stimulus programs and those implemented in the past 10 years. The central government has so far abstained from stimulating the property market due to already existing speculative excesses there. This is very different from the policy easing that took place in 2008-‘09, 2012 and 2015-’16, when the authorities boosted property markets along with other sectors of the economy. Chart I-9 reveals that the 2015-‘17 residential property market revival and following boom was facilitated by the Pledged Supplementary Lending (PSL) program conducted by the People’s Bank of China (PBoC) – which was de-facto the outright monetarization of real estate by the central bank.1 The authorities have so far been reluctant to use this PSL program again, and the odds are that housing sales and new construction will continue to decline (Chart I-10). Chart I-9Residential Property Market Is Deteriorating
Residential Property Market Is Deteriorating
Residential Property Market Is Deteriorating
Chart I-10China: Construction Volumes Are Shrinking
China: Construction Volumes Are Shrinking
China: Construction Volumes Are Shrinking
Importantly, the property market holds the key to consumer and business sentiment and, hence, their willingness to spend. The latter is crucial to the growth outlook. Overall, a deepening slump in real estate demand and prices could dent consumer and small business confidence as well as their spending. Meanwhile, shrinking construction volumes will dampen industrial sectors (Chart I-10). Investment Implications: A Replay Of 2016-‘17? How does the credit and fiscal impulse relate to financial markets globally that are leveraged to the Chinese economy? The top two panels of Chart I-11 show our money impulse as well as credit and fiscal spending impulse (CFI), while the bottom two panels contain EM share prices and industrial metals prices. There are a few observations to be made: Chart I-11China: Money And Credit/Fiscal Impulses, EM Stocks And Metals Prices
China: Money And Credit/Fiscal Impulses, EM Stocks And Metals Prices
China: Money And Credit/Fiscal Impulses, EM Stocks And Metals Prices
First, the CFI has not yet bottomed – i.e., it has not confirmed the upturn in the money impulse. Second, as illustrated in this Chart, the bottoms in the money impulse as well as the CFI in July 2015 preceded the bottom in EM and commodities by six months, and their peaks led the top in financial markets - in January 2018 - by about 15 months. Besides, in 2012-‘13, the rise in both the money impulse and CFI did not do much to help EM stocks or industrial commodities prices. Third, the credit and fiscal impulse leads the global manufacturing PMI by several months as illustrated in Chart I-1 on page 1, as well as mainland’s capital goods imports (Chart I-12). Chart I-12China's Impact On Industrial Goods And Commodities
China's Impact On Industrial Goods And Commodities
China's Impact On Industrial Goods And Commodities
On the whole, investors should consider buying China-related plays only after both the money impulse and the CFI bottom together which has not yet occurred. Besides, even if these indicators rise in tandem, the bottom in China-related financial market plays could be a few months later because these impulses have historically led markets. This is why we believe a final down leg in EM and China-related plays still lies ahead. Typically, the last/capitulation phase in bear markets is considerable and being early can be very painful. Bottom Line: We continue to recommend underweighting/playing EM and China-related risk assets on the short side. Arthur Budaghyan, Senior Vice President Emerging Markets Strategy arthurb@bcaresearch.com Lin Xiang, Research Analyst linx@bcaresearch.com Mexico: Reiterating Our Overweight Stance Mexican financial markets have rebounded, outperforming their EM counterparts since mid-December. This outperformance has further upside because the AMLO administration is proving to be less populist and more pragmatic, especially relative to investors’ expectations. We are reiterating our recommendations to overweight Mexican markets, especially the currency, local fixed-income and sovereign credit, within respective EM portfolios due to the following considerations: The 2019 budget is a prime example of sensible rather than populist policies by the AMLO administration. The budget targets a primary surplus of 1% of GDP versus 0.8% of GDP in 2018 (Chart II-1). Notably, the 2019 budget envisages an absolute decline in nominal expenditures in 29 out of 56 categories. Chart II-1Fiscal Tightening In 2019
Fiscal Tightening In 2019
Fiscal Tightening In 2019
Such a restrained budget follows the conservative fiscal policy of the previous administration. In brief, the nation’s fiscal policy and public debt profile remain sound. Public spending will be increased mostly in the areas that are critical to boosting productivity. These include infrastructure spending, vocational training, promoting “financial deepening” and competition, eliminating graft and improving security. These efforts are critical to boosting business confidence, investment and ultimately productivity. On the revenue side, the budget has become much less reliant on oil revenues than before. The share of oil revenues in total government revenues historically hovered around 30%, but in 2018 it declined to 18%. The 2019 budget assumes an average oil price of $55 per barrel, a conservative projection. Investors have also been somewhat alarmed by the 16% hike in minimum wages, but this should be put into historical context. Chart II-2 illustrates that the minimum wage in real terms (deflated by consumer price inflation) dropped by 70% since its peak in 1976, before rising in the recent years. Chart II-2Historical Perspective On Minimum Wage
Historical Perspective On Minimum Wage
Historical Perspective On Minimum Wage
Importantly, Mexico’s competitiveness problem does not stem from high wages but from a lack of productivity gains. Productivity has been stagnant, and wages in real terms have not risen in many years. Hence, the true test for the nation is to raise productivity, not curb wages. Remarkably, the Mexican peso is very cheap, as measured by the real effective exchange rate based on unit labor costs (Chart II-3). Hence, the minimum wage hike can be viewed as payback after decades of dramatic declines in the minimum wage in real terms. Chart II-3The Mexican Peso Is Cheap
The Mexican Peso Is Cheap
The Mexican Peso Is Cheap
The central bank has overdone it with hiking interest rates: interest rates are currently among the highest of the mainstream EM economies, both in nominal and real terms (Chart II-4). Hence, local rates offer great value relative to other EMs (Chart II-4, bottom panel). Chart II-4High Real And Nominal Interest Rates
High Real And Nominal Interest Rates
High Real And Nominal Interest Rates
Tight fiscal and monetary policies will curb domestic demand and promote disinflation. Money and credit growth remain very sluggish (Chart II-5). This is negative for consumer and business spending, but positive for investors in local currency bonds. Chart II-5Monetary Growth Is Weak
Monetary Growth Is Weak
Monetary Growth Is Weak
The basis is that a retrenchment in domestic demand and thereby imports will help stabilize the trade balance amid low oil prices. Hence, this is on the margin a positive for the peso as well as for local currency bonds relative to their EM counterparts. Finally, Mexico will benefit from its ties to the U.S. economy, unlike many other EMs that are more exposed to China. Investment Recommendation We continue to recommend overweighting the peso and local currency bonds within an EM fixed-income portfolio. Currency traders should maintain our long MXN / short ZAR trade (Chart II-6, top two panels). Chart II-6Remain Overweight Mexican Currency And Fixed-Income
Remain Overweight Mexican Currency And Fixed-Income
Remain Overweight Mexican Currency And Fixed-Income
Credit market investors should continue to overweight Mexican sovereign credit within an EM credit portfolio (Chart II-6, bottom panel). Finally, we are also reiterating our long Mexico position within an EM equity portfolio. While domestic demand growth and corporate profits will continue to disappoint, the declining risk premium on Mexican assets due to a re-assessment among investors of AMLO’s policies warrants a mild overweight in large caps and a sizable overweight in small caps relative to their EM peers. Colombia: Headed Into Another Downtrend The Colombian economy is set to undergo another phase of growth retrenchment: The government is planning to reduce the overall fiscal deficit from 4.5% to 2.4% of GDP by the end of 2019 (Chart III-1). Oil-related revenues make up under 10% of total government revenues, and they are shrinking as both oil production and prices have plunged. Chart III-1Fiscal Policy Will Tighten In 2019
Fiscal Policy Will Tighten In 2019
Fiscal Policy Will Tighten In 2019
As a result, the government should undertake major fiscal cutbacks and hike taxes to achieve the overall budget deficit target of 2.4%. Such substantial fiscal tightening will hurt domestic demand. Regarding the exchange rate, the central bank is pursuing a “hands-off” approach, which is likely to continue. Therefore, the currency is set to depreciate due to the large current account deficit and lack of sufficient foreign funding. Notably, the current account deficit excluding oil is -7% of GDP (Chart III-2, top panel), and the plunge in oil prices and weak domestic demand will cause FDI inflows to drop meaningfully (Chart III-2, bottom panel). Together, this points to further currency depreciation. Chart III-2BoP Dynamics Are Deteriorating
BoP Dynamics Are Deteriorating
BoP Dynamics Are Deteriorating
Meanwhile, the central bank is not in a position to ease policy to offset the impact of fiscal tightening, as a weaker exchange rate historically leads to higher inflation (Chart III-3, top panel). In fact, given core inflation is at the upper end of the central bank’s target range (Chart III-3, bottom panel), a considerable currency depreciation could lead to rate hikes. Raising rates amid weakening growth is a recipe for considerable yield curve flattening. Chart III-3Weaker Currency = Higher Inflation
Weaker Currency = Higher Inflation
Weaker Currency = Higher Inflation
Lending rates remain well above nominal GDP growth, and the banking system is still restructuring following years of a credit boom. Credit growth will remain weak, reinforcing weakness in domestic demand stemming from substantial fiscal tightening. Finally, consumer and business confidence seem to be faltering due to the negative attention surrounding Colombian President Iván Duque Márquez’s policies. The negative terms-of-trade shocks and the imminent fiscal tightening will reinforce worsening sentiment among economic agents. Profound cyclical headwinds to growth indicate that the economy is set to return to a growth recession – a very low but slightly positive growth rate. With respect to investment strategy, we recommend the following: First, we are downgrading this bourse from overweight to neutral within an EM equity portfolio. While overweighting Latin American stocks as a whole within an EM equity portfolio, we believe that Brazilian, Chilean and Mexican share prices offer a better risk-reward profile than Colombian ones (Chart III-4). Chart III-4Colombia Is Unlikely To Outperform LATAM
Colombia Is Unlikely To Outperform LATAM
Colombia Is Unlikely To Outperform LATAM
Second, as to sovereign credit investors, we are reiterating an overweight stance because fiscal tightening and monetary policy orthodoxy as well as low government debt levels will help Colombian sovereign credit to outperform. Third, two opposing cross-currents will shape the domestic bond market. On the one hand, weak growth is positive for bonds. On the other hand, currency depreciation is negative. Net-net, investors in local currency government bonds should be slightly overweight or neutral this market within an EM local bond portfolio. For fixed-income investors, we recommend a new trade: position for yield curve flattening (Chart III-5). This is a bet on a considerable growth slowdown amid looming fiscal austerity. Chart III-5Colombia: Bet On Yield Curve Flattening
Colombia: Bet On Yield Curve Flattening
Colombia: Bet On Yield Curve Flattening
Andrija Vesic, Research Analyst andrijav@bcaresearch.com Footnotes 1 Please see Emerging Markets Strategy Special Report "China Real Estate: A Never-Bursting Bubble?" dated April 6, 2018, available on ems.bcaresearch.com Equity Recommendations Fixed-Income, Credit And Currency Recommendations
Highlights So What? Our “Black Swan” risks for the year reveal several potential wars. Why? While we think it is premature to expect armed conflict over Taiwan, an outbreak of serious tensions is possible. Russia and Ukraine may have a shared incentive to go renew hostilities this year. Saudi Arabia has received a “blank cheque” from Donald Trump, so it may continue to be provocative. Everyone has forgotten about the Balkans … but tensions are building. A “Lame Duck” Trump could stage a military intervention in Venezuela. Feature Over the past three years, we have compiled a list of five geopolitical “Black Swans.” These are low-probability events whose market impact would be significant enough to matter for global investors. Unlike the great Byron Wien’s list of “Ten Surprises for 2018,” we do not assign these events a “better than 50% likelihood of happening.”1 Instead, we believe that the market is seriously underpricing these risks by assigning them only single-digit probabilities when the reality is closer to 10%-15%, a level at which a risk premium ought to be assigned. Furthermore, some of our events below are obscure enough that it is unclear how exactly to price them. But before we get to our list of the five things that keep us up at night,2 a quick note on the question for financial markets in 2019: Will the economic policy divergence between the U.S. and China continue? At the moment, momentum is building behind the narrative that both the U.S. and China have decided to reflate. In anticipation of this narrative switch, we closed our long DM / short EM equity trade on December 3, 2018 for a 15.70% return (originally opened on March 6, 2018). How sustainable is the EM outperformance relative to DM? Will the rest of the world “catch up” to U.S. growth momentum, thus hurting the U.S. dollar in the process? The global central bank – the Fed – is already expected to “back off,” even though members of the FOMC have simply pointed out that they remain data-dependent. Granting our BCA House View that the U.S. economy remains in decent health, U.S. economic data will continue to come in strong through the course of the year. This means that there is scope for a hawkish Fed surprise for the markets, given that the interest rate market already has dovish expectations, anticipating 4.33 basis points and 16.74 basis points of cuts over the next 12 and 24 months respectively (Chart 1).
Chart 1
Meanwhile, the global demand engine – China – may disappoint in its reflationary efforts. We refer to China as the “global demand engine” because the combined imports and capex of China and other emerging markets dwarf that of the U.S. and EU (Chart 2 and Chart 3).3 Chinese imports alone make up $1.6 trillion, constituting 23% of the $7 trillion total of EM imports and about half of EM investment expenditures. Given that large swaths of EM are high-beta to the Chinese economy, the EM-plus-China slice of the global demand pie is leveraged to Beijing’s reflationary policies. Chart 2EM/China Imports Are Much Larger Than U.S.'s And EU's Combined
EM/China Imports Are Much Larger Than U.S.'s And EU's Combined
EM/China Imports Are Much Larger Than U.S.'s And EU's Combined
Chart 3EM/China Capex Is As Large As U.S.'s And EU's Combined
EM/China Capex Is As Large As U.S.'s And EU's Combined
EM/China Capex Is As Large As U.S.'s And EU's Combined
Chinese policymakers have gestured toward greater support for the economy. The communiqué published following the Central Economic Work Conference (CEWC) in December called for a broad stabilization of aggregate demand as a focus of macro policy over the course of 2019. The language was still not very expansionary, but Beijing has launched stimulus despite relatively muted communiqués in the past. The massive stimulus of early 2016, for instance, followed a mixed CEWC communiqué in December 2015. So everything depends on the forthcoming data. Broad money and credit growth improved marginally in December, while the State Council announced that local government bond issuance could begin at the start of the year rather than waiting until spring. Meanwhile, a coordinated announcement by the People’s Bank of China, the Ministry of Finance, and the National Development and Reform Commission declares that a larger tax cut is forthcoming – that is, in addition to the roughly 1% of GDP household tax cuts that went into effect starting late last year. Monetary policy remains very lax with liquidity injections and additional RRR cuts. Before investors become overly bullish, however, we would note that Chinese policymakers are focusing their reflationary efforts on fiscal spending and supply-side reforms like tax cuts. The problem with the latter is that household tax cuts will not add much to global demand, given that consumer goods make up just 15% of China’s imports (Table 1). The vast majority of Chinese imports stem from the country’s capital spending. Table 1China’s Consumer-Oriented Stimulus Will Boost Different Imports Than Past Stimulus
Five Black Swans In 2019
Five Black Swans In 2019
Fiscal spending, meanwhile, is as large as the overall credit origination in the Chinese economy (Chart 4). But without a revival in credit growth, more spending will mainly serve to stabilize the economy, not light it on fire. It is likely that part of the fiscal pump-priming will be greater issuance of local government bonds. However, even the recently announced 1.39 trillion RMB quota for new bonds this year is not impressive. And even a 2 trillion RMB increase would only be equivalent to a single month of large credit expansion (Chart 5). Chart 4China: Credit Origination Is As Large As Government Spending
China: Credit Origination Is As Large As Government Spending
China: Credit Origination Is As Large As Government Spending
Chart 5
As such, tactically nimble investors could profit from a reflationary narrative that sees both the global central bank – the Fed – and the global fiscal engine – China – turning more dovish and supportive of growth. However, we agree with BCA’s Emerging Markets Chief Strategist Arthur Budaghyan, who is on record saying that “Going Tactically Long EM Is Akin To Collecting Pennies In Front Of A Steamroller.” The bottom line for investors is that 2019 is the first year in a decade where the collective intention of policymakers – across the world – is to prepare for the next recession, rather than to prevent a deflationary relapse. This cognitive shift may be slight, but it is important. The Fed and Beijing are engaged in a macroeconomic game of chicken. Each camp is trying to avoid having to over-reflate at the end of the cycle. For the Fed, the goal is to have room to cut rates sufficiently when the recession finally hits. For China, the goal is to ensure that its leverage does not get out of hand. Into this uncertain macroeconomic context we now insert the five Black Swans for 2019. To qualify for our list, the events must be: Unlikely: There must be less than a 20% probability that the event will occur in the next 12 months; Out of sight: The scenario we present should not be receiving media coverage, at least not as a serious market risk; Geopolitical: We must be able to identify the risk scenario through the lens of BCA’s geopolitical methodology. Genuinely unpredictable events – such as meteor strikes, pandemics, crippling cyber-attacks, solar flares, alien invasions, and failures in the computer program running the simulation that we call the universe – do not make the cut. Black Swan 1: China Goes To War With Taiwan One could argue that a military conflict between China and Taiwan in 2019 should not technically qualify for our list, as there has been chatter in the media about such an outcome. Indeed, our recent travels across Asia revealed that clients are taking a much greater interest in our longstanding view – since January 2016 – that Taiwan is the premier geopolitical Black Swan. We established this view well before President Trump won the election and received a congratulatory call from Taiwanese President Tsai Ing-wen, breaking diplomatic practice since 1979. Now, at the beginning of 2019, the exchange of barbs between the Chinese and Taiwanese presidents has raised tensions anew (Chart 6).4 Chart 6Taiwanese Geopolitical Risk Likely To Rise From Here
Taiwanese Geopolitical Risk Likely To Rise From Here
Taiwanese Geopolitical Risk Likely To Rise From Here
Nonetheless, Taiwan makes the cut here because we doubt that most of our global clients take the issue seriously. Furthermore, we are concerned that – with fair odds of a U.S.-China trade truce lasting through 2019 – cross-strait tensions could fall out of sight. The basis of our view is that there is a unique confluence of political developments in Beijing, Washington, and Taipei that is conducive toward a diplomatic or military incident that could escalate tensions: Taiwan’s pro-independence Democratic Progressive Party (DPP), in addition to taking the presidency in 2016, won control of the legislature for the first time ever (Chart 7). This means that domestic political constraints on President Tsai Ing-wen’s administration are lower than usual. Tsai has angered Beijing by seeking stronger relations with the U.S. and refusing to endorse the 1992 Consensus, which holds that there is only “One China” albeit two interpretations. China’s General Secretary Xi Jinping has removed term limits and placed greater emphasis on the reunification of Taiwan. Xi has consolidated power domestically and has pursued a more aggressive foreign policy throughout his term, including in the South China Sea, where greater naval control would enable China to threaten Taiwan’s supply security. Xi’s blueprint for his “New Era” includes the reunification of China, and some have argued that there is a fixed timetable for reunification with Taiwan by 2050 or even 2035.5 Some recent military drills can be seen as warnings to Taiwan. U.S. President Trump called the One China Policy into question at the outset of his term in office (only later reaffirming it), and has presided over an increase in U.S. strategic pressure against China, such as the trade war and freedom of navigation operations, including in the Taiwan Strait. Trump’s National Security Adviser John Bolton and Assistant Defense Secretary Randall Schriver are seen as Taiwan hawks, while the just-concluded Republican Congress passed the Taiwan Travel Act and the Asia Reassurance Initiative Act (ARIA), which imply an upgrade to the U.S. commitment to Taiwan’s democracy and security.6
Chart 7
These three factors suggest that, cyclically, there is larger room than usual for incidents to occur that initiate a vicious cycle of tensions. The odds of a full-fledged war are still very low – the U.S. has reaffirmed the One China Policy in its recent negotiations with Beijing, which seem to be progressing, while China has not changed its official position on Taiwan. Beijing’s reunification timetable still has a comfortable 30 years to go. The Chinese economy has not collapsed, so there is no immediate need for Beijing to dive headlong into a nationalist foreign policy adventure that could bring on World War III. However, the odds of diplomatic incidents, or military saber rattling, that then trigger a dangerous escalation and a multi-month period of extremely elevated tensions are much higher than the market recognizes. This is because the U.S. and China may still see strategic tensions flare even if they make progress on a trade deal, while a failure on the trade front could spark a spillover into strategic areas. Any cross-strait incident would be relevant to global investors – and not just Taiwanese assets, which would suffer the brunt of economic sanctions – because the slightest increase in the odds of a full-scale war would be extremely negative for global risk appetite. Over the next 12 months, we would mostly expect Beijing to eschew high-profile provocations. The reason is that President Tsai is unpopular and the recent local elections in Taiwan saw her DPP lose seats to the more China-friendly Kuomintang (Chart 8). An aggressive posture could revive the DPP ahead of the January 2020 presidential election, the opposite of what Beijing wants.7
Chart 8
On the other hand, Beijing could decide to ignore the 1996 precedent and choose outright military intimidation. Or it could attempt to meddle in Taiwan’s domestic politics, as it has been accused of doing in the recent local elections.8 Meanwhile, the U.S. and Taiwan are the more likely instigators of an incident over these 12 months, knowingly or not. Washington and Taipei have a window of opportunity to achieve a few concrete objectives while Presidents Tsai and Trump are still in office – which cannot be guaranteed after 2020. A similar window of opportunity caused a market-relevant spike in China-South Korea tensions back in 2015-17, when the United States, seeing that the right-wing Park Geun-hye administration was falling out of power, attempted to rush through the deployment of the Terminal High Altitude Area Defense (THAAD) missile system in South Korea. As a result, China imposed economic sanctions on its neighbor (Chart 9). Chart 9China Hits South Korea Over THAAD
China Hits South Korea Over THAAD
China Hits South Korea Over THAAD
Something similar could transpire over the next year if the U.S. sends a high-level official – say, Bolton, or Secretary of State Mike Pompeo, or even Vice President Mike Pence – to hold talks in Taiwan. Or if the U.S. stages a major show of force in the Taiwan Strait, as it threatened in October, or U.S. naval vessels call on Taiwanese ports. The U.S. could also announce bigger or better arms packages (Chart 10), such as submarine systems, which have been cleared by the Department of State. Given the elevated U.S.-China and China-Taiwan tensions overall, such an incident could cause a bigger escalation than the different participants expect – and even more so than the market currently expects. Chart 10U.S. Arms Sales To Taiwan Could Provoke Beijing
U.S. Arms Sales To Taiwan Could Provoke Beijing
U.S. Arms Sales To Taiwan Could Provoke Beijing
Bottom Line: Cyclically, the period between now and the inauguration of the next Taiwanese president in May 2020 brings heightened risk of a geopolitical incident. Depending on what happens in 2020, tensions could rise or fall for a time. Yet structurally, as Sino-American strategic distrust continues to build, Taiwan will continually find itself at the center of the storm. Black Swan 2: Russia And Ukraine Agree To Go To War Tensions are mounting between Russia and Ukraine in the run-up to the March 31 Ukrainian presidential election. Incumbent President, Petro Poroshenko, has been trailing in the polls for a year. His rival is the populist Yulia Tymoshenko, who has been leading both first-round and second-round polling. Both Poroshenko and Tymoshenko have, at various points in their careers, been accused of being pro-Russian. Poroshenko’s business interests, as with most successful Ukrainian businesspeople, include considerable holdings in Russia. Tymoshenko, on the other hand, was imprisoned from 2011 to 2014 for negotiating a gas imports contract with Russia that allegedly hurt Ukrainian interests. With the most pro-Russian parts of Ukraine either cleaved off (Crimea) or in a state of lawlessness (Donetsk and Luhansk), the median voter in the country has become considerably more nationalist and anti-Russian. It therefore serves no purpose for any politician to campaign on a platform of normalizing relations with Moscow. In this context, the decision by the Patriarchate of Constantinople – the first-among-equals of the Christian Orthodox churches – to grant autocephaly (sovereignty) to the Orthodox Church of Ukraine in January is part of the ongoing evolution of Ukraine into an independent entity from Russia. This process could create tensions, particularly as parts of the country continue to be engaged in military conflict (Map 1). From Moscow’s perspective, the autocephaly grants Ukraine religious – and therefore some semblance of cultural – independence from Russia. This solidifies the loss of a 43-million person crown jewel from the Russian sphere of influence.
Chart
Moscow is also not averse to stoking tensions. Although President Putin’s mandate will last until 2024, his popularity is nearly at the lowest level this decade. Orthodox monetary and fiscal policy, along with pension reforms, have sapped his political capital at home. In 2014, tensions over Ukraine spurred nationalist sentiment in Russia, rapidly increased popular support for both Putin and his government (Chart 11). Putin may calculate that another such recapitalization may be needed. Chart 11Non-Negligible Risk Of Russian Aggression
Non-Negligible Risk Of Russian Aggression
Non-Negligible Risk Of Russian Aggression
The danger is therefore that domestic politics in both Ukraine and Russia may create a window of opportunity for a skirmish this quarter. Perhaps something akin to the naval tensions around the Kerch Strait that ultimately cost President Putin a summit with President Trump at the G20 meeting in December. While these incidents may benefit both sides domestically, and may even appear carefully orchestrated, they could also get out of hand in unpredictable ways. Bottom Line: While both Kiev and Russia may see a short-termed conflict as domestically beneficial, such an outcome could have unforeseen consequences. At the very least, it could sap already poor business confidence in neighboring Europe, as it did in 2014-2015. Black Swan 3: Saudi Arabia With A Blank Cheque One of the greatest geopolitical blunders of the twentieth century was Berlin’s decision to give its ally Austro-Hungary a “blank cheque.” Austro-Hungary was an anachronism at the turn of the century – a multiethnic empire held together by allegiance to a royal family. As such, the ideology of nationalism represented an existential threat, particularly given that 60% of the empire’s population was neither Austrian nor Hungarian. Following the assassination of its crown prince Archduke Franz Ferdinand by a pan-Slavist terrorist in Sarajevo, Vienna decided that a total destruction of Serbia was necessary for geopolitical and domestic political reasons. Today, Saudi Arabia is in many ways an anachronism itself. It is the world’s last feudal monarchy. Its leaders understand the risks and have begun an ambitious and multifaceted reform effort. Unlike Austro-Hungary, Saudi Arabia has learned to embrace nationalism. Riyadh is using the war in Yemen, as well as targeted actions against its own royal family and the religious establishment, to build a modern nation-state. The problem is that, much as nationalism was an ideological kryptonite for Vienna, democratic Islamism is an existential problem for Riyadh and its peers among the Gulf monarchies. Neighboring Qatar, a tiny peninsular kingdom enjoying an oversized geopolitical influence due to its natural gas wealth, has supported various groups across the Middle East that believe that democracy and conservative Islam are compatible. Turkey and Qatar have often cooperated in this effort, as the ruling Justice and Development Party (AKP) of Turkey has served as a model for many such Islamist parties in the region. Why Qatar hitched its geopolitical wagon to democratic Islamism is not clear. Perhaps its leaders felt that it was the only option unclaimed by an energy-rich sponsor. Regardless, Qatar’s support of the Muslim Brotherhood and other such groups has clearly irked Saudi Arabia and other Gulf monarchies, enough for them to kick Qatar out of the Gulf Cooperation Council (GCC). In 2017, with the pro-Saudi Trump administration ascendant in the White House, Riyadh felt emboldened enough to break off all diplomatic relations with Qatar and impose an economic blockade. Since 2014, another dynamic has emerged in the region that raises further concerns: a scramble for material resources brought on by the end of +$100 per barrel oil prices. Saudi public expenditures have been steadily rising since 2008, both due to population growth, social welfare spending in the wake of Arab Spring rebellions, and astronomical defense spending to counter the rising influence of Iran. And yet, 2014 saw oil prices plunge to decade lows in a matter of months. Saudi Arabia’s fiscal breakeven oil price has doubled, in a decade, from under $40 per barrel to $83 per barrel in 2018 (Chart 12). Meanwhile, Qatar’s GDP is a quarter of that of Saudi Arabia, even though its population is less than 2% of Saudi Arabia’s. Chart 12Saudi Arabia Has A Fiscal Problem
Saudi Arabia Has A Fiscal Problem
Saudi Arabia Has A Fiscal Problem
Rumors that the U.S. Defense Secretary James Mattis prevented a Saudi invasion of Qatar in 2018 have largely been dismissed by the mainstream media. But should they be? If allegedly “rogue elements” of the Saudi intelligence establishment can dismember a journalist in a consulate, why couldn’t “rogue elements” of its military stage a coup – or an outright invasion – in neighboring Qatar? Such an outcome would truly be extraordinary, but so was the annexation of Crimea in 2014. Meanwhile, President Trump offered an extraordinary level of support for Riyadh by issuing what we can only refer to as a “blank cheque” following Khashoggi’s murder. In the November 20 statement, President Trump essentially created a new policy doctrine of standing with Saudi Arabia “no matter what.”9 Two weeks later, Riyadh “thanked” the U.S. President by slashing the OPEC oil output by 1.2 million barrels per day. From this dynamic, it appears that Washington has made a similar strategic blunder in 2018 that Berlin did in 1914. A weakened, stressed, and threatened ally has been given a “blank cheque” by its stronger ally. Such a sweeping offer of support may lead to unintended consequences as the weaker ally feels that its material and geopolitical constraints can be overcome. In Saudi Arabia’s case, that could mean a more aggressive policy towards Qatar, or perhaps Iran. Particularly now that the White House has seen several realist members of the Trump cabinet – such as Mattis and former Secretary of State Rex Tillerson – replaced by Iran hawks and Trump loyalists. Bottom Line: A combination of less independent-minded cabinet members in the White House and a clear “blank cheque” from President Trump to Saudi Arabia could cause geopolitical risk to re-emerge in the Middle East. In the near term, this could increase the geopolitical risk premium on oil prices – as measured by the residual in Chart 13.
Chart 13
Black Swan 4: The Balkans Become A Powder Keg … Again Bismarck famously said in 1888 – 26 years before the outbreak of the Great War, that “one day the great European War will come out of some damned foolish thing in the Balkans.” The Balkans are far less geopolitically relevant today than in the early twentieth century. They are also exhausted following a decade-long Yugoslav rigor mortis in the 1990s which yielded at least three regional wars and now six (or seven, depending who is counting) independent states. The problem is that tensions have not disappeared. Two frozen conflicts remain. First, Bosnia and Herzegovina is a sovereign country made up of two political entities, with the Serb-dominated Republika Srpska agitating for independence and aligning with Russia. Second, tensions between Serbia and Kosovo took a turn for the worse late last year as Kosovo imposed an economic embargo on trade with Serbia and called for the creation of a military. Has anything really changed over the course of the decade? We think there are three causes for alarm: Tensions between Russia and the West have become serious, with both camps looking to score tactical and strategic wins across the globe. With the Syrian Civil War all but over, a new battleground may emerge. While Republika Srpska is essentially an outright ally of Russia, Serbia continues to try to straddle the fine line between an EU enlargement candidate and geopolitical neutrality. However, this high-wire act is becoming untenable as… Enlargement fatigue sets in the EU. There is no doubt that the EU enlargement process froze Balkan conflicts. Countries like Serbia and Kosovo have an incentive to be on their best behavior so long as the prospect of eventual EU membership remains. But in the current environment of introspection, the EU may not have enough of a coherent geopolitical vision to deal with the Balkans without a crisis. The global economic cycle may be ending, leading to a global recession in the next 12-to-24 months. While our BCA House View remains that the next recession will be a mild one in the U.S., we think that EM and, by extension, frontier markets could be the eye of the storm in the next downturn. As investors abandon their “search for yield” in riskier geographies, they could exacerbate poor governance, political tensions, and geopolitical cleavages that have been frozen in place by the last economic cycle. Finally, U.S. policy towards the Balkans is unclear. In the past, the U.S. asked all countries in the region to accept the status quo and prepare for EU integration. But with the U.S. now adopting an antagonistic view towards the EU bloc, it is unclear what Washington’s message to the Balkans will be. After all, Trump has personally encouraged all other world leaders to don their own version of the “America First” slogan. The only problem in a place like the Balkans is that “Serbia first” – or Croatia and Kosovo first – is unlikely to go down smoothly in the neighborhood, given the last twenty – or even hundred – years. Bottom Line: The powder keg that is the Balkans has not been dried for decades. However, several tailwinds of stability are gone, replaced with macro headwinds. A renewed conflict on Europe’s doorstep could be the next great geopolitical crisis. If this were to occur, we would bank on greater European integration, especially in terms of military and foreign policy. However, it could also mark the first break in U.S.-EU foreign policy if the two decide to pick opposing sides in the region. Black Swan 5: Lame Duck Trump For our final Black Swan, we are sticking with one of our 2018 choices: a “Lame duck” presidency. “Lame duck” presidents – leaders whose popularity late in their terms have sunk so low that they can no longer affect policy – are said to be particularly adventurous in the foreign arena. While this adage has a spotty empirical record, there are several notable examples in recent memory.10 American presidents have few constitutional constraints when it comes to foreign policy. Therefore, when domestic constraints rise, U.S. presidents can seek relevance abroad. President Trump may become the earliest, and lamest, lame duck president in recent U.S. history. While his Republican support remains strong (Chart 14), his overall popularity is well below the average presidential approval rating at this point in the political cycle (Chart 15). Now there is also a Democrat-led House of Representatives to stymie his domestic policy and launch independent investigations into both his administration’s conduct and his personal finances and dealings.
Chart 14
Chart 15
We would also add the Senate to the list of problems for President Trump. The electoral math was friendly towards the Republicans in 2018, with Democrats defending 10 Senate seats in states that President Trump won in 2016. In 2020, however, two-thirds of the races will be for Republican-held seats. As such, many Republican senators may begin campaigning early by moving away from President Trump. What kind of adventures would we expect to see President Trump embark on in 2019? Last year, we identified “China-U.S. trade war,” “Iran jingoism,” and “North Korea” as potentials. In many ways, 2018 was the year when all three mattered. Going forward, however, we think that trade war and the Middle East might take a backseat. First, the bear market in equities has raised the odds of a recession. As such, the potential cost of pursuing the trade war further has been increased. So has an aggressive policy towards Iran that dramatically boosts oil prices. Furthermore, President Trump has signaled that he is willing to withdraw from the Middle East, calling for a full withdrawal from Syria and telegraphing one from Afghanistan. Instead, we see President Trump potentially following in the footsteps of previous U.S. administrations and finding relevance in Latin America. A military intervention in Venezuela, to ostensibly support a coup against the current regime, would find little opposition domestically. First, there is no doubt that Venezuela has become a genuine humanitarian disaster. Second, its oil output is on a downward spiral already, with only 1 million b/d of production at risk due to a potential military conflict (Chart 16). Third, the new Bolsonaro administration in Brazil may even support an intervention, as well as neighboring Colombia. This is a change from the last twenty years, in which Latin American countries largely stuck together, despite ideological differences, in opposition to U.S. interference in the continent’s domestic affairs. Chart 16On A Downward Spiral
On A Downward Spiral
On A Downward Spiral
Finally, even the anti-Trump U.S. foreign policy establishment may support an intervention. Not only is there the issue of human suffering, but Russia and China have used Venezuela as an anchor to build out influence in America’s sphere of influence. Furthermore, the potential promise of Venezuela’s eventual energy production is another reason to consider an American intervention (Chart 17).
Chart 17
Bottom Line: American presidents rarely decide to go softly into that good night. It is very difficult to see President Trump become irrelevant. With tensions with China carrying a high economic cost and military interventions in the Middle East remaining politically toxic in the wake of Iraq and Afghanistan wars, perhaps President Trump will decide to go “retro,” in the sense of a throwback Latin America intervention. Marko Papic, Senior Vice President Chief Geopolitical Strategist marko@bcaresearch.com Matt Gertken, Vice President Geopolitical Strategy mattg@bcaresearch.com Footnotes 1 Please see, Blackstone, “Byron Wien Announces Ten Surprises For 2018,” dated January 2, 2018, available at blackstone.com. 2 A shoutout to another doyen of the financial industry, Alastair Newton! 3 Please see BCA Emerging Markets Strategy Special Report, “Deciphering Global Trade Linkages,” dated September 27, 2018, available at ems.bcaresearch.com. 4 Please see “Highlights of Xi’s speech at Taiwan message anniversary event,” China Daily, January 2, 2019, available at www.chinadaily.com.cn; and “President Tsai Issues Statement On China’s President Xi’s ‘Message To Compatriots In Taiwan,’” Office of the President, Republic of China (Taiwan), January 2, 2019, available at english.president.gov.tw. 5 Please see Xi Jinping, “Secure a Decisive Victory in Building a Moderately Prosperous Society in All Respects and Strive for the Great Success of Socialism with Chinese Characteristics for a New Era,” section 3.12, October 18, 2017, available at www.xinhuanet.com; and Deng Yuwen, “Is China Planning To Take Taiwan By Force In 2020?” South China Morning Post, July 20, 2018, available at beta.scmp.com. 6 Please see United States, H.R. 535, Taiwan Travel Act, 115th Congress (2017-18), available at www.congress.gov and S. 2736, Asia Reassurance Initiative Act of 2018, 115th Congress (2017-18), available at www.congress.gov. 7 This is precisely what occurred when China chose missile tests in 1995-96 and drove voters toward the very candidate, Lee Teng-hui, that Beijing least desired. The popular Taipei Mayor Ko Wen-je may run for president in 2020, and Beijing may see him as preferable to President Tsai. He has spoken of China and Taiwan as being part of the same family and he has held city-to-city talks between Shanghai and Taipei despite the shutdown in direct talks between Beijing and Taipei. 8 Please see Andrew Sharp, “Beijing likely meddled in Taiwan elections, US cybersecurity firm says,” Nikkei Asian Review, November 28, 2018, available at asia.nikkei.com. 9 Please see “Statement from President Donald J. Trump on Standing with Saudi Arabia,” The White House, dated November 20, 2018, available at whitehouse.org. 10 President Clinton launched the largest NATO military operation against Yugoslavia amidst impeachment proceedings against him, while President George H. W. Bush ordered U.S. troops to Somalia a month after losing the 1992 election. Ironically, President George H. W. Bush intervened in Somalia in order to lock in the supposedly isolationist Bill Clinton, who had defeated him three weeks earlier, into an internationalist foreign policy. President George W. Bush ordered the “surge” of troops into Iraq in 2007 after losing both houses of Congress in 2006; President Obama arranged the Iranian nuclear deal after losing the Senate (and hence Congress) to the Republicans in 2014. Geopolitical Calendar
Highlights On the bright side, Malaysia’s structural backdrop is improving notably, especially in the semiconductors segment. Yet the cyclical growth outlook remains downbeat. While we are maintaining a market-weight allocation to Malaysian equities within an EM equity portfolio, we are putting this bourse on our upgrade watch list. As a play on the ameliorating structural outlook, we recommend an overweight position in Malaysian small-cap stocks relative to the EM universe – both the small-cap and overall equity benchmarks. Feature Malaysian stocks have performed quite poorly in recent years: the equity index, in U.S. dollars, is close to its 2016 lows in absolute terms, and relative to the emerging markets (EM) benchmark, it is not far from the lows of last decade (Chart I-1). Chart I-1Malaysian Stocks & Commodities Prices: Tight Relationship
Malaysian Stocks & Commodities Prices: Tight Relationship
Malaysian Stocks & Commodities Prices: Tight Relationship
Odds are that a structural bottom in this bourse’s relative performance versus the EM index may have been reached. Hence, we are putting Malaysian equities on our upgrade watch list while maintaining a market-weight allocation due to tactical considerations. On the negative side, the past credit excesses have not been recognized and provisioned for by Malaysian commercial banks. The latter account for a notable 34% of the MSCI Malaysia index, and they will be a drag on this bourse's performance. Absolute performance also still hinges on global growth, commodities prices and the overall direction of Asian/EM markets. We are still negative on these parameters. Critically, there are various signs indicating an ameliorating structural backdrop in Malaysia. The country is undergoing notable improvements in the semiconductor sector, thereby reducing its dependence on commodities and increasing its exposure to a high-value industry. To capitalize on this theme of an improving structural backdrop, we are recommending an overweight position in Malaysian small-cap stocks relative to the EM universe – both the small-cap and overall equity benchmarks. Shifting Away From Commodities And Toward Electronics Parting Ways With Commodities Malaysia and its financial markets have been very exposed to commodities prices over the past 15 years or so (Chart I-1, top panel). Nevertheless, the country seems to be shifting away from its considerable reliance on the resource sector and moving into other value-added segments: in particular, semiconductors and technology. Such a structural shift – if successful – would be an extremely positive development as it would lead to rising productivity gains and higher per capita income growth. In short, the country would be able to achieve higher rates of sustainable non-inflationary growth, feeding into a sustainable bull market in Malaysian equities. Several points are noteworthy in this regard: The real output of crude and petroleum products as well as palm oil are declining sharply relative to the economy’s real total output (Chart I-2). Chart I-2Malaysia's Commodities Output Is Falling In Importance
Malaysia's Commodities Output Is Falling In Importance
Malaysia's Commodities Output Is Falling In Importance
Exports volumes of palm oil, crude oil and natural gas have all been falling relative to Malaysia’s total overseas shipment volumes (Chart I-3). Chart I-3Commodities Export Volumes Are Declining In Relative Terms
Commodities Export Volumes Are Declining In Relative Terms
Commodities Export Volumes Are Declining In Relative Terms
Crude oil, gas, and palm oil now account for 4%, 5%, and 7% of total exports in value terms, respectively. Crucially, not only is the importance of commodities in the overall Malaysian economy diminishing in volume terms, it is also falling in nominal terms due to low resource prices. For instance, net export revenues from fuel (i.e. crude oil, petroleum and natural gas) have fallen from US$18 billion in 2013 to US$5 billion today (Chart I-4, top panel). Chart I-4Commodities' Net Export Revenues Are Also Diminishing
Commodities' Net Export Revenues Are Also Diminishing
Commodities' Net Export Revenues Are Also Diminishing
Meanwhile, net exports of palm oil (and other plant-based fats) have dropped from US$20 billion to US$10 billion (Chart I-4, bottom panel). Improvement In High-Value-Added Manufacturing There are also some positive structural signs taking place in the Malaysian economy that are signaling an improvement in productivity and competitiveness: Malaysian export volumes of machinery and transport equipment are expanding in absolute terms as well as relative to overall export volumes (Chart I-5, top and middle panels). Chart I-5Malaysia's Machinery Exports Are Rocking
Malaysia's Machinery Exports Are Rocking
Malaysia's Machinery Exports Are Rocking
Remarkably, Malaysian aggregate export volumes are quickly regaining lost global market share (Chart I-5, bottom panel). Further, the ratio of exports to imports has hit a structural bottom and is slowly picking up in volume terms (Chart I-6). Chart I-6Malaysian Overall Exports Are Regaining Lost Market Share
Malaysian Overall Exports Are Regaining Lost Market Share
Malaysian Overall Exports Are Regaining Lost Market Share
This suggests some improvements in the competitiveness of domestic industries is slowly underway. Meanwhile, Malaysian high-skill and technology intensive exports as a share of global high-tech exports seem to have made a major bottom in U.S. dollar terms and will begin to rise (Chart I-7). Chart I-7Bottom In Malaysia's High-Tech Global Share?
Bottom In Malaysia's High-Tech Global Share?
Bottom In Malaysia's High-Tech Global Share?
Advanced education enrollment is high and improving – and is only outpaced by Korea and China in emerging Asia (Chart I-8). Importantly, Malaysia has among the best demographics of mainstream developing countries. The working age population as a share of the total population will continue to be high all the way to 2040. Chart I-8Malaysians Like Going To School
Malaysians Like Going To School
Malaysians Like Going To School
Malaysian expenditures on R&D have also been on the rise, outpacing a lot of other countries in the region (Chart I-9, top panel). R&D expenditures in Malaysia could also be catching up to Singapore’s (Chart I-9, bottom panel). Chart I-9Malaysia's Expenditure On R&D Is Rising
Malaysia's Expenditure On R&D Is Rising
Malaysia's Expenditure On R&D Is Rising
In line with these positives, net FDIs into Malaysia have been rising briskly (Chart I-10). Importantly, these investments have been driven by European companies, meaning the latter are transferring valuable technological know-how to Malaysia. Chart I-10Net FDIs Are Rising
Net FDIs Are Rising
Net FDIs Are Rising
The Malaysian ringgit is cheap (Chart I-11) and has reached almost two-decade lows against many Asian currencies. This makes Malaysia increasingly more competitive. Chart I-11The Ringgit Is Cheap
The Ringgit Is Cheap
The Ringgit Is Cheap
Finally, our colleagues from the Geopolitical Strategy team believe that the recently elected Pakatan Harapan government will improve governance and transparency, which had significantly deteriorated under Najib Razak’s rule. A Marriage To Electronics Malaysia is attempting to reestablish itself as a major semiconductor hub in the region. Remarkably, after declining for 15 years, semiconductor exports are finally rising as a share of GDP (Chart I-12) and Malaysian semiconductor exports are outperforming those of its neighbors. Chart I-12Malaysian Semiconductor Exports Are Booming
Malaysian Semiconductor Exports Are Booming
Malaysian Semiconductor Exports Are Booming
The Malaysian government since 2010, has identified the semiconductor sector as a key area for development and prosperity. In turn, it has been introducing programs and setting up institutions to support the industry. The 2019 budget reinforces the government’s priority to develop the sector. Several anecdotal observations confirm that Malaysia is moving up the value chain in the semiconductor industry, and is going beyond simple testing and assembly: Growing the semiconductor cluster: The Malaysian Institute of Microelectronic Systems (MIMOS) has established a shared services platform for advanced analytical services in the semiconductor industry to provide support to Malaysian semiconductor companies. The Economic Industrial Design Centre (EIDC) is also providing support to SMEs in order to enhance their efficiency. Similarly, the Semiconductor Fabrication Association of Malaysia (SFAM) has been partnering with local universities to enhance their engineering programs and offer training, internships and research opportunities for students. Developing home-grown semiconductors: In 2015, Malaysian public institutions in partnership with private companies developed the Green Motion Controller (GMS), an integrated circuit that reduces energy consumption. This semiconductor is an energy efficient controller that carries applications in hybrid cars and air conditioners, among other things. Nanotechnology: NanoMalaysia – a nanotechnology commercialization agency – is providing services to SMEs and start-ups to help increase their competitiveness by enabling them to upgrade to more efficient production methods. Light-emitting Diode (LED) manufacturing: Malaysia is becoming a hub for the manufacturing of energy efficient LED chips. This is the result of OSRAM’s – a German light manufacturer – large investment in a high-tech production facility. There are early signs already that the above developments are beginning to bear results. Chart I-13 shows that the difference between exports and imports of semiconductors (in U.S. dollars) have been surging. This shows Malaysia is able to add greater value to the semiconductors it imports and then re-exports. Chart I-13Malaysia Adds Value To The Semis It Imports
Malaysia Adds Value To The Semis It Imports
Malaysia Adds Value To The Semis It Imports
Bottom Line: Commodities are declining in importance to the Malaysian economy. Meanwhile, Malaysia’s structural backdrop is improving as the semiconductor and hardware technology segments are rising in prominence. Cyclical Weakness Despite the positive structural backdrop, Malaysia’s cyclical outlook remains challenging. Our view on commodities and global trade continues to be negative. Not only are commodities prices deflating but semiconductor prices are also falling, and their global shipments are weakening (Chart I-14). Chart I-14Cyclical Weakness In Global Semiconductor Cycle
Cyclical Weakness In Global Semiconductor Cycle
Cyclical Weakness In Global Semiconductor Cycle
The epicenter of the global trade slowdown, however, will be in Chinese construction activity. Consequently, industrial resources prices are more vulnerable than electronics in this global growth downturn. The above deflationary forces would negatively shock Asia’s growth outlook, and consequently Malaysian growth as well: The top panel of Chart I-15 shows that Malaysian narrow money growth has already rolled over decisively and is foreshadowing weaker bank loan growth. Chart I-15Malaysian Domestic Growth Set To Weaken
Malaysian Domestic Growth Set To Weaken
Malaysian Domestic Growth Set To Weaken
Slower bank loan growth will weaken purchasing power and impact domestic consumption. The middle panel of Chart I-15 shows that car sales – having surged this summer because of the abolishment of the GST – are weakening anew. Malaysian companies and banks have among the largest foreign currency debt loads (Table I-1). We expect more currency depreciation in Malaysia, as we do in EM overall. This will make foreign currency debt more expensive to service, and consequently dampen companies’ and banks’ appetites for expansion. Table I-1Malaysia's External Debt Breakdown
Malaysia: Structural Improvements Despite Cyclical Weaknesses
Malaysia: Structural Improvements Despite Cyclical Weaknesses
Finally, the real estate sector remains depressed. Property volume sales are contracting and have dropped to 2008 levels, and housing construction approvals are slumping (Chart I-16). Chart I-16Malaysia's Property Sector Is Depressed
Malaysia's Property Sector Is Depressed
Malaysia's Property Sector Is Depressed
While this means that cleansing has been taking place in the property sector, the banking sector has not recognized NPLs and remains the weakest link in the Malaysian economy. Specifically, the top panel of Chart I-17 illustrates that the NPLs in the banking system still stand at a mere 1.5%. This is in spite of the fact that since 2009, non-financial private sector credit to GDP has risen significantly. Therefore, the true level of NPLs is probably considerably higher. Chart I-17Malaysian Banks Are Under-Provisioned
Malaysian Banks Are Under-Provisioned
Malaysian Banks Are Under-Provisioned
Further, Malaysian banks have been lowering provisions to boost profits (Chart I-17, bottom panel). This is unsustainable. As growth weakens, Malaysian banks will see their NPLs rise and will need to raise provisions. Chart I-18 demonstrates that if provisions rise by 20%, bank operating earnings will contract and bank share prices would fall. Chart I-18Malaysian Banks' Share Prices Will Fall
Malaysian Banks' Share Prices Will Fall
Malaysian Banks' Share Prices Will Fall
Bottom Line: Malaysia’s cyclical growth outlook is still feeble, with the banking system being the weakest link. Banks’ large weight in the equity index makes this bourse still vulnerable in the coming months. Optimal Macro Policy Mix Fiscal Consolidation… Fiscal policy is set to be tighter as per the Malaysian government budget announced on November 2 and its preference to pursue fiscal consolidation to reduce the deficit. The budget projects only a slight increase in expenditures in 2019, which means it will likely slowdown from 8% currently (Chart I-19). Chart I-19Government Expenditure Growth Will Soften
Government Expenditure Growth Will Soften
Government Expenditure Growth Will Soften
The government will also recognize public-sector liabilities not presently shown on its balance sheet and strengthen both transparency and administrative efficiency. Critically, the budget also includes strategies to support the entrepreneurial part of the economy. Overall, this budget bodes very well for the structural outlook. Yet it will not support growth cyclically. …To Be Offset By Easy Monetary Policy Despite continued currency weakness, the Malaysian monetary authorities will not be in a hurry to raise interest rates to defend the ringgit. This is in contrast with other central banks in the region like Indonesia and the Philippines. This is presently an optimal policy mix for Malaysia and is positive for the stock market’s relative performance versus its counterparts in many other EMs. Malaysia’s structural inflation is low: core inflation hovers around zero. Therefore, the central bank will neither raise interest rates nor sell its foreign exchange reserves to defend the currency. Both currency depreciation and low interest rates are needed to mitigate the downturn in exports as well as offset fiscal consolidation. In the meantime, the ringgit is unlikely to depreciate in a sudden and vicious manner but rather will likely fall gradually. First, the current account will remain in surplus, even as global trade contracts. The basis is that if Malaysian exports fall, imports will simultaneously follow. The country imports a lot of intermediate goods to then process and re-export. Second, Malaysia is unlikely to witness pronounced capital flight as occurred in 2015. The new government has increased confidence in the economy among both locals and foreigners. In addition, net portfolio investments have been negative for a while. This means that a large amount of foreign capital has exited already, reducing the risk of further outflows. What’s more, foreign ownership of local currency bonds has fallen from 33% in June 2016 to 24% today. Moreover, at 28% of market cap, foreign ownership of equities is among the lowest in EM. These also limit potential foreign selling. Bottom Line: Policymakers are adopting a wise policy mix for the economy at the current juncture: tight fiscal and easy monetary policies. This is structurally positive, even if it does not preclude cyclical weakness. Investment Conclusions Weighing structural positives versus the cyclical growth weakness and the unhealthy banking system, we are maintaining a market-weight allocation to Malaysian stocks within the EM universe, but are placing this bourse on our upgrade watch list. We need to see a selloff in bank stocks before we upgrade it to overweight. Within Malaysian equities, we recommend shorting/underweighting banks and going long/overweighting small cap stocks. To capitalize on Malaysia’s improving structural growth outlook, we recommend buying Malaysian small caps, but hedging positions by shorting the EM aggregate or small-cap indexes. The ringgit is poised to depreciate further versus the U.S. dollar along with other EM/Asian currencies. We continue to short the ringgit versus the greenback. With respect to sovereign credit and local government bonds, dedicated portfolios should currently have a market-weight allocation. The negative cyclical growth outlook is offset by the right macro policy mix and improving growth potential. Ayman Kawtharani, Associate Editor ayman@bcaresearch.com Equity Recommendations Fixed-Income, Credit And Currency Recommendations
Feature An infrastructure bill has been the focus of economists and strategists as the next leg in fiscal easing to sustain the economy. On the face of it, such a thesis appears eminently believable. Despite historically low unemployment, 2018 has seen tremendous fiscal easing (Chart 1), both via the tax cuts at the end of 2017 and through the bipartisan spending agreement in early 2018, implying the current administration fears neither inflation nor deficits in its pursuit of economic growth. Further, after the Republicans’ shellacking in the midterm elections, it is also logical to expect the GOP to double down on their Trump card through the 2020 presidential election cycle. Chart 1An Already-Strong Fiscal Thrust
An Already-Strong Fiscal Thrust
An Already-Strong Fiscal Thrust
As such, much hope has been placed in the passage of an infrastructure bill, which began in late 2016 following the election of the Trump administration and its promise “to invest $550 billion to ensure we can export our goods and move our people faster and safer”. The excitement surrounding infrastructure diminished following the passage of the Tax Cuts and Jobs Act and the implied much lower probability of an infrastructure bill in light of the debt implications of the unfunded tax cut. Further, the White House released their infrastructure plan in February, 2018 which sought only $200 billion in funding, but planned to stimulate $1.5 trillion in new investment via the multiplicative effect of public-private partnerships (PPP). However, the midterm elections have made infrastructure a hot topic once again for our clients. Is passage of an infrastructure bill likely? Would such a bill prolong the business cycle? At first glance, the market’s dimmed hopes of an infrastructure bill seem justified, in the context of the already-powerful fiscal thrust. Still, our sister Geopolitical Strategy service believes the odds of passage are above 50%. BOX 1 Will Trump And The Democrats Pass An Infrastructure Bill? President Donald Trump, laser focused on reelection in 2020, faces a big decision about how to conduct domestic policy in the wake of the midterm election. Will he negotiate and compromise with the opposition in the House, like President Bill Clinton did after 1994? Or will he become mired in disagreements, like President Barack Obama after 2010? Infrastructure spending is one of the few areas where Trump and the Democrats have a clear basis for passing a major piece of legislation. It is much harder for these two to agree on immigration – given Trump’s demand for funding the border wall – or health care – given Trump’s opposition to Obama’s Affordable Care Act (Obamacare). By contrast, Trump campaigned vociferously on the need for more infrastructure and proposed a $1.5 trillion spending plan ($200 billion in federal funds) in February.1 Democrats are fully in support of infrastructure investment. The likeliest next Speaker of the House, Nancy Pelosi (D-CA), has been saying “build, build, build” both before and after the midterms, and her lieutenant, Representative Steny Hoyer (D-MD), has recently emphasized his eagerness to work with Trump on this issue. There is no doubt whether the public will approve – infrastructure spending always receives high levels of support, and it is one of the few policy areas unaffected by partisanship and polarization (Chart 2). Senate Majority Leader Mitch McConnell (R-KY) and Pelosi have begun negotiations and Democratic Representative Peter DeFazio (D-OR), likely the next head of the House Transportation Committee, has already outlined a plan. Chart 2U.S. Public Wants Infrastructure Spending
BCA’s Outlook For Infrastructure Stocks
BCA’s Outlook For Infrastructure Stocks
The chief constraint is funding, obviously. Republicans want to use a limited amount of federal seed money in order to spur public-private partnerships but Democrats want direct federal funding sourced through indexing the federal fuel tax to inflation and issuing government bonds. There will have to be a new Democratic-authored bill, which may or may not merge with aspects of Trump’s plan. How much money are we talking about? Trump’s plan called for $1.5 trillion over 10 years, of which $200 billion would be federal. Hence $20 billion in federal spending per year, but with cuts to existing programs. Some analysts have argued that Trump’s plan would actually have seen a net reduction in federal infrastructure spending over the long run due to its cuts to existing federal programs (which happen to be infrastructure-oriented) in order to offset his proposed spending increases. Democrats will insist on no cuts to existing programs, plus funding for new building.2 The mainstream Democrats are proposing $100 billion in new spending per year for 10 years, but this number includes zero cuts to existing programs. Mainstream Democrats are therefore asking for less in actual new spending than meets the eye, but are unlikely to go for less than Trump’s $20 billion. As a reference, President Obama’s last budget proposal was looking at $32 billion in federal infrastructure increases per year.3 An agreement on $20-$40 billion per year in new spending is not insurmountable given that both sides agree that they could raise the $0.18 per gallon tax on gasoline, which has not been raised since 1993 and is not indexed to inflation. Trump has proposed raising it by $0.25 per gallon, and this is more than other proposals (at $0.15 per gallon) or than merely indexing to inflation. This would raise an estimated $375 billion over 10 years.4 In addition, the Democrats are looking to revise aspects of Trump’s tax cuts to fund infrastructure. While Secretary of Treasury Steve Mnuchin says no one in the administration is considering paring back the recent sharp reductions in the corporate rate, Trump has already signaled willingness to negotiate on the corporate rate to provide for a middle-class tax cut. This suggests that modifications to his 2017 Tax Cut and Jobs Act are not out of the question as infrastructure funding. Signature pieces of major legislation help presidents get reelected. The tax cuts were a product of traditional conservative policy, with limited popularity, whereas a populist compromise to the tax cuts in order to fund an infrastructure package (as long as it is still a net tax cut from pre-2017) could produce a signature piece of legislation from Trump “the builder” going into 2020. In other words, Trump can refrain from vetoing a federal gasoline tax hike or an adjustment to his own corporate tax cuts in order to pass a popular infrastructure initiative. The Democratic opposition will have written the bill, so both parties would “share the blame.” And the Democrats in the Senate would only need 15-18 GOP Senators to support a profligate infrastructure plan. Given popular and presidential support, and that the GOP-controlled Senate agreed with the budget spending blowout in early 2018, we think that more than enough Republican Senators can go along with an infrastructure plan. The bill will come at a time when other major legislative options are on ice and when both Trump and the Democrats will need at least one achievement to sell to voters in 2020. Might the Democrats sabotage such a bill in order to deny the president any fiscal help ahead of the 2020 election? Possibly. But they would have to pretend to negotiate before pulling out of the deal. It could backfire mightily. Whereas passing a big infrastructure bill would demonstrate their ability to govern and would help them win over voters in the vital Midwestern battleground states, where collapsing bridges and poisonous water systems have made headlines. Bottom Line: There is a greater than 50% chance that a bill will pass. As a baseline estimate, a bill worth $200-$400 billion over ten years is a reasonable estimate for a bill that could pass in late 2019 or (less likely) early 2020. Needless to say, $200-$400 billion over 10 years is a far cry from headline numbers like $1.5 trillion. It is an even farther cry from the progressive Democrats’ “People’s Infrastructure Plan” which calls for $2 trillion over ten years. Net new spending of $20-$40 billion per year is about 10%-20% of existing annual infrastructure spending and only 0.1%-0.20% of American GDP. In our examination, we will frequently reference the 2009 American Recovery and Reinvestment Act (ARRA), the most recent major infrastructure bill aimed at stimulating the economy. This bill cost $787 billion, of which $500 billion was cash outlays (the remainder was tax incentives). However, only $105 billion of the ARRA was targeted at infrastructure spending ($20 billion per year). Still using the 2009 ARRA as an analogy, the midpoint of high and low estimates from the CBO’s post-mortem of the ARRA’s efficacy, the ARRA added 1.1% to real GDP in 2009, followed by 2.4% in 2010. If we assume the goal of this bill is truly to prolong the business cycle to align with the election cycle, it stands to reason that time is of the essence. Further, the PPP requirements to achieve the $1.5 trillion in new investment envisaged by the White House raise a host of issues. Buy-in from private partners, the associated incremental planning and an assumed dearth of shovel-ready PPP-appropriate projects lead us to believe that a Q1 passage of a bill would be necessary for it to achieve its goals. Lastly, when the 2009 ARRA became effective, the unemployment rate was 8.3%. It is 3.7% now (Chart 3). We would anticipate an inflation-fearing Fed to deliver a monetary response to this fiscal slack in the form of interest rate hikes that would at least partially offset the stimulus. With two opposing forces pushing on the economy, it is ambiguous to us whether the stimulus would, in fact, stimulate. Chart 3Historically Low Unemployment
Historically Low Unemployment
Historically Low Unemployment
What Drives Domestic Infrastructure Stocks Anyway? As equity strategists, our role is to offer clients insights into the best way to play the anticipated fiscal largesse. Accordingly, we have created an index from a range of industrials and materials GICS3&4 indexes that should see a positive reaction to a spur in infrastructure demand; we present the BCA Infrastructure Basket in Chart 4 with details of its constituents included in an appendix following this report. Chart 4BCA's Infrastructure Basket…
BCA's Infrastructure Basket…
BCA's Infrastructure Basket…
Much like the initial excitement surrounding the prospect of an infrastructure bill following Trump’s election, our infrastructure basket leapt in November 2016. However the diminishing hopes of a bill, especially of the size discussed on the campaign trail, are reflected in the basket’s mostly steady decline from its late 2016 peak. This decline accelerated following the passage of the tax cuts at the end of 2017. A reasonable assumption would be that the price of our basket of equities would track in line, by and large, with most leading economic indicators as they are broadly a reflection of the industrial economy. Testing this hypothesis over the past 30 years is revealing: we found no material correlation between domestic leading indicators, even capital expenditures and planned capital expenditures that should be significant top line drivers (Chart 5). The upshot is that domestic private sector sentiment is unrelated to infrastructure stock performance. Chart 5...Is Not Correlated With Leading Indicators
...Is Not Correlated With Leading Indicators
...Is Not Correlated With Leading Indicators
When plotted against the historic budget deficit and government debt levels, a better picture emerges (Chart 6). Our inference is that public spending and the infrastructure basket tend to move together, which is corroborated by the aforementioned recent moves around rising and falling hopes for a Trump infrastructure bill. Still, this analysis is incomplete as the infrastructure basket and fiscal growth were inversely correlated between 2004 and 2009 before reestablishing a positive relationship and even then the relationship is relatively loose. Chart 6Fiscal Expansion And Infrastructure Stocks Mostly In Sync
Fiscal Expansion And Infrastructure Stocks Mostly In Sync
Fiscal Expansion And Infrastructure Stocks Mostly In Sync
Accordingly, we widened our analysis to global indicators excluding the U.S., where we found a significantly tighter correlation (Chart 7), though only post-2001. We ascribe the close post-2001 relationship to China’s joining of the WTO and their resulting ascendency in driving equity returns in the emerging market space. Chart 8 confirms our hypothesis; our infrastructure basket and the EM equity index overlap. Chart 7Global Leading Indicators Are Better
Global Leading Indicators Have a Tighter Correlation
Global Leading Indicators Have a Tighter Correlation
Chart 8EM And Infrastructure Go Hand In Hand
EM And Infrastructure Go Hand In Hand
EM And Infrastructure Go Hand In Hand
Drilling down on China seems appropriate in this context and further corroborates our assertion that China is increasingly the driver of U.S. domestic infrastructure stock performance. Particularly in the post-GFC era, the slowdown in Chinese capex and money supply growth appear to be the principal drivers of these stocks (second and bottom panels, Chart 9). This message is echoed when we compare the infrastructure basket to the Chinese credit growth impulse and the Keqiang index (Chart 10). Chart 9Chinese Growth Drives Domestic Infrastructure Stocks
Chinese Growth Drives Domestic Infrastructure Stocks
Chinese Growth Drives Domestic Infrastructure Stocks
Chart 10Slowing Growth In China Points To A Down Leg
bca.uses_sr_2018_12_10_c10
bca.uses_sr_2018_12_10_c10
Bottom Line: Domestic private sector sentiment has little impact on the BCA Infrastructure Basket, though U.S. government spending clearly has a significant impact on the performance of the stocks. Still, it appears that Chinese growth is at least as important as domestic government spending to the relative performance of the infrastructure basket. In light of BCA’s view of flat or slowing growth in China, at least for the year ahead, we would wait for a positive catalyst before adding this basket as a holding. A Value Trap In The Making Investors may correctly point out that our infrastructure basket has already been beaten up and the stage may be set for a relief rally. In fact, the basket has already notched two months of outperformance, lifting it off its decade low relative to the S&P 500 (Chart 11). However, as shown in the middle panel of Chart 12, this rally has come while forward EPS growth estimates have trailed the broad market, meaning that the rally has been exclusively a valuation rerating rather than a fundamental turning point in earnings (bottom panel, Chart 12). Chart 11Fairly Valued Over Long Term...
Fairly Valued Over Long Term...
Fairly Valued Over Long Term...
Chart 12...And A Value Trap In The Short Term
...And A Value Trap In The Short Term
...And A Value Trap In The Short Term
Further, while the bear market for this basket of stocks is set to enter its second year, we would caution that a turning point may be further off in the distance than optimists may hope. Witness the six year period from 1995 to 2001 when the infrastructure basket dramatically underperformed the market (Chart 11). Valuations in the infrastructure basket were only a third of the broad market before a rally occurred, a far cry from where they are now. As well, the relative rally likely had more to do with the souring of the tech sector than a particular affection for infrastructure stocks; it took another five years for the basket to reach its average valuation. We would further note that on a longer-term basis, while still a discount to the broad market, valuations remain roughly in line with their historical average (Chart 11). Bottom Line: History has shown bear markets for infrastructure stocks can be deep and prolonged. Thus while the infrastructure basket is relatively cheap compared to the recent past, looking further back in history tells us that this may not be the case. Accordingly, we think the BCA Infrastructure Basket has all the markings of a value trap. So What Does It All Mean The passage of an infrastructure bill seems likely, though the form it will take remains subject to debate. As well, the timing and efficacy of such a bill may mean that it both undershoots expectations with respect to its size and eventual economic impact. The BCA Infrastructure Basket has tended to trade off of domestic fiscal expansion but EM in general and China in particular appear to have taken over as the core drivers of relative stock performance. While bearishness has reigned in this basket for the past year, we caution that this still looks like the early stages of underperformance. We would wait for a positive catalyst in the EM and/or China before chasing the BCA Infrastructure Basket. Details on the composition of this basket are in an appendix that follows. Chris Bowes, Associate Editor chrisb@bcaresearch.com Matt Gertken, Vice President Geopolitical Strategy mattg@bcaresearch.com Appendix
BCA’s Outlook For Infrastructure Stocks
BCA’s Outlook For Infrastructure Stocks
Footnotes 1 Please see the White House, “Legislative Outline for Rebuilding Infrastructure in America,” 2018, available at www.politico.com. 2 Please see Jacob Leibenluft, “Three Key Questions About The Trump Infrastructure Plan,” Center on Budget and Policy Priorities, January 30, 2018, available at www.cbpp.org. 3 Please see Senate Democratic Caucus, “Senate Democrats’ Jobs & Infrastructure Plan For America’s Workers,” March 7, 2018, available at www.democrats.senate.gov. 4 Please see Lauren Gardner, Tanya Snyder, and Brianna Gurciullo, “Trump endorses 25-cent gas tax hike, lawmakers say,” Politico, February 14, 2018, available at www.politico.com.
Mr. X and his daughter, Ms. X, are long-time BCA clients who visit our office toward the end of each year to discuss the economic and financial market outlook. This report is an edited transcript of our recent conversation. Mr. X: I have been eagerly looking forward to this meeting given the recent turbulence in financial markets. Our investments have done poorly in the past year and, with hindsight, I wish I had followed my instincts to significantly cut our equity exposure at the end of 2017, although we did follow your advice to move to a neutral stance in mid-2018. I remain greatly troubled by economic and political developments in many countries. I have long believed in open and free markets and healthy political discourse, and this all seems under challenge. As always, there is much to talk about. Ms. X: Let me add that I also am pleased to have this opportunity to talk through the key issues that will influence our investment strategy over the coming year. As I am sure you remember, I was more optimistic than my father about the outlook when we met a year ago but things have not worked out as well as I had hoped. In retrospect, I should have paid more attention to your view that markets and policy were on a collision course as that turned out to be a very accurate prediction. When I joined the family firm in early 2017, I persuaded my father that we should have a relatively high equity exposure and that was the correct stance. However, this success led us to maintain too much equity exposure in 2018, and my father has done well to resist the temptation to say “I told you so.” So, we are left with a debate similar to last year: Should we move now to an underweight in risk assets or hold off on the hope that prices will reach new highs in the coming year? I am still not convinced that we have seen the peak in risk asset prices as there is no recession on the horizon and equity valuations are much improved, following recent price declines. I will be very interested to hear your views. BCA: Our central theme for 2018 that markets and policy would collide did turn out to be appropriate and, importantly, the story has yet to fully play out. The monetary policy tightening cycle is still at a relatively early stage in the U.S. and has not even begun in many other regions. Yet, although it was a tough year for most equity markets, the conditions for a major bear market are not yet in place. One important change to our view, compared to a year ago, is that we have pushed back the timing of the next U.S. recession. This leaves a window for risk assets to show renewed strength. It remains to be seen whether prices will reach new peaks, but we believe it would be premature to shift to an underweight stance on equities. For the moment, we are sticking with our neutral weighting for risk assets, but may well recommend boosting exposure if prices suffer further near-term weakness. We will need more clarity about the timing of a recession before we consider aggressively cutting exposure. Mr. X: I can see we will have a lively discussion because I do not share your optimism. My list of concerns is long and I hope we have time to get through them all. But first, let’s briefly review your predictions from last year. BCA: That is always interesting to do, although sometimes rather humbling. A year ago, our key conclusions were that: The environment of easy money, low inflation and healthy profit growth that has been so bullish for risk assets will start to change during the coming year. Financial conditions, especially in the U.S., will gradually tighten as decent growth leads to building inflationary pressures, encouraging central banks to withdraw stimulus. With U.S. equities at an overvalued extreme and investor sentiment overly optimistic, this will set the scene for an eventual collision between policy and the markets. The conditions underpinning the bull market will erode only slowly which means that risk asset prices should continue to rise for at least the next six months. However, long-run investors should start shifting to a neutral exposure. Given our economic and policy views, there is a good chance that we will move to an underweight position in risk assets during the second half of 2018. The U.S. economy is already operating above potential and thus does not need any boost from easier fiscal policy. Any major tax cuts risk overheating the economy, encouraging the Federal Reserve to hike interest rates and boosting the probability of a recession in 2019. This is at odds with the popular view that tax cuts will be good for the equity market. A U.S. move to scrap NAFTA would add to downside risks. For the second year in a row, the IMF forecasts of economic growth for the coming year are likely to prove too pessimistic. The end of fiscal austerity has allowed the Euro Area economy to gather steam and this should be sustained in 2018. However, the slow progress in negotiating a Brexit deal with the EU poses a threat to the U.K. economy. China’s economy is saddled with excessive debt and excess capacity in a number of areas. Any other economy would have collapsed by now, but the government has enough control over banking and other sectors to prevent a crisis. Growth should hold above 6% in the next year or two, although much will depend on how aggressively President Xi pursues painful reforms. The market is too optimistic in assuming that the Fed will not raise interest rates by as much as indicated in their “dots” projections. There is a good chance that the U.S. yield curve will become flat or inverted by late 2018. Bonds are not an attractive investment at current yields. Only Greece and Portugal have real 10-year government bond yields above their historical average. Corporate bonds should outperform governments, but a tightening in financial conditions will put these at risk in the second half of 2018. The Euro Area and Japanese equity markets should outperform the U.S. over the next year reflecting their better valuations and more favorable financial conditions. Developed markets should outperform the emerging market index. Historically, the U.S. equity market has led recessions by between 3 and 12 months. If, as we fear, a U.S. recession starts in the second half of 2019, then the stock market would be at risk from the middle of 2018. The improving trend in capital spending should favor industrial stocks. Our other two overweight sectors are energy and financials. The oil price will be well supported by strong demand and output restraint by OPEC and Russia. The Brent price should average $65 a barrel over the coming year, with risks to the upside. We expect base metals prices to trade broadly sideways but will remain highly dependent on developments in China. Modest positions in gold are warranted. Relative economic and policy trends will favor a firm dollar in 2018. Unlike at the start of 2017, investors are significantly short the dollar which is bullish from a contrary perspective. Sterling is quite cheap but Brexit poses downside risks. The key market-relevant geopolitical events to monitor will be fiscal policy and mid-term elections in the U.S., and reform policies in China. With the former, the Democrats have a good chance of winning back control of the House of Representatives, creating a scenario of complete policy gridlock. A balanced portfolio is likely to generate average returns of only 3.3% a year in nominal terms over the next decade. This compares to average returns of around 10% a year between 1982 and 2017. As already noted, the broad theme that policy tightening – especially in the U.S. – would become a problem for asset markets during the year was supported by events. However, the exact timing was hard to predict. The indexes for non-U.S. developed equity markets and emerging markets peaked in late-January 2018, and have since dropped by around 18% and 24%, respectively (Chart 1). On the other hand, the U.S. market, after an early 2018 sell-off, hit a new peak in September, before falling anew in the past couple of months. The MSCI All-Country World index currently is about 6% below end-2017 levels in local-currency terms. Chart 1Our 'Collision Course' Theme For 2018 Played Out
Our 'Collision Course' Theme For 2018 Played Out
Our 'Collision Course' Theme For 2018 Played Out
We started the year recommending an overweight in developed equity markets but, as you noted, shifted that to a neutral position mid-year. A year ago, we thought we might move to an underweight stance in the second half of 2018 but decided against this because U.S. fiscal stimulus boosted corporate earnings and extended the economic cycle. Our call that emerging markets would underperform was on target. Although it was U.S. financial conditions that tightened the most, Wall Street was supported by the large cut in the corporate tax rate while the combination of higher bond yields and dollar strength was a major problem for many indebted emerging markets. Overall, it was not a good year for financial markets (Table 1). Table 1Market Performance
OUTLOOK 2019: Late-Cycle Turbulence
OUTLOOK 2019: Late-Cycle Turbulence
As far as the overall macro environment was concerned, we were correct in predicting that the IMF was too pessimistic on economic growth. A year ago, the IMF forecast that the advanced economies would expand by 2% in 2018 and that has since been revised up to 2.4% (Table 2). This offset a slight downgrading to the performance of emerging economies. The U.S., Europe and Japan all grew faster than previously expected. Not surprisingly, inflation also was higher than forecast, although in the G7, it has remained close to the 2% level targeted by most central banks. Table 2IMF Economic Forecasts
OUTLOOK 2019: Late-Cycle Turbulence
OUTLOOK 2019: Late-Cycle Turbulence
Despite widespread fears to the contrary, the data have supported our view that Chinese growth would hold above a 6% pace in 2018. Nevertheless, a slowdown currently is underway and downside risks remain very much in place in terms of excessive credit and trade pressures. Another difficult year lies ahead for the Chinese authorities and we will no doubt return to this topic later. As far as our other key forecasts are concerned, we were correct in our views that oil prices and the U.S. dollar would rise and that the market would be forced to revise up its predictions of Fed rate hikes. Of course, oil has recently given back its earlier gains, but we assume that is a temporary setback. On the sector front, our macro views led us to favor industrials, financials and energy, but that did not work out well as concerns about trade took a toll on cyclical sectors. Overall, there were no major macro surprises in 2018, and it seems clear that we have yet to resolve the key questions and issues that we discussed a year ago. At that time, we were concerned about the development of late-cycle pressures that ultimately would undermine asset prices. That story has yet to fully play out. It is hard to put precise timing on when the U.S. economy will peak and, thus, when asset prices will be at maximum risk. Nevertheless, our base case is that there likely will be a renewed and probably final run-up in asset prices before the next recession. Late-Cycle Challenges Mr. X: This seems like déjà-vu all over again. Since we last met, the cycle is one year older and, as you just said, the underlying challenges facing economies and markets have not really changed. If anything, things are even worse: Global debt levels are higher, inflation pressures more evident, Fed policy is moving closer to restrictive territory and protectionist policies have ratcheted up. If it was right to be cautious six months ago, then surely we should be even more cautious now. Ms. X: Oh dear, it does seem like a repeat of last year’s discussion because, once again, I am more optimistic than my father. Obviously, there are structural problems in a number of countries and, at some point, the global economy will suffer another recession. But timing is everything, and I attach very low odds to a downturn in the coming year. Meanwhile, I see many pockets of value in the equity market. Rather than cut equity positions, I am inclined to look for buying opportunities. BCA: We sympathize with your different perspectives because the outlook is complex and we also have lively debates about the view. The global equity index currently is a little below where it was when we met last year, but there has been tremendous intra-period volatility. That pattern seems likely to be repeated in 2019. In other words, it will be important to be flexible about your investment strategy. You both make good points. It is true that there are several worrying problems regarding the economic outlook, including excessive debt, protectionism and building inflation risks. At the same time, the classic conditions for an equity bear market are not yet in place, and may not be for some time. This leaves us in the rather uncomfortable position of sitting on the fence with regard to risk asset exposure. We are very open to raising exposure should markets weaken further in the months ahead, but also are keeping careful watch for signs that the economic cycle is close to peaking. In other words, it would be a mistake to lock in a 12-month strategy right now. Mr. X: I would like to challenge the consensus view, shared by my daughter, that the next recession will not occur before 2020, and might even be much later. The main rationale seems to be that the policy environment remains accommodative and there are none of the usual imbalances that occur ahead of recessions. Of course, U.S. fiscal policy has given a big boost to growth in the past year, but I assume the effects will wear off sharply in 2019. More importantly, there is huge uncertainty about the level of interest rates that will trigger economic problems. It certainly has not taken much in the way of Fed rate hikes to rattle financial markets. Thus, monetary policy may become restrictive much sooner than generally believed. I also strongly dispute the idea that there are no major financial imbalances. If running U.S. federal deficits of $1 trillion in the midst of an economic boom is not an imbalance, then I don’t know what is! At the same time, the U.S. corporate sector has issued large amounts of low-quality debt, and high-risk products such as junk-bond collateralized debt obligations have made an unwelcome reappearance. It seems that the memories of 2007-09 have faded. It is totally normal for long periods of extremely easy money to be accompanied by growing leverage and increasingly speculative financial activities, and I don’t see why this period should be any different. And often, the objects of speculation are not discovered until financial conditions become restrictive. Finally, there are huge risks associated with rising protectionism, the Chinese economy appears to be struggling, Italy’s banks are a mess, and the Brexit fiasco poses a threat to the U.K. economy. Starting with the U.S., please go ahead and convince me why a recession is more than a year away. BCA: It is natural for you to worry that a recession is right around the corner. The current U.S. economic expansion will become the longest on record if it makes it to July 2019, at which point it will surpass the 1990s expansion. Economists have a long and sad history of failing to forecast recessions. Therefore, a great deal of humility is warranted when it comes to predicting the evolution of the business cycle. The Great Recession was one of the deepest downturns on record and the recovery has been fairly sluggish by historic standards. Thus, it has taken much longer than usual for the U.S. economy to return to full employment. Looking out, there are many possible risks that could trip up the U.S. economy but, for the moment, we see no signs of recession on the horizon (Chart 2). For example, the leading economic indicator is still in an uptrend, the yield curve has not inverted and our monetary indicators are not contracting. Our proprietary recession indicator also suggests that the risk is currently low, although recent stock market weakness implies some deterioration. Chart 2Few U.S Recession 'Red Flags'
Few U.S Recession 'Red Flags'
Few U.S Recession 'Red Flags'
The buildup in corporate debt is a cause for concern and we are not buyers of corporate bonds at current yields. However, the impact of rising yields on the economy is likely to be manageable. The interest coverage ratio for the economy as a whole – defined as the profits corporations generate for every dollar of interest paid – is still above its historic average (Chart 3). Corporate bonds are also generally held by non-leveraged investors such as pension funds, insurance companies, and ETFs. The impact of defaults on the economy tends to be more severe when leveraged institutions are the ones that suffer the greatest losses. Chart 3Interest Costs Not Yet A Headwind
Interest Costs Not Yet A Headwind
Interest Costs Not Yet A Headwind
We share your worries about the long-term fiscal outlook. However, large budget deficits do not currently imperil the economy. The U.S. private sector is running a financial surplus, meaning that it earns more than it spends (Chart 4). Not only does this make the economy more resilient, it also provides the government with additional savings with which to finance its budget deficit. If anything, the highly accommodative stance of fiscal policy has pushed up the neutral rate of interest, giving the Fed greater scope to raise rates before monetary policy enters restrictive territory. The impetus of fiscal policy on the economy will be smaller in 2019 than it was in 2018, but it will still be positive (Chart 5). Chart 4The U.S. Private Sector Is Helping To Finance The Fiscal Deficit
The U.S. Private Sector Is Helping To Finance The Fiscal Deficit
The U.S. Private Sector Is Helping To Finance The Fiscal Deficit
Chart 5U.S. Fiscal Policy Still Stimulative In 2019
U.S. Fiscal Policy Still Stimulative In 2019
U.S. Fiscal Policy Still Stimulative In 2019
The risks to growth are more daunting outside the U.S. As you point out, Italy is struggling to contain borrowing costs, a dark cloud hangs over the Brexit negotiations, and China and most other emerging markets have seen growth slow meaningfully. The U.S., however, is a relatively closed economy – it is not as dependent on trade as most other countries. Its financial system is reasonably resilient thanks to the capital its banks have raised over the past decade. In addition, Dodd-Frank and other legislation have made it more difficult for financial institutions to engage in reckless risk-taking. Mr. X: I would never take a benign view of the ability and willingness of financial institutions to engage in reckless behavior, but maybe I am too cynical. Even if you are right that debt does not pose an immediate threat to the market, surely it will become a huge problem in the next downturn. If the U.S. federal deficit is $1 trillion when the economy is strong, it is bound to reach unimaginable levels in a recession. And, to make matters worse, the Federal Reserve may not have much scope to lower interest rates if they peak at a historically low level in the next year or so. What options will policymakers have to respond to the next cyclical downturn? Is there a limit to how much quantitative easing central banks can do? BCA: The Fed is aware of the challenges it faces if the next recession begins when interest rates are still quite low. Raising rates rapidly in order to have more “ammunition” for counteracting the downturn would hardly be the best course of action as this would only bring forward the onset of the recession. A better strategy is to let the economy overheat a bit so that inflation rises. This would allow the Fed to push real rates further into negative territory if the recession turns out to be severe. There is no real limit on how much quantitative easing the Fed can undertake. The FOMC will undoubtedly turn to asset purchases and forward guidance again during the next economic downturn. Now that the Fed has crossed the Rubicon into unorthodox monetary policy without generating high inflation, policymakers are likely to try even more exotic policies, such as price-level targeting. The private sector tends to try to save more during recessions. Thus, even though the fiscal deficit would widen during the next downturn, there should be plenty of buyers for government debt. However, once the next recovery begins, the Fed may feel increasing political pressure to keep rates low in order to allow the government to maintain its desired level of spending and taxes. The Fed guards its independence fiercely, but in a world of increasingly political populism, that independence may begin to erode. This will not happen quickly, but to the extent that it does occur, higher inflation is likely to be the outcome. Ms. X: I would like to explore the U.S.-China dynamic a bit more because I see that as one of the main challenges to my more optimistic view. I worry that President Trump will continue to take a hard line on China trade because it plays well with his base and has broad support in Congress. And I equally worry that President Xi will not want to be seen giving in to U.S. bullying. How do you see this playing out? BCA: Investors hoping that U.S. President Donald Trump and his Chinese counterpart Xi Jinping will reach a deal to end the trade war on the sidelines of the forthcoming G20 leaders' summit in Buenos Aires are likely to be disappointed. President Trump's fiscal policy is completely inconsistent with his trade agenda. Fiscal stimulus in a full-employment economy will suck in imports. It also forces the Fed to raise rates more aggressively than it otherwise would, leading to a stronger dollar. The result will be a larger U.S. trade deficit. Trump will not be able to blame Canada or Mexico for a deteriorating trade position because he just signed a trade agreement with them. The new USMCA agreement is remarkably similar to NAFTA, with the notable exception that it contains a clause barring Canada and Mexico from negotiating bilateral trade deals with China. This means Trump needs a patsy who will take the blame for America's burgeoning trade deficit and China will fill that role. For his part, President Xi knows full well that he will still be China’s leader when Trump is long gone. Giving in to Trump’s demands would hurt him politically. All this means that the trade war will persist. Mr. X: I see a trade war as a major threat to the economy, but it is not the only thing that could derail the economic expansion. Let’s explore that issue in more detail. The Economic Outlook Mr. X: You have shown in previous research that housing is often a very good leading indicator of the U.S. economy, largely because it is very sensitive to changes in the monetary environment. Are you not concerned about the marked deterioration in recent U.S. housing data? BCA: Recent trends in housing have indeed been disappointing, with residential investment acting as a drag on growth for three consecutive quarters. The weakness has been broad-based with sales, the rate of price appreciation of home prices, and builder confidence all declining (Chart 6). Even though the level of housing affordability is decent by historical standards, there has been a fall in the percentage of those who believe that it is a good time to buy a home. Chart 6Recent Softness In U.S. Housing
Recent Softness In U.S. Housing
Recent Softness In U.S. Housing
There are a few possible explanations for the weakness. First, the 2007-09 housing implosion likely had a profound and lasting impact on the perceived attractiveness of home ownership. The homeownership rate for people under 45 has remained extremely low by historical standards. Secondly, increased oversight and tighter regulations have curbed mortgage supply. Finally, the interest rate sensitivity of the sector may have increased with the result that even modest increases in the mortgage rate have outsized effects. That, in turn, could be partly explained by recent tax changes that capped the deduction on state and local property taxes, while lowering the limit on the tax deductibility of mortgage interest. The trend in housing is definitely a concern, but the odds of a further major contraction seem low. Unlike in 2006, the home vacancy rate stands near record levels and the same is true for the inventory of homes. The pace of housebuilding is below the level implied by demographic trends and consumer fundamentals are reasonably healthy. The key to the U.S. economy lies with business investment and consumer spending and these areas are well supported for the moment. Consumers are benefiting from continued strong growth in employment and a long overdue pickup in wages. Meanwhile, the ratio of net worth-to-income has surpased the previous peak and the ratio of debt servicing-to-income is low (Chart 7). Last year, we expressed some concern that the depressed saving rate might dampen spending, but the rate has since been revised substantially higher. Based on its historical relationship with U.S. household net worth, there is room for the saving rate to fall, fueling more spending. Real consumer spending has grown by 3% over the past year and there is a good chance of maintaining that pace during most of 2019. Chart 7U.S. Consumer Fundamentals Are Healthy
U.S. Consumer Fundamentals Are Healthy
U.S. Consumer Fundamentals Are Healthy
Turning to capital spending, the cut in corporate taxes was obviously good for cash flow, and surveys show a high level of business confidence. Moreover, many years of business caution toward spending has pushed up the average age of the nonresidential capital stock to the highest level since 1963 (Chart 8). Higher wages should also incentivize firms to invest in more machinery. Absent some new shock to confidence, business investment should stay firm during the next year. Chart 8An Aging Capital Stock
An Aging Capital Stock
An Aging Capital Stock
Overall, we expect the pace of U.S. economic growth to slow from its recent strong level, but it should hold above trend, currently estimated to be around 2%. As discussed earlier, that means capacity pressures will intensify, causing inflation to move higher. Ms. X: I share the view that the U.S. economy will continue to grow at a healthy pace, but I am less sure about the rest of the world. BCA: You are right to be concerned. We expected U.S. and global growth to diverge in 2018, but not by as much as occurred. Several factors have weighed on CEO confidence outside of the U.S., including trade wars, a strong dollar, higher oil prices, emerging market turbulence, the return of Italian debt woes, and a slowdown in the Chinese economy. The stress has shown up in the global manufacturing PMI, although the latter is still at a reasonably high level (Chart 9). Global export growth is moderating and the weakness appears to be concentrated in capex. Capital goods imports for the major economies, business investment, and the production of investment-related goods have all decelerated this year. Chart 9Global Manufacturing Slowdown
Global Manufacturing Slowdown
Global Manufacturing Slowdown
Our favorite global leading indicators are also flashing yellow (Chart 10). BCA’s global leading economic indicator has broken below the boom/bust line and its diffusion index suggests further downside. The global ZEW composite and the BCA boom/bust indicator are both holding below zero. Chart 10Global Growth Leading Indicators
Global Growth Leading Indicators
Global Growth Leading Indicators
Current trends in the leading indicators shown in Chart 11 imply that the growth divergence between the U.S. and the rest of the world will remain a key theme well into 2019. Among the advanced economies, Europe and Japan are quite vulnerable to the global soft patch in trade and capital spending. Chart 11Global Economic Divergence Will Continue
Global Economic Divergence Will Continue
Global Economic Divergence Will Continue
The loss of momentum in the Euro Area economy, while expected, has been quite pronounced. Part of this is due to the dissipation of the 2016/17 economic boost related to improved health in parts of the European banking system that sparked a temporary surge in credit growth. The tightening in Italian financial conditions following the government’s budget standoff with the EU has weighed on overall Euro Area growth. Softer Chinese demand for European exports, uncertainties related to U.S. trade policy and the torturous Brexit negotiations, have not helped the situation. Real GDP growth decelerated to close to a trend pace by the third quarter of 2018. The manufacturing PMI has fallen from a peak of 60.6 in December 2017 to 51.5, mirroring a 1% decline in the OECD’s leading economic indicator for the region. Not all the economic news has been bleak. Both consumer and industrial confidence remain at elevated levels according to the European Commission (EC) surveys, consistent with a resumption of above-trend growth. Even though exports have weakened substantially from the booming pace in 2017, the EC survey on firms’ export order books remains at robust levels (Chart 12). Importantly for the Euro Area, the bank credit impulse has moved higher.The German economy should also benefit from a rebound in vehicle production which plunged earlier this year following the introduction of new emission standards. Chart 12Europe: Slowing, But No Disaster
Europe: Slowing, But No Disaster
Europe: Slowing, But No Disaster
We interpret the 2018 Euro Area slowdown as a reversion-to-the-mean rather than the start of an extended period of sub-trend growth. Real GDP growth should fluctuate slightly above trend pace through 2019. Given that the Euro Area’s output gap is almost closed, the ECB will not deviate from its plan to end its asset purchase program by year end. Gradual rate hikes should begin late in 2019, assuming that inflation is closer to target by then. In contrast, the Bank of Japan (BoJ) is unlikely to change policy anytime soon. The good news is that wages have finally begun to grow at about a 2% pace, although it required extreme labor shortages. Yet, core inflation is barely positive and long-term inflation expectations are a long way from the 2% target. The inflation situation will have to improve significantly before the BoJ can consider adjusting or removing the Yield Curve Control policy. This is especially the case since the economy has hit a bit of an air pocket and the government intends to raise the VAT in 2019. Japan’s industrial production has stalled and we expect the export picture to get worse before it gets better. We do not anticipate any significant economic slack to develop, but even a sustained growth slowdown could partially reverse the gains that have been made on the inflation front. Ms. X: We can’t talk about the global economy without discussing China. You have noted in the past how the authorities are walking a tightrope between trying to unwind the credit bubble and restructure the economy on the one hand, and prevent a destabilizing economic and financial crisis on the other. Thus far, they have not fallen off the tightrope, but there has been limited progress in resolving the country’s imbalances. And now the authorities appear to be stimulating growth again, risking an even bigger buildup of credit. Can it all hold together for another year? BCA: That’s a very good question. Thus far, there is not much evidence that stimulus efforts are working. Credit growth is still weak and leading economic indicators have not turned around (Chart 13). There is thus a case for more aggressive reflation, but the authorities also remain keen to wean the economy off its addiction to debt. Chart 13China: No Sign Of Reacceleration
China: Credit Impulse Remains Weak
China: Credit Impulse Remains Weak
Waves of stimulus have caused total debt to soar from 140% of GDP in 2008 to about 260% of GDP at present (Chart 14). As is usually the case, rapid increases in leverage have been associated with a misallocation of capital. Since most of the new credit has been used to finance fixed-asset investment, the result has been overcapacity in a number of areas. For example, the fact that 15%-to-20% of apartments are sitting vacant is a reflection of overbuilding. Meanwhile, the rate of return on assets in the state-owned corporate sector has fallen below borrowing costs. Chart 14China: Debt Still Rising
China: Debt Still Rising
China: Debt Still Rising
Chinese exports are holding up well so far, but this might only represent front-running ahead of the implementation of higher tariffs. Judging from the steep drop in the export component of both the official and private-sector Chinese manufacturing PMI, exports are likely to come under increasing pressure over the next few quarters as the headwinds from higher tariffs fully manifest themselves (Chart 15). Chart 15Chinese Exports About To Suffer
Chinese Exports About To Suffer
Chinese Exports About To Suffer
The most likely outcome is that the authorities will adjust the policy dials just enough to stabilize growth sometime in the first half of 2019. The bottoming in China’s broad money impulse offers a ray of hope (Chart 16). Still, it is a tentative signal at best and it will take some time before this recent easing in monetary policy shows up in our credit impulse measure and, later, economic growth. A modest firming in Chinese growth in the second half of 2019 would provide a somewhat stronger demand backdrop for commodities and emerging economies that sell goods to China. Chart 16A Ray Of Hope From Broad Money
bca.bca_mp_2018_12_01_c16
bca.bca_mp_2018_12_01_c16
Ms. X: If you are correct about a stabilization in the Chinese economy next year, this presumably would be good news for emerging economies, especially if the Fed goes on hold. EM assets have been terribly beaten down and I am looking for an opportunity to buy. BCA: Fed rate hikes might have been the catalyst for the past year’s pain in EM assets, but it is not the underlying problem. As we highlighted at last year’s meeting, the troubles for emerging markets run much deeper. Our long-held caution on emerging economies and markets is rooted in concern about deteriorating fundamentals. Excessive debt is a ticking time bomb for many of these countries; EM dollar-denominated debt is now as high as it was in the late 1990s as a share of both GDP and exports (Chart 17). Moreover, the declining long-term growth potential for emerging economies as a group makes it more difficult for them to service the debt. The structural downtrend in EM labor force and productivity growth underscores that trend GDP growth has collapsed over the past three decades (Chart 17, bottom panel). Chart 17EM Debt A Problem Given Slowing Supply-Side...
EM Debt A Problem Given Slowing Supply-Side...
EM Debt A Problem Given Slowing Supply-Side...
Decelerating global growth has exposed these poor fundamentals. EM sovereign spreads have moved wider in conjunction with falling PMIs and slowing industrial production and export growth. And it certainly does not help that the Fed is tightening dollar-based liquidity conditions. EM equities usually fall when U.S. financial conditions tighten (Chart 18). Chart 18...And Tightening Financial Conditions
...And Tightening Financial Conditions
...And Tightening Financial Conditions
Chart 19 highlights the most vulnerable economies in terms of foreign currency funding requirements, and foreign debt-servicing obligations relative to total exports. Turkey stands out as the most vulnerable, along with Argentina, Brazil, Indonesia, Chile, and Colombia. In contrast, Emerging Asia appears to be in better shape relative to the crisis period of the late 1990s. Chart 19Spot The Outliers
OUTLOOK 2019: Late-Cycle Turbulence
OUTLOOK 2019: Late-Cycle Turbulence
The backdrop for EM assets is likely to get worse in the near term, given our view that the Fed will continue to tighten and China will be cautious about stimulating more aggressively. Our base case outlook sees some relief in the second half of 2019, but it is more of a “muddle-through” scenario than a V-shaped economic recovery. Mr. X: Perhaps EM assets could enjoy a bounce next year if the Chinese economy stabilizes, but the poor macro fundamentals you mentioned suggest that it would be a trade rather than a buy-and-hold proposition. I am inclined to avoid the whole asset class in 2019. Bond Market Prospects Ms. X: Let’s turn to fixed income now. I was bearish on bonds in 2018, but yields have risen quite a bit, at least in the United States. The Fed has lifted the fed funds rate by 100 basis points over the past year and I don’t see a lot of upside for inflation. So perhaps yields have peaked and will move sideways in 2019, which would be good for stocks in my view. BCA: Higher yields have indeed improved bond value recently. Nonetheless, they are not cheap enough to buy at this point (Chart 20). The real 10-year Treasury yield, at close to 1%, is still depressed by pre-Lehman standards. Long-term real yields in Germany and Japan remain in negative territory at close to the lowest levels ever recorded. Chart 20Real Yields Still Very Depressed
Real Yields Still Very Depressed
Real Yields Still Very Depressed
We called the bottom in global nominal bond yields in 2016. Our research at the time showed that the cyclical and structural factors that had depressed yields were at an inflection point, and were shifting in a less bond-bullish direction. Perhaps most important among the structural factors, population aging and a downward trend in underlying productivity growth resulted in lower equilibrium bond yields over the past couple of decades. Looking ahead, productivity growth could stage a mild rebound in line with the upturn in the growth rate of the capital stock (Chart 21). As for demographics, the age structure of the world population is transitioning from a period in which aging added to the global pool of savings to one in which aging is beginning to drain that pool as people retire and begin to consume their nest eggs (Chart 22). The household saving rates in the major advanced economies should trend lower in the coming years, placing upward pressure on equilibrium global bond yields. Chart 21Productivity Still Has Some Upside
Productivity Still Has Some Upside
Productivity Still Has Some Upside
Chart 22Demographics Past The Inflection Point
Demographics Past The Inflection Point
Demographics Past The Inflection Point
Cyclical factors are also turning against bonds. U.S. inflation has returned to target and the Fed is normalizing short-term interest rates. The market currently is priced for only one more rate hike after December 2018 in this cycle, but we see rates rising more than that. Treasury yields will follow as market expectations adjust. Long-term inflation expectations are still too low in the U.S. and most of the other major economies to be consistent with central banks’ meeting their inflation targets over the medium term. As actual inflation edges higher, long-term expectations built into bond yields will move up. The term premium portion of long-term bond yields is also too low. This is the premium that investors demand to hold longer-term bonds. Our estimates suggest that the term premium is still negative in the advanced economies outside of the U.S., which is not sustainable over the medium term (Chart 23). Chart 23Term Premia Are Too Low
Term Premia Are Too Low
Term Premia Are Too Low
We expect term premia to rise for two main reasons. First, investors have viewed government bonds as a good hedge for their equity holdings because bond prices have tended to rise when stock prices fell. Investors have been willing to pay a premium to hold long-term bonds to benefit from this hedging effect. But the correlation is now beginning to change as inflation and inflation expectations gradually adjust higher and output gaps close. As the hedging benefit wanes, the term premium should rise back into positive territory. Second, central bank bond purchases and forward guidance have depressed yields as well as interest-rate volatility. The latter helped to depress term premia in the bond market. This effect, too, is beginning to unwind. The Fed is letting its balance sheet shrink by about $50 billion per month. The Bank of England has kept its holdings of gilts and corporate bonds constant for over a year, while the ECB is about to end asset purchases. The Bank of Japan continues to buy assets, but at a much reduced pace. All this means that the private sector is being forced to absorb a net increase in government bonds for the first time since 2014 (Chart 24). Chart 25 shows that bond yields in the major countries will continue to trend higher as the rapid expansion of central bank balance sheets becomes a thing of the past. Chart 24Private Sector To Absorb More Bonds
OUTLOOK 2019: Late-Cycle Turbulence
OUTLOOK 2019: Late-Cycle Turbulence
Chart 25QE Unwind Will Weigh On Bond Prices
QE Unwind Will Weigh On Bond Prices
QE Unwind Will Weigh On Bond Prices
Ms. X: I’m not a fan of bonds at these levels, but that sounds overly bearish to me, especially given the recent plunge in oil prices. BCA: Lower oil prices will indeed help to hold down core inflation to the extent that energy prices leak into non-energy prices in the near term. Nonetheless, in the U.S., this effect will be overwhelmed by an overheated economy. From a long-term perspective, we believe that investors still have an overly benign view of the outlook for yields. The market expects that the 10-year Treasury yield in ten years will only be slightly above today’s spot yield, which itself is still very depressed by historical standards (Chart 26). And that also is the case in the other major bond markets. Chart 26Forward Yields Are Too Low
Forward Yields Are Too Low
Forward Yields Are Too Low
Of course, it will not be a straight line up for yields – there will be plenty of volatility. We expect the 10-year Treasury yield to peak sometime in 2019 or early 2020 in the 3.5%-to-4% range, before the next recession sends yields temporarily lower. Duration should be kept short at least until the middle of 2019, with an emphasis on TIPS relative to conventional Treasury bonds. We will likely downgrade TIPS versus conventionals once long-term inflation expectations move into our target range, which should occur sometime during 2019. The ECB and Japan will not be in a position to raise interest rates for some time, but the bear phase in U.S. Treasurys will drag up European and Japanese bond yields (at the very long end of the curve for the latter). Total returns are likely to be negative in all of the major bond markets in 2019. Real 10-year yields in all of the advanced economies are still well below their long-term average, except for Greece, Italy and Portugal (Chart 27). Chart 27Valuation Ranking Of Developed Bond Markets
OUTLOOK 2019: Late-Cycle Turbulence
OUTLOOK 2019: Late-Cycle Turbulence
Within global bond portfolios, we recommend being underweight bond markets where central banks are in a position to raise short-term interest rates (the U.S. and Canada), and overweight those that are not (Japan and Australia). The first ECB rate hike is unlikely before the end of 2019. However, the imminent end of the asset purchase program argues for no more than a benchmark allocation to core European bond markets within global fixed-income portfolios, especially since real 10-year yields in parts of continental Europe are the furthest below their long-term average. We are overweight gilts at the moment, but foresee shifting to underweight in 2019, depending on how Brexit plays out. Ms. X: What about corporate bonds? I know that total returns for corporates will be poor if government bond yields are rising. But you recommended overweighting corporate bonds relative to Treasurys last year. Given your view that the next U.S. recession is more than a year away, it seems reasonable to assume they will outperform government bonds. BCA: We were overweight corporates in the first half of 2018, but took profits in June and shifted to neutral at the same time that we downgraded our equity allocation. Spreads had tightened to levels that did not compensate investors for the risks. Recent spread widening has returned some value to U.S. corporates. The 12-month breakeven spreads for A-rated and Baa-rated corporate bonds are almost back up to their 50th percentile relative to history (Chart 28). Still, these levels are not attractive enough to justify buying based on valuation alone. As for high-yield, any rise in the default rate would quickly overwhelm the yield pickup in this space. Chart 28Corporate Bond Yields Still Have Upside
Corporate Bond Yields Still Have Upside
Corporate Bond Yields Still Have Upside
It is possible that some of the spread widening observed in October and November will reverse, but corporates offer a poor risk/reward tradeoff, even if the default rate stays low. Corporate profit growth is bound to decelerate in 2019. This would not be a disaster for equities, but slowing profit growth is more dangerous for corporate bond excess returns because the starting point for leverage is already elevated. As discussed above, at a macro level, the aggregate interest coverage ratio for the U.S. corporate sector is decent by historical standards. However, this includes mega-cap companies that have little debt and a lot of cash. Our bottom-up research suggests that interest coverage ratios for firms in the Bloomberg Barclays corporate bond index will likely drop close to multi-decade lows during the next recession, sparking a wave of downgrade activity and fallen angels. Seeing this coming, investors may require more yield padding to compensate for these risks as profit growth slows. Our next move will likely be to downgrade corporate bonds to underweight. We are watching the yield curve, bank lending standards, profit growth, and monetary indicators for signs to further trim exposure. You should already be moving up in quality within your corporate bond allocation. Mr. X: We have already shifted to underweight corporate bonds in our fixed income portfolio. Even considering the cheapening that has occurred over the past couple of months, spread levels still make no sense in terms of providing compensation for credit risk. Equity Market Outlook Ms. X: While we all seem to agree that corporate bonds are not very attractive, I believe that enough value has been restored to equities that we should upgrade our allocation, especially if the next recession is two years away. And I know that stocks sometimes have a powerful blow-off phase before the end of a bull market. Mr. X: This is where I vehemently disagree with my daughter. The recent sell-off resembles a bloodbath in parts of the global market. It has confirmed my worst fears, especially related to the high-flying tech stocks that I believe were in a bubble. Hopes for a blow-off phase are wishful thinking. I’m wondering if the sell-off represents the beginning of an extended bear market. BCA: Some value has indeed been restored. However, the U.S. market is far from cheap relative to corporate fundamentals. The trailing and 12-month forward price-earnings ratios (PER) of 20 and 16, respectively, are still far above their historical averages, especially if one leaves out the tech bubble period of the late 1990s. And the same is true for other metrics such as price-to-sales and price-to-book value (Chart 29). BCA’s composite valuation indicator, based on 8 different valuation measures, is only a little below the threshold of overvaluation at +1 standard deviation because low interest rates still favor equities on a relative yield basis. Chart 29U.S. Equities Are Not Cheap
U.S. Equities Are Not Cheap
U.S. Equities Are Not Cheap
It is true that equities can reward investors handsomely in the final stage of a bull market. Chart 30 presents cumulative returns to the S&P 500 in the last nine bull markets. The returns are broken down by quintile. The greatest returns, unsurprisingly, generally occur in the first part of the bull market (quintile 1). But total returns in the last 20% of the bull phase (quintile 5) have been solid and have beaten the middle quartiles. Chart 30Late-Cycle Blow-Offs Can Be Rewarding
OUTLOOK 2019: Late-Cycle Turbulence
OUTLOOK 2019: Late-Cycle Turbulence
Of course, the tricky part is determining where we are in the bull market. We have long viewed financial markets through the lens of money and credit. This includes a framework that involves the Fed policy cycle. The historical track record for risk assets is very clear; they tend to perform well when the fed funds rate is below neutral, whether rates are rising or falling. Risk assets tend to underperform cash when the fed funds rate is above neutral (Table 3). Table 3Stocks Do Well When The Fed Funds Rate Is Below Neutral
OUTLOOK 2019: Late-Cycle Turbulence
OUTLOOK 2019: Late-Cycle Turbulence
We believe the fed funds rate is still in easy territory. This suggests that it is too early to shift to underweight on risk assets. We may even want to upgrade to overweight if stocks become cheap enough, as long as Fed policy is not restrictive. That said, there is huge uncertainty about the exact level of rates that constitutes “neutral” (or R-star in the Fed’s lingo). Even the Fed is unsure. This means that we must watch for signs that the fed funds rate has crossed the line into restrictive territory as the FOMC tightens over the coming year. An inversion of the 3-month T-bill/10-year yield curve slope would be a powerful signal that policy has become tight, although the lead time of an inverted curve and declining risk asset prices has been quite variable historically. Finally, it is also important to watch U.S. profit margins. Some of our research over the past couple of years focused on the late-cycle dynamics of previous long expansions, such as the 1960s, 1980s and 1990s. We found that risk assets came under pressure once U.S. profit margins peaked. Returns were often negative from the peak in margins to the subsequent recession. Mr. X: U.S. profit margins must be close to peak levels. I’ve seen all sorts of anecdotal examples of rising cost pressures, not only in the labor market. BCA: We expected to see some margin pressure to appear by now. S&P 500 EPS growth will likely top out in the next couple of quarters, if only because the third quarter’s 26% year-over-year pace is simply not sustainable. But it is impressive that our margin proxies are not yet flagging an imminent margin squeeze, despite the pickup in wage growth (Chart 31). Chart 31U.S. Margin Indicators Still Upbeat
U.S. Margin Indicators Still Upbeat
U.S. Margin Indicators Still Upbeat
Margins according to the National Accounts (NIPA) data peaked in 2014 and have since diverged sharply with S&P 500 operating margins. It is difficult to fully explain the divergence. The NIPA margin is considered to be a better measure of underlying U.S. corporate profitability because it includes all companies (not just 500), and it is less subject to accounting trickery. That said, even the NIPA measure of margins firmed a little in 2018, along with the proxies we follow that correlate with the S&P 500 measure. The bottom line is that the macro variables that feed into our top-down U.S. EPS model point to a continuing high level of margins and fairly robust top-line growth, at least for the near term. For 2019, we assumed slower GDP growth and incorporated some decline in margins into our projection just to err on the conservative side. Nonetheless, our EPS model still projects a respectable 8% growth rate at the end of 2019 (Chart 32). The dollar will only be a minor headwind to earnings growth unless it surges by another 10% or more. Chart 32EPS Growth Forecasts
EPS Growth Forecasts
EPS Growth Forecasts
The risks to EPS growth probably are to the downside relative to our forecast, but the point is that U.S. earnings will likely remain supportive for the market unless economic growth is much weaker than we expect. None of this means that investors should be aggressively overweight stocks now. We trimmed our equity recommendation to benchmark in mid-2018 for several reasons. At the time, value was quite poor and bottom-up earnings expectations were too high, especially on a five-year horizon. Also, sentiment measures suggested that investors were overly complacent. As you know, we are always reluctant to chase markets into highly overvalued territory, especially when a lot of good news has been discounted. As we have noted, we are open to temporarily shifting back to overweight in equities and other risk assets. The extension of the economic expansion gives more time for earnings to grow. The risks facing the market have not eased much but, given our base-case macro view, we would be inclined to upgrade equities if there is another meaningful correction. Of course, our profit, monetary and economic indicators would have to remain supportive to justify an upgrade. Mr. X: But you are bearish on bonds. We saw in October that the equity market is vulnerable to higher yields. BCA: It certainly won’t be smooth sailing through 2019 as interest rates normalize. Until recently, higher bond yields reflected stronger growth without any associated fears that inflation was a growing problem. The ‘Fed Put’ was seen as a key backstop for the equity bull market. But now that the U.S. labor market is showing signs of overheating, the bond sell-off has become less benign for stocks because the Fed will be less inclined to ease up at the first sign of trouble in the equity market. How stocks react in 2019 to the upward trend in yields depends a lot on the evolution of actual inflation and long-term inflation expectations. If core PCE inflation hovers close to or just above 2% for a while, then the Fed Put should still be in place. However, it would get ugly for both bonds and stocks if inflation moves beyond 2.5%. Our base case is that this negative dynamic won’t occur until early 2020, but obviously the timing is uncertain. One key indicator to watch is long-term inflation expectations, such as the 10-year TIPS breakeven inflation rate (Chart 33). It is close to 2% at the moment. If it shifts up into the 2.3%-2.5% range, it would confirm that inflation expectations have returned to a level that is consistent with the Fed meeting its 2% inflation target on a sustained basis. This would be a signal to the Fed that it is must become more aggressive in calming growth, with obvious negative consequences for risk assets. Chart 33Watch For A Return To 2.3%-2.5% Range
Watch For A Return To 2.3%-2.5% Range
Watch For A Return To 2.3%-2.5% Range
Mr. X: I am skeptical that the U.S. corporate sector can pull off an 8% earnings gain in 2019. What about the other major markets? Won’t they get hit hard if global growth continues to slow as you suggest? BCA: Yes, that is correct. It is not surprising that EPS growth has already peaked in the Euro Area and Japan. The profit situation is going to deteriorate quickly in the coming quarters. Industrial production growth in both economies has already dropped close to zero, and we use this as a proxy for top-line growth in our EPS models. Nominal GDP growth has decelerated sharply in both economies in absolute terms and relative to the aggregate wage bill. These trends suggest that profit margins are coming under significant downward pressure. Even when we build in a modest growth pickup and slight rebound in margins in 2019, EPS growth falls close to zero by year-end according to our models. Both the Euro Area and Japanese equity markets are cheap relative to the U.S., based on our composite valuation indicators (Chart 34). However, neither is above the threshold of undervaluation (+1 standard deviation) that would justify overweight positions on valuation alone. We think the U.S. market will outperform the other two at least in the first half of 2019 in local and, especially, common-currency terms. Chart 34Valuation Of Nonfinancial Equity Markets Relative To The U.S.
OUTLOOK 2019: Late-Cycle Turbulence
OUTLOOK 2019: Late-Cycle Turbulence
Ms. X: It makes sense that U.S. profit growth will outperform the other major developed countries in 2019. I would like to circle back to emerging market assets. I understand that many emerging economies have deep structural problems. But you admitted that the Chinese authorities will eventually stimulate enough to stabilize growth, providing a bounce in EM growth and asset prices next year. These assets seem cheap enough to me to warrant buying now in anticipation of that rally. As we all know, reversals from oversold levels can happen in a blink of an eye and I don’t want to miss it. BCA: We are looking for an opportunity to buy as well, but are wary of getting in too early. First, valuation has improved but is not good enough on its own to justify buying now. EM stocks are only moderately undervalued based on our EM composite valuation indicator and the cyclically-adjusted P/E ratio (Chart 35). EM currencies are not particularly cheap either, outside of Argentina, Turkey and Mexico (Charts 36A and 36B). Valuation should only play a role in investment strategy when it is at an extreme, and this is not the case for most EM countries. Chart 35EM Stocks Are Not At Capitulation Levels...
bca.bca_mp_2018_12_01_c35
bca.bca_mp_2018_12_01_c35
Chart 36A…And Neither Are EM Currencies
...And Neither Are EM Currencies
...And Neither Are EM Currencies
Chart 36B…And Neither Are EM Currencies
...And Neither Are EM Currencies
...And Neither Are EM Currencies
Second, corporate earnings growth has plenty of downside potential in the near term. Annual growth in EM nonfinancial EBITDA, currently near 10%, is likely to turn negative next year, based on our China credit and fiscal impulse indicator (Chart 37). And, as we emphasized earlier, China is not yet pressing hard on the gas pedal. Chart 37EM Earnings Growth: Lots Of Downside
EM Earnings Growth: Lots Of Downside
EM Earnings Growth: Lots Of Downside
Third, it will take time for more aggressive Chinese policy stimulus, if it does occur, to show up in EM stocks and commodity prices. Trend changes in money growth and our credit and fiscal impulse preceded the trough in EM stocks and commodity prices in 2015, and again at the top in stocks and commodities in 2017 (Chart 38). However, even if these two indicators bottom today, it could take several months before the sell-off in EM financial markets and commodity prices abates. Chart 38Chinese Money And Credit Leads EM And Commodities
Chinese Money And Credit Leads EM And Commodities
Chinese Money And Credit Leads EM And Commodities
Finally, if Chinese stimulus comes largely via easier monetary policy rather than fiscal stimulus, then the outcome will be a weaker RMB. We expect the RMB to drift lower in any event, because rate differentials vis-à-vis the U.S. will move against the Chinese currency next year. A weaker RMB would add to the near-term headwinds facing EM assets. The bottom line is that the downside risks remain high enough that you should resist the temptation to bottom-fish until there are concrete signs that the Chinese authorities are getting serious about boosting the economy. We are also watching for signs outside of China that the global growth slowdown is ending. This includes our global leading economic indicator and data that are highly sensitive to global growth, such as German manufacturing foreign orders. Mr. X: Emerging market assets would have to become a lot cheaper for me to consider buying. Debt levels are just too high to be sustained, and stronger Chinese growth would only provide a short-term boost. I’m not sure I would even want to buy developed market risk assets based solely on some Chinese policy stimulus. BCA: Yes, we agree with your assessment that buying EM in 2019 would be a trade rather than a buy-and-hold strategy. Still, the combination of continued solid U.S. growth and a modest upturn in the Chinese economy would alleviate a lot of investors’ global growth concerns. The result could be a meaningful rally in pro-cyclical assets that you should not miss. We are defensively positioned at the moment, but we could see becoming more aggressive in 2019 on signs that China is stimulating more firmly and/or our global leading indicators begin to show some signs of life. Besides upgrading our overall equity allocation back to overweight, we would dip our toes in the EM space again. At the same time, we will likely upgrade the more cyclical DM equity markets, such as the Euro Area and Japan, while downgrading the defensive U.S. equity market to underweight. We are currently defensively positioned in terms of equity sectors, but it would make sense to shift cyclicals to overweight at the same time. Exact timing is always difficult, but we expect to become more aggressive around the middle of 2019. We also think the time is approaching to favor long-suffering value stocks over growth stocks. The relative performance of growth-over-value according to standard measures has become a sector call over the past decade: tech or financials. The sector skew complicates this issue, especially since tech stocks have already cracked. But we have found that stocks that are cheap within equity sectors tend to outperform expensive (or growth) stocks once the fed funds rate moves into restrictive territory. This is likely to occur in the latter half of 2019. Value should then have its day in the sun. Currencies: Mr. X: We don’t usually hedge our international equity exposure, so the direction of the dollar matters a lot to us. As you predicted a year ago, the U.S. dollar reigned supreme in 2018. Your economic views suggest another good year in 2019, but won’t this become a problem for the economy? President Trump’s desire to lower the U.S. trade deficit suggests that the Administration would like the dollar to drop and we could get some anti-dollar rhetoric from the White House. Also, it seems that the consensus is strongly bullish on the dollar which is always a concern. BCA: The outlook for the dollar is much trickier than it was at the end of 2017. As you highlighted, traders are already very long the dollar, implying that the hurdle for the greenback to surprise positively is much higher now. However, a key driver for the dollar is the global growth backdrop. If the latter is poor in the first half of 2019 as we expect, it will keep a bid under the greenback. Interest rates should also remain supportive for the dollar. As we argued earlier, current market expectations – only one more Fed hike after the December meeting – are too sanguine. If the Fed increases rates by more than currently discounted, the dollar’s fair value will rise, especially if global growth continues to lag that of the U.S. Since the dollar’s 2018 rally was largely a correction of its previous undervaluation, the currency has upside potential in the first half of the year (Chart 39). Chart 39U.S. Dollar Not Yet Overvalued
U.S. Dollar Not Yet Overvalued
U.S. Dollar Not Yet Overvalued
A stronger dollar will dampen foreign demand for U.S.-produced goods and will boost U.S. imports. However, do not forget that a rising dollar benefits U.S. consumers via its impact on import prices. Since the consumer sector represents 68% of GDP, and that 69% of household consumption is geared toward the (largely domestic) service sector, a strong dollar will not be as negative for aggregate demand and employment as many commentators fear, unless it were to surge by at least another 10%. In the end, the dollar will be more important for the distribution of U.S. growth than its overall level. Where the strong dollar is likely to cause tremors is in the political arena. You are correct to point out that there is a large inconsistency between the White House’s desires to shore up growth, while simultaneously curtailing the trade deficit, especially if the dollar appreciates further. As long as the Fed focuses on its dual mandate and tries to contain inflationary pressures, the executive branch of the U.S. government can do little to push the dollar down. Currency intervention cannot have a permanent effect unless it is accompanied by shifts in relative macro fundamentals. For example, foreign exchange intervention by the Japanese Ministry of Finance in the late 1990s merely had a temporary impact on the yen. The yen only weakened on a sustained basis once interest rate differentials moved against Japan. This problem underpins our view that the Sino-U.S. relationship is unlikely to improve meaningfully next year. China will remain an easy target to blame for the U.S.’s large trade deficit. What ultimately will signal a top in the dollar is better global growth, which is unlikely until the second half of 2019. At that point, expected returns outside the U.S. will improve, causing money to leave the U.S., pushing the dollar down. Mr. X: While 2017 was a stellar year for the euro, 2018 proved a much more challenging environment. Will 2019 be more like 2017 or 2018? BCA: We often think of the euro as the anti-dollar; buying EUR/USD is the simplest, most liquid vehicle for betting against the dollar, and vice versa. Our bullish dollar stance is therefore synonymous with a negative take on the euro. Also, the activity gap between the U.S. and the Euro Area continues to move in a euro-bearish fashion (Chart 40). Finally, since the Great Financial Crisis, EUR/USD has lagged the differential between European and U.S. core inflation by roughly six months. Today, this inflation spread still points toward a weaker euro. Chart 40Relative LEI's Moving Against Euro
Relative LEI's Moving Against Euro
Relative LEI's Moving Against Euro
It is important to remember that when Chinese economic activity weakens, European growth deteriorates relative to the U.S. Thus, our view that global growth will continue to sputter in the first half of 2019 implies that the monetary policy divergence between the Fed and the ECB has not yet reached a climax. Consequently, we expect EUR/USD to trade below 1.1 in the first half of 2019. By that point, the common currency will be trading at a meaningful discount to its fair value, which will allow it to find a floor (Chart 41). Chart 41Euro Heading Below Fair Value Before Bottoming
Euro Heading Below Fair Value Before Bottoming
Euro Heading Below Fair Value Before Bottoming
Mr. X: The Bank of Japan has debased the yen, with a balance sheet larger than Japan’s GDP. This cannot end well. I am very bearish on the currency. BCA: The BoJ’s monetary policy is definitely a challenge for the yen. The Japanese central bank rightfully understands that Japan’s inability to generate any meaningful inflation – despite an economy that is at full employment – is the consequence of a well-established deflationary mindset. The BoJ wants to shock inflation expectations upward by keeping real rates at very accommodative levels well after growth has picked up. This means that the BoJ will remain a laggard as global central banks move away from accommodative policies. The yen will continue to depreciate versus the dollar as U.S. yields rise on a cyclical horizon. That being said, the yen still has a place within investors’ portfolios. First, the yen is unlikely to collapse despite the BoJ’s heavy debt monetization. The JPY is one of the cheapest currencies in the world, with its real effective exchange rate hovering at a three-decade low (Chart 42). Additionally, Japan still sports a current account surplus of 3.7% of GDP, hardly the sign of an overstimulated and inflationary economy where demand is running amok. Instead, thanks to decades of current account surpluses, Japan has accumulated a positive net international investment position of 60% of GDP. This means that Japan runs a constant and large positive income balance, a feature historically associated with strong currencies. Chart 42The Yen Is Very Cheap
The Yen Is Very Cheap
The Yen Is Very Cheap
Japan’s large net international investment position also contributes to the yen’s defensive behavior as Japanese investors pull money back to safety at home when global growth deteriorates. Hence, the yen could rebound, especially against the euro, the commodity currencies, and EM currencies if there is a further global growth scare in the near term. Owning some yen can therefore stabilize portfolio returns during tough times. As we discussed earlier, we would avoid the EM asset class, including currency exposure, until global growth firms. Commodities: Ms. X: Once again, you made a good call on the energy price outlook a year ago, with prices moving higher for most of the year. But the recent weakness in oil seemed to come out of nowhere, and I must admit to being confused about where we go next. What are your latest thoughts on oil prices for the coming year? BCA: The fundamentals lined up in a very straightforward way at the end of 2017. The coalition we have dubbed OPEC 2.0 – the OPEC and non-OPEC producer group led by the Kingdom of Saudi Arabia (KSA) and Russia – outlined a clear strategy to reduce the global oil inventory overhang. The producers that had the capacity to increase supply maintained strict production discipline which, to some analysts, was still surprising even after the cohesiveness shown by the group in 2017. Outside that core group output continued to fall, especially in Venezuela, which remains a high-risk producing province. The oil market was balanced and prices were slowly moving higher as we entered the second quarter of this year, when President Trump announced the U.S. would re-impose oil export sanctions against Iran beginning early November. The oft-repeated goal of the sanctions was to reduce Iranian exports to zero. To compensate for the lost Iranian exports, President Trump pressured OPEC, led by KSA, to significantly increase production, which they did. However, as we approached the November deadline, the Trump Administration granted the eight largest importers of Iranian oil 180-day waivers on the sanctions. This restored much of the oil that would have been lost. Suddenly, the market found itself oversupplied and prices fell. As we move toward the December 6 meeting of OPEC 2.0 in Vienna, we are expecting a production cut from the coalition of as much as 1.4mm b/d to offset these waivers. The coalition wishes to keep global oil inventories from once again over-filling and dragging prices even lower in 2019. On the demand side, consumption continues to hold up both in the developed and emerging world, although we have somewhat lowered our expectations for growth next year. We are mindful of persistent concerns over the strength of demand – particularly in EM – in 2019. Thus, on the supply side and the demand side, the level of uncertainty in the oil markets is higher than it was at the start of 2018. Nonetheless, our base-case outlook is on the optimistic side for oil prices in 2019, with Brent crude oil averaging around $82/bbl, and WTI trading $6/bbl below that level (Chart 43). Chart 43Oil Prices To Rebound In 2019
Oil Prices To Rebound In 2019
Oil Prices To Rebound In 2019
Ms. X: I am skeptical that oil prices will rebound as much as you expect. First, oil demand is likely to falter if your view that global growth will continue slowing into early 2019 proves correct. Second, U.S. shale production is rising briskly, with pipeline bottlenecks finally starting to ease. Third, President Trump seems to have gone from taking credit for high equity prices to taking credit for low oil prices. Trump has taken a lot flack for supporting Saudi Arabia following the killing of The Washington Post journalist in Turkey. Would the Saudis really be willing to lose Trump’s support by cutting production at this politically sensitive time? BCA: Faltering demand growth remains a concern. However, note that in our forecasts we do expect global oil consumption growth to slow down to 1.46mm b/d next year, somewhat lower than the 1.6mm b/d growth we expect this year. In terms of the U.S. shale sector, production levels over the short term can be somewhat insensitive to changes in spot and forward prices, given the hedging activity of producers. Over the medium to longer term, however, lower spot and forward prices will disincentivize drilling by all but the most efficient producers with the best, lowest-cost acreage. If another price collapse were to occur – and were to persist, as the earlier price collapse did – we would expect a production loss of between 5% and 10% from the U.S. shales. Regarding KSA, the Kingdom needs close to $83/bbl to balance its budget this year and next, according to the IMF’s most recent estimates. If prices remain lower for longer, KSA’s official reserves will continue to fall, as its sovereign wealth fund continues to be tapped to fill budget gaps. President Trump’s insistence on higher production from KSA and the rest of OPEC is a non-starter – it would doom those economies to recession, and stifle further investment going forward. The U.S. would also suffer down the road, as the lack of investment significantly tightens global supply. So, net, if production cuts are not forthcoming from OPEC at its Vienna meeting we – and the market – will be downgrading our oil forecast. Ms. X: Does your optimism regarding energy extend to other commodities? The combination of a strong dollar and a China slowdown did a lot of damage to industrial commodities in 2018. Given your view that China’s economy should stabilize in 2019, are we close to a bottom in base metals? BCA: It is too soon to begin building positions in base metals because the trade war is going to get worse before it gets better. Exposure to base metals should be near benchmark at best entering 2019, although we will be looking to upgrade along with other risk assets if Chinese policy stimulus ramps up. Over the medium term, the outlook for base metals hinges on how successfully China pulls off its pivot toward consumer- and services-led growth, away from heavy industrial-led development. China accounts for roughly half of global demand for these base metals. Commodity demand from businesses providing consumer goods and services is lower than that of heavy industrial export-oriented firms. But demand for commodities used in consumer products – e.g., copper, zinc and nickel, which go into stainless-steel consumer appliances such as washers and dryers – will remain steady, and could increase if the transition away from heavy industrial-led growth is successful. Gasoline and jet fuel demand will also benefit, as EM consumers’ demand for leisure activities such as tourism increases with rising incomes. China is also going to be a large producer and consumer of electric vehicles, as it attempts to reduce its dependence on imported oil. Although timing the production ramp-up is difficult, in the long term these trends will be supportive for nickel and copper. Mr. X: You know I can’t let you get away without asking about gold. The price of bullion is down about 5% since the end of 2017, but that is no worse than the global equity market and it did provide a hedge against economic, financial or political shocks. The world seems just as risky as it did a year ago, so I am inclined to hold on to our gold positions, currently close to 10% of our portfolio. That is above your recommended level, but keeping a solid position in gold is one area where my daughter and I have close agreement regarding investment strategy. BCA: Gold did perform well during the risk asset corrections we had in 2018, and during the political crises as well. The price is not too far away from where we recommended going long gold as a portfolio hedge at the end of 2017 ($1230.3/oz). We continue to expect gold to perform well as a hedge. When other risk assets are trading lower, gold holds value relative to equities and tends to outperform bonds (Chart 44). Likewise, when other risk assets are rising, gold participates, but does not do as well as equities. It is this convexity – outperforming on the downside but participating on the upside with other risk assets – that continues to support our belief that gold has a role as a portfolio hedge. However, having 10% of your portfolio in gold is more than we would recommend – we favor an allocation of around 5%. Chart 44Hold Some Gold As A Hedge
OUTLOOK 2019: Late-Cycle Turbulence
OUTLOOK 2019: Late-Cycle Turbulence
Geopolitics Ms. X: I’m glad that the three of us agree at least on one thing – hold some gold! Let’s return to the geopolitical situation for a moment. Last year, you correctly forecast that divergent domestic policies in the U.S. and China – stimulus in the former and lack thereof in the latter – would be the most investment-relevant geopolitical issue. At the time, I found this an odd thing to highlight, given the risks of protectionism, populism, and North Korea. Do you still think that domestic policies will dominate in 2019? BCA: Yes, policy divergence between the U.S. and China will also dominate in 2019, especially if it continues to buoy the U.S. economy at the expense of the rest of the world. Of course, Beijing may decide to do more stimulus to offset its weakening economy and the impact of the trade tariffs. A headline rate cut, cuts to bank reserve requirements, and a boost to local government infrastructure spending are all in play. In the context of faltering housing and capex figures in the U.S., the narrative over the next quarter or two could be that the policy divergence is over, that Chinese policymakers have “blinked.” We are pushing back against this narrative on a structural basis. We have already broadly outlined our view that China will not be pressing hard to boost demand growth. Many of its recent policy efforts have focused on rebalancing the economy away from debt-driven investment (Chart 45). The problem for the rest of the world is that raw materials and capital goods comprise 85% of Chinese imports. As such, efforts to boost domestic consumption will have limited impact on the rest of the world, especially as emerging markets are highly leveraged to “old China.” Chart 45Rebalancing Of The Chinese Economy
Rebalancing Of The Chinese Economy
Rebalancing Of The Chinese Economy
Meanwhile, the Trump-Democrat gridlock could yield surprising results in 2019. President Trump is becoming singularly focused on winning re-election in 2020. As such, he fears the “stimulus cliff” looming over the election year. Democrats, eager to show that they are not merely the party of “the Resistance,” have already signaled that an infrastructure deal is their top priority. With fiscal conservatives in the House all but neutered by the midterm elections, a coalition between Trump and likely House Speaker Nancy Pelosi could emerge by late 2019, ushering in even more fiscal stimulus. While the net new federal spending will not be as grandiose as the headline figures, it will be something. There will also be regular spending increases in the wake of this year’s bipartisan removal of spending caps. We place solid odds that the current policy divergence narrative continues well into 2019, with bullish consequences for the U.S. dollar and bearish outcomes for EM assets, at least in the first half of the year. Mr. X: Your geopolitical team has consistently been alarmist on the U.S.-China trade war, a view that bore out throughout 2018. You already stated that you think trade tensions will persist in 2019. Where is this heading? BCA: Nowhere good. Rising geopolitical tensions in the Sino-American relationship has been our premier geopolitical risk since 2012. The Trump administration has begun tying geopolitical and strategic matters in with the trade talks. No longer is the White House merely asking for a narrowing of the trade deficit, improved intellectual property protections, and the removal of non-tariff barriers to trade. Now, everything from surface-to-air missiles in the South China Sea to Beijing’s “Belt and Road” project are on the list of U.S. demands. Trade negotiations are a “two-level game,” whereby policymakers negotiate in parallel with their foreign counterparts and domestic constituents. While Chinese economic agents may accept U.S. economic demands, it is not clear to us that its military and intelligence apparatus will accept U.S. geopolitical demands. And Xi Jinping himself is highly attuned to China’s geopolitical position, calling for national rejuvenation above all. We would therefore downplay any optimistic news from the G20 summit between Presidents Trump and Xi. President Trump could freeze tariffs at current rates and allow for a more serious negotiating round throughout 2019. But unless China is willing to kowtow to America, a fundamental deal will remain elusive in the end. For Trump, a failure to agree is still a win domestically, as the median American voter is not asking for a resolution of the trade war with China (Chart 46). Chart 46Americans Favor Being Tough On China
OUTLOOK 2019: Late-Cycle Turbulence
OUTLOOK 2019: Late-Cycle Turbulence
Ms. X: Could trade tensions spill into rising military friction? BCA: Absolutely. Minor military skirmishes will likely continue and could even escalate. We believe that there is a structural bull market in “war.” Investors should position themselves by being long global defense stocks. Mr. X: That is not encouraging. What about North Korea and Iran? Could they become geopolitical risks in 2019? BCA: Our answer to the North Korea question remains the same as 12 months ago: we have seen the peak in the U.S.’ display of a “credible military threat.” But Iran could re-emerge as a risk mid-year. We argued in last year’s discussion that President Trump was more interested in playing domestic politics than actually ratcheting up tensions with Iran. However, in early 2018 we raised our alarm level, particularly when staffing decisions in the White House involved several noted Iran hawks joining the foreign policy team. This was a mistake. Our initial call was correct, as President Trump ultimately offered six-month exemptions to eight importers of Iranian crude. That said, those exemptions will expire in the spring. The White House may, at that point, ratchet up tensions with Iran. This time, we will believe it when we see it. Intensifying tensions with Iran ahead of the U.S. summer vacation season, and at a time when crude oil markets are likely to be finely balanced, seems like folly, especially with primary elections a mere 6-to-8 months away. What does President Trump want more: to win re-election or to punish Iran? We think the answer is obvious, especially given that very few voters seem to view Iran as the country’s greatest threat (Chart 47). Chart 47Americans Don’t See Iran As A Major Threat
OUTLOOK 2019: Late-Cycle Turbulence
OUTLOOK 2019: Late-Cycle Turbulence
Ms. X: Let’s turn to Europe. You have tended to dismiss Euroskeptics as a minor threat, which has largely been correct. But don’t you think that, with Brexit upon us and Chancellor Angela Merkel in the twilight, populism in continental Europe will finally have its day? BCA: Let’s first wait to see how Brexit turns out! The next few months will be critical. Uncertainty is high, with considerable risks remaining. We do not think that Prime Minister May has the votes in the House of Commons to push through any version of soft Brexit that she has envisioned thus far. If the vote on the U.K.-EU exit deal falls through, a new election could be possible. This will require an extension of the exit process under Article 50 and a prolonged period of uncertainty. The probability of a no-deal Brexit is lower than 10%. It is simply not in the interest of anyone involved, save for a smattering of the hardest of hard Brexit adherents in the U.K. Conservative Party. Put simply, if the EU-U.K. deal falls through in the House of Commons, or even if PM May is replaced by a hard-Brexit Tory, the most likely outcome is an extension of the negotiation process. This can be easily done and we suspect that all EU member states would be in favor of such an extension given the cost to business sentiment and trade that would result from a no-deal Brexit. It is not clear that Brexit has emboldened Euroskeptics. In fact, most populist parties in the EU have chosen to tone down their Euroskepticism and emphasize their anti-immigrant agenda since the Brexit referendum. In part, this decision has to do with how messy the Brexit process has become. If the U.K. is struggling to unravel the sinews that tie it to Europe, how is any other country going to fare any better? The problem for Euroskeptic populists is that establishment parties are wise to the preferences of the European median voter. For example, we now have Friedrich Merz, a German candidate for the head of the Christian Democratic Union – essentially Merkel’s successor – who is both an ardent Europhile and a hardliner on immigration. This is not revolutionary. Merz simply read the polls correctly and realized that, with 83% of Germans supporting the euro, the rise of the anti-establishment Alternative for Germany (AfD) is more about immigration than about the EU. As such, we continue to stress that populism in Europe is overstated. In fact, we expect that Germany and France will redouble their efforts to reform European institutions in 2019. The European parliamentary elections in May will elicit much handwringing by the media due to a likely solid showing by Euroskeptics, even though the election is meaningless. Afterwards, we expect to see significant efforts to complete the banking union, reform the European Stability Mechanism, and even introduce a nascent Euro Area budget. But these reforms will not be for everyone. Euroskeptics in Central and Eastern Europe will be left on the outside looking in. Brussels may also be emboldened to take a hard line on Italy if institutional reforms convince the markets that the core Euro Area is sheltered from contagion. In other words, the fruits of integration will be reserved for those who play by the Franco-German rules. And that could, ironically, set the stage for the unraveling of the European Union as we know it. Over the long haul, a much tighter, more integrated, core could emerge centered on the Euro Area, with the rest of the EU becoming stillborn. The year 2019 will be a vital one for Europe. We are sensing an urgency in Berlin and Paris that has not existed throughout the crisis, largely due to Merkel’s own failings as a leader. We remain optimistic that the Euro Area will survive. However, there will be fireworks. Finally, a word about Japan. The coming year will see the peak of Prime Minister Shinzo Abe’s career. He is promoting the first-ever revision to Japan’s post-war constitution in order to countenance the armed forces. If he succeeds, he will have a big national security success to couple with his largely effective “Abenomics” economic agenda – after that, it will all be downhill. If he fails, he will become a lame duck. This means that political uncertainty will rise in 2019, after six years of unusual tranquility. Conclusions Mr. X: This is a good place to conclude our discussion. We have covered a lot of ground and your views have reinforced my belief that 2019 could be even more turbulent for financial markets than the past has been. I accept your opinion that a major global economic downturn is not around the corner, but with valuations still stretched, I feel that it makes good sense to focus on capital preservation. I may lose out on the proverbial “blow-off” rally, but so be it – I have been in this business long enough to know that it is much better to leave the party while the music is still playing! Ms. X: I agree with my father that the risks surrounding the outlook have risen as we have entered the late stages of this business-cycle expansion. Yet, if global growth does temporarily stabilize and corporate earnings continue to expand, I fear that being out of the market will be very painful. The era of hyper-easy money may be ending, but interest rates globally are still nowhere near restrictive territory. This tells me that the final stages of this bull market could be very rewarding. A turbulent market is not only one where prices go down – they can also go up a lot! BCA: The debate you are having is one we ourselves have had on numerous occasions. There is always a trade-off between maximizing short-term returns and taking a longer-term approach. Valuations are the ultimate guidepost for long-term returns. While most assets have cheapened over the past year, prices are still fairly elevated. Table 4 shows our baseline calculations of what a balanced portfolio will earn over the coming decade. We estimate that such a portfolio will deliver average annual returns of 4.9% over the next ten years, or 2.8% after adjusting for inflation. That is an improvement over our inflation-adjusted estimate of 1.3% from last year, but still well below the 6.6% real return that a balanced portfolio earned between 1982 and 2018. Table 410-Year Asset Return Projections
OUTLOOK 2019: Late-Cycle Turbulence
OUTLOOK 2019: Late-Cycle Turbulence
Our return calculations for equities assume that profit margins decline modestly over the period and that multiples mean revert to their historical average. These assumptions may turn out to be too pessimistic if underlying changes in the economy keep corporate profits elevated as a share of GDP. Structurally lower real interest rates may also justify higher P/E multiples, although this would be largely offset by the prospect of slower economic growth, which will translate into slower earnings growth. In terms of the outlook for the coming year, a lot hinges on our view that monetary policy in the main economies stays accommodative. This seems like a safe assumption in the Euro Area and Japan, where rates are near historic lows, as well as in China, where the government is actively loosening monetary conditions. It is not such a straightforward conclusion for the U.S., where the Fed is on track to keep raising rates. If it turns out that the neutral interest rate is not far above where rates are already, we could see a broad-based slowdown of the U.S. economy that ripples through to the rest of the world. And even if U.S. monetary policy does remain accommodative, many things could still upset the apple cart, including a full-out trade war, debt crises in Italy or China, or a debilitating spike in oil prices. As the title of our outlook implies, 2019 is likely to be a year of increased turbulence. Ms. X: As always, you have left us with much to think about. My father has looked forward to these discussions every year and now that I am able to join him, I understand why. Before we conclude, it would be helpful to have a recap of your key views. BCA: That would be our pleasure. The key points are as follows: The collision between policy and markets that we discussed last year finally came to a head in October. Rather than falling as they normally do when stocks plunge, U.S. bond yields rose as investors reassessed the willingness of the Fed to pause hiking rates even in the face of softer growth. Likewise, hopes that China would move swiftly to stimulate its economy were dashed as it became increasingly clear that the authorities were placing a high emphasis on their reform agenda of deleveraging and capacity reduction. The ongoing Brexit saga and the stalemate between the populist Italian government and the EU have increased uncertainty in Europe at a time when the region was already beginning to slow. We expect the tensions between policy and markets to be an ongoing theme in 2019. With the U.S. unemployment rate at a 48-year low, it will take a significant slowdown for the Fed to stop hiking rates. Despite the deterioration in economic data over the past month, real final domestic demand is still tracking to expand by 3% in the fourth quarter, well above estimates of the sustainable pace of economic growth. Ultimately, the Fed will deliver more hikes next year than discounted in the markets. This will push up the dollar and keep the upward trend in Treasury yields intact. The dollar should peak midway next year. China will also become more aggressive in stimulating its economy, which will boost global growth. However, until both of these things happen, emerging markets will remain under pressure. For the time being, we continue to favor developed market equities over their EM peers. We also prefer defensive equity sectors such as health care and consumer staples over cyclical sectors such as industrials and materials. Within the developed market universe, the U.S. will outperform Europe and Japan for the next few quarters, especially in dollar terms. A stabilization in global growth could ignite a blow-off rally in global equities. If the Fed is raising rates in response to falling unemployment, this is unlikely to derail the stock market. However, once supply-side constraints begin to fully bite in early 2020 and inflation rises well above the Fed’s target of 2%, stocks will begin to buckle. This means that a window exists next year where stocks will outperform bonds. We would maintain a benchmark allocation to stocks for now, but increase exposure if global bourses were to fall significantly from current levels without a corresponding deteriorating in the economic outlook. Corporate credit will underperform stocks as government bond yields rise. A major increase in spreads is unlikely as long as the economy is still expanding, but spreads could still widen modestly given their low starting point. U.S. shale companies have been the marginal producers in the global oil sector. With breakeven costs in shale close to $50/bbl, crude prices are unlikely to rise much from current levels over the long term. However, over the next 12 months, we expect production cuts in Saudi Arabia will push prices up, with Brent crude averaging around $82/bbl in 2019. A balanced portfolio is likely to generate average returns of only 2.8% a year in real terms over the next decade. This compares to average returns of around 6.6% a year between 1982 and 2018. We would like to take this opportunity to wish you and all of our clients a very peaceful, healthy and prosperous New Year. The Editors November 26, 2018