Fiscal
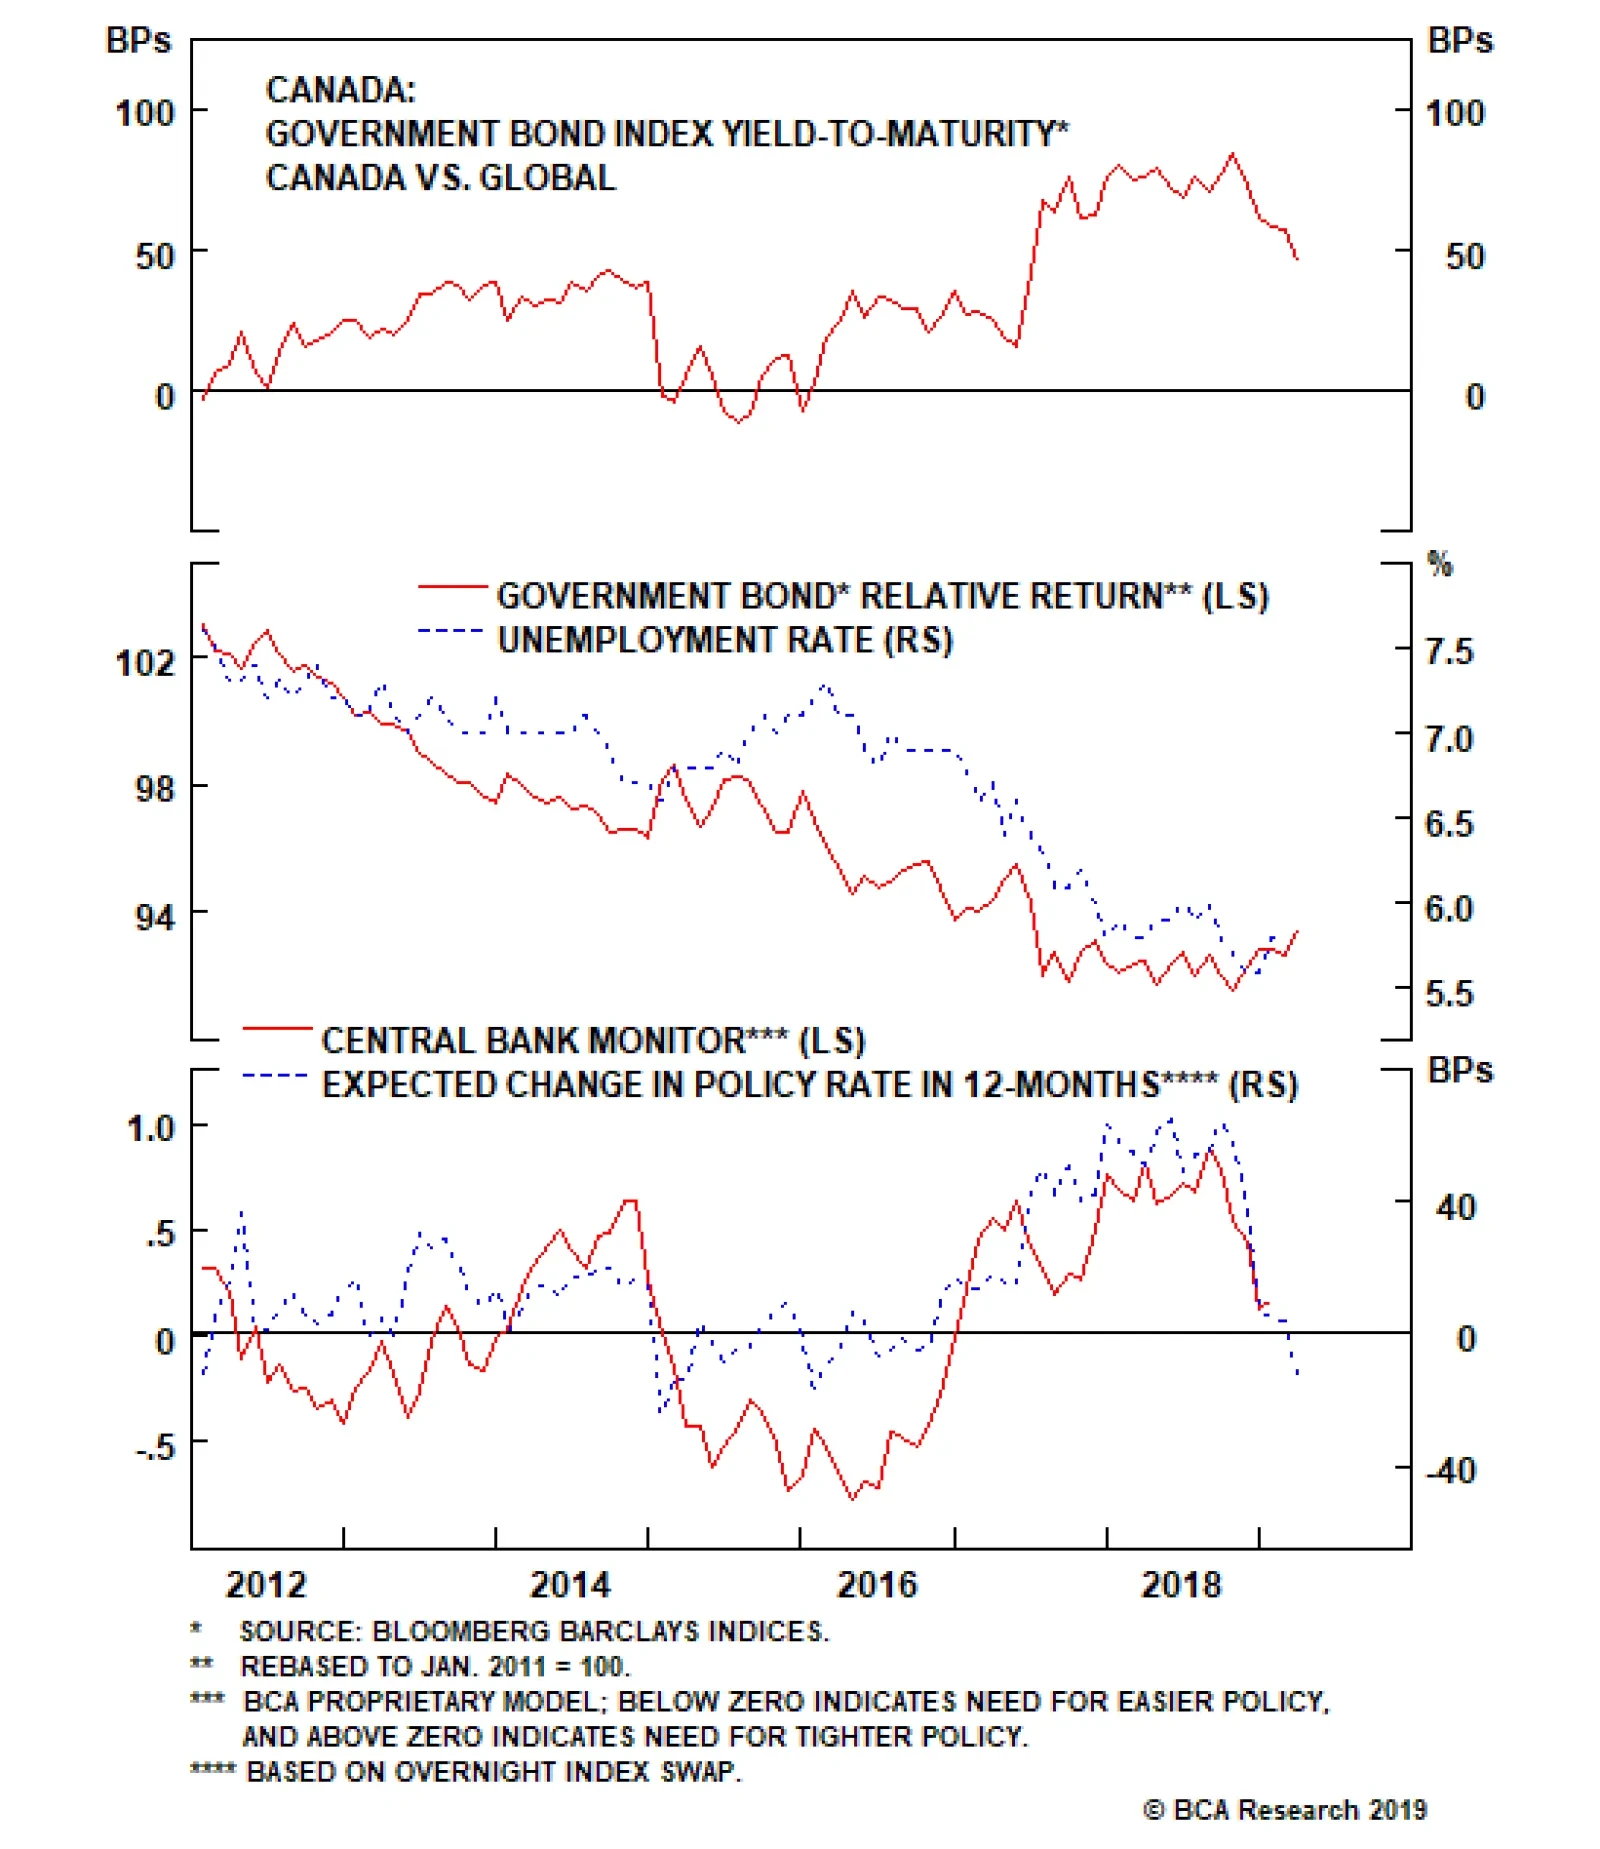
Canadian government bonds have been clawing back much of the relative underperformance that occurred in 2017 and 2018 when the Bank of Canada (BoC) was delivering multiple rate hikes. The spread between the yields on the Bloomberg Barclays Canada Treasury…
Strategies such as price-level targeting would represent a significant change from managing the 2% annual inflation target on a non-cumulative basis. The Fed has executed its price-stability mandate by aiming for 2% annual inflation, as measured by the…

Highlights So What? The late-cycle rally still faces non-trivial political hurdles. Why? U.S.-China trade talks, the U.S. threat of tariffs on auto imports, and Brexit continue to pose risks. A shocking revelation from the Mueller report could have a temporary negative impact on equity markets. A bombshell would increase Trump’s chances of removal from office. We give 35% odds to tarrifs on autos and auto parts, and 10% odds to a hard Brexit. Feature In our February 6 report we outlined how a “Witches’ Brew” of geopolitical risks had the potential to short-circuit the late-cycle equity rally. A month later, that brew is still bubbling. President Donald Trump’s approval rating has rebounded but going forward it faces challenges from negative headlines (Chart 1). These include a soaring trade deficit, a large influx of illegal immigrants on the southern border, a weak jobs report for February, a setback in North Korean diplomacy, and an intensification of the scandals plaguing Trump’s inner circle. Chart 1Don't Get Comfortable Just Yet, Mr. President
Don't Get Comfortable Just Yet, Mr. President
Don't Get Comfortable Just Yet, Mr. President
Each of these issues calls into question the effectiveness of Trump’s core policies and the stability of his administration, though in reality they are only potentially problematic. While Special Counsel Robert Mueller’s forthcoming report poses a tail risk, the substantial threat remains Trump’s trade policy. Indeed, investors face “the persistence of uncertainties related to geopolitical factors” and the “threat of protectionism,” according to European Central Bank President Mario Draghi, who spoke as he rolled out a new round of monetary stimulus for Europe and its ailing banks. What did Draghi have in mind? The obvious culprits are the U.S.-China trade talks, the U.S. threat of tariffs on auto imports, and Brexit. There were other issues – such as “vulnerabilities in emerging markets” – but the first three are the most likely to have turned Draghi’s head. The global economic outlook is likely to improve on the back of Chinese stimulus and policy adjustments by the ECB and Federal Reserve. But growth has not yet stabilized and financial markets face additional volatility due to the fact that none of these “geopolitical factors” is going to be resolved easily. The good news is that Trump, overseeing a precarious economy ahead of an election, has an incentive to play softball rather than hardball. Mueller’s Smoking Gun? News reports suggest that Mueller will soon issue the final report of his investigation into President Trump’s election campaign links with Russia. There is really only one way in which the Mueller report could be market relevant: it could produce smoking-gun evidence that results in non-trivial impeachment proceedings. Any scandal big enough to remove Trump from office or clearly damage his reelection chances is significant because financial markets would dislike the extreme policy discontinuity (Chart 2). Anything short of this will be a red herring for markets, though admittedly many of our clients disagree.
Chart 2
Very little is known about what Mueller will report and how he will interpret his mandate. Mueller’s investigation may or may not make it to the public in full form, at least initially, and he may or may not make any major additional indictments. Congress will strive to get access to the report, which is internal to the Justice Department, while spin-off investigations will proliferate among lower-level federal district attorneys and congressional committees. The legal battle, writ large, will run into the 2020 election and beyond. House Democrats alone can decide whether to bring articles of impeachment against Trump, but the case would be struck down in the Senate if it did not rest on ironclad evidence of wrongdoing that implicated Trump personally. Republican Senators will not jump ship easily – especially not 18 of them. That would require a sea change in grassroots support for Trump. Trump’s approval among Republicans remains the indicator to watch, and it is still strong (Chart 3). If this number crashes in the aftermath of the Mueller report, then Trump could find himself on a Nixonian trajectory, implying higher odds of a Senate conviction (Chart 4). At that point, markets would begin discounting a Democratic sweep in 2020, with business sentiment and risk assets likely to drop at the prospect of higher taxes and increased regulation (Chart 5).
Chart 3
Chart 4
Chart 5A 2020 Democratic Sweep Would Dent Business Sentiment
A 2020 Democratic Sweep Would Dent Business Sentiment
A 2020 Democratic Sweep Would Dent Business Sentiment
After all, if scandals remove Trump from office, then not only is a Democrat likely to win the White House, but any Democrat is likely to win – even a non-centrist like Bernie Sanders or other Democratic candidates like Kamala Harris who have swung hard to the left. Meanwhile, the odds of Democrats taking control of the Senate (while keeping the House) will rise. With Democratic candidates flirting with democratic socialism and proposing a range of left-wing policies, the prospect of full Democratic control of the legislative and executive branches would weigh on financial markets. We doubt that the Mueller report can fall short of a smoking gun while still dealing a fatal blow to Trump. The Democrats control the House, so if the scandal grows to gigantic proportions, they will impeach. Yet if they impeach without an ironclad case, Trump will be acquitted. And if Trump is acquitted, it is hard to see how his chances of reelection would fall. The impeachment of former President Bill Clinton looms large over Democrats, since it ended up boosting his popularity. If Democrats are overzealous to no end, it will help Trump’s campaign. If Trump should then win re-election, he will have veto power and likely a GOP Senate, so his policies will remain in place. The outcome for markets would be policy continuity, though the market-positive aspects of Trump’s first term may not be improved while the market-negative aspects, such as his trade policy and foreign policy, may reboot. Mueller is an all-or-nothing prospect: he either leads us to the equivalent of the Watergate Tapes or not. Lesser crimes are unlikely to have a decisive impact on the election. But volatility is likely to go up as the report comes due, just as it did during the Lewinsky scandal (Chart 6), at least until the dust settles and there is clarity on impeachment. And an equity sell-off at dramatic points in the saga cannot be ruled out, especially if global factors combine with actual impeachment (Chart 7). Chart 6Impeachment Proceedings Likely To Raise Vol...
Impeachment Proceedings Likely To Raise Vol...
Impeachment Proceedings Likely To Raise Vol...
Chart 7… And Potentially Dampen Returns
...And Potentially Dampen Returns
...And Potentially Dampen Returns
Bottom Line: A specific, shocking revelation from the Mueller report could have a negative impact on equity markets and risk assets, but any such moves would be temporary as long as the growth and earnings backdrop remain positive and Mueller does not drop a bombshell that increases Trump’s chances of removal from office. Separating The Budget From The Border The president faces adverse developments on the southern border after having initiated a controversial national emergency in order to transfer military funds to construct new barriers. The U.S. has seen an abnormally large increase in apprehensions and attempted entries this year (Charts 8A & 8B). Ultimately the influx calls attention to the porous southern border and as such may help to justify Trump’s policy focus. For now it raises the question of why the administration’s tough tactics are failing to deter immigrants. Meanwhile his emergency declaration has divided the Republican Party, with several members likely to join with Democrats in a resolution of disapproval that Trump will veto.
Chart 8
Chart 8
Congress will not be able to override the veto, but Trump’s decree also faces challenges in the judicial system. We doubt that the Supreme Court will rule against him but it certainly is possible. The ruling is highly likely to come before the election. Meanwhile Trump is kicking off the FY2020 budget battle with his newest request of $8.6 billion for the border wall and cuts to a range of discretionary non-defense spending. The presidential budget is a fiction – it is based on unrealistic cuts to a range of government programs. Any budget that is passed will bear no relation to the administration’s proposals. Opinion polls referenced above clearly demonstrate that Trump’s approval rating suffered from the recent government shutdown. This does not mean that he will conclude the next budget battle by the initial deadline of October 1 or that a late-2019 shutdown is impossible. He might accept a short shutdown to try to secure defense spending that would arguably legitimize his repurposing of military funds for border construction. But his experience early this year means that the odds of another long-running, bruising shutdown are low. Might Trump refuse to raise the debt ceiling later this year to get his way on the wall? This is even less likely than a shutdown due to the negative impact that a debt ceiling constraint would have on social security recipients and bond markets. Trump also has the most to lose if the 2011 budget caps snap back into place in 2020 due to any failure of the FY2020 negotiations (Chart 9). As such, the debt ceiling – which the Treasury Department can keep at bay until the end of the fiscal year in October – and the 2020 budget may be resolved together this time around.
Chart 9
In short, Trump will be forced to punt on congressional funding for the wall later this year and will have to campaign on it again in November 2020, with the slogan “Finish the Wall.” This is a market-positive outcome, as the hurdles to fiscal spending in 2020 are likely to be reduced: Trump will have to concede to some Democratic priorities and abandon his proposed cuts. The Democrats, for their part, are likely to have enough moderates to get the next budget over the line with Republican support. To illustrate, Republicans only need 21 votes for a majority, while no fewer than 26 Democrats were recently chastised by House Speaker Nancy Pelosi for cooperating with Republicans. The implication is that a bipartisan majority can be found. Since Trump cannot get his budget cuts, and does not really even want them, the projected contraction of the budget deficit in 2020 will be reduced or erased (Chart 10). On the margin, this would support higher inflation and bond yields.
Chart 10
The biggest threat to Trump’s reelection is still the risk that the long business cycle will expire by November next year. However, the exceedingly low February payrolls print was misleading – the unemployment rate fell and wage growth was firm (Chart 11). American households are in relatively good shape and that bodes well for Trump, for the time being. Chart 11American Households Are In Good Shape
American Households Are In Good Shape
American Households Are In Good Shape
Bottom Line: The economy is relatively well supported and Trump and the Democrats are ultimately likely to cooperate on the budget under the table, reducing the risks of a debt ceiling breach, or an extended government shutdown later this year, or a fall off the 2020 stimulus cliff. The Trade Deficit: Trump’s Pivot To Europe Trade policy is where Trump’s challenges merge with Draghi’s woes. The U.S. trade deficit lurched upwards to a ten-year high of $621 billion in 2018 (Chart 12). The trade deficit is uniquely important to Trump because he campaigned on an unorthodox protectionist agenda in order to reduce it. It will be very difficult for him to evade the consequences if the deficit is higher, as a share of GDP, in November 2020 than it was in January 2017. Chart 12Trade Deficit Jump Is A Blow To Trump
Trade Deficit Jump Is A Blow To Trump
Trade Deficit Jump Is A Blow To Trump
The underlying cause of the rising deficit is that a growing American economy at full employment with a relatively strong dollar will suck in larger quantities of imports. This effect is overriding any that Trump’s tariffs have had in discouraging imports. Meanwhile the global slowdown, reinforced by trade retaliation and negative sentiment, are harming U.S. exports (Chart 13). The administration’s policies of fiscal stimulus combined with encouraging private investment are guaranteed to lead to a higher current account deficit, barring an offsetting (and highly unlikely) rise in private saving. The current account deficit must equal the gap between domestic saving and investment and a rising fiscal deficit represents a drop in saving. Chart 13Trade War Hurting U.S. Exports
Trade War Hurting U.S. Exports
Trade War Hurting U.S. Exports
What does the trade deficit imply for the U.S.-China talks? On one hand, the U.S. could put more pressure on China after feeling political heat from the large deficit. On the other hand, China has always offered to reduce the bilateral trade deficit directly through bulk purchases of goods, particularly commodities. It is Trump’s top negotiator, Robert Lighthizer, who has insisted that China make structural changes to reduce trade imbalances on a long-term and sustainable basis.1 In a sign of progress, the U.S. and China have reportedly arrived at a currency agreement. No details are known and therefore it is impossible to say if it would mean a more “market-oriented” renminbi, which could fluctuate and have a variable impact on the trade deficit, or a renminbi that is managed to be stronger against the dollar, which would tend to weigh on the deficit, as Trump might wish. The two negotiating teams are working on the text of five other structural issues that should also mitigate the deficit. Moreover, China’s new foreign investment law, if enforced, could increase American market access by leveling the playing field for foreign firms. However, there is still no monitoring mechanism, the two presidents have not scheduled a final signing summit, and the deterioration in North Korean peace talks also works against any quick conclusion. If Trump concludes a deal, the next question for investors is whether he will impose Section 232 tariffs on auto and auto imports on the EU and other partners (Chart 14).
Chart 14
The European Commission’s top trade negotiator, Cecilia Malmstrom, recently met with Lighthizer in Washington to discourage tariffs. She refused to admit agriculture into the negotiations, as per a U.S.-EU joint statement in July 2018, but proposed equalizing tariffs on industrial goods as a way for both sides to make a positive start (Chart 15). She said that the U.S. repealing the Section 232 steel and aluminum tariffs are necessary for any final deal. And she reiterated that any new tariffs (e.g., the proposed Section 232 tariffs on autos and auto parts) would prevent a deal and provoke immediate retaliation on $23 billion worth of American exports.
Chart 15
Malmstrom also said that the EU would prefer to work with the U.S. on reforming the World Trade Organization and addressing China’s trade violations. This approach fits with that of Japan, which has joined the U.S. and EU in trilateral discussions toward reforming the global trade architecture in a bid to mitigate U.S. protectionism and constrain China. The problem with the EU’s position is that once the U.S. and China make a trade deal, the U.S. will not have as immediate of a need to form a trade coalition against China (other than in dealing with WTO issues). Moreover, Japan will be forced to accept a deal with the U.S. in short order. A rotation of Trump trade policy to focus on Europe is likely. We give 35% odds to tariffs on autos and auto parts. The USMCA will increase the cost of production in North America while Europe is so far excluding cars from negotiations with the U.S., so there is room for a clash. But any tariffs on autos will be less sweeping than those against China. Trump will play softball rather than hardball for the following reasons: The public is less skeptical of trade with Europe and Japan than with China. The auto sector is heavily concentrated in the Red States and many states that are heavily exposed to trade with the EU are also critical to Trump’s reelection (Map 1).
Chart
Section 232 tariffs that are required to be enacted by May 18 would have plenty of time to impact the U.S. economy negatively by November 2020. Congress and the defense establishment are against a trade war with U.S. allies, while bipartisanship reigns when it comes to tougher actions toward China. The bilateral trade deficit is less excessive with Europe than with China (see Chart 12 above). The U.S. carmaker and auto parts lobby are unanimously against the tariffs – and in fact has called for the removal of the steel and aluminum tariffs in a stance that echoes that of the EU. The existing steel and aluminum tariffs provide Trump with leverage in the negotiations with the EU and Japan, whereas the U.S. has agreed not to impose new tariffs on these partners while trade negotiations are underway. New tariffs would nix negotiations and ensure that the ensuing quarrels are long and drawn out, with a necessarily worse economic impact. To initiate a new trade war in the wake of the U.S.-China war would be to undercut the positive impact on trade, financial conditions, and sentiment that is supposedly driving Trump’s desire for a China deal in the first place. The U.S. eventually will need to build a trilateral coalition to hold China to account and ensure that it does not slide back into its past mercantilist practices. Even limited or pinprick tariffs will have an adverse impact on equity markets, given that they will hit Europe at a time when its economy is decelerating dangerously and when Brexit uncertainty is already weighing on European assets and sentiment (see next section). This may be why both the U.K. and Germany have recently softened their positions on Chinese telecom company Huawei, which they have been investigating for national security concerns related to the rollout of 5G networks. They are signaling that they are not going to sacrifice their relationship with China if the U.S. is dealing with China bilaterally while threatening to turn around and slap tariffs on their auto exports. If the U.S. goes ahead with tariffs – on the basis that its China agreement allows it to isolate Europe – the EU will not be a pushover, as exports to the U.S. only amount to 2.6% of GDP (Chart 16). The result of the U.S.-China quarrel has been a deepening EU-China trade relationship and that trend is set to continue (Chart 17), especially if the U.S. continues to use punitive measures that increase the substitution effect and the strategic value of the Chinese and European markets to each other. Chart 16The EU Will Not Be A Pushover In Face Of U.S. Tariffs
The EU Will Not Be a Pushover In Face Of U.S. Tariffs
The EU Will Not Be a Pushover In Face Of U.S. Tariffs
Chart 17EU-China Trade Relationship Deepening
EU-China Trade Relationship Deepening
EU-China Trade Relationship Deepening
Bottom Line: In the wake of any U.S.-China agreement, we give a 35% chance that Trump will impose tariffs on European cars and car parts. Such tariffs are not our base case because they are unlikely to shrink the U.S. trade deficit and would have a negative impact on the Red State economy. But lower magnitude tariffs cannot be ruled out – and the impact on the euro and European industrial sector would clearly be detrimental in the short run. Assuming that global and European growth is recovering, a tariff shock to Europe’s carmakers could present a good opportunity to buy on the dip. Any U.S.-EU trade war will ultimately be shorter-lived and less disruptive than the U.S.-China trade war, which is likely to resume at some point even if Presidents Trump and Xi get a deal this year. The United Kingdom: Snap Election More Likely A series of important votes is taking place in Westminster this week, with the end result likely to be an extension to negotiations over a withdrawal deal at the EU Council summit on March 21. Conditional on that extension, the odds of a new election are sharply rising. The first vote, as we go to press on Tuesday, has resulted in a rejection of Prime Minister Theresa May’s exit plan by 149 votes – the second rejection after her colossal defeat in January by 230 votes. The loss was expected because the EU has not offered a substantial compromise on the contentious Irish “backstop” arrangement, which would keep Northern Ireland and/or the U.K. in the European Customs Union beyond the transition date of December 31, 2020. All that was offered was an exit clause for the U.K. sans Northern Ireland. But Northern Ireland is part of the U.K. and the introduction of additional border checks on the Irish Sea would mark a new division within the constitutional fabric. This is unacceptable to the Conservative Party and especially to the Democratic Union Party of Northern Ireland, which gives May her majority in parliament. On Wednesday, we expect the vote for a “no deal” exit, in which the U.K. simply leaves the EU without any arrangements as to the withdrawal (or future relationship), to fail by an even larger margin than May’s plan. Leaving without a deal would cause a negative economic shock due to the automatic reversion to relatively high WTO tariff levels with the EU, which receives 46% of the U.K.’s exports and is thus vital in the maintenance of its trade balance and terms of trade (Chart 18). It is impossible to see parliament voting in favor of such an outcome – parliament was never the driving force behind Brexit, with most MPs preferring to remain in the EU. Chart 18No Deal Brexit A Huge Blow To U.K.
No Deal Brexit Huge Blow To U.K.
No Deal Brexit Huge Blow To U.K.
The risk is that parliament should fail repeatedly to pass the third vote this week, a motion asking the EU for an extension period to the March 29 “exit day.” This is unlikely but possible. In this case, the supreme decision-making body of the U.K. will be paralyzed. A bloodbath will ensue in which the country will either see Prime Minister May ousted, a snap election called, or both. If the extension passes, the EU Council is likely to go along with the decision. It is in the EU’s near-term economic interest not to trigger a crash Brexit and in its long-term interest to delay Brexit until the U.K. public decides they would rather stay after all. The problem is that it will not want to grant an extension for longer than July, when new Members of the European Parliament take their seats after the May 23-26 EU elections. The U.K. may be forced to put up candidates for the election. What good would an extension do anyway? The likeliest possibility is, yet again, a new election. The conditions are not yet ripe for a second referendum, though the odds are rising that one will eventually occur. The Labour Party has fallen in the opinion polls amidst Jeremy Corbyn’s indecisive leadership and a divisive platform change within the party to push for a second Brexit referendum (Chart 19). An election now gives May’s Conservatives an opportunity to build a larger and stronger majority – after all, in the U.K. electoral system, the winner takes all in each constituency, so the Tories would pick up most of the seats that Labour loses. May’s faction might be able to strengthen its hand vis-à-vis hard Brexiters who have less popular support yet currently have the numbers to block May’s withdrawal plan. Chart 19A New Election Would Be Opportunistic
A New Election Would Be Opportunistic
A New Election Would Be Opportunistic
Theresa May might be unwilling to call an election given her fateful mistake of calling the snap election of 2017. If she demurs, she could face an internal party coup. There is a slim chance that a hard Brexiter could take the helm, bent on steering the U.K. out of the EU without a deal. Parliament, however, would rebel against such a leader. Ultimately, the economic and financial constraints of a crash Brexit are too hard and we expect that the votes will reflect this fact, whether in an adjusted exit deal or a new election. But both outcomes require an extension. However, we must point out that the constitutional and geopolitical constraints alone are not sufficient to prevent a crash out: parliament is the supreme lawmaking authority and there is no other basis for the U.K. to leave in an orderly fashion. The United Kingdom has survived worse, as many hard Brexiters will emphasize. A crash is a mistake that can happen. But the odds are not higher than 10%-20% given the stakes (Diagram 1). Diagram 1The Path To Salvation Remains Fraught With Dangers
The Witches’ Brew Keeps Bubbling…
The Witches’ Brew Keeps Bubbling…
With the EU economy not having stabilized and the U.S. contemplating Section 232 trade tariffs, Brexit is all the more reason to be wary of sterling, the euro, and European equities in the near term, especially relative to the U.S. dollar and U.S. equities. Gilts can rally even in the event of an extension given the uncertainty that this would entail, though the BCA House View is neutral. Bottom Line: Expect parliament to ask for an extension. At the same time, the odds of a new election have risen sharply. The absence of a new election could lead to a power struggle within the Tory party that could escalate the risk of a hard Brexit, though we still place the odds at 10%. A second referendum is rising in probability but will only become possible after the dust settles from the current crisis. Investment Conclusions The ECB’s stimulus measures are positive for European and global growth over a 6-to-12-month time frame. They suggest that financial assets could be supported later in the year, depending in great part on what happens in China. China’s combined January and February total social financing growth reinforces our Feb 20 report arguing that the risk of stimulus is now to the upside. As People’s Bank Governor Yi Gang put it, the slowdown in total social financing last year has stopped. The annual meeting of the National People’s Congress also resulted in largely accommodative measures on top of this credit increase. Nevertheless, stimulus operates with a lag, and for the reasons outlined above we are not yet willing to favor EUR/USD or European equities within developed markets. A 35% chance of tariffs is non-negligible. We expect U.S. equities to outperform within the developed world and Chinese equities to outperform within the emerging world on a 6-to-12 month basis. Matt Gertken, Vice President Geopolitical Strategy mattg@bcaresearch.com Marko Papic, Senior Vice President Chief Geopolitical Strategist marko@bcaresearch.com Footnotes 1 Lighthizer now has bipartisan support in Congress, whose members will lambast Trump if he squanders the historic leverage he has built up in exchange for a shallow deal that only temporarily weighs on the trade deficit.
Highlights Many on the left have embraced Modern Monetary Theory because it seemingly provides a politically expedient way to increase social welfare spending without raising taxes. Money-financed budget deficits can be justified when an economy is stuck in a liquidity trap, but can be extremely inflationary once full employment is reached. Investors should regard MMT as simply an extreme example of the increasingly permissive attitude that policymakers are adopting towards inflation and larger budget deficits. The path to high rates is lined with low rates, meaning that an extended period of accommodative monetary policy is usually necessary to stoke inflation. Investors should maintain a bullish bias towards global equities for now, but be prepared to turn bearish late next year as inflation begins to accelerate in the United States. An earlier turn to a more defensive posture on stocks may be necessary if Bernie Sanders, or some other far-left candidate, emerges as the likely victor in the next presidential election. Feature Print Some Money And Feel The Bern You know that an economic theory has reached the big leagues of policy debate when the Fed Chair is asked about it during his congressional testimony. This is exactly what happened on February 26, 2019, when Senator David Perdue questioned Jay Powell about his views on Modern Monetary Theory, or simply MMT as it is often called. Rather ironically given its name, MMT plays down the influence of monetary policy over the economy. Its adherents argue that Congress, and not the Fed, should be responsible for maintaining full employment. MMT proponents abhor the idea of a “balanced budget.” They contend that worries about sovereign debt levels are overblown. The U.S. government can always print money to finance itself. Fiscal deficits matter, but only to the extent that excessive deficits can cause inflation. The theory’s backers are a bit cagey about exactly how much inflation they are willing to tolerate or what they would do if, as in the 1970s, inflation and unemployment both rose together. Whether one thinks MMT is crackpot economics is not the point. What matters is that its supporters are growing in number. They include Stephanie Kelton, Bernie Sanders’ former economic advisor, and one of the speakers at BCA’s forthcoming annual New York Investment Conference. In my personal opinion, Sanders stands a very good chance of winning the 2020 presidential election. This makes MMT about as market-relevant as anything out there. In the following Q&A, we discuss the details of MMT and what it means for investors: Q: How does Modern Monetary Theory differ from standard Keynesian economics? A: MMT is almost indistinguishable from Keynesian economics when an economy is stuck in a liquidity trap, an environment where even interest rates of zero are not enough to revive demand. What really separates the two schools of thought is that MMT proponents tend to see liquidity trap conditions as the normal state of affairs, whereas most Keynesians see them as the exception to the rule. Q: Who’s right? The Keynesians or the MMTers? A: That remains to be seen. Near-zero rates have been the norm for most of the last decade, and much longer in Japan. This is a key reason why MMT has grown in popularity. The future may be different, however. Output gaps are shrinking and some of the structural forces which have held down rates over the last decade may fade. For example, the ratio of workers-to-consumers has peaked around the world, which may result in a decline in global savings (Chart 1). This could push up interest rates. Chart 1The Worker-To-Consumer Ratio Has Peaked Globally
The Worker-To-Consumer Ratio Has Peaked Globally
The Worker-To-Consumer Ratio Has Peaked Globally
Q: Does the tendency of MMT backers to see the world as chronically ensnarled in a liquidity trap explain why they seem to consistently argue for bigger budget deficits? A: It does. If an economy needs negative interest rates to reach full employment, but actual rates are constrained by the zero-lower bound, anything which incrementally adds to aggregate demand will not result in higher rates. This means that increased government spending will not crowd out private investment – indeed, quite to the contrary, bigger budget deficits will “crowd in” private spending by boosting employment. The standard MMT prescription is to run a budget deficit that is large enough, but no larger, to maintain full employment. In effect, this means taking any excess private-sector savings – that is, savings which cannot be transformed into private investment or exported abroad via a current account surplus – and having the government absorb them with its own dissavings. Q: So MMT supporters are assuming that the government is competent and agile enough to tighten and loosen fiscal policy at exactly the right time? Good luck with that. A: Yes, that is a common problem with most left-wing theories: They assume that the government should not be trusted with anything unless it is run by fellow leftists, in which case it should be trusted with everything. To make the fiscal response timelier, MMT supporters have proposed creating a government job guarantee. The basic idea is that the government would hire more workers when the private sector is hunkering down, while shedding workers when the private sector is expanding. In theory, automatic fiscal stabilizers of this sort could help dampen the business cycle. The consensus among MMT backers in the U.S. is that a $15 wage would be high enough to offer a tolerable standard of living without enticing many people to opt for government work when suitable private-sector employment is available. MMT supporters are assuming that the government is competent and agile enough to tighten and loosen fiscal policy at exactly the right time. Unfortunately, as is often the case with such ideas, the devil is in the details. For example, does the $15 wage include potentially generous government benefits? What will the government do if someone shows up for work but decides to just loaf around? What about low-skilled workers who would be more productive in the private sector but are instead diverted into government make-work projects? Inquiring minds want to know. Q: And the price tag could be huge! Wouldn’t an extended period of large budget deficits – even if justified by economic circumstances – cause debt levels to spiral out of control? A: A prolonged period of large budget deficits would most certainly lead to a significant increase in the government debt burden. However, if the interest rate on government borrowing is lower than the growth rate of the economy, as MMT supporters tend to assume, the debt-to-GDP ratio will eventually stabilize.1 In such a setting, the government could just roll over the existing stock of debt indefinitely, while issuing enough new debt to cover interest payments. No additional taxes would be necessary. Chart 2 shows this point analytically.
Chart 2
Right now, projected GDP growth is higher than 10-year government borrowing rates for most countries (Chart 3). That’s the good news. The bad news is that there is no guarantee that this will remain the case indefinitely. If interest rates ever rose above GDP growth for an extended period of time, debt dynamics would quickly become unsustainable. MMTers argue that the government can borrow at any rate it wants because they see the currency as a public monopoly.
Chart 3
Q: Isn’t it crazy to assume that interest rates will always stay below GDP growth? A: Not according to MMTers. They argue that the government can borrow at any rate it wants. This is because they see the currency as a public monopoly. As long as a government is able to issue its own currency, it can create money to pay for whatever it purchases, and by definition, money pays no interest. This means that the interest rate can always be held below the growth rate of the economy. The only reason policymakers may wish to raise interest rates is if inflation is getting out of hand. However, even then, most MMT adherents would prefer that the government tighten fiscal policy either by hiking taxes on the rich or cutting spending programs they don’t like (the military is usually high on their list). Raising rates is widely seen by MMT supporters as simply providing a handout to bondholders. Q: It sounds like MMT basically cuts the Fed and other central banks out of the loop. A: That’s right. MMTers contend that monetary policy has little impact on the economy. In fact, many MMT advocates believe that higher rates raise aggregate demand by putting more income into bondholders’ pockets. It’s a very odd argument. Yes, corporate investment tends to respond more to animal spirits than to changes in interest rates. However, there is little doubt that rates affect housing, the currency, and asset prices (and all three, in turn, affect animal spirits). It is almost as if the 1982 recession – an episode where the Volcker Fed took interest rates to 19% – never happened. Q: An odd argument, but perhaps not a surprising one? A: That’s where the “Magic Money Tree” moniker comes in. When an economy is suffering from high unemployment, there really is a free lunch: Putting more people to work can increase someone’s spending without decreasing someone else’s. However, when an economy is at full employment, scarcity becomes relevant again. If a government wants to spend more, it has to convince the private sector to spend less, which it normally does by raising interest rates. MMTers like to throw out the old chestnut about how budget deficits endow the private sector with financial assets such as cash or government bonds. But if additional government spending leads to higher inflation, an increase in the volume of financial assets will simply result in the erosion of the value of existing financial assets. There may be times when more government spending is beneficial even in a full-employment economy, such as funding for basic scientific research or public infrastructure. However, there may also be times when increased government spending is wasteful and comes at the expense of valuable private-sector investment. MMT does not distinguish between the two cases because its adherents seem to deny that any such trade-off exists. Q: It sounds like MMTers want to have their cake and eat it too. A: Exactly. The political appeal of MMT is that it seemingly promises European-style welfare spending without Europe’s level of taxes. Just print more money! Let us ignore the fact that the Fed actually pays interest on bank reserves. Under the current rules, increasing the monetary base would not be costless for the government if that money ended up back at the Fed in the form of excess reserves, as it surely would. The bigger problem is that a large increase in government spending, which is not matched by much higher taxes, will quickly cause the economy to overheat. At that point, policymakers would either need to rapidly tighten fiscal policy, aggressively hike interest rates, or face hyperinflation and a plunging currency. Q: That seems like an obvious point. Why don’t MMTers see it? A: It gets back to what we discussed at the outset – MMTers regard the world as being chronically stuck in a liquidity trap. The prevailing view among MMTers is that there is still a lot of spare capacity globally, including in the United States, where the unemployment rate has fallen below official estimates of NAIRU (the Non-Accelerating Inflation Rate of Unemployment). MMT supporters tend to be skeptical of these NAIRU estimates, believing them to be biased upwards. MMTers see the world as being chronically stuck in a liquidity trap. The prevailing view among MMTers is that there is still a lot of spare capacity in the world. To be fair, the methodology used by the OECD and many other statistical agencies to calculate the full employment rate, which effectively just smooths out past values of the actual unemployment rate, has probably understated the degree of labor market slack in a few countries (Chart 4). Chart 4AThe Unemployment Rate Versus NAIRU (I)
The Unemployment Rate Versus NAIRU (I)
The Unemployment Rate Versus NAIRU (I)
Chart 4BThe Unemployment Rate Versus NAIRU (II)
The Unemployment Rate Versus NAIRU (II)
The Unemployment Rate Versus NAIRU (II)
That said, we doubt that NAIRU is overstated in the United States. Both the Fed and the OECD peg NAIRU at 4.3%, slightly below the CBO’s estimate of 4.6%. As it is, the current CBO estimate is nearly one percentage point below the post-1960 average (Chart 5). Back in the 1960s and 1970s, most economists thought NAIRU was lower than it actually turned out to be (Chart 6). This caused the Fed to keep rates below where they should have been. Chart 5U.S. NAIRU Is Estimated To Be The Lowest On Record
U.S. NAIRU Is Estimated To Be The Lowest On Record
U.S. NAIRU Is Estimated To Be The Lowest On Record
Chart 6The Fed Continuously Overstated The Magnitude Of Economic Slack In The 1970s
The Fed Continuously Overstated The Magnitude Of Economic Slack In The 1970s
The Fed Continuously Overstated The Magnitude Of Economic Slack In The 1970s
Q: Let’s bring this back to market strategy. What does the increasing popularity of MMT mean for investors? A: Investors should regard MMT as simply an extreme example of the increasingly permissive attitude that policymakers are adopting towards inflation. The idea that central banks should raise rates preemptively to avoid overheating is slowly giving way to the belief that they should wait to see the “whites of inflation’s eyes” before tightening monetary policy. Meanwhile, on the fiscal side, austerity is out, and big deficits are in. None of this should be all that surprising. Attitudes towards inflation move in generational cycles. The generation that grew up during the 1930s was highly sensitized towards deflation risk. As a result, policymakers focused on increasing employment, even at the expense of higher inflation. In contrast, the generation that came of age in the 1970s favored policies that clamped down on inflation. For today’s generation, the stagflation of the seventies is a distant memory. “Maximum employment” is the name of the game again. It often takes several years for an overheated economy to produce inflation. This is particularly true when the Phillips curve is quite flat, as appears to be the case today. To the extent that the Fed raises rates over the next 12 months, it will be in response to better-than-expected growth. The stock market should be able to do well in that environment. However, as we get into late-2020 or early-2021, inflation may begin to move materially higher, forcing the Fed to crank up the pace of rate hikes. At that point, equity prices will drop and a maximum short duration stance towards government bonds will be warranted. Q: Just in time for Bernie Sanders’ inauguration! You predicted Trump would win, but Crazy Bernie? Come on, seriously? A: My guess is that Trump was the only Republican candidate who could have beaten Hillary Clinton in 2016, while Clinton was the only Democratic candidate who could have lost to Trump. Had it been Bernie versus Trump, Trump would have lost. Given how close the election turned out to be, Sanders would have probably prevailed. This is not just idle speculation. During the tail end of the 2016 primary season, head-to-head polls showed Sanders leading Trump by about 10 points, compared to a 3-point lead for Clinton (Chart 7). The final results would have been more favorable for Trump, but given how close the election turned out to be, Sanders would have probably prevailed.
Chart 7
A strong economy will help Trump this time around. However, demographic trends continue to move against Republicans. Trump also made a strategic mistake during his first two years in office by focusing on Republican pet issues like corporate tax cuts and gutting Obamacare, rather than securing funding for the border wall, which was his signature campaign promise. For its part, the Democrat establishment will try to stymie Sanders again, but having recently watered down the “superdelegate” rules, it will be in a much weaker position to do so than last time. Q: Yikes, President Bernie doesn’t sound good for stocks! A: In our client conversations on “tail risks” facing the markets, Bernie Sanders almost never comes up. Admittedly, a lot can change in the next 12 months, including the possibility that Joe Biden will enter the race. Biden is more moderate than Sanders and has broad-based appeal. This means that it is still too early to make any significant changes to portfolio strategy. However, if Bernie Sanders, or some other far-left candidate, begins to do well in the polls, markets may start to get antsy later this year. Peter Berezin Chief Global Investment Strategist peterb@bcaresearch.com 1 Please see Global Investment Strategy Weekly Report, “Is There Really Too Much Government Debt In The World?” dated February 22, 2019. Strategy & Market Trends MacroQuant Model And Current Subjective Scores
Chart 8
Tactical Trades Strategic Recommendations Closed Trades
At the end of 2019, Canadian growth ground to a halt. Not only are exports hurt by the recent decline in global growth, but domestic economic activity is also reeling, as capex remains soft, households are reluctant to spend, and housing activity is in poor…
Highlights So What? The yellow vest movement has not soured our optimistic view on France – if anything, it tells us it is time to turn more bullish. Why? The constraints on Macron pursuing reforms are overstated; he has no choice but to double-down. France has multiple tailwinds: strong demographic trends, comparative advantages in exports, and an increasingly pro-business market environment. Also … The roadmap for the European Union to change structurally is set, though it will need political will to materialize. Feature “La réforme oui, la chienlit non!” Charles De Gaulle, May 1968 “France is only herself when she leads fights that are bigger than herself.” Emmanuel Macron, August 2018 “When France sneezes the rest of Europe catches cold.” Prince Clemens von Metternich, 1848 In May 2017, the election of 39-year-old Emmanuel Macron brought an end to the seemingly unstoppable tide of populist nationalism in the developed world. As it turned out, the median voter in France was not as angry as the median voter in the U.K. and the U.S. The reforms implemented since the French election have hardly made headlines outside of domestic media. The struggles of Italy, akin to la commedia dell’arte, and the jousting between London and Brussels, have drawn more attention. More recently, the yellow vest protests have reaffirmed the usual stereotypes about France. Behind the headlines, however, one cannot ignore the market relevance of what is happening in France. Thought to be condemned to stagnation by the rigidity of its labor market and the size of its state, the country is now looking to undo the malaise of the past two decades. The only surprise about the protests is that they did not occur sooner in Macron’s term. In this Special Report, we assess the ongoing yellow vest protests, review the reforms conducted since 2017, and give Macron favorable chances of reforming France further. We also highlight structural tailwinds that will support the French economy in the long run. Finally, we briefly go over the European Union’s roadmap for reforms. How Relevant Are The Yellow Vest Protests? Where there are reforms, there are protests. Or, as an astute client once told us: Buy when blood is in the streets. Had there been no protest against President Macron’s reforms, it would have signaled they lacked teeth. Protests were inevitable as soon as Macron set in motion his ambitious pro-growth and pro-business reform agenda. The yellow vest movement is not a coherent force led by a clear leadership. The demands of the group are many: lower taxes, better services, less of the current reforms (specifically in education), and more of other reforms. But despite this lack of clarity, the protesters have convinced most of the public that the reform agenda should pause, or at least slow down (Chart 1).
Chart 1
What started on social media as a protest against the fuel tax in rural areas has evolved into a movement against President Macron. This transition occurred in part because a large segment of the population believes that Macron’s reforms have mainly benefited the wealthy. In fact, 77% of respondents in a recent poll view him as the “president of the rich.” The modification of the “wealth tax” – which mostly shifts the focus toward real estate assets instead of financial assets – was highly criticized for favoring the wealthiest households. It resonated strongly with the perception that past governments helped the wealthiest households to accumulate more wealth at the expense of the middle class. But it is not clear how intense or durable this popular sentiment will be, given that this type of inequality is not extreme in France and has not been rising (Chart 2). Chart 2What Income Inequality?
What Income Inequality?
What Income Inequality?
Public support for the protests has hovered around 70% for several weeks since they started in November 2018, but is now coming down (Chart 3). There are now more respondents who think that the protests should stop than those who believe they should continue (Chart 4). As a sign of things to come, a demonstration against the yellow vests and in support of Macron and his government – held by the “red scarves” – managed to gather more people on the streets of Paris than the regionally based yellow vests have done in the capital city.1
Chart 3
Chart 4
Who are the yellow vests? The profile is shown in Diagram 1. They are mostly rural, mostly hold a high school degree (or less), and overwhelmingly support anti-establishment political leaders Marine Le Pen (right-wing leader of the National Rally) or Jean-Luc Mélenchon (left-wing leader of La France Insoumise). This suggests that the movement has failed to cross the ideological aisle and win converts from the center. Diagram 1The Profile Of A 'Yellow Vest' Protester
France: La Marche A Suivre?
France: La Marche A Suivre?
How many French people are actually protesting? Although there was a slight pickup in protests at the beginning of January, nationwide numbers are not high. In fact, they are far from what they were back in November and therefore would have to get much larger for markets to become concerned anew (Chart 5). If we are to compare these protests to those in 1995 or 2010, the numbers pale in comparison (Table 1). For instance, the protest of December 1995 brought a million people onto the streets while the demonstrations against the Woerth pension reform in 2010 lasted for seven months and gathered close to nine million protesters across eight different events (Chart 6).
Chart 5
Table 1In A Glorious History Of Protests, 'Yellow Vests' Are A Footnote
France: La Marche A Suivre?
France: La Marche A Suivre?
Chart 6
Instead we would compare the yellow vest protests to the 15-month long Spanish Indignados in 2011, which gathered between six and eight million protesters overall, and the U.S. Occupy Wall Street protests that same year. The two movements were similarly disorganized and combined disparate and often contradictory demands. In both cases, the governments largely ignored the protesters. In the Spanish case, the right-of-center government of Mariano Rajoy plowed ahead with painful, pro-market reforms that have significantly improved Spain’s competitiveness. Thus the yellow vests should not have a major impact on Macron’s reform agenda. Although they have dragged his approval rating to historic lows (Chart 7), there is no constitutional procedure for the French president to lose power. The president’s mandate runs until 2022 and he has a solid 53% of the seats in the Assemblée Nationale. In other words, despite the consensus view – including among voters (Chart 8) – that he will not be able to implement the reforms he had planned, he still has the political power to push forward new initiatives. Chart 7...Although Macron Wishes He Was Sarkozy!
...Although Macron Wishes He Was Sarkozy!
...Although Macron Wishes He Was Sarkozy!
Chart 8
Nevertheless, Macron will certainly have to adjust course to calm the protesters. For example, the recent increase in the minimum wage that the government announced in response to the demonstrations was not supposed to be implemented until later in the presidential term. The reforms brought forward in response to the protest are highlighted in Table 2. This should help reduce the movement’s fervor or otherwise its support. Table 2Macron’s Reforms: The Scorecard
France: La Marche A Suivre?
France: La Marche A Suivre?
More importantly, Table 2 provides a list of the main reforms that have been implemented, proposed, or are yet to be completed since the election. The pace and breadth of these reforms come close to a revolution by the standards of the past forty years.2 What really matters is how these reforms tackle the following three key issues: the size of the state, the cost of financing such a large state, and the inflexible labor market. Macron is making progress on the latter two. Labor reforms, effective since the beginning of 2018, simplify a complex labor code to allow for more negotiations at the company level, leaving unions outside the process. They also establish ceilings on damages awarded by labor courts, which represent a real burden on small and medium-sized French companies. The objective is to better align firm-level wage and productivity developments and encourage hiring on open-ended contracts. Education and vocational reforms aim at reducing the slack in the economy by reallocating skills. The youth unemployment rate, and the percentage of the youth population not in education, employment, or training, are both high (Chart 9). This is very relevant for the labor market given that the lack of skilled labor is the most important barrier to hiring (Chart 10), more so than regulation or employment costs. Chart 9Stagnant Youth Employment Figures...
Stagnant Youth Employment Figures...
Stagnant Youth Employment Figures...
Chart 10...Are A Product Of Skill Deficiencies And Economic Uncertainty
...Are A Product Of Skill Deficiencies And Economic Uncertainty
...Are A Product Of Skill Deficiencies And Economic Uncertainty
The administration’s weak spot is the large size of the state, which is undeniably at the root of the French malaise. At 55% of GDP, total government spending makes the French state the largest amongst developed economies (Chart 11). Although cutbacks have been announced, they have not materialized yet. These would include bringing the defense budget back to 2% of GDP, decreasing the number of deputies in the National Assembly by 30%, and cutting 120,000 jobs in the public sector.
Chart 11
On the bright side, polls show that the French people understand the need to pare back the state. Indeed, 71% are in favor of the announced 100 billion euro cuts in government spending by 2022. Even Marine Le Pen campaigned on the promise of cutting the size of the public sector. Despite having a relatively good opinion of government employees, the majority of respondents approve of increasing work hours and job cuts for redundant government employees (Chart 12).
Chart 12
The fundamental problem of a large public sector is that it has to be financed by taxing the private sector. This has fallen on the shoulders of businesses. However, under Macron, the corporate tax rate is set to decline progressively from 33.33% to 25% by 2022 – a cut of 8.3% in the corporate tax rate over four years (Chart 13). Chart 13Respite Coming For The Private Sector
Respite Coming For The Private Sector
Respite Coming For The Private Sector
Bottom Line: The yellow vest protests were to be expected – they are the natural consequence of Emmanuel Macron’s push to reform the French economy and state. However, when compared to previous efforts to derail government reforms, the numbers simply do not stack up. Their disunited and broad objectives are likely to limit the effectiveness of the movement going forward. The global media’s focus on the protests ignores the structural reforms that Paris has already passed. This is a mistake as the reforms have been significant thus far, though much remains to be done. What To Expect Going Forward? Macron stands in what we call the “danger zone” of the J-Curve of structural reform (Diagram 2). Cutting the size of the state might be what he needs to get out of that zone over the course of his term. Diagram 2In The Danger Zone Of The J-Curve
France: La Marche A Suivre?
France: La Marche A Suivre?
Unlike the last two presidents, Macron’s term has begun with a whirlwind. If he stops now, it is highly unlikely that he will recover his support levels. As such, there is no strategic reason why he would reverse course. His popularity is already in the doldrums. His only chance at another term is to plow ahead and campaign in 2022 on his accomplishments. He just needs to ensure that he will not plow into a rock. As expected, Macron has not made any mention of changing course on his most business-friendly reforms, which we see as a signal to investors that despite the recent chaos, the plan remains the same. Pension reforms, however, will likely be postponed given the ongoing protests. Macron hoped to introduce a universal, unified pension system by the middle of 2019 to replace an overly complex and fragmented system in which 42 different types of pension coexist, each one with its own calculation rules. Though protests (both yellow vest and otherwise) have been unimpressive by historical standards (Table 1), it might be too risky for the government to push the pension reform so close to these events. Bottom Line: Macron has turned France into one of the fastest-reforming countries in Europe. Do not read too much into the lows in approval rating and the protests. Macron has no choice but to own the reform agenda and try to campaign on it in 2022. France Is Not Hopelessly Condemned To Stagnation No country elicits investor doom and gloom like France. It is like the adage that Brazil has been turned on its head: France is the country of the past and always will be. However, we think that such pessimism ignores three important structural tailwinds. Demographics From 2015 to 2050, the age distribution will remain broadly unchanged (Chart 14). The same cannot be said of Italy or Germany, where low fertility rates and ageing populations will permanently shift the demographic picture. Indeed, France has the highest fertility rate amongst advanced economies and less than 20% of the population is older than 65 (Chart 15). And France is far from relying on net migration to keep its population growing; migration represented only 27% of total population growth between 2013 and 2017, lower than in the U.S., the U.K. and Germany even if we were to exclude the migration crisis (Chart 16).
Chart 14
Chart 15France Has Healthy Demographics…
Positive Demographic Trends
Positive Demographic Trends
Chart 16
Whenever one mentions France’s positive demographics, criticism emerges that the high fertility rate is merely the result of migrants having lots of kids. This is not entirely correct. While data is scarce due to nineteenth century laws prohibiting censuses based on race or religious belief, data from neighboring European states shows that the birth rate among migrants and citizens of migrant descent essentially declines to that of the native population by the second generation, which in France remains at the replacement level.3 Solid population growth will be a boon to the French economy. A stable dependency ratio – the ratio of working-age to very old or very young people – should limit the burden on government budgets. Further, France will avoid the downward pressure on aggregate household savings associated with an ageing population, the negative implications of a smaller pool of funds available to the private sector, and the resulting inflationary pressures. We also expect the structural rise in European elderly labor force participation to finally take effect in France. The aftermath of the Great Recession and the burden of having to provide for unemployed youth should spur French retirees to work longer. At 3.1%, France is still some way behind Germany at 7% and the average of 6% for European countries (Chart 17). Chart 17Time For Pépère To Get Back To Work
Time For Pépère To Get Back To Work
Time For Pépère To Get Back To Work
Together, these forces imply a higher long-term French potential growth. Based on demographic divergence alone, the European Commission expects French nominal GDP to overtake German nominal GDP by 2040. The French Savoir-Faire France has lost competitiveness in the global marketplace. French export performance has suffered from decades of rigidities and high unit-labor costs while some of France’s peers, such as Germany, benefited greatly from an early implementation of labor reforms (Chart 18). While pro-growth and pro-market reforms ought to reverse some of these trends, France can still rely on a manufacturing savoir-faire that gives it a strong foothold in high value-added sectors of manufacturing, such as in transportation, defense, and aeronautics. Chart 18The Hartz Reforms Gap
The Hartz Reforms Gap
The Hartz Reforms Gap
Table 3 lists the 10 largest export sectors as a share of total exports for France and Germany. These two economies share five similar categories of exports amongst their largest exports, representing respectively 23.8% and 24.3% of their total exports. However, France displays a substantially higher revealed comparative advantage (RCA) in its flagship sectors.4 In other words, the level of specialization of these sectors relative to the world average is higher in France than in Germany. Going forward, it is precisely this level of specialization in the high value-added sectors that will support the French manufacturing industry. Table 3France Vs. Germany: Closer Than You Think
France: La Marche A Suivre?
France: La Marche A Suivre?
We also view the bullish trends for defense spending and arms trade, and the burgeoning EM demand for transportation goods, as important tailwinds for French manufacturing. France is the world’s fourth-largest global defense exporter and will benefit from shifting geopolitical equilibriums caused by multipolarity. France is also well positioned in the transportation sector where its exports to EM countries represent 20% of its overall transportation exports – a share that more than doubled in the past 15 years (Chart 19). While this trend is currently declining with the end of Chinese industrialization, we expect that it will resume over the next several decades as more EM and FM economies grow. Chart 19EM: A Growth Market For France
EM: A Growth Market For France
EM: A Growth Market For France
France Is Much More Business-Friendly Than You Think A surge in the number of businesses created followed the election of the French president. Last year, more than 520,000 new businesses were created (Chart 20). Chart 20The New 'Start-Up Nation'
The New "Start-Up Nation"
The New "Start-Up Nation"
The ease of doing business has improved on various metrics and the economy-wide regulatory and market environment should continue on this trend, as measured by the OECD product market regulation indicator (Chart 21). For instance, it takes only three and a half days to set up a business in France and no more than five steps, which is much easier than in most European countries.
Chart 21
France also ranks 10th on the Global Entrepreneurship Index – a measure of the health of entrepreneurship ecosystems in 137 countries. It appears prepared for more tech start-ups as it ranks amongst the top countries on the Technological Readiness Index. Overall, France is now a much more attractive destination for investments (Chart 22). It appears that Brexit uncertainty is also driving some long-term capital investments. Between 2016 and 2017, the number of FDI projects in France jumped by 31% and Paris has become the most attractive European city for foreign direct investments (Chart 23).
Chart 22
Chart 23Paris: The City Of (Love) FDI
Paris: The City Of (Love) FDI
Paris: The City Of (Love) FDI
Cyclical View Despite the end of QE, markets do not expect the ECB to start hiking rates in the next 12 months – the expected change in ECB policy rate as discounted by the Overnight Index Swap curve is only 7 bps. This means the private sector will keep benefiting from extremely low lending rates, nearing 2%. Bank loans to the private sector will continue growing at a solid pace (Chart 24). Chart 24Banks Are Itching To Lend
Banks Are Itching To Lend
Banks Are Itching To Lend
A lower unemployment rate and accelerating wage growth are positive for both consumer spending and residential investment. Average monthly earnings have strongly rebounded in the past five quarters (Chart 25). These two trends could put a floor under deteriorating household confidence and support consumer spending (Chart 26). Should household confidence rebound, consumers might spend more and stimulate the economy given their high savings rate. Chart 25Consumers Are Primed To Consume
Consumers Are Primed To Consume
Consumers Are Primed To Consume
Chart 26But Protests Have Dented Confidence
But Protests Have Dented Confidence
But Protests Have Dented Confidence
How does this dynamic translate in economic growth? Despite the setback experienced by the euro area – due to weaker external demand, or “vulnerabilities in emerging markets” to use the European Central Bank’s (ECB) own words – and the negative economic impact of the yellow vests, French real GDP grew by 1% (annualized) in the fourth quarter. The concessions made by Macron to answer the protests will bring the budget deficit close to 3.2% of GDP – from an earlier projection of 2.8%. The fiscal thrust will contribute positively to GDP growth (Chart 27), though 2020 may witness a larger fiscal drag. Chart 27Macron Has Given Up On Austerity
Macron Has Given Up On Austerity
Macron Has Given Up On Austerity
Bottom Line: The overall fundamentals of the economy are not as bad as the pessimists say. Cyclical and structural tailwinds will support the French economy going forward and should be reinforced by reforms. Can Europe Be Set En Marche Too? Macron’s presidency offers the European Union a window of opportunity to change structurally. He is already perceived as the “default leader” of Europe and might be the answer to the EU’s desperate need for strong leadership. What we have so far looks like a roadmap for a roadmap, but some progress could materialize this year. The European Stability Mechanism (ESM) – the European instrument for economic crisis prevention – is supposed to be granted new powers. At the Euro Summit in December, the ministers agreed on the terms of reference of the common backstop to the euro zone bank resolution fund (SRF), which would allow the ESM to lend to the SRF should a crisis or number of crises suck away all its funds. It would be ready from 2024 to come up with loans for bank resolution. While this may appear to be too late to make a difference in the next recession, we would remind clients that all dates are malleable in the European context. The possibility of the ESM playing a role in a potential sovereign debt restructuring in the future, like a sort of “European IMF,” was also discussed. However, some – including the ESM’s leadership – argue that such an expanded role will necessitate a greater injection of capital, which obviously Berlin must accept. Second, the stalled Banking Union project requires Berlin’s intimate involvement. In fact, Germany remains practically the only member state against the European Deposit Insurance Scheme (EDIS). This deposit insurance union would go a long way toward stabilizing the Euro Area amid future financial crises. However, a high-level working group should report by June 2019. As such, with Merkel sidelined and Macron taking leadership of the reform process, there could be movement on the EDIS by mid-year. Bottom Line: As Merkel exits the stage, France is likely to seize the opportunity to take the leading role from the Germans. By delivering the reforms he promised during his campaign and thus performing effectively at home, Macron hopes to obtain the legitimacy to set the EU en marche as well. Some material progress could be achieved as early as June this year. Stay tuned. Jeremie Peloso, Research Analyst jeremiep@bcaresearch.com Footnotes 1 According to the government, 10,500 “red scarves” marched in Paris on January 27, 2018. 2 Sans the guillotine! 3 Rojas, Bernardi, and Schmid, “First and second births among immigrants and their descendants in Switzerland,” Demographic Research 38:11 (2018), pp. 247-286, available at https://www.demographic-research.org/Volumes/Vol38/11/Ariane Pailhé, “The convergence of second-generation immigrants’ fertility patterns in France: The role of sociocultural distance between parents’ and host country,” Demographic Research 36:45 (2017), pp. 1361-1398, available at https://www.demographic-research.org/Volumes/Vol36/45/Kulu et al., “Fertility by Birth Order among the Descendants of Immigrants in Selected European Countries,” Population And Development Review 43:1 (2017), pp. 31-60, available at https://doi.org/10.1111/padr.12037 4 A country displays a revealed comparative advantage in a given product if it exports more than its “fair” share, that is, a share that is equal to the share of total world trade that the product represents.
Austerity fatigue has set in. Trump’s big budget deficits and his “I love debt” mantra are the waves of the future. For their part, the Democrats are shifting to the left, with the “Green New Deal” proposal being the latest manifestation. The case for…
Highlights It may seem self-evident that most governments are overly indebted, but both theory and evidence suggest otherwise. Higher debt today does not require higher taxes tomorrow if the growth rate of the economy exceeds the interest rate on government bonds. Not only is that currently the case, but it has been the norm for most of history. Unlike private firms or households, governments can choose the interest rate at which they borrow, provided that they issue debt in their own currencies. Ultimately, inflation is the only constraint to how large fiscal deficits can get. Today, most governments would welcome higher inflation. There are increasing signs China is abandoning its deleveraging campaign. Fiscal policy will remain highly accommodative in the U.S. and will turn somewhat more stimulative in Europe. Remain overweight global equities/underweight bonds. We do not have a strong regional equity preference at the moment, but expect to turn more bullish on EM versus DM by the middle of this year. Feature A Fiscal Non-Problem? Debt levels in advanced economies are higher today than they were on the eve of the Global Financial Crisis. Rising private debt accounts for some of this increase, but the lion’s share has occurred in government debt (Chart 1). Chart 1Global Debt Levels Have Risen, Especially In The Public Sector
Global Debt Levels Have Risen, Especially In The Public Sector
Global Debt Levels Have Risen, Especially In The Public Sector
Not surprisingly, rising public debt levels have elicited plenty of consternation. While there has been a lively debate about how fast governments should tighten their belts, few have disputed the seemingly self-evident opinion that some degree of “fiscal consolidation” is warranted. Given this consensus view, one would think that the economic case for public debt levels being too high is airtight. It’s not. Far from it. Debt Sustainability, Quantified Start with the classic condition for debt sustainability, which specifies the primary fiscal balance (i.e., the overall balance excluding interest payments) necessary to maintain a constant debt-to-GDP ratio (See Box 1 for a derivation of this equation).
Image
An increase in the economy’s growth rate (g), or a decrease in real interest rates (r), would allow the government to loosen the primary fiscal balance without causing the debt-to-GDP ratio to increase (Chart 2).1 If the government were to ease fiscal policy beyond that point, debt would rise in relation to GDP. But by how much? It is tempting to assume that the debt-to-GDP ratio would then begin to increase exponentially. However, that is only true if the interest rate is higher than the growth rate of the economy. If the opposite were true, the debt-to-GDP ratio would rise initially but then flatten out at a higher level.2
Chart 2
A Fiscal Free Lunch The last point is worth emphasizing. As long as the interest rate is below the economic growth rate, then any primary fiscal balance – even a permanent deficit of 20%, or even 30% of GDP – would be consistent with a stable long-term debt-to-GDP ratio. In such a setting, the government could just indefinitely rollover the existing stock of debt, while issuing enough new debt to cover interest payments. No additional taxes would be necessary. In fact, stabilizing the debt-to-GDP ratio becomes easier the higher it rises. Chart 3 shows this point analytically.
Chart 3
Ah, one might say: If the government issues a lot of debt, then interest rates would rise, and before we know it, we are back in a world where the borrowing rate is above the economy’s growth rate, at which point the debt dynamics go haywire. Now, that sounds like a sensible statement, but it is actually quite misleading. As long as a government is able to issue its own currency, it can always create money to pay for whatever it purchases. If people want to turn around and use that money to buy bonds, they are welcome to do so, but the government is under no obligation to pay them the interest rate that they want. If they do not wish to hold cash, they can always use the cash to buy goods and services or exchange it for foreign currency. As long as a government is able to issue its own currency, it can always create money to pay for whatever it purchases. Wouldn’t that cause inflation and currency devaluation? Yes, it might, and that’s the real constraint: What limits the ability of governments with printing presses to run large deficits is not the inability to finance them. Rather, it is the risk that their citizens will treat their currencies as hot potatoes, rushing to exchange them for goods and services out of fear that rising prices will erode the purchasing power of their cash holdings. When Is Saving Desirable? The reason governments pay interest on bonds is because they want people to save more. However, more savings is not necessarily a good thing. This is obviously the case when an economy is depressed, but it may even be true when an economy is at full employment. Just like someone can work so much that they have no time left over for leisure, or buy a house so big that they spend all their time maintaining it, it is possible for an economy to save too much, leading to an excess of capital accumulation. Under such circumstances, steady-state consumption will be permanently depressed because so much of the economy’s resources are going towards replenishing the depreciation of the economy’s capital stock. Economists have a name for this condition: “dynamic inefficiency.” What determines whether an economy is dynamically inefficient? As it turns out, the answer is the same as the one that determines whether debt ratios are on an explosive path or not: The difference between the interest rate and the economy’s growth rate. Economies where interest rates are below the growth rate will tend to suffer from excess savings. In that case, government deficits, to the extent that they soak up national savings, may increase national welfare. r < g Has Been The Norm Today, the U.S. 10-year Treasury yield stands at 2.69%, compared to the OECD’s projection of nominal GDP growth of 3.8% over the next decade. The gap between projected growth and bond yields is even greater in other major economies (Chart 4).
Chart 4
Granted, equilibrium real rates are likely to rise over the next few years as spare capacity is absorbed. Structural factors might also push up real rates over time. Most notably, the retirement of baby boomers could significantly curb income growth, leading to a decline in national savings. Chart 5 shows that the ratio of workers-to-consumers globally is in the process of peaking after a three-decade long ascent. Economic growth could also fall if cognitive abilities continue to deteriorate, a worrying trend we discussed in a recent Special Report.3 Chart 5The Global Worker-To-Consumer Ratio Has Peaked
The Global Worker-To-Consumer Ratio Has Peaked
The Global Worker-To-Consumer Ratio Has Peaked
It may take a while before real rates rise above GDP growth. Still, it may take a while before real rates rise above GDP growth. As Olivier Blanchard, the former chief economist at the IMF, noted in his Presidential Address to the American Economics Association earlier this year, periods in U.S. history where GDP growth exceeds interest rates have been the rule rather than the exception (Chart 6).4 The same has been true for most other economies.5 Chart 6GDP Growth Above Interest Rates: Historically, The Rule, Not The Exception
GDP Growth Above Interest Rates: Historically, The Rule, Not The Exception
GDP Growth Above Interest Rates: Historically, The Rule, Not The Exception
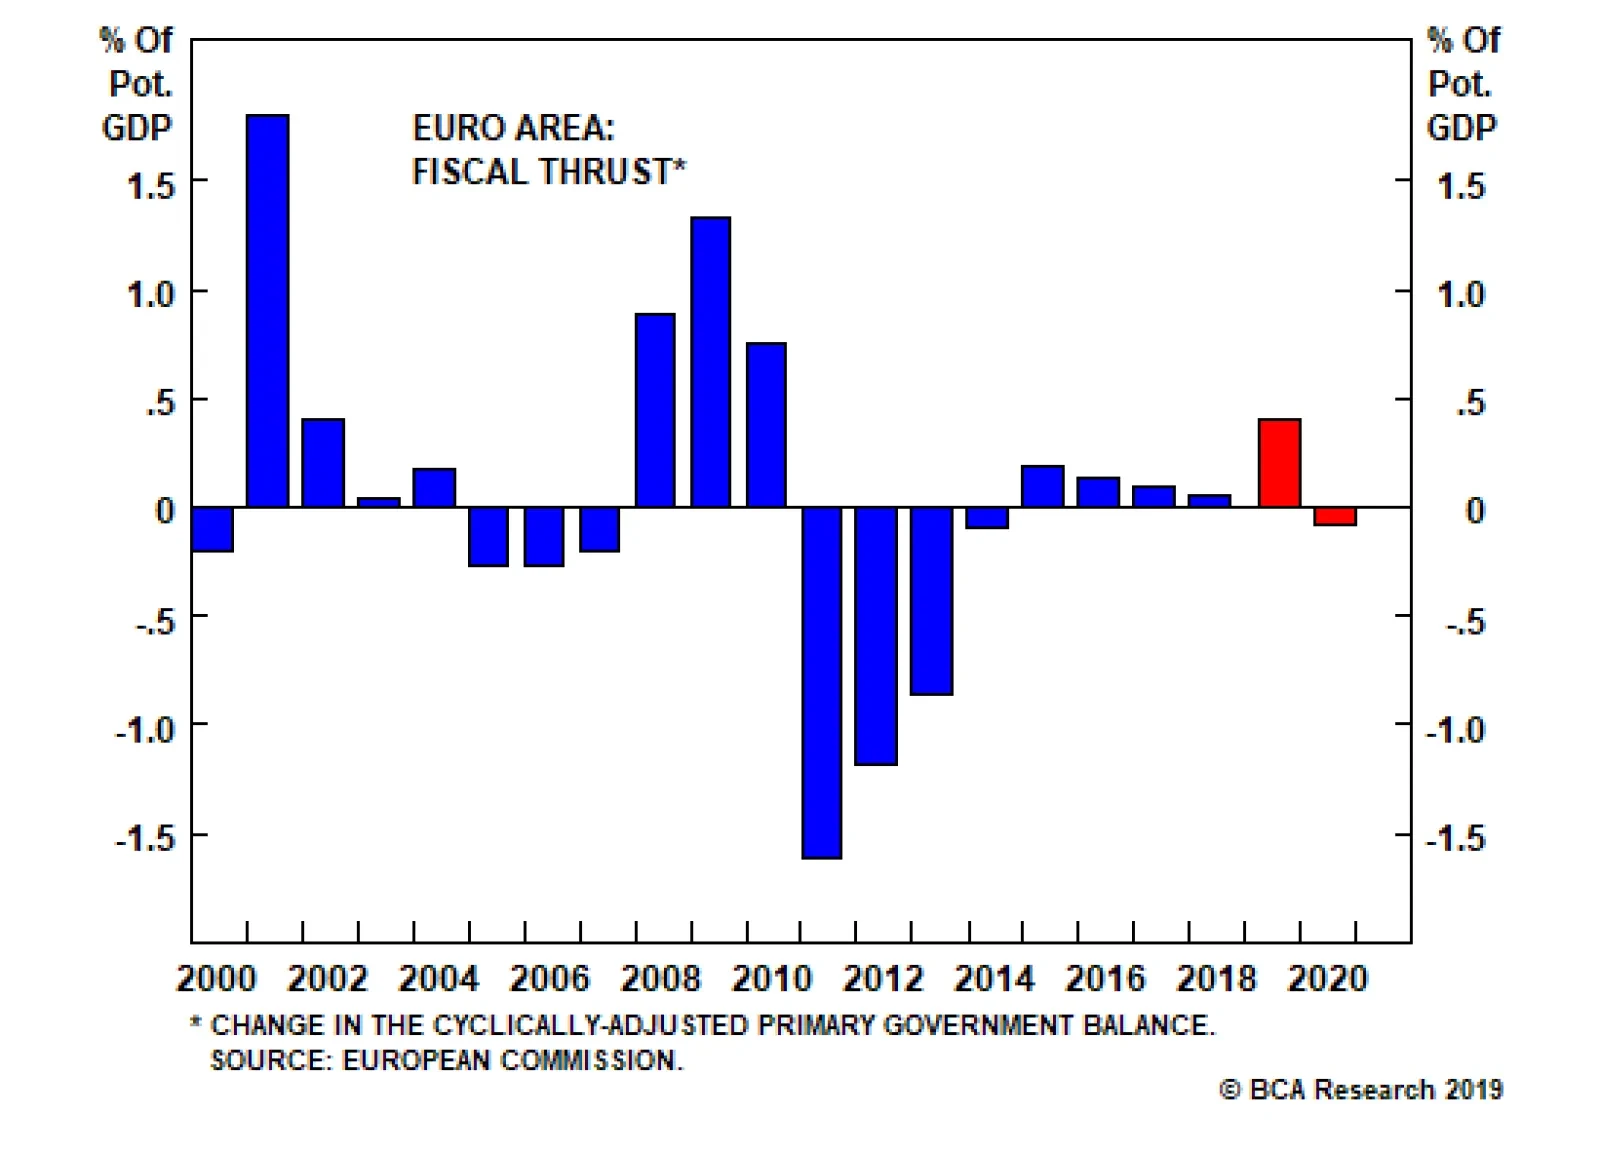
What’s Next For Fiscal Policy? Austerity fatigue has set in. In the U.S., fiscally conservative Republicans, if they ever really existed, are a dying breed. Trump’s big budget deficits and his “I love debt” mantra are the waves of the future. For their part, the Democrats are shifting to the left, with the “Green New Deal” proposal being the latest manifestation. The case for fiscal stimulus is stronger in the euro area than for the United States. The European Commission expects the euro area to see a positive fiscal thrust of 0.40% of GDP this year, up from a thrust of 0.05% of GDP last year (Chart 7). This should help support growth. Chart 7The Euro Area Will Benefit From A Modest Amount Of Fiscal Easing This Year
The Euro Area Will Benefit From A Modest Amount Of Fiscal Easing This Year
The Euro Area Will Benefit From A Modest Amount Of Fiscal Easing This Year
Additional fiscal easing would be feasible. This is clearly true in Germany, but even in Italy, the cyclically-adjusted government primary surplus is larger than what is necessary to stabilize the debt ratio.6 Unfortunately, the situation in southern Europe is greatly complicated by the ECB’s inability to act as an unconditional lender of last resort to individual sovereign borrowers. When a government cannot print its own currency, its debt markets can be subject to multiple equilibria. Under such circumstances, a vicious spiral can develop where rising bond yields lead investors to assign a higher default risk, thus leading to even higher yields (Chart 8).
Chart 8
Mario Draghi’s now-famous “whatever it takes” pledge has gone a long way towards reassuring bond investors. Nevertheless, given the political constraints the ECB faces, it is doubtful that Italy or other indebted economies in the euro area will be able to pursue large-scale stimulus. Instead, the ECB will keep interest rates at exceptionally low levels. A new round of TLTROs is also looking increasingly likely, which should protect against a rise in bank funding costs and a potential credit crunch. Our European team believes that a TLTRO extension would be particularly helpful to Italian banks. Even in Italy, the cyclically-adjusted government primary surplus is larger than what is necessary to stabilize the debt ratio. Despite having one of the highest sovereign debt ratios in the world, Japan faces no pressing need to tighten fiscal policy. Instead of raising the sales tax this October, the government should be cutting it. A loosening of fiscal policy would actually improve debt sustainability if, as is likely, a larger budget deficit leads to somewhat higher inflation (and thus, lower real borrowing rates) and, at least temporarily, faster GDP growth. We expect the Abe government to counteract at least part of the sales tax increase with new fiscal measures, and ultimately to abandon plans for further fiscal tightening over the next few years. In the EM space, Brazil, Turkey, and South Africa are among a handful of economies with vulnerable fiscal positions. They all have borrowing rates that exceed the growth rate of the economy, cyclically-adjusted primary budget deficits, and above-average levels of sovereign debt (Chart 9).
Chart 9
In contrast, China stands out as having the biggest positive gap between projected GDP growth and sovereign borrowing rates of any major economy. The problem is that the main borrowers have been state-owned companies and local governments, neither of which are backstopped by the state. Not officially, anyway. Unofficially, the government has been extremely reluctant to allow large-scale defaults anywhere in the economy. Despite all the rhetoric about market-based reforms, they are unlikely to start now. Historically, the Chinese government has allowed credit growth to reaccelerate whenever it has fallen towards nominal GDP growth. As we recently argued in a report entitled “China’s Savings Problem,” China needs more debt to sustain aggregate demand.7 Historically, the government has allowed credit growth to reaccelerate whenever it has fallen towards nominal GDP growth (Chart 10). The stronger-than-expected jump in credit origination in January suggests that we are approaching such an inflection point. Chart 10Historically, China Has Scaled Back On Deleveraging When Credit Growth Has Fallen Close To Nominal GDP Growth
Historically, China Has Scaled Back On Deleveraging When Credit Growth Has Fallen Close To Nominal GDP Growth
Historically, China Has Scaled Back On Deleveraging When Credit Growth Has Fallen Close To Nominal GDP Growth
Investment Conclusions The consensus economic view is that deflation is a much harder problem to overcome than inflation. When dealing with inflation, all you have to do is raise interest rates and eventually the economy will cool down. With deflation, however, a central bank could very quickly find itself up against the zero lower bound constraint on interest rates, unable to ease policy any further via conventional means. While this standard argument is correct, it takes a very monetary policy-centric view of macroeconomic policy. When interest rates are low, fiscal policy becomes very potent. Indeed, the whole notion that deflation is a bigger problem than inflation is rather peculiar. Just as it is easier to consume resources than to produce them, it should be easier to get people to spend than to save. People like to spend. And even if they didn’t, governments could go out and buy goods and services directly. Looking out, our bet is that policymakers will increasingly lean towards the ever-more fiscal stimulus. If structural trends end up causing the so-called neutral rate of interest to rise – the rate of interest that is necessary to avoid overheating – policymakers will have no choice but to eventually raise rates and tighten fiscal policy (Box 2). However, they will only do so begrudgingly. The result, at least temporarily, will be higher inflation. Fixed-income investors should maintain below benchmark duration exposure over both a cyclical and structural horizon. Reflationary policies that increase nominal GDP growth will help support equities, at least over the next 12 months. Chart 11 shows that corporate earnings tend to accelerate whenever nominal GDP growth rises. We upgraded global equities to overweight following the December FOMC meeting selloff. While our enthusiasm for stocks has waned with the year-to-date rally, we are sticking with our bullish bias. Chart 11Earnings And Nominal GDP Growth Tend To Move In Lock-Step
Earnings And Nominal GDP Growth Tend To Move In Lock-Step
Earnings And Nominal GDP Growth Tend To Move In Lock-Step
A reacceleration in Chinese credit growth will put a bottom under both Chinese and global growth by the middle of this year. As a countercyclical currency, the dollar will likely come under pressure in the second half of this year. Until then, we expect the greenback to be flat-to-modestly stronger. The combination of faster global growth and a weaker dollar later this year will be manna from heaven for emerging markets. We closed our put on the EEM ETF for a gain of 104% on Jan 3rd, and are now outright long EM equities. I do not have a strong view on the relative performance of EM versus DM at the moment, but expect to shift EM equities to overweight by this summer.8 Peter Berezin, Chief Global Strategist Global Investment Strategy peterb@bcaresearch.com Box 1 The Arithmetic Of Debt Sustainability
Image
Box 2 Debt Sustainability And Full Employment: The Role Of Fiscal And Monetary Policy
Image
Policymakers should strive to stabilize the ratio of debt-to-GDP over the long haul, while also ensuring that the economy stays near full employment. The accompanying chart shows the tradeoffs involved. The DD schedule depicts the combination of the primary fiscal balance and the gap between the borrowing rate and GDP growth (r minus g) that is consistent with a stable debt-to-GDP ratio. In line with the debt sustainability equation derived in Box 1, the slope of the DD schedule is simply equal to the debt/GDP ratio. Any point below the DD schedule is one where the debt-to-GDP ratio is rising, while any point above is one where the ratio is falling. The EE schedule depicts the combination of the primary fiscal balance and r - g that keeps the economy at full employment. The schedule is downward-sloping because an increase in the primary fiscal balance implies a tightening of fiscal policy, and hence requires an offsetting decline in interest rates. Any point above the EE schedule is one where the economy is operating at less than full employment. Any point below the EE schedule is one where the economy is operating beyond full employment and hence overheating. Suppose there is a structural shift in the economy that causes the neutral rate of interest – the rate of interest consistent with full employment and stable inflation – to increase. In that case, the EE schedule would shift to the right: For any level of the fiscal primary balance, the economy would need a higher interest rate to avoid overheating. The arrows show three possible “transition paths” to a new equilibrium. Scenario #1 is one where policymakers raise rates quickly but are slow to tighten fiscal policy. This results in a higher debt-to-GDP ratio. Scenario #2 is one where policymakers tighten fiscal policy quickly but are slow to raise rates. This results in a lower debt-to-GDP ratio. Scenario #3 is one where the government drags its feet in both raising rates and tightening fiscal policy. As the economy overheats, real rates actually decline, sending the arrow initially to the left. This effectively allows policymakers to inflate away the debt, leading to a lower debt-to-GDP ratio. Note: In Scenario #2, and especially in Scenario #3, the DD line will become flatter (not shown on the chart to avoid clutter). Consequently, the final equilibrium will be one where real rates are somewhat higher, but the primary fiscal balance is somewhat lower, than in Scenario #1. Footnotes 1 One can equally define the interest rate and GDP growth rate in nominal terms (see Box 1 for details). 2 Japan is a good example of this point. The primary budget deficit averaged 5% of GDP between 1993 and 2010, a period when government net debt rose from 20% of GDP to 142% of GDP. Since then, Japan’s primary deficit has averaged 5.1% of GDP, but net debt has risen to only 156% of GDP (and has been largely stable for the past two years). 3 Please see Global Investment Strategy Special Report, “The Most Important Trend In The World Has Reversed And Nobody Knows Why,” dated February 1, 2019. 4 Olivier Blanchard, “Public Debt And Low Interest Rates,” Peterson Institute for International Economics and MIT American Economic Association (AEA) Presidential Address, (January 2019). 5 Paolo Mauro, Rafael Romeu, Ariel Binder, and Asad Zaman, “A Modern History Of Fiscal Prudence And Profligacy,” IMF Working Paper, (January 2013). 6 The Italian 10-year bond yield is 2.83% while nominal GDP growth is 2.64%. Multiplying the difference by net debt of 118% of GDP results in a required primary surplus of .22% of GDP that is necessary to stabilize the debt-to-GDP ratio. This is lower than the IMF’s 2018 estimate of cyclically-adjusted government primary surplus of 2.14%. 7 Please see Global Investment Strategy Weekly Report, “China’s Savings Problem,” dated January 25, 2019. 8 Please note that my colleague, Arthur Budaghyan, BCA’s Chief EM strategist, remains bearish on both EM and DM equities and expects EM to underperform DM over the coming months. Strategy & Market Trends MacroQuant Model And Current Subjective Scores
Chart 12
Tactical Trades Strategic Recommendations Closed Trades
Highlights So What? China’s January credit data suggest that stimulus is here. Why? January credit growth was a blowout number. Trade uncertainty is likely to be prolonged with an extension of talks. Equity bourses in South Korea and Russia are the most likely to benefit from Chinese stimulus. Industrial metals such as copper will also benefit – with a delay. Feature New credit data for China in January improves the chances that Beijing’s stimulus measures will overshoot this year, causing China’s economy to bottom in 2019 and jumpstart global growth. In our annual outlook for this year we argued that while China was stimulating the economy, the magnitude of stimulus would be the decisive factor for the global macro environment in 2019. We argued that the type of stimulus would remain primarily fiscal – tax cuts for households and small and medium-sized enterprises – and hence that it would be modest as fiscal easing would merely offset relatively weak credit growth. This view stemmed from our assessment of the Xi Jinping administration, highlighted in April 2017, as an “elitist” (not populist) administration. Its policy priorities are to discipline the Chinese economy, and in particular to contain systemic financial risk, which President Xi has cited as a national security threat. This view is not wrong, but the latest data clearly show that Xi has decided to pause these painful efforts at limiting leverage and rebalancing China’s economy. Witness January’s decisive uptick in both total social financing (total private credit) and local government bond issuance (Chart 1). Chart 1Higher Risk Of An Overshoot
Higher Risk Of An Overshoot
Higher Risk Of An Overshoot
A massive spike in new credit is the single most important criterion in our “Checklist For A Stimulus Overshoot.” Thus, from a policy perspective, we are now at higher risk of an overshoot (Table 1). Not only credit as a whole but also informal lending saw a surge in January, implying that the government is relenting in its crackdown on the shadow banks. The approval of local government bond issuance for early in the year – and the People’s Bank of China’s announcement of a “Central Bank Bills Swap” program – reinforce this policy shift.1 Table 1Checklist For A Chinese Stimulus Overshoot In 2019
China: Stimulating Amid The Trade Talks
China: Stimulating Amid The Trade Talks
A stimulus overshoot is positive for Chinese demand in the short run but negative for potential GDP in the long run. A “traditional” credit surge of this nature cannot be surgically targeted at SMEs or households. It will go to state-owned enterprises, privileged corporations, property developers, and the like, which have always had the advantage in China’s financial system. SOEs have taken a much larger share of new loans than private companies in recent years,2 and the only silver lining of this trend was the possibility that tighter credit controls would discipline the SOEs. That silver lining is now fading, barring some new and surprising development on the reform front. China needs to create 26 trillion renminbi in new credit over the course of the year to avoid a corporate earnings contraction. These January numbers put China on track to do just that (Chart 2), assuming that President Xi and U.S. President Donald Trump agree to a short-term, framework trade deal this year. Chart 2On Track To Avoid An Earnings Contraction
On Track To Avoid An Earnings Contraction
On Track To Avoid An Earnings Contraction
Of course, a few caveats are in order. First, January’s credit number is only one data point and credit growth is always abnormally strong in the first month of the year. Early in the year, banks seek to expand their assets rapidly in a bid to get as much market share as possible before administrative credit quotas kick in. Because of Chinese New Year, it is best to combine January and February data to get a sense of the rate of credit expansion in the first part of the year. To do that, investors will have to wait for mid-March when the February data is out. This year’s January numbers are very strong relative to previous Januaries (Chart 3) and the context is more accommodative than the 2017 January credit surge, when authorities were beginning to tighten rather than ease macroprudential policy. Still a rapid rate of credit expansion will have to be sustained in the coming months in order to meet the 26 trillion RMB requirement highlighted above.
Chart 3
Second, there is some risk that China’s households and private businesses will not respond as positively today as in the past. The intensification of Communist Party control over the society and economy, President Xi’s cancellation of term limits, and the strategic confrontation with the United States have created a bearish sentiment in the private sector. Our Emerging Markets Strategy would point out that if the propensity to consume, and money velocity,3 do not accelerate, then a surge in new credit may fail to ignite a reacceleration in China (Chart 4). Chart 4Chinese Are Holding On To Their Money
Chinese Are Holding On To Their Money
Chinese Are Holding On To Their Money
Still, what we now know is that Xi Jinping and his top economic adviser, Vice Premier Liu He, are not initiating the “assault phase of reform” that their predecessors initiated in the late 1990s in order to cleanse China’s economy of bad loans and zombie companies. Instead, they are likely reestablishing the “Socialist Put” in order to reverse the current deceleration, demonstrate China’s continued economic might and face down the United States’ threat of tariffs. Bottom Line: China’s stimulus measures are increasingly likely to overshoot, with positive implications for both Chinese and global growth. China is still facing a corporate earnings recession, but the odds of averting it are increasing. Trade Deadline More Likely To Be Extended What of the trade war? First, we would warn clients that China’s annual credit origination is a much bigger factor for the global economy than China’s exports to the United States (Chart 5). The trade war can escalate from here and yet, if China’s stimulus works as it has in the past, the results will be manageable for China’s economy save for Chinese companies expressly exposed to the U.S. economy through exports. In reality, both the U.S. and China are now effectively stimulating their economies and in this sense global trade as a whole will benefit regardless of bilateral tariffs. Chart 5Watch China Credit, Not So Much The Trade War
Watch China Credit, Not So Much The Trade War
Watch China Credit, Not So Much The Trade War
But it is possible that just as global equity markets ignored China’s economic slowdown and only sold off when the tariffs were levied (Chart 6), they may not continue to rally much on China’s credit data. Given the already considerable rally in global risk assets since October, markets may not be satisfied merely with one or two months of solid credit data out of China without a clear resolution to the trade conflict. After all, if a collapse in U.S.-China trade talks portends a new Cold War, then institutional investors may be justified in taking a wait-and-see approach despite China’s credit cycle upswing. Chart 6Will Equities Ignore China Data (Again)?
Will Equities Ignore China Data (Again)?
Will Equities Ignore China Data (Again)?
In the past, we have highlighted that the U.S. and China are not economically prohibited from engaging in a trade war – the export exposure is too small – and China’s new stimulus reinforces this point. However, President Trump is concerned about causing a sell-off in the tech sector and hence the broad equity market which could translate into a bear market and raise the probability of a recession occurring prior to November 2020. Meanwhile, in China, given Beijing’s reported trade concessions, there is apparently a desire to pacify the relationship and discourage U.S. unilateral tariffs and sanctions that could become seriously destabilizing for the Chinese economy and society. The need to have a happy 2021 centenary celebration for the Communist Party may factor into policymakers’ thinking. The latest news flow is mildly positive for the odds of getting a framework deal sometime this year. President Trump visited the Chinese negotiators in Washington, D.C. while President Xi reciprocated with the American negotiators in Beijing. Trump has signaled that an extension of the March 1 deadline is possible, and a two-month extension is being bandied about in the press. China’s National People’s Congress is likely to pass a new Foreign Investment Law that ostensibly guarantees many of the American demands on forced tech transfer, intellectual property theft, and discriminatory treatment of U.S. companies (Table 2). Even the second Trump summit with Kim Jong Un, this time in Vietnam, should be seen as a mild positive for U.S.-China negotiations. Table 2New Foreign Investment Law Would Be A Positive For U.S.-China Negotiations
China: Stimulating Amid The Trade Talks
China: Stimulating Amid The Trade Talks
However, Presidents Trump and Xi have yet to schedule a new summit, which is probably necessary for a final deal. And there are murmurs from the press suggesting that China’s new law and other concessions are not going to satisfy the U.S. negotiators on the critical point of “structural changes” and a verification process. This leaves us inclined to change our trade war probabilities to increase the odds of an extension (Table 3). The improvement in U.S. financial conditions and China’s stimulus, if anything, make it more likely that negotiations will be extended, as both sides feel their economic and financial constraints less acutely. Table 3Updated Trade War Probabilities
China: Stimulating Amid The Trade Talks
China: Stimulating Amid The Trade Talks
Bottom Line: Global and Chinese risk assets should rally on China’s credit uptick, but the lack of resolution of the trade war could continue to inhibit animal spirits – and the odds of a March 1 resolution are declining. Who Are The Equity Winners Of China’s Stimulus? China’s strong January credit number is supportive of global equity markets. That much is obvious. But which equity markets will benefit the most? In what follows we examine the relationship between Chinese credit and MSCI equity returns of various countries. We find that Malaysian, Australian, South Korean, and Indonesian equities are the most highly correlated with Chinese credit growth and are thus most likely to benefit from the recent upturn (Chart 7). On the other hand, France and Italy stand out as countries whose bourses are more insulated.
Chart 7
Out of the markets that are positively correlated, South Korea and Russia stand out as relatively cheap (Chart 8). Thus we expect these equities to do especially well. By contrast, while Indonesia and the Philippines are highly leveraged to China, these markets are currently relatively expensive. BCA’s Emerging Markets Strategy is currently overweight Korean and Russian equities within the EM space, neutral Turkey (although recently upgraded from underweight), and underweight Indonesia and the Philippines.
Chart 8
In addition to credit stimulus, we expect Chinese household consumption to also gain support going forward. This will likely be driven by policy stimulus targeting the consumer specifically and is best exemplified by the recently announced tax cuts (Chart 9), which we expect to trickle down to greater consumer demand and growth in retail sales. Our base case calls for 8%-10% growth in household consumption over the coming 12 months, up from the current 3.5%.
Chart 9
However, consumer sentiment in China is weak. BCA’s Emerging Markets Strategy’s proxy for household marginal propensity to spend ticked up recently, after falling since early last year (see Chart 4 above). A resumption in the decline would highlight that households are increasingly unwilling to spend, which would translate into weaker retail sales despite policy efforts to boost consumption. Such a scenario – in which credit growth accelerates without a substantial uptick in consumer spending – is plausible, given that it occurred between mid-2015 and mid-2016 (Chart 10). In any case, whether Chinese stimulus comes in the form of the traditional credit channel, or instead in the form of fiscal stimulus to household consumption, the same equity markets will generally benefit the most (Chart 11). Chart 10...But Flattish Retail Sales Are Also A Possibility
...But Flattish Retail Sales Are Also A Possibility
...But Flattish Retail Sales Are Also A Possibility
Chart 11
Indeed, global equity markets react the same way regardless of the type of stimulus implemented. For instance, MSCI returns for the Philippines, Sweden, Malaysia, Indonesia, and Turkey are more closely correlated to both Chinese credit growth and retail sales growth compared to Italy, Japan, and France. The same conclusion is reached when we look at the correlations between Chinese credit growth or consumption growth and individual MSCI sectors such as industrials and consumer discretionary (Chart 12).
Chart 12
The relatively stronger correlation between Chinese credit growth and equity returns – as opposed to Chinese retail sales and equity returns – can be put down to the nature of Chinese imports. While industrial goods account for the bulk of China’s purchases of foreign goods, consumer goods excluding autos make up only 15% of China’s imports (Table 4). However, as Chart 12 illustrates, the relationship between China’s retail sales growth and global equities is much tighter in the case of the consumer discretionary sector, whether the latter is compared to global industrials sectors or the overall MSCI index. Table 4Import Composition Of Chinese Imports
China: Stimulating Amid The Trade Talks
China: Stimulating Amid The Trade Talks
Equity market exposure to China is not always in line with the extent of each country’s trade exposure to China (Chart 13).
Chart 13
There are some clear exceptions – most notably Mexico, which has the highest correlation coefficient with Chinese credit and consumption variables since 2010. However, this is likely due to idiosyncratic factors.4 Correlation does not imply causation, and we cannot conclude with certainty that Mexican equities will outperform amid China’s new round of stimulus. Nevertheless, given that Mexico is a very deeply liquid market that benefits amid EM bull markets, this may not be entirely coincidental. The correlations between global equity markets and Chinese credit peak two months after the stimulus measures are first implemented (Chart 14). This is more or less in line with adjusted total social financing’s correlation versus industrial metals. However BCA’s Commodity & Energy Strategy has shown that copper’s correlations versus other measures of Chinese money and credit peak after roughly three quarters (Chart 15).5 This is evident in both the 2012 and 2015-16 stimulus episodes in which the bottom in copper prices lagged the bottom in China’s credit growth. Thus we may witness a rebound in equity markets on the back of China’s credit splurge before we see an improvement in annual returns on copper prices.
Chart 14
Chart 15Copper Rallies Lag China Credit Stimulus
Copper Rallies Lag China Credit Stimulus
Copper Rallies Lag China Credit Stimulus
Bottom Line: South Korean and Russian equities are best positioned to benefit from the positive surprise in China’s credit data. France and Italy are the worst positioned. Copper prices will rebound with a delay. Investment Implications BCA’s Geopolitical Strategy recommends that investors stay long Chinese equities ex-tech relative to the emerging market benchmark. This is a tactical call initiated in August 2018 that is now becoming a cyclical call on the basis of the credit upswing. We also remain long the “China Play Index,” a basket of China-sensitive assets, and long China’s “Big Five” banks relative to other banks. A rebound in China’s credit data and stronger global growth will support copper demand. Prices are still 15% below the mid-2018 peak and are poised to benefit in this environment, especially given that global inventories are already falling. BCA’s Geopolitical Strategy recommends that investors go long copper. Meanwhile, BCA’s China Investment Strategy recommends (for now) staying only tactically overweight Chinese equities relative to the global benchmark, pending higher conviction that the pace of credit growth will be strong enough to overwhelm the negative ramifications of a continued deceleration in actual activity over the coming few months on sentiment and 12-month forward earnings expectations. Over the long run, Geopolitical Strategy would look to underweight Chinese equities, as we are not optimistic about China’s productivity and potential GDP. This is because of the negative structural consequences of continuing the Socialist Put (i.e., bad loans, zombie companies, trade protectionism). We would expect CNY/USD to remain relatively buoyant in the context of both trade negotiations with the U.S. and fiscal-and-credit stimulus. The trade talks can hardly succeed if CNY/USD is falling. Depending on whether and how soon China’s stimulus results in a durable economic bottom, global growth could stabilize and the USD could see a substantial countertrend selloff. Matt Gertken, Vice President Geopolitical Strategy mattg@bcaresearch.com Roukaya Ibrahim, Editor/Strategist roukayai@bcaresearch.com Footnotes 1 Please see Emerging Markets Strategy Special Report titled “China: Prepping A Bazooka?” dated February 14, 2019 available at ems.bcaresearch.com 2 Please see Nicholas Lardy, “The State Strikes Back: The End Of Economic Reform In China?” Peterson Institute For International Economics, January 29, 2019, available at piie.com. 3 Please see Emerging Markets Strategy Weekly Report titled “Dissecting China’s Stimulus,” dated January 17, 2019 available at ems.bcaresearch.com 4 The 2012 election of President Enrique Peña Nieto caused Mexican equities to outperform their EM counterparts. Similarly in 2015-16, U.S. outperformance relative to EM also supported Mexico relative to EM because Mexico’s economy is highly leveraged to its northern neighbor. In both periods Mexico’s outperformance was not caused by – but instead coincided with – Chinese credit stimulus. These idiosyncratic events biased the correlation between Mexico’s equity markets and Chinese credit growth to the upside. 5 Please see Commodity & Energy Strategy Weekly Report titled “Trade Wars, China Credit Policy Will Roil Global Copper Markets,” dated June 21, 2018, available at ces.bcaresearch.com.
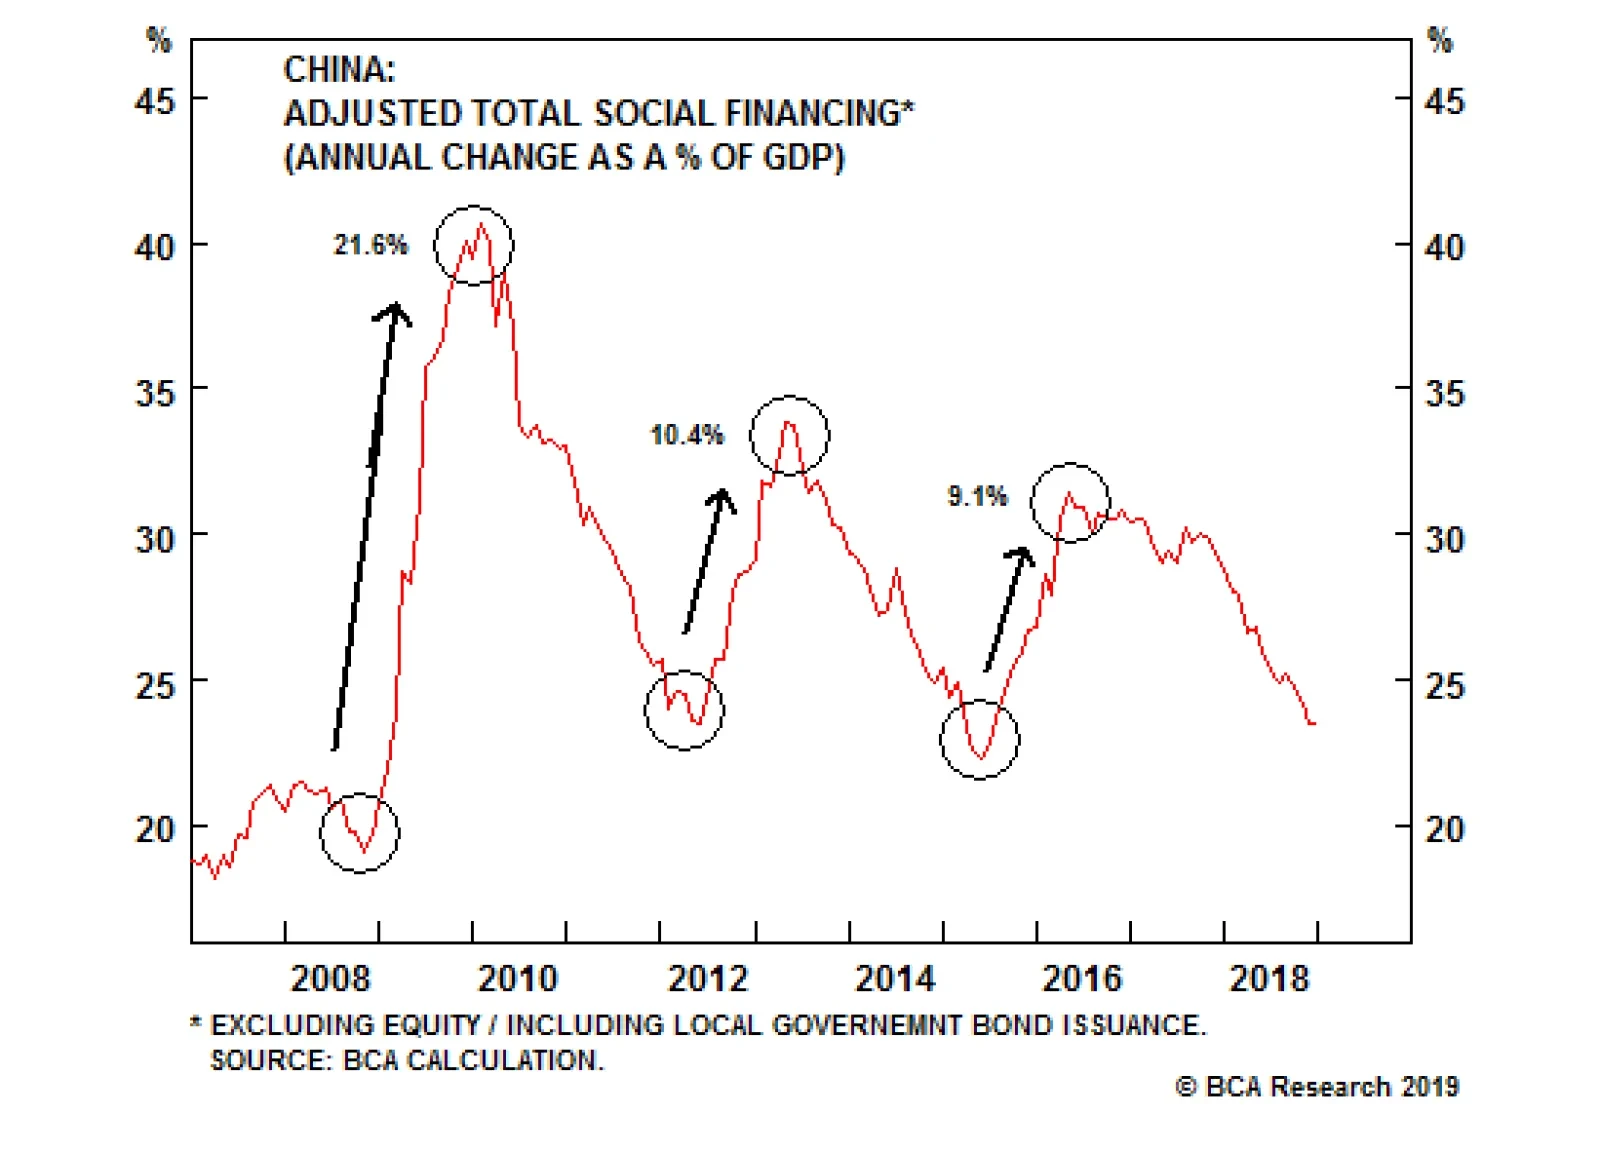
There is no doubt that Chinese policymakers are stimulating the economy, but the question is whether they are willing to pull the credit lever as aggressively as they have done in the past. So far, all of the evidence we have reviewed point to a cautious…