Fiscal

Feature In what has become a tradition, I met with Ms. Mea following client meetings in Europe last week. Ms. Mea is a long-term BCA client who has been following our Emerging Markets Strategy very closely over the years. It was our fourth meet-up in the past 18 months. Ms. Mea keeps our meetings interesting by always challenging our views and questioning the nuances of our analysis. The timing of our most recent meeting was particularly notable, as we had just received news that the latest U.S.-China trade talks had not produced an agreement. In light of this, Ms. Mea started our conversation with a question on the link between geopolitics and financial markets: Ms. Mea: Why have the U.S. and China failed to reach a trade accord when it is clear that without one, both global financial markets and business sentiment will be hurt? Answer: The U.S. and China are intertwined in a geopolitical confrontation that will endure for decades. Their strategic national interests are not aligned at all. Therefore, any accord on trade and other geopolitical disputes will not be lasting. It is impossible to accurately forecast and time all turns of the negotiation process and the associated event risks. Therefore, an investment process should be informed and guided by a thematic approach. The U.S. and China are intertwined in a geopolitical confrontation that will endure for decades. Our theme has been, and remains, that China and the U.S. are in a long-term geopolitical confrontation that epitomizes a rivalry between an existing and a rising superpower. This suggests that the demands of one side will be unacceptable to the other. That makes any agreement unsustainable over the long run. In brief, there was a structural regime shift in the U.S.-China relationship last year. Yet global equity markets rallied this year on rising expectations of a major trade deal. Notably, most of the gains in EM equities since late December occurred on days when there was positive news on the progress of trade talks. Hence, the EM rally can largely be attributed to expectations of a trade deal. Not surprisingly, the failure to conclude a trade accord has quickly pushed EM share prices back down to their mid-January levels (Chart I-1). As such, the majority of investors who have bought the EM equity index since early this year lost a substantial part of their gains in the recent selloff. Chart I-1EM Equity Index: Between Support And Resistance
EM Equity Index: Between Support And Resistance
EM Equity Index: Between Support And Resistance
Given that these two nations are embroiled in a long-term geopolitical rivalry, it will be difficult to find solutions on trade and geopolitical disputes that can simultaneously satisfy both sides. Even so, this does not imply that global risk assets will be in freefall forever. Financial markets currently need to price in both (1) a geopolitical risk premium on a structural basis; and (2) the impact of trade tariffs on global business activity on a cyclical basis. Once these two components have been priced in, markets will become less sensitive to the ebbs and flows of tensions between the U.S. and China. Finally, China’s exports to the U.S. constitute only 3.5% of mainland GDP (Chart I-2). This is considerably smaller than capital spending, which makes up 42% of China’s GDP. Further, most of the investment outlays over the past 10 years have not been in productive capacity to supply goods to the American market. On the contrary, the overwhelming share of capital expenditures since 2008 have occurred in domestic segments of the economy rather than export industries. Certainly, the trade confrontation will weigh on consumer and business sentiment in China as well as reduce the flow of U.S. dollars to the Middle Kingdom, warranting RMB depreciation. Still, there are other predicaments unrelated to the U.S. import tariffs that Chinese policymakers are facing. These include the credit, money and property bubbles that we have written about extensively. China’s exports to the U.S. constitute only 3.5% of mainland GDP. Ms. Mea: With no trade deal, the odds appear to be rising that the Chinese authorities will ramp up both credit and fiscal stimulus. Should investors not be looking through the near-term volatility and be buying EM risk assets and China-plays – because this stimulus will produce a cyclical recovery in the mainland economy? Answer: It is a safe bet that the Chinese authorities will encourage more credit creation and ramp up fiscal spending. The difficulty for investors is in gauging two unknowns: What is the lead time between the stimulus and economic growth, and what will be the multiplier effect of these stimuli. Lead time: Chart I-3 portends our aggregate credit and fiscal spending impulse. Based on the past relationship between turning points in this indicator and the business cycle in China, the latter is likely to bottom around August. Chart I-2Structure Of Chinese Economy
Structure Of Chinese Economy
Structure Of Chinese Economy
Chart I-3China: Stimulus Works With A Time Lag
China: Stimulus Works With A Time Lag
China: Stimulus Works With A Time Lag
Chart I-4China's Stimulus And Financial Markets: 2012 Versus 2016
China's Stimulus And Financial Markets: 2012 Versus 2016
China's Stimulus And Financial Markets: 2012 Versus 2016
Multiplier effect: The impact of stimulus on the economy also depends on the multiplier effect. The latter is contingent on households’ and companies’ willingness to spend. If households and companies hasten the pace of spending, the economy can recover with little stimulus. If they reduce their expenditure growth, the economy may require much more stimulus. The majority of investors and commentators are comparing China’s current stimulus efforts with what occurred in 2016. However, our hunch is that the current Chinese business cycle might actually resemble the 2012-‘13 episode due to similarities in the multiplier effect. The size of credit and fiscal stimulus in 2012 was as large as in 2016. Nevertheless, the business cycle recovery in 2012-‘13 was very muted, as illustrated in Chart I-3 on page 3. Consistently, EM share prices and commodities did not stage a cyclical rally in 2012 as they did in 2016-‘17 (Chart I-4). Ms. Mea: It seems you are implying that differences between the 2012 and 2016 economic and financial markets outcomes are due to the multiplier. How does one appraise the multiplier effect? Answer: In a word, yes. Unfortunately, there is no easy way to forecast consumers’ and businesses’ willingness to spend – particularly in the midst of a clash between the positive effects of stimulus and the negative sentiment stemming from the ongoing U.S.-China confrontation. We have constructed indicators that measure the willingness to spend among households and companies in China. Our proxies for their marginal propensity to spend (MPS) are currently in decline (Chart I-5A and I-5B). Chart I-5AChina: Households' Marginal Propensity To Spend
China: Households' Marginal Propensity To Spend
China: Households' Marginal Propensity To Spend
Chart I-5BChina: Enterprises’ Marginal Propensity To Spend
China: Enterprises' Marginal Propensity To Spend
China: Enterprises' Marginal Propensity To Spend
MPS does not affect day-to-day expenditures, but rather captures consumer spending on large-ticket items such as housing, cars and durable goods, as well as investment expenditures by companies. Consistently, mainland companies’ MPS leads industrial metal prices by several months (Chart I-5B). Chart I-6 illustrates the critical difference between 2012 and 2016 in terms of the impact of credit and fiscal stimulus. In both episodes, the size of the stimulus was roughly the same, but the manufacturing PMI did not really recover in 2012-’13, gyrating in the 49-51 range. In contrast, it did stage a cyclical recovery in 2016-‘17 (Chart I-6, second panel). In brief, the difference between the 2012 and 2016 episodes was the MPS by companies and households (Chart I-6, third and fourth panels). There are other predicaments unrelated to the U.S. import tariffs that Chinese policymakers are facing. These include the credit, money and property bubbles that we have written about extensively. Provided the not-so-upbeat sentiment among Chinese households and businesses due to their high debt levels and the ongoing trade conflict, the odds are that their MPS will remain weak for now. As a result, the impact of credit and fiscal stimulus on China’s business cycle will be muted for now. As such, more stimulus and longer lead time may be required to engineer a cyclical recovery. Interestingly, the current profiles of both EM and developed equity markets closely resemble their 2012 trajectories – both in terms of direction and magnitude (Chart I-7). Chart I-6China's Stimulus In 2012 And 2016: Beware Of Multiplier Effect
China's Stimulus In 2012 And 2016: Beware Of Multiplier Effect
China's Stimulus In 2012 And 2016: Beware Of Multiplier Effect
Chart I-7Is 2018-2019 Akin ##br##2011-2012?
Is 2018-2019 Akin 2011-2012?
Is 2018-2019 Akin 2011-2012?
Ms. Mea: So, you are suggesting risks to China-related plays and EM financial markets are skewed to the downside. How should one assess how much downside there is, and what should investors look for to gauge turnings points in financial markets? Answer: We continuously assess the investment landscape, not only based on our fundamental analysis of the global/EM/China business cycles but also on various financial market valuations, positioning and technicals. Let’s review where we stand with respect to these metrics. Equity Valuations: EM stocks are not cheap. Our favored measure of equity valuations is the composite indicator-based 20% trimmed means of the following multiples: trailing and forward P/E, price-to-cash earnings, price-to-book value and price-to-dividend ratios (Chart I-8). On these metrics, EM stocks appear fairly valued. Nevertheless, these valuations should be viewed in the context of structural decline in EM corporate profitability. The measures of return on equity and assets for non-financial companies in EM are on par with their 2008 lows (Chart I-8, middle and bottom panels). When valuations are neutral, the equity market’s direction is dictated by the profit outlook. The latter currently remains negative for EM and Chinese companies (Chart I-9). Chart I-8EM Equities Are Not Cheap
bca.ems_wr_2019_05_16_s1_c8
bca.ems_wr_2019_05_16_s1_c8
Chart I-9Downside Profit Surprises In EM And China
Downside Profit Surprises In EM And China
Downside Profit Surprises In EM And China
Currency Valuations: The U.S. dollar is only moderately (one standard deviation) expensive, according to the real effective exchange rate based on unit labor costs (Chart I-10). The latter is our most favored currency valuation measure. The greenback has been in a major structural bull market since 2011. Secular bull/bear markets do not typically end before valuations reach 1.5-2 standard deviations. We reckon that the cyclical and structural backdrop remains favorable for the dollar, and odds are it will overshoot before a major top sets in. Going forward, most of the dollar’s additional gains will not occur versus the euro or the Japanese yen – which are already modestly undervalued (Chart I-10, middle and bottom panels) – but against other currencies. In particular, commodity currencies of developed economies have not yet cheapened enough (Chart I-11). Typically, a structural bear market in commodities does not end until these commodity currencies become cheap. Hence, the current valuation profile of these commodity currencies is consistent with the notion that the secular bear markets in commodities prices and EM are not yet over. Chart I-10The Euro Is Fairly Valued, The Yen Is Cheap G3 Currency Valuations
The Euro Is Fairly Valued, The Yen Is Cheap G3 Currency Valuations
The Euro Is Fairly Valued, The Yen Is Cheap G3 Currency Valuations
Chart I-11Commodities Currencies ##br##Are Not Cheap Yet
Commodities Currencies Are Not Cheap Yet
Commodities Currencies Are Not Cheap Yet
Unfortunately, there are no data for unit labor cost-based real effective exchange rates for the majority of EMs. However, it is a safe bet to infer that long- and medium-term cycles in EM currencies coincide with those of DM commodity currencies because they are all pro-cyclical. If DM commodity currencies have not yet bottomed, EM currencies remain vulnerable. Relative to the global equity benchmark, global materials have broken down to new cyclical lows. This could be a harbinger of EM relative equity performance making new lows. Ms. Mea: But the positioning in the U.S. dollar is long. How consistent is this with your view of further dollar strength? Positioning: While investors are long the U.S. dollar versus several DM currencies, they are short the greenback versus EM currencies. Chart I-12 illustrates the aggregate net long positions of both leveraged funds and asset managers in the BRL, MXN, RUB and ZAR. As of May 10 (the last datapoint available), investors were as long these EM high-beta currencies as they were at their cyclical peak in early 2018. As to emerging Asian currencies, ongoing RMB depreciation will drag emerging Asian currencies down. Notably, the Korean won has already broken down from its tapering wedge pattern. Concerning EM equities, investor positioning and sentiment was still very elevated before last week’s market turmoil. Chart I-13 demonstrates the number of net long positions in EM ETFs (EEM) by leveraged funds and asset managers. The last datapoint is also as of May 10. Chart I-12Investors Have Been Long EM Currencies
Investors Have Been Long EM Currencies
Investors Have Been Long EM Currencies
Chart I-13Investors Have Been Bullish On EM Stocks
Investors Have Been Bullish On EM Stocks
Investors Have Been Bullish On EM Stocks
In short, investor sentiment on EM was bullish and long positions in EM were extended before the U.S.-China trade confrontation escalated again. Tell-tale signs and technicals: Market profiles can sometimes help us gauge whether an asset class is in a bull or bear market, and what the next move is likely to be. We have the following observations: U.S. dollar volatility is close to its record lows (Chart I-14). Following the previous three low-volatility episodes, EM shares prices in dollar terms dropped substantially over the ensuing 18 months – 60% in 1997-1998, 65% in 2007-2008 and 30% in 2014-2015. The rationale is that very low global currency volatility indicates that investors do not foresee a major tectonic macro shift. When this does inevitably occur, currency markets move violently. The RMB depreciation could be a tectonic macro shift that global markets are not prepared for. The absolute and relative performances of EM stocks resemble that of global materials stocks. Global materials are breaking below their long-term moving averages (technical support lines) in absolute terms, raising the odds that the EM equity index will do the same. Relative to the global equity benchmark, global materials have broken down to new cyclical lows. This could be a harbinger of EM relative equity performance making new lows (Chart I-15). Chart I-14U.S. Dollar Volatility And ##br##EM Equity Returns
U.S. Dollar Volatility And EM Equity Returns
U.S. Dollar Volatility And EM Equity Returns
Chart I-15EM And Global Materials: Relative To Global Index
EM And Global Materials: Relative To Global Index
EM And Global Materials: Relative To Global Index
Consistently, industrial metals prices as well as our Risk-on/Safe-Haven Currency Index have potentially formed a head-and-shoulders pattern and may be entering a major down leg (Chart I-16). Further weakness in these variables would be consistent with a risk-off phase in EM financial markets. Finally, the relative performance of the MSCI China All-Share Index – which includes all onshore- and offshore-listed stocks – has relapsed relative to the global equity benchmark, failing to break above its long-term moving average (Chart I-17). This is a negative tell-tale sign, and often warrants considerable downside. Chart I-16A Head-And-Shoulder Pattern In Global Cyclical Markets?
bca.ems_wr_2019_05_16_s1_c16
bca.ems_wr_2019_05_16_s1_c16
Chart I-17China All-Share Index: Absolute And Relative Performance
China All-Share Index: Absolute And Relative Performance
China All-Share Index: Absolute And Relative Performance
Ms. Mea: It seems to me that the RMB holds the key. What are your thoughts on the Chinese currency? Answer: There are several reasons why the RMB will likely depreciate. First, yuan depreciation is needed to mitigate the impact of U.S. import tariffs on Chinese exporters’ profitability. Authorities could use the RMB depreciation to fight back against U.S. import tariffs – a response that U.S. President Donald Trump will certainly not like. Second, the ongoing cyclical downturn in China and rising deflationary pressures also warrant a cheaper currency. Third, there is a vast overhang of money supply in China: The broad money supply is equivalent to US$30 trillion. More stimulus will only make this oversupply of yuans larger. This, along with the desire of mainland households and businesses to diversify their deposits into foreign currencies/assets, is like “the sword of Damocles” on the yuan’s exchange rate. Finally, the sources of foreign currency that previously offset capital outflows in China are no longer available. The current account surplus has largely evaporated. In addition, the central bank seems to be reluctant to reduce its foreign exchange reserves to fund capital outflows. In fact, at US$3 trillion, its foreign currency reserves are equivalent to only 10% of local currency broad money supply. All in all, we are structurally short the RMB versus the dollar. Chart I-18China, Commodities, & EM: Identical Cycles
China, Commodities, & EM: Identical Cycles
China, Commodities, & EM: Identical Cycles
Ms. Mea: What are the investment implications? Where are we in the EM/China investment cycle? Answer: Our investment themes since early this decade have been that EM share prices and currencies are in a bear market, the U.S. dollar is in a structural bull market, and commodities are in a structural downtrend (Chart I-18). With the exception of 2016-‘17, these themes have played out quite well. These structural moves have not yet been exhausted. At the moment, we do not foresee a 2016-’17-type cyclical rally either. The failure of EM equities to outperform DM stocks and the resilience of the U.S. dollar during the risk-on period since early this year, give us comfort in maintaining a negative stance on EM risk assets. Importantly, a decade-long poor EM performance is likely to end with a bang rather than a whimper, especially when investors by and large remain bullish on EM. On the whole, we recommend trading EM stocks on the short side and underweighting EM equities in a global equity portfolio. Within the EM equity universe, our overweights are Russia, central Europe, Thailand, non-tech Korean stocks, Mexico, Chile, the UAE and Vietnam. Our underweights are Brazil, South Africa, Turkey, Peru, Indonesia, India, and the Philippines. Fixed-income investors should also position for higher volatility and weaker EM currencies, favoring low-beta versus high-beta markets. Russian and Mexican markets are our favored local currency and U.S. dollar bonds. Finally, we continue to recommend shorting a basket of the following EM currencies versus the U.S. dollar: ZAR, CLP, IDR, MYR, PHP and KRW. Our currency overweights are MXN, RUB, SGD and the THB as well as central European currencies. Arthur Budaghyan Chief Emerging Markets Strategist arthurb@bcaresearch.com Equity Recommendations Fixed-Income, Credit And Currency Recommendations
Highlights Looking past the day-to-day noise of trade-related announcements, we view the underlying odds of an actual trade agreement this year to have fallen below 50%. For the purposes of investment strategy, China-exposed investors should now simply assume that the U.S. proceeds with 25% tariffs on all imports from China. Given this, investors should stop focusing strictly on the odds of trade war, and should instead start focusing on the likely net impact of the tariff shock and China’s inevitable policy response. Simulated and empirical estimates of the impact of a 25% increase in tariffs affecting all U.S.-China trade suggest that economic conditions in China are likely to deteriorate to 2015/2016-like levels. This implies that a 2015/2016-style policy response will again be required in order for policymakers to be confident that the shock will be overcome. The preference of policymakers is to prevent another significant episode of releveraging, but the constraints facing policymakers suggest that one is unlikely to be avoided. We see a meaningful chance that this tension will be resolved by a classic market “riot” over the coming 3 months as financial markets force reluctant policymakers to capitulate. We would not recommend a long position in Chinese stocks, either in absolute terms or relative to the global benchmark, for investors with a time horizon of less than 3 months. However, over a strictly cyclical (i.e. 6-12 month) time horizon, we would recommend staying long/overweight on the basis that policymakers will ultimately respond as needed. We recommend investors hedge the inherent RMB exposure from a long US$ cyclical position in Chinese stocks by opening a long USD-CNH trade. Feature U.S. and Chinese negotiators failed last week to secure an agreement deferring the threatened increase in the second round tariff rate.1 The tariffs increased on Thursday at midnight for goods not already in transit to the U.S. (effectively doubling the existing tariffs), which was followed by the inevitable retaliation by China on Monday (scheduled to take effect on June 1). The retaliation, coupled with President Trump’s earlier warning that China should not do so, was taken by investors as a sign that 25% tariffs on all goods imported from China will soon be in place. As we go to press, the S&P 500, Hang Seng China Enterprises Index, and the CSI 300 are down 3.5%, 7%, and 6.9%, respectively, since President Trump’s May 5 tweet (Chart 1). Chart 1Investors Are Starting To Price In 25% Tariffs Affecting All U.S.-China Trade
Investors Are Starting To Price In 25% Tariffs Affecting All U.S.-China Trade
Investors Are Starting To Price In 25% Tariffs Affecting All U.S.-China Trade
Stimulus Minus Shock Holding all else equal, the events of the past two weeks are strictly negative for Chinese economic growth and would thus justify a decisively bearish outlook for Chinese stock prices after the rally that has taken place over the past six months. However, all is not equal, because a substantial deterioration in the export outlook will invariably cause a response from Chinese policymakers. Over the coming few weeks, global investors are likely to remain highly focused on developments and announcements related to the trade conflict. But at this point, our geopolitical team believes that the conclusion of an actual trade agreement this year is now only a 40% probability. This underscores that China-exposed investors should, for the purposes of investment strategy, simply assume that the U.S. proceeds with 25% tariffs on all imports from China, and should broaden their focus to the outcome of a simple formula that describes the potential net outcome of this event. Two simple scenarios concerning this formula are outlined below: Scenario 1 (Bullish): Stimulus – Shock > 0 Scenario 2 (Bearish): Stimulus – Shock ≤ 0 In scenario 1, the impact of China’s reflationary efforts more than offsets the negative shock to aggregate demand from the sharp decline in exports to the U.S. In this scenario, investors should actually have a bullish cyclical outlook for China-related assets, even if the near-term outlook is deeply negative. Scenario 2 denotes a bearish outcome where China’s reflationary response is not larger than the magnitude of the shock, which includes a circumstance where the impacts are exactly offsetting (because of the higher uncertainty, and thus risk premium, that this would entail). “Solving” The Formula In order to “solve” this formula, investors need answers to the following three questions: What is the size and disposition of the likely shock to China’s economy in a full-tariff scenario? What kind of reflationary response is required in order to offset this shock? What are the odds that policymakers will deliver the required response? Simulated and empirical estimates of a 25% increase in tariffs affecting all U.S.-China trade suggest a sizeable economic impact. Charts 2 & 3 provide the IMF’s perspective on the first question. The charts show the simulated impact of a 25% increase in tariffs affecting all U.S.-China trade, and they estimate the near-term impact for China to be -1.25% for real GDP (-0.5% over the long-run) and -3.5% for real exports (-4.5% to -5.5% over the long run).
Chart 2
Chart 3
A recent IMF working paper came up with a more benign estimate of the first year impact, but a sizeable second year impact and a similar estimate of the long-term ramifications of tariff increases.2 Using a dataset with wide time and country coverage, the aggregate results of the study imply that Chinese output is only likely to fall about 0.2% in the year following the tariff increase. However, the cumulative shock to output increased sharply to roughly 1.6% in the second year of the tariff increase, with a negative yearly impact to output persisting for 5 years (with an average annual impact of -0.6% over the whole period, somewhat higher than the estimates shown in Charts 2 & 3). At the 90% confidence interval, the author’s estimates show that a tariff increase of this magnitude would imply a -1.7% average impact on output per year in the first two years following the increase. Chart 4The IMF's Shock Estimates Suggest A Serious Hit To China's Economy
The IMF's Shock Estimates Suggest A Serious Hit To China's Economy
The IMF's Shock Estimates Suggest A Serious Hit To China's Economy
In order to answer the second question, investors need to have some sense of the relative magnitude of the estimates noted above. Chart 4 provides some perspective and highlights that the estimates above, were they to materialize, would do two things: Taking Chinese real GDP data at face value, it would cause the largest deceleration in China’s real GDP growth rate since 2012, when the economy slowed significantly and authorities responded forcefully. Based on the most recent data for Chinese real export growth, a 3.5% deceleration in export volume would push its growth rate to its lowest level since the global financial crisis. In practice, we doubt that China’s reported real GDP growth rate accurately reflects what occurred in 2015, and it is very possible that a similar deceleration happened in that year. However, economic similarity to the 2015/2016 episode implies that a similar policy response may also be required, a proposition that is supported by our MSCI China Index earnings recession model. Table 1 shows a set of earnings recession probabilities, based on a model that we presented in two recent reports.3 The scenarios express the odds as a function of new credit to GDP and our calculation of China’s export weighted exchange rate, and assume a substantial decline in the new export orders component of the official manufacturing PMI, and flat momentum in forward earnings. Table 1Our Earnings Recession Model Suggests That A 2015/2016 Style Response Is Needed To Counter This Shock
Simple Arithmetic
Simple Arithmetic
The table clearly highlights that a significant further acceleration in new credit to GDP, coupled with a meaningful decline in the exchange rate, is needed in order to stabilize the earnings outlook. We have previously related stability in the outlook for earnings to stability in the economy itself, given the close correlation between Chinese investment-relevant economic activity and the earnings cycle (Chart 5). Given that new credit to GDP peaked at 31.5% during the 2015/2016 episode, it seems reasonable to conclude that a 2015/2016-style policy response will again be required in order for policymakers to be confident that the shock will be overcome. Policymaker Preferences Vs. Constraints This brings us to our third question: What are the odds that policymakers will deliver the stimulus required to confidently overcome the upcoming shock? It seems reasonable to conclude that a 2015/2016-style policy response will again be required in order for policymakers to be confident that the shock will be overcome. If the answer was only dependent on the preferences of policymakers, the odds would be low. China has relied heavily on credit to stimulate its economy over the past decade, and Chart 6 highlights that this has come at a high cost. The BIS’ estimate of the debt service ratio of China’s private non-financial sector is already extraordinarily high relative to other countries, and another round of meaningful re-leveraging will just make this problem even worse. Chart 5Earnings Stability = Economic ##br##Stability
Earnings Stability = Economic Stability
Earnings Stability = Economic Stability
Chart 6Further Leveraging Will Undoubtedly Make A Big Problem Even Worse
Further Leveraging Will Undoubtedly Make A Big Problem Even Worse
Further Leveraging Will Undoubtedly Make A Big Problem Even Worse
We documented in detail how this has created the risk of a debt trap for China’s state-owned enterprises in an August Special Report,4 and have presented evidence arguing that China’s policymakers appear to have good economic reasons to try and shift China’s economy away from extremely high rates of investment towards more consumption.5 This implies that restraining credit growth to avoid further leveraging has been a reasonable policy objective during periods of relative economic stability. However, policy decisions cannot be made in a vacuum, and this is true even in the case of China. As such, instead of preferences, investors should be focused on policymaker constraints in judging likely policy actions. Given the potential for second round effects, Chinese policymakers need to calibrate their policy response to ensure a positive net impact of the stimulus minus the shock. In our view, three factors point to the conclusion that Chinese policymakers face serious economic constraints in setting their policy response: Charts 2-4 highlighted that 25% tariffs on all U.S.-China trade would constitute a meaningful shock, but it is also the case that this shock would be coming at a time when Chinese economic momentum is already relatively weak. This suggests that policymakers will have to act quickly and decisively to put a floor under economic activity. Charts 7 & 8 suggest that there are meaningful second round effects on Chinese domestic investment from external sector shocks, which raises the possibility that the impact on Chinese economic activity may be larger than Charts 2-4 suggest. Chart 7 shows that while the contribution to official real GDP growth from net exports is small, Chart 8 shows that past changes in net export contribution are reasonably correlated with subsequent changes in the contribution to growth from gross capital formation. While it is possible that this relationship is not actually causal, taking it at face value implies that the IMF’s estimate of the impact on output could be exceeded if the contribution to growth from net exports declines by 0.4% or more (holding the contribution to growth from final consumption expenditure constant). Since 2018’s change in net export contribution declined by three times this amount (1.2%), the downside risks to domestic investment from effectively quadrupling U.S. import tariffs are clear. China does not have a flexible labor market, and its political system is highly sensitive to significant job losses. Chart 9 shows that the employment situation has already seriously deteriorated in lockstep with actual economic activity, further underscoring the need for policymakers to act urgently.
Chart 7
Chart 8
Chart 9The Employment Situation Is Already Deteriorating, And Will Do So Further
The Employment Situation Is Already Deteriorating, And Will Do So Further
The Employment Situation Is Already Deteriorating, And Will Do So Further
We are open to the idea that policymakers may be able to devise a stimulative response of similar reflationary magnitude to the 2015/2016 episode without resorting to a major credit overshoot, but we are currently unable to articulate what it might be. This is an area of ongoing research for BCA’s China Investment Strategy service, but for now we assume that a credit overshoot remains the ultimate line of defense for China’s policymakers that will be deployed if the pursuit of alternative strategies fail to quickly stabilize economic activity. Investment Strategy Conclusions In our view, focusing on policymaker constraints rather than their preferences is much more likely to guide investors towards the right strategy conclusions over a 6-12 month time horizon. However, in the near-term, policy mistakes can occur, and are much more likely to occur if policymakers react to the imposition of constraints rather than anticipate their arrival. Over the coming three months, we see meaningful odds that Chinese policymakers remain reluctant to allow another episode of significant releveraging in the economy. If we are correct in our assessment of the damage that the tariff shock is likely to cause, this would set up a classic market “riot”, where policymakers are forced by financial markets to capitulate and respond forcefully to the seriousness of the economic situation. Further RMB weakness is likely. Investors should hedge their exposure and go long USD-CNH. Chart 10Investors Have A Green Light To Bet On A Lower RMB
Investors Have A Green Light To Bet On A Lower RMB
Investors Have A Green Light To Bet On A Lower RMB
Given this, we would not recommend a long position in Chinese stocks, either in absolute terms or relative to the global benchmark, for investors with a time horizon of less than 3 months. However, over a cyclical (i.e. 6-12 month) time horizon, we would recommend staying long/overweight on the basis that policymakers will ultimately deliver the stimulus required to more than offset the upcoming shock to external demand. This means that our long MSCI China Index, MSCI China A onshore index, and MSCI China Growth index trades relative to the global benchmark are explicitly cyclical in orientation, and may suffer meaningful further losses over the coming few months before ultimately recovering. As a final point, Table 1 highlighted that a meaningful decline in the exchange rate is likely required in order to stabilize the earnings outlook. Chart 10 shows that currency weakness persisted well past the trough in relative Chinese investable equity performance during the 2015/2016 episode, and we would expect a similar result in the current environment given the nature of the shock. As such, we recommend investors hedge the inherent RMB exposure from a long US$ cyclical position in Chinese stocks by opening a long USD-CNH trade today, with high odds of a break above 7 in the coming weeks. Jonathan LaBerge, CFA, Vice President Special Reports jonathanl@bcaresearch.com Footnotes 1 The first, second, third “round” of tariffs reference the $50/$200/$300 billion tranches of imported goods subject to U.S. tariff announcements since last summer. 2 IMF Working Paper WP/19/9, “Macroeconomic Consequences of Tariffs”, by Davide Furceri, Swarnali A. Hannan, Jonathan D. Ostry, and Andrew K. Rose. 3 Please see China Investment Strategy Special Report “Six Questions About Chinese Stocks,” dated January 16, 2019, and Weekly Report “A Gap In The Bridge,” dated January 30, 2019 available at cis.bcaresearch.com. 3 Please see China Investment Strategy Special Report “Chinese Policymakers: Facing A Trade-Off Between Growth And Leveraging,” dated August 29, 2018, available at cis.bcaresearch.com. 4 Please see China Investment Strategy Weekly Report “Is China Making A Policy Mistake?,” dated October 31, 2018, available at cis.bcaresearch.com. Cyclical Investment Stance Equity Sector Recommendations
Highlights Even if higher tariffs are imposed tonight, there is a good chance that China and the U.S. will reach a temporary trade truce over the coming weeks. Contrary to President Trump’s assertion, U.S. companies and consumers have borne all of the costs of the tariffs. With the next U.S. presidential campaign less than one year away, the self-described “master negotiator” will actually need to prove that he can negotiate a trade deal. If trade talks do collapse, the Chinese will ramp up credit/fiscal stimulus “MMT style,” thus providing a cushion under global growth and risk assets. In fact, there is a very high probability that the Chinese will overreact to the risks to growth, much like they did in 2009 and 2016. Investors should remain overweight global equities for the next 12 months, while positioning for a modestly weaker U.S. dollar and somewhat higher global bond yields. Feature Tariff Man Strikes Again Hopes for a quick end to the trade war were dashed last Sunday. President Trump threatened to hike tariffs on $200 billion of Chinese goods and begin proceedings to tax the remaining $325 billion of imports currently not subject to tariffs. Although details remain sketchy, U.S. Trade Representative Robert Lighthizer apparently informed the president that the Chinese were backtracking on prior commitments to change laws dealing with issues such as market access, forced technology transfers, and IP theft.1 This infuriated Trump. Trump’s announcement came just as Vice Premier Liu He and a 100-person Chinese trade delegation were set to depart for Washington. As BCA’s Chief Geopolitical Strategist Matt Gertken has noted, the relationship between the two sides was deteriorating even before Trump fired his latest salvo.2 The Chinese government was incensed by the U.S. request that Canada detain and extradite a senior official at Huawei, a top Chinese telecom firm. For its part, the Trump Administration was irked by China’s questionable enforcement of Iranian oil imports, the escalation of Chinese military drills around Taiwan, and the perception that China had not done enough to keep North Korea in check following the failed summit with Kim Jong-Un in Hanoi. It would be naïve to expect these ongoing geopolitical issues to fade anytime soon. The world is shifting from a unipolar to a multipolar one (Chart 1). In an environment where there are overlapping spheres of influence, geopolitical tensions will rise. Chart 1The Era Of Unipolarity Is Over
The Era Of Unipolarity Is Over
The Era Of Unipolarity Is Over
That said, stocks still managed to advance during the first four decades of the post-war era even though the U.S. and the Soviet Union were at each other’s throats. What investors need today is some reassurance that the current trade spat will not degenerate into a full-out trade war that undermines global commerce. Ultimately, we think they will get this reassurance for the same reason that the Soviets and Americans never ended up lobbing missiles at each other: It would have been a lose-lose proposition to do so. Yet, the path from here to there will be a bumpy one. Investors should expect heightened volatility over the coming weeks. As It Turns Out, Trade Wars Are Neither Good Nor Easy To Win There was never any doubt that Wall Street would suffer from a trade war. What was less clear at the outset was the impact that higher tariffs would have on Main Street. Despite President Trump’s claim that the tariffs paid to the U.S. Treasury were “mostly borne by China,” the evidence suggests that close to 100% of the tariffs were, in fact, borne by U.S. companies and consumers. What investors need today is some reassurance that the current trade spat will not degenerate into a full-out trade war that undermines global commerce. A recent NBER paper compared the prices of Chinese imports that were subject to tariffs and similar goods that were not.3 Had Chinese producers been forced to bear the cost of the tariffs, one would have expected pre-tariff import prices to decline. In fact, they didn’t. The tariffs were simply absorbed by U.S. importers in the form of lower profit margins and by U.S. consumers in the form of higher selling prices. This does not mean that Chinese producers escaped unscathed. The paper showed that imports of tariffed goods dropped sharply as U.S. demand shifted away from China and towards domestically-produced goods and imports from other countries. Chart 2Support For Protectionism Rises When Unemployment Is High
Support For Protectionism Rises When Unemployment Is High
Support For Protectionism Rises When Unemployment Is High
One might think that the decision to divert spending from Chinese goods to, say, Korean goods would be irrelevant for U.S. welfare. However, a simple thought experiment reveals that this is not the case. Suppose that a 10% tariff raises the price of an imported good from $100 to $110. If the consumer buys this good from China, the consumer will lose $10 while the U.S. government will gain $10, implying no loss in welfare. However, suppose the consumer buys the same good, tariff-free, from Korea for $105. Then the consumer loses $5 while the government gets no additional revenue, implying a net loss in national welfare of $5. Things get trickier when we consider the case where the consumer buys an identical domestically-produced good for say, $107, in order to avoid the tariff. If the economy is suffering from high unemployment, the additional demand will boost GDP by $107. The consumer who bought the domestically-produced good will be worse off by $7, but wages and profits will rise by $107, leaving a net gain of $100 for the economy. When unemployment is high, beggar-thy-neighbor policies make more sense. This is a key reason why support for protectionism tends to rise when unemployment increases (Chart 2). Today, however, the U.S. unemployment rate is at a 49-year low. To the extent that tariffs shift demand towards locally sourced goods, this is likely to require that workers and capital be diverted from other uses. When this occurs, there is no change in overall GDP. Within the context of the example above, all that would happen is that consumers would lose $7, reducing national welfare by the same amount. In fact, it is even worse than that. The example above does not include the impact on welfare from any resources that would need to be squandered from having to shift workers and capital equipment from sectors of the economy that lose from higher tariffs to those that gain from them. Nor does the example include the adverse impact on national welfare from any retaliatory policies. Ironically, while the evidence suggests that U.S. tariffs did not have much effect on Chinese import prices, it does appear that Chinese tariffs had an effect on U.S. export prices. Agricultural prices are highly sensitive to market conditions. Chart 3 shows that grain and soybean prices fell noticeably in 2018 on days when trade tensions intensified. This pattern has continued into the present. It is not surprising that Senators Chuck Grassley and Joni Ernst, along with other senior Iowa politicians, penned a letter to President Trump imploring him to reach a trade deal in order to help the state’s farming communities.4
Chart 3
China’s Secret Weapon: MMT To be fair, the arguments above do not account for the strategic possibility that the threat of punitive tariffs forces the Chinese to open their markets and refrain from corporate espionage and IP theft. If Trump is able to wrangle these concessions from the Chinese, then he could remove the tariffs, creating an environment more favorable to American corporate interests. The problem is that China will resist conceding so much ground. True, a trade war would hurt Chinese exporters much more than it would hurt U.S. firms. However, China is no longer as dependent on trade as it once was. Chinese exports to the U.S. account for only 3.6% of GDP, down from 7.3% of GDP in 2006 (Chart 4). China also has plenty of tools to support the economy in the event of a trade war. Chief among these is credit/fiscal stimulus. As we discussed three weeks ago, investors are underestimating China’s ability to ramp up credit growth in order to support spending throughout the economy.5 High levels of household savings have kept interest rates below the growth rate of the economy (Chart 5). When GDP growth exceeds the interest rate at which the government can borrow, even a persistently large budget deficit will produce a stable debt-to-GDP ratio in the long run. Chart 4China Is No Longer As Dependent On Trade With The U.S. As It Once Was
China Is No Longer As Dependent On Trade With The U.S. As It Once Was
China Is No Longer As Dependent On Trade With The U.S. As It Once Was
Chart 5China: High Levels Of Household Savings Have Kept Interest Rates Below The Growth Rate Of The Economy
China: High Levels Of Household Savings Have Kept Interest Rates Below The Growth Rate Of The Economy
China: High Levels Of Household Savings Have Kept Interest Rates Below The Growth Rate Of The Economy
The standard counterargument is that governments cannot control the interest rate at which they borrow. This means that they run the risk of experiencing a vicious circle where high debt levels cause bond yields to rise, making it more difficult for the government to service its debt. This could lead to even higher bond yields and, eventually, default. However, this argument applies only to countries that do not issue their own currencies. Since a sovereign government can always print cash to pay for the goods and services, it can never run out of money. Chinese exports to the U.S. account for only 3.6% of GDP, down from 7.3% of GDP in 2006. The main reason a sovereign central bank would wish to raise rates is to prevent the economy from overheating. If a rising fiscal deficit is the consequence of a decline in private-sector spending (which is something that would likely happen during a trade war), there is no risk of overheating, and hence, there is no need to raise interest rates. We are not big fans of Modern Monetary Theory, but at least on this point, the MMT crowd is right while most analysts are wrong. Investment Conclusions It is impossible to say with any confidence what the next few days will bring on the trade front. If the Trump Administration’s allegation that the Chinese backtracked on prior commitments turns out to be true, it is possible that some of them will be reinstated, thus allowing the negotiations to resume. This could prompt Trump to offer a “grace period” to the Chinese of one or two weeks later tonight before scheduled tariff hikes are set to occur. If tariffs do go up, what should investors do? The answer depends on how much stocks fall in response to the news. If global equities were to decline by more than five percent, our inclination would be to get more bullish. There are two reasons for this. First, the failure to reach a deal this week does not mean that the talks will irrevocably break down. The point of Trump’s tariffs was never to raise revenue. It was to force the Chinese into a trade agreement that served America’s interests. With less than a year to go before the presidential campaign kicks into high gear, the self-described “master negotiator” needs to prove to the American public that he can actually negotiate a trade deal. This means some sort of an agreement is more likely than not. Second, as noted above, China will respond aggressively with fresh stimulus if the U.S. slaps tariffs on its exports. This will help cushion global growth and risk assets. Infrastructure spending tends to be more commodity intensive than manufacturing production. Thus, even if the Chinese government exactly offsets the loss of manufacturing exports with additional infrastructure spending, the net effect on global growth will probably be positive. China will respond aggressively with fresh stimulus if the U.S. slaps tariffs on its exports. In reality, there is a very high probability that the Chinese will do more than that. As the 2009 and 2016 episodes illustrate, when faced with a clear downside shock to growth, the government calibrates the policy response based on the worst-case scenario. Not only would a bout of hyperstimulus provide downside protection to the Chinese economy against a growth shock, it would also give the government more negotiating leverage with Trump. After all, it is much easier to brush away threats of punitive tariffs if you have an economy that is humming along. Investors should remain overweight global equities for the next 12 months, while positioning for a modestly weaker U.S. dollar and somewhat higher global bond yields. Peter Berezin, Chief Global Strategist Global Investment Strategy peterb@bcaresearch.com Footnotes 1 David Lawder, Jeff Mason, and Michael Martina, “Exclusive: China backtracked on almost all aspects of U.S. trade deal – sources,” Reuters, May 8, 2019. 2 Please see Geopolitical Strategy Special Alert, “U.S. And China Get Cold Feet,” dated May 6, 2019. 3 Mary Amiti, Stephen J. Redding, and David E. Weinstein, “The Impact of the 2018 Trade War on U.S. Prices and Welfare,” NBER Working Paper No. 25672, (March 2019). 4 “Young, Ernst Lead Iowa Delegation in Letter Urging President Not to Impose Tariffs,” Joni Ernst United States Senator For Iowa, March 7, 2018. 5 Please see Global Investment Strategy Weekly Report, “Chinese Debt: A Contrarian View,” dated April 19, 2019. Strategy & Market Trends MacroQuant Model And Current Subjective Scores
Chart 6
Tactical Trades Strategic Recommendations Closed Trades
The BoC places a lot of weight on the Business Outlook Survey (BoS) in determining its economic forecasts, and in setting monetary policy. Thus, it is no surprise that in the official statement following the April 24 monetary policy meeting, the BoC…
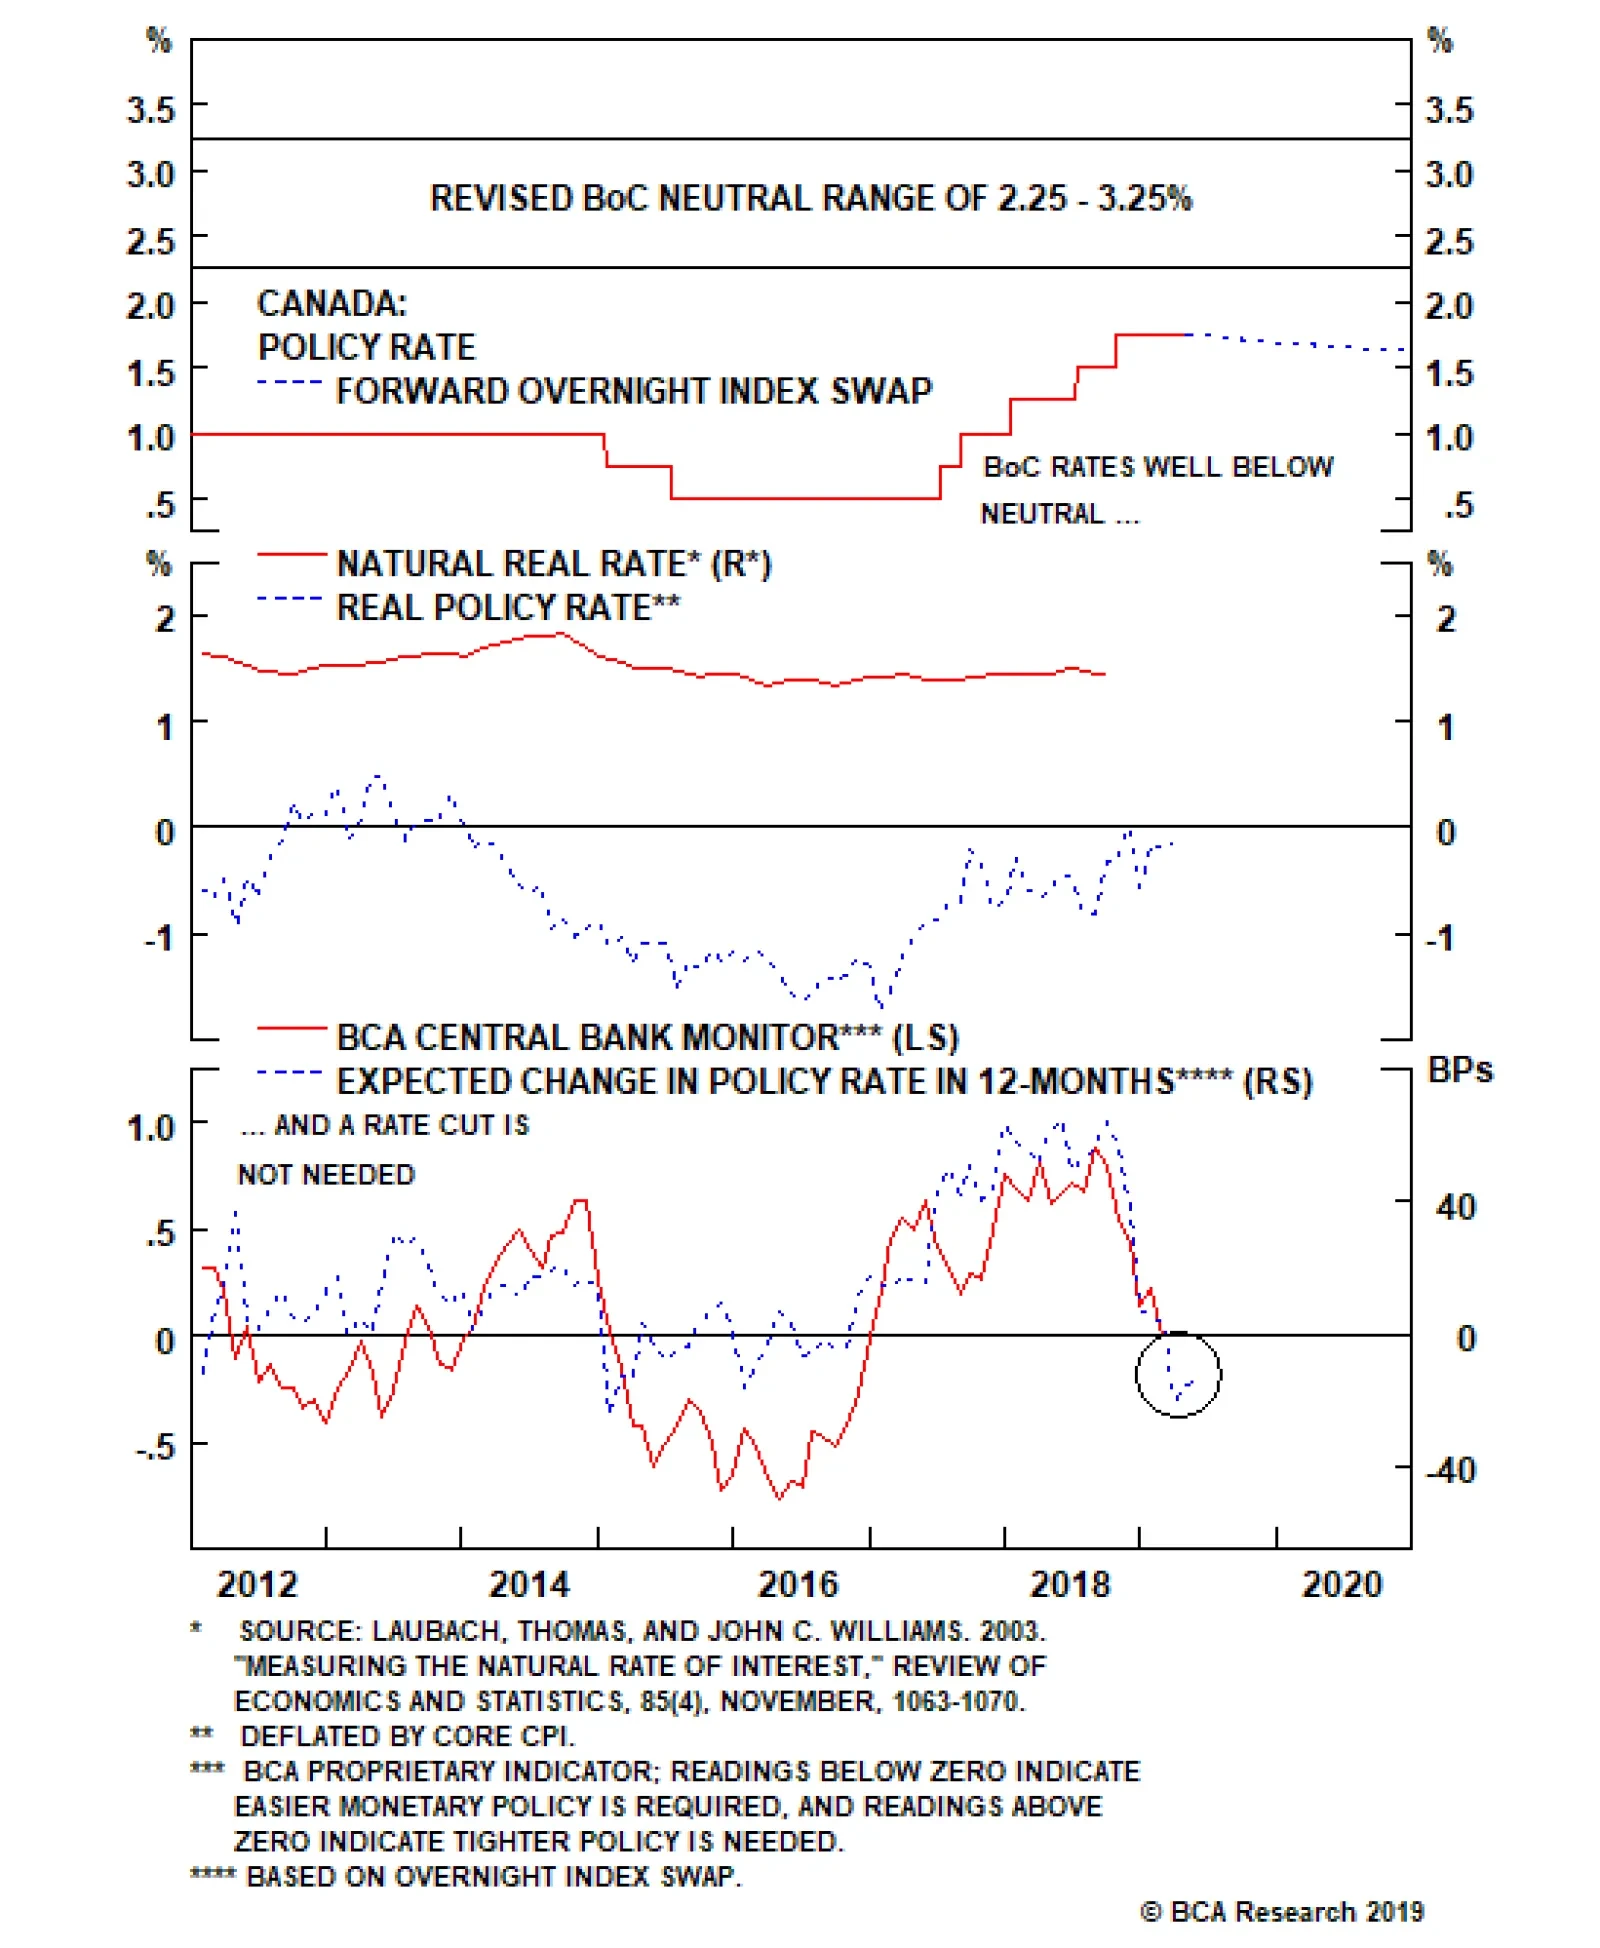
The problem for the BoC is that its policy rate of 1.75% remains well below its own estimated neutral range, which is now 2.25%-3.25%. A similar message comes when looking at the neutral real rate (“r-star”) estimate for Canada produced by the New York Fed,…
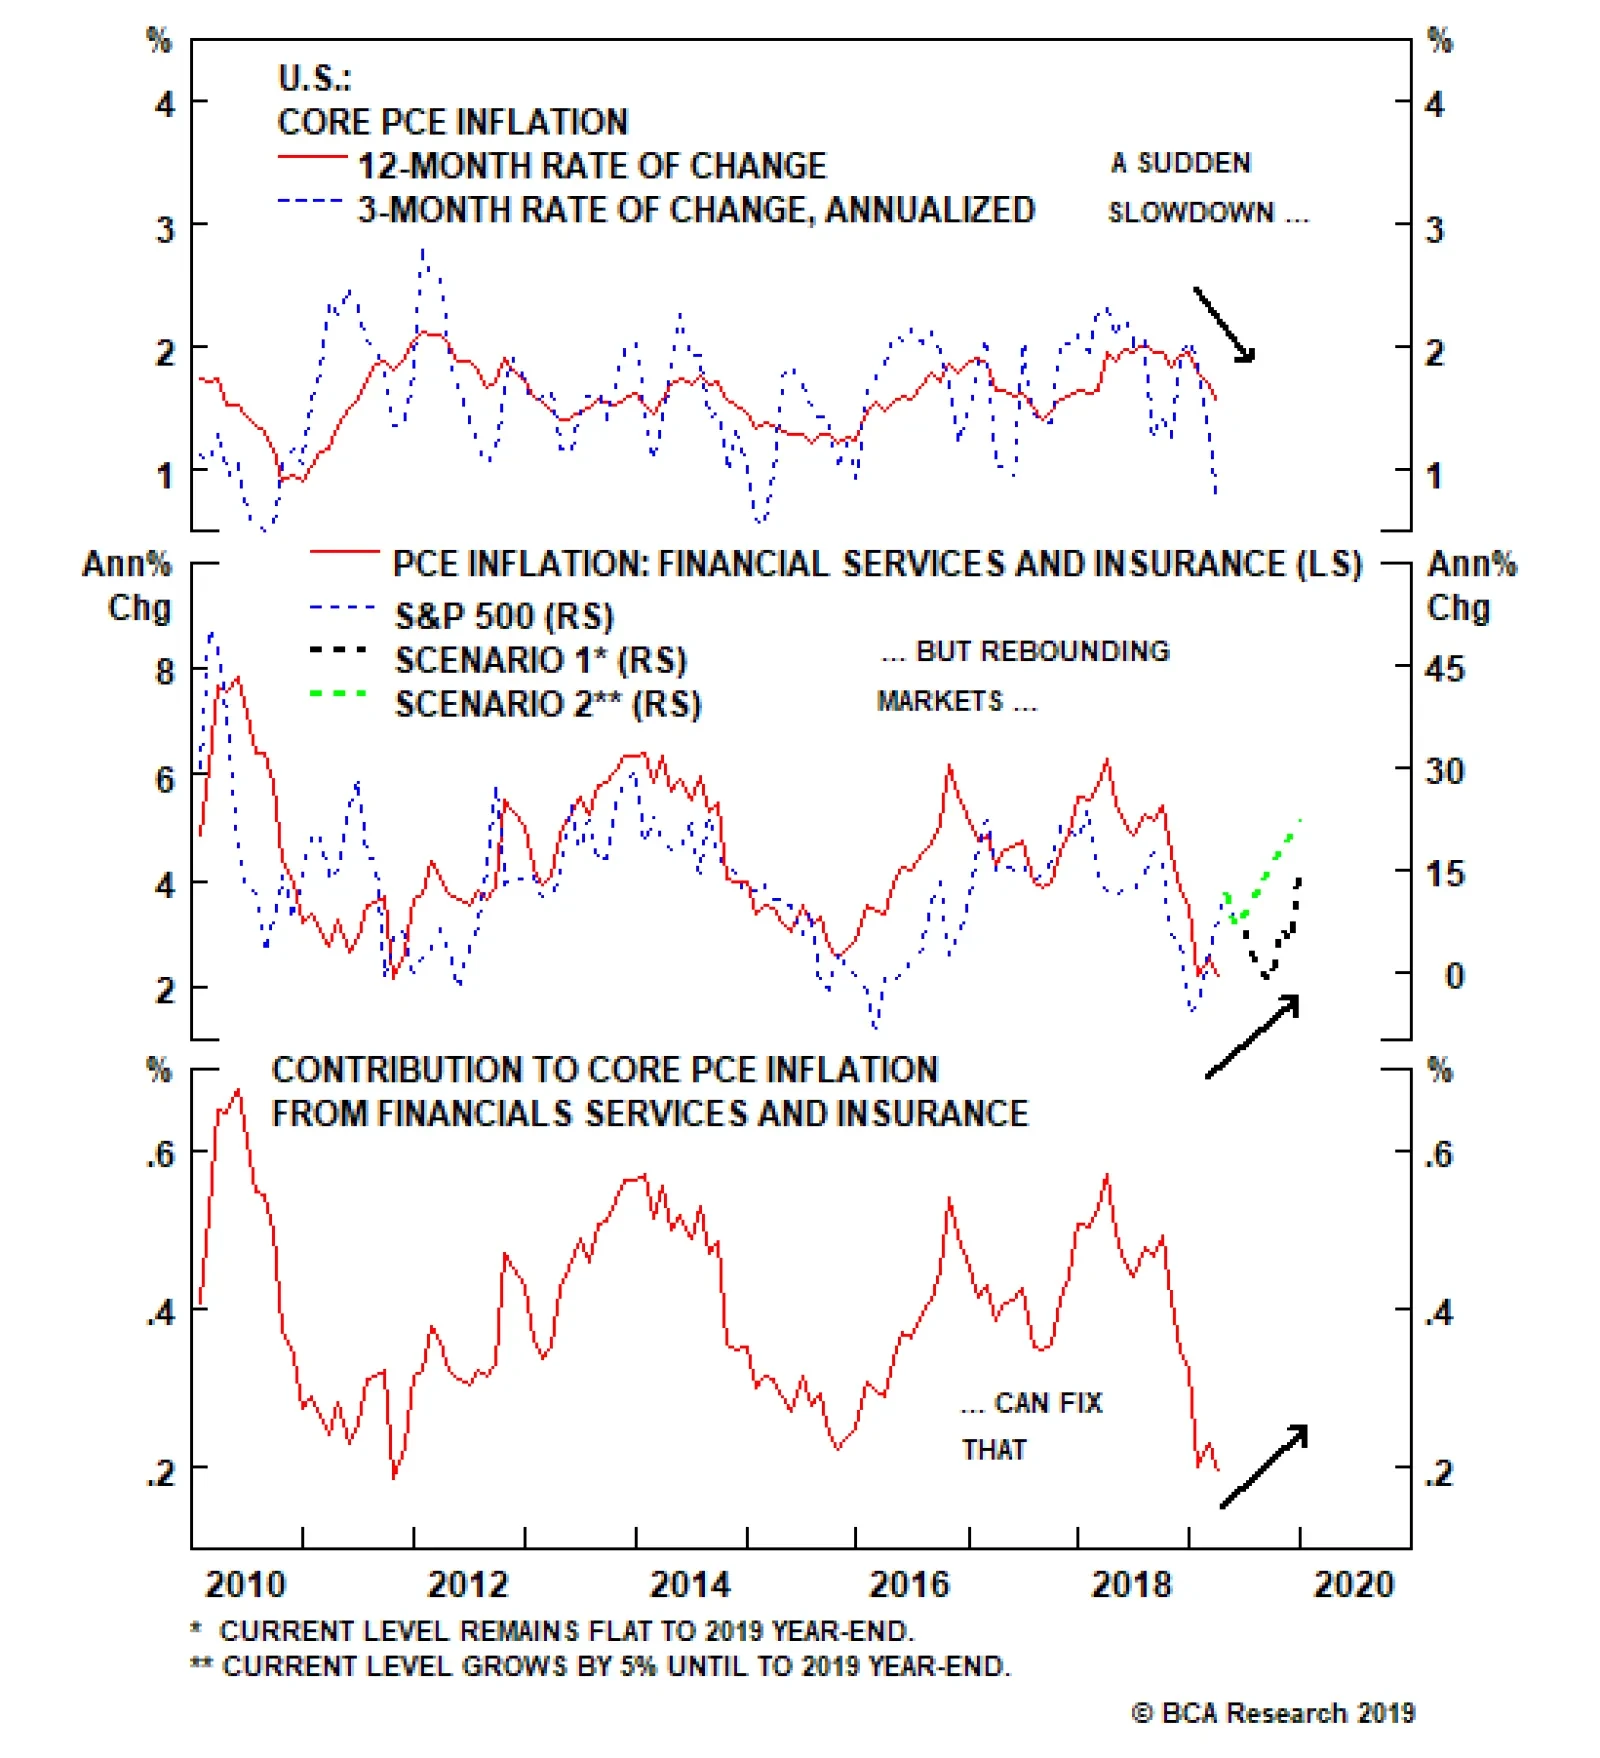
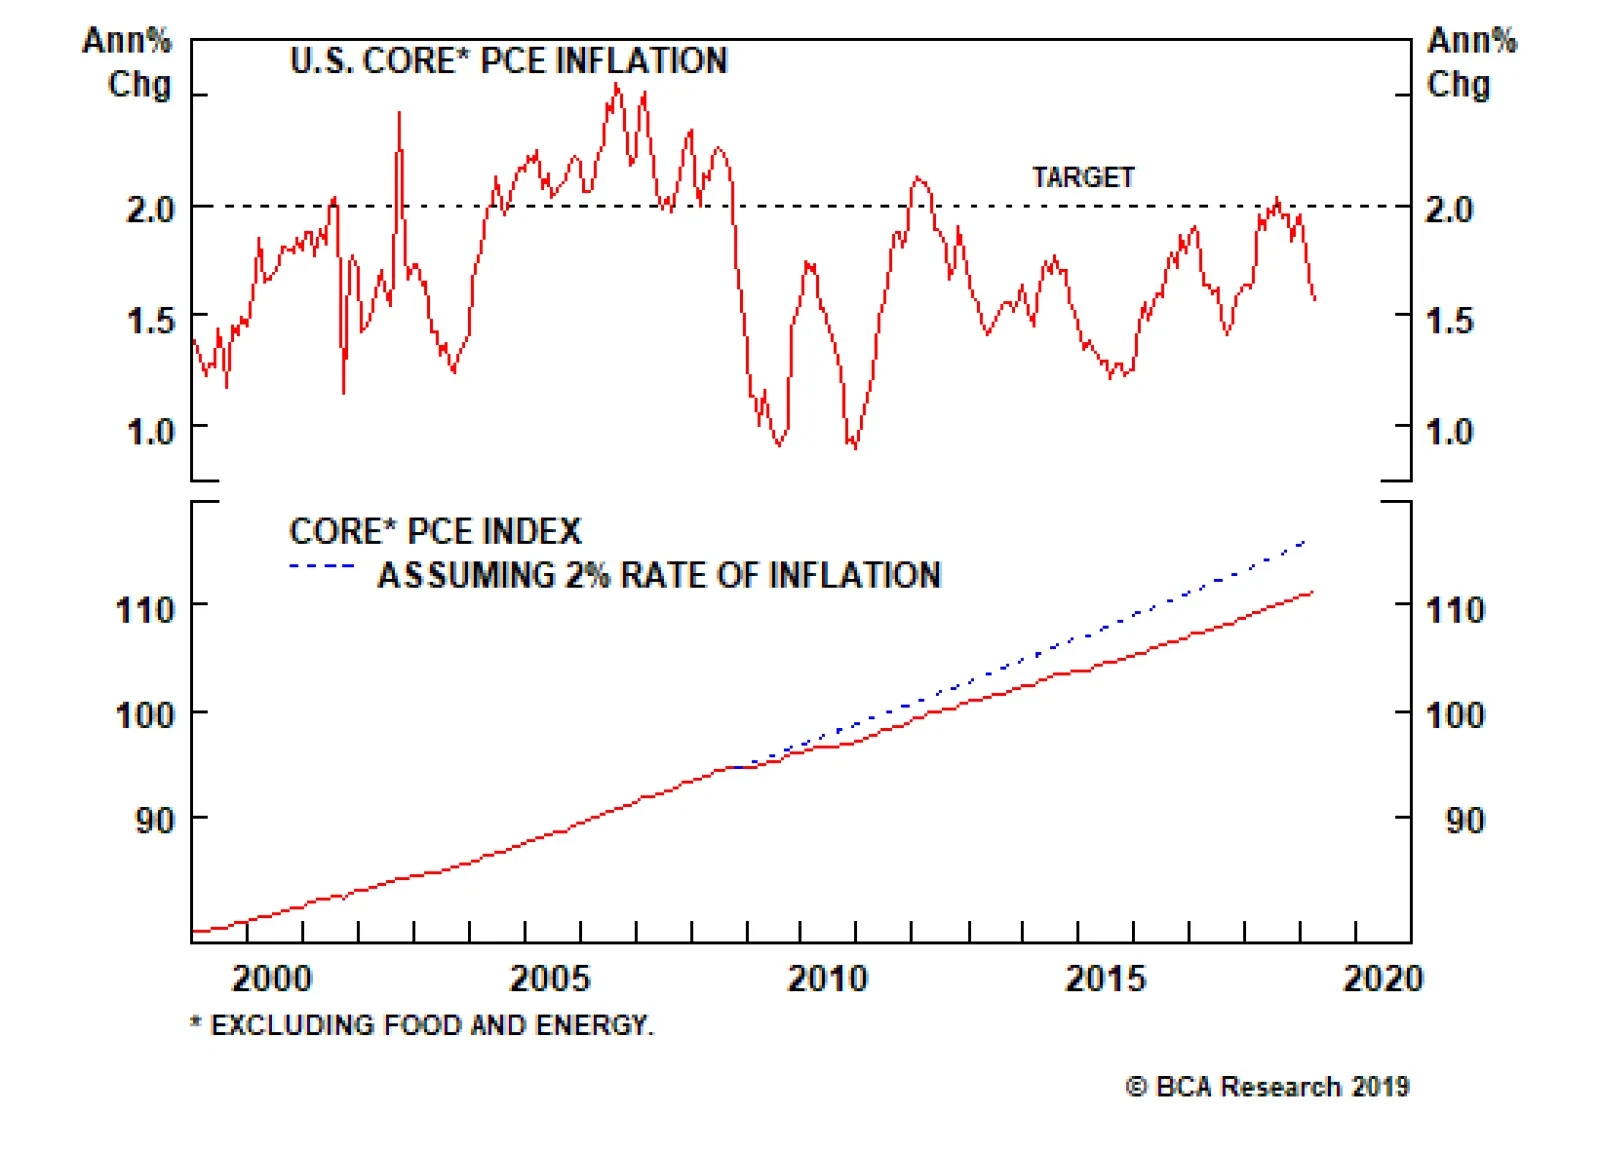
In 2018, prior to the year-end correction in U.S. equity markets, the contribution to core PCE inflation from the Financial Services category was a steady 0.5-0.6 percentage points. After the market rout, that contribution has fallen to 0.2 percentage points,…
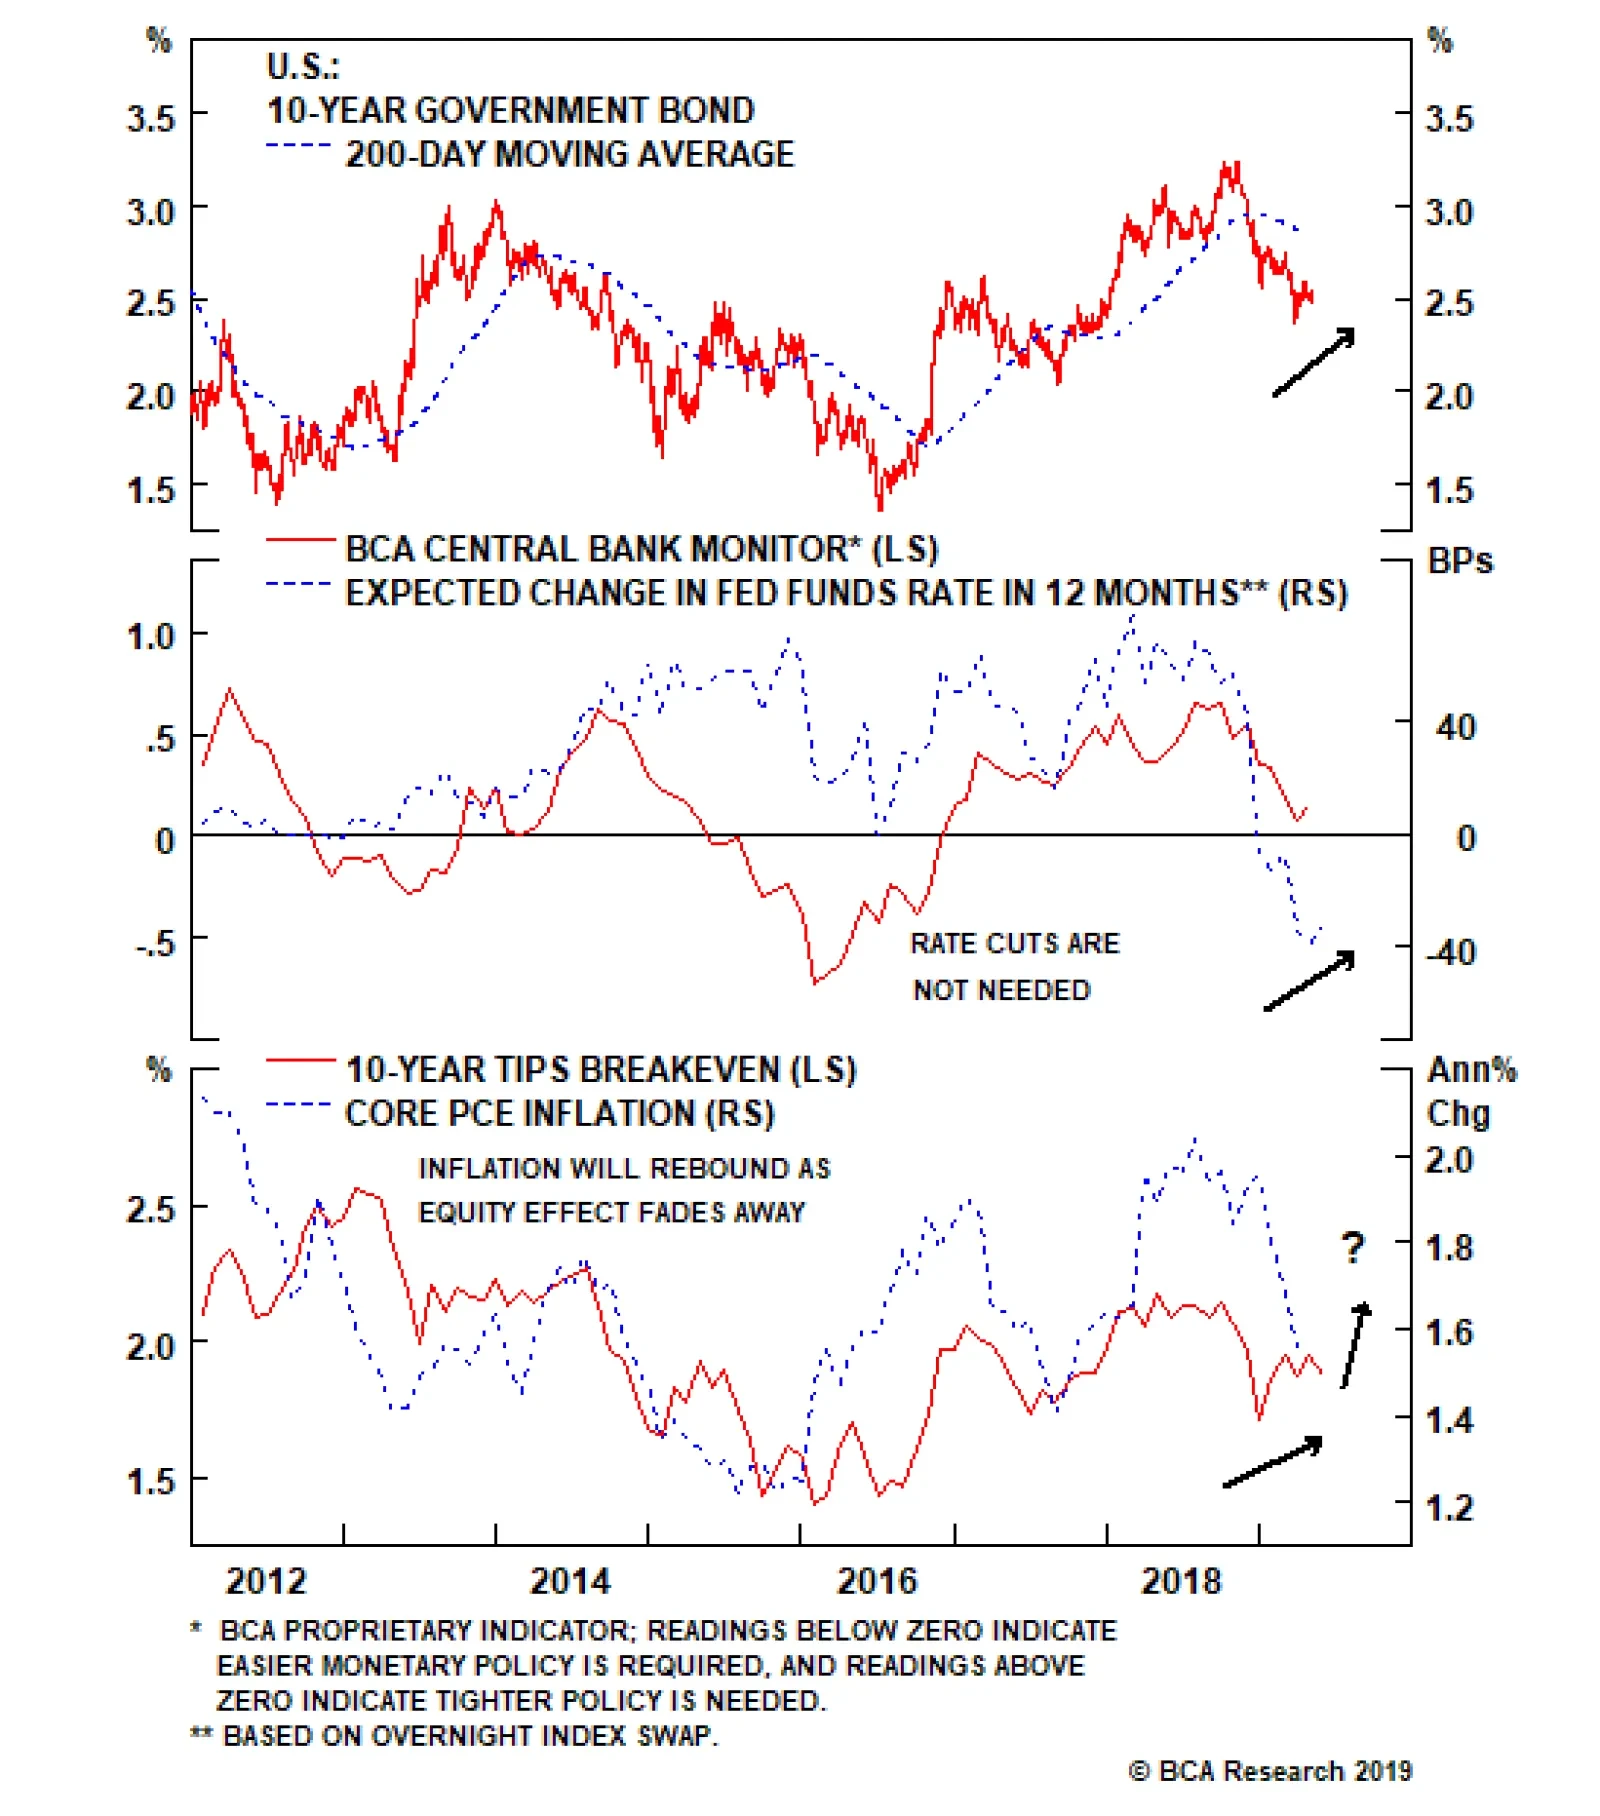
The official statement acknowledged that U.S. inflation was running below the 2% target, but Fed Chair Jerome Powell later described that inflation shortfall as “transitory” and expected to reverse. Powell standing his ground so firmly was a sharp rebuke…
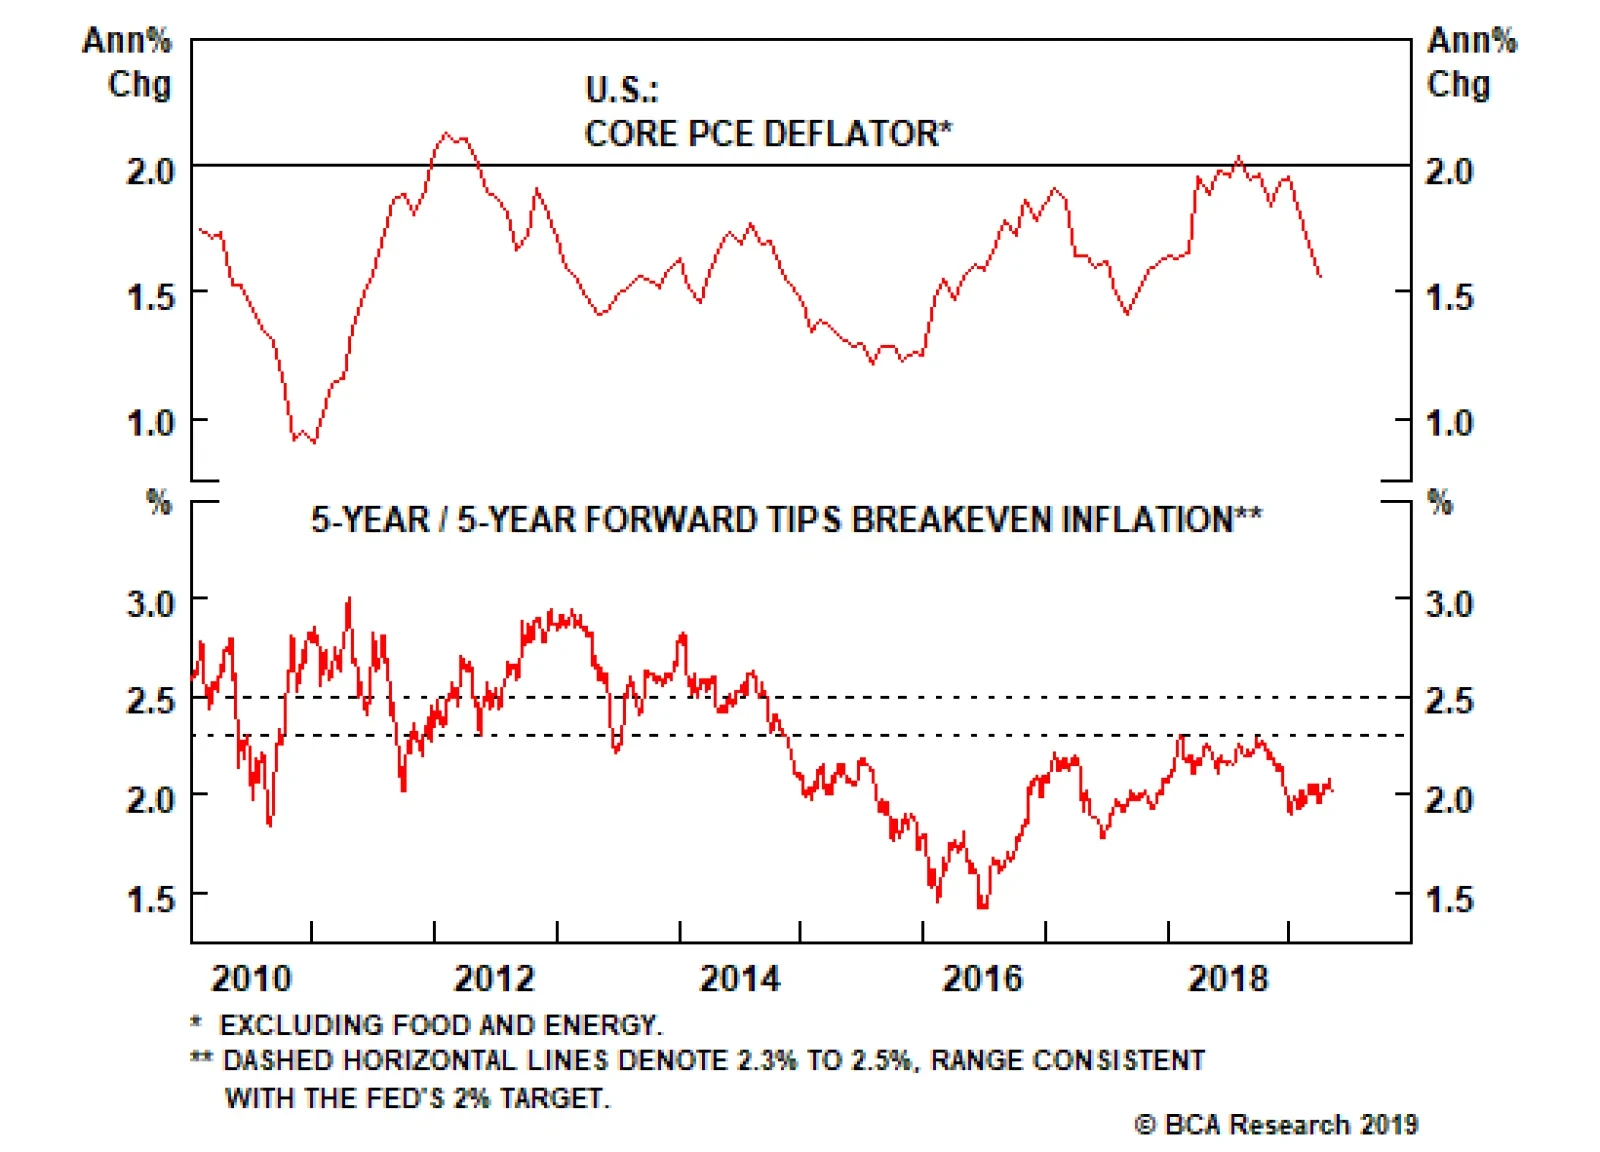
If inflation runs persistently above or below 2 percent, then the Fed would be forced to adjust its policy stance to nudge it back towards target. If inflation’s deviation from target is only transitory, it means that it will return to target even if the…
Under the Fed’s existing framework, its “symmetric” inflation target is not supposed to be backward-looking. Symmetry simply means that the Fed targets 2% inflation every year, allowing for an equal probability of inflation ending up overshooting its mark as…
The rationale is straightforward: If the neutral rate turns out to be higher than expected and inflation starts to accelerate, central banks can always tighten monetary policy. In contrast, if the neutral rate is very low, the decision to raise rates could…