Developed Countries

Executive Summary Rampant talk of a wage-price spiral is premature, ginned up by media reports about union organizing successes and union negotiators’ wins. Recent agreements negotiated by unions have not lit an inflationary fuse, as all major compensation series are contracting in real terms. The full sweep of US labor market history, buttressed by the history of the last four decades, suggests that labor has a steep hill to climb to reverse its fortunes. The president has a bully pulpit and the executive branch has a lot of enforcement levers at its disposal, but the judicial and legislative branches are powerful counterweights and the state-level climate is decidedly unfriendly to workers. Labor could regain the upper hand but we’ve been underwhelmed by its victories thus far in the pandemic. We will not believe that it’s turned the tide until we see definitive evidence. The Labor Tide Is Out
The Labor Tide Is Out
The Labor Tide Is Out
Bottom Line: Investors assume that a wage-price spiral is inevitable, or has already begun, at their own peril. The playing field is still heavily tilted in employers’ favor and mainstream media has exaggerated labor’s pandemic gains. Feature Dear Client, This Special Report, updating and elaborating upon our view of the likelihood of a US wage-price spiral, will be our last written output until Monday, May 23rd. We are vacationing this week and we will be holding our quarterly webcast on May 16th in lieu of a publication. Please join us with your questions on the 16th to make it a fully interactive event. Best regards, Doug Peta The term “wage-price spiral” is being increasingly bandied about by the media, broker-dealers and independent strategists and economists. The talk has been prevalent enough that a significant proportion of investors seem to believe a spiral is inevitable if it hasn’t already begun. There is more to the history of US labor market relations than the stagflation seventies and early eighties, however, and we are tempted to see the early-thirties-to-late-seventies New Deal era as the anomaly and the Reagan era that began in 1981 as the rule. Much may hinge on just how much the administration of the “most pro-union president you’ve ever seen” will be able to accomplish when it faces the prospect of the loss of its Congressional majorities in six months. After restating our framework for thinking about the origins and outcomes of strikes and lockouts, we examine the outcomes of the pandemic-era work stoppages tracked by the Bureau of Labor Statistics (BLS). The BLS’ database only covers strikes involving at least 1,000 workers, effectively limiting its scope to strikes involving large union locals. Though the database is not comprehensive, we strongly believe that the incidence of large strikes and their outcomes offer meaningful insight into the evolving balance of power between employees and employers. Our conclusion is that management retains the upper hand; it will take more than a pandemic and one friendly administration’s term to turn the tables. Strikes Occur When One Side Overplays Its Hand Chart 1The Strike-Slack Link Has Been Shattered
The Strike-Slack Link Has Been Shattered
The Strike-Slack Link Has Been Shattered
Strikes (and lockouts) occur when labor and management cannot reach a mutually acceptable settlement, often because at least one side overestimates its bargaining power. It is easy to agree when labor and management hold similar views about each side’s relative position, as when both perceive that one of them is considerably stronger. In that case, a settlement favoring the stronger side can be reached quickly, especially if the stronger side exercises some restraint and does not seek to impose terms that the weaker side can scarcely abide. Restraint is rational in repeated games like employer-employee bargaining, especially if the stronger party recognizes that its advantage is not permanent. 40 years of waxing management power, however, may have imbued both sides with a sense that employers have insurmountable structural advantages. Since the early eighties, private sector union membership has withered, taboos against hiring strikebreakers have disappeared, the Federal bench has been filled with judges disposed to see things from management’s perspective, and state legislatures have increasingly weakened union protections to attract businesses. Since the Reagan administration took office, the incidence of major work stoppages (Chart 1, top panel) has ceased to correlate with the state of labor market slack (Chart 1, bottom panel). With the JOLTS, consumer confidence and NFIB surveys indicating that the pandemic has made it as easy as it has ever been to find a job (and extremely difficult to fill one), it is notable that so few unionized employees are playing their trump card of withholding their labor to extract concessions from their employers. Related Report US Investment StrategyLabor Strikes Back, Part 2: Where Strikes Come From And Who Wins Them With the link between labor market tightness and strikes severed, game theory offers the best insight into the origin of strikes. We posit a simple framework in which each side can hold any of five perceptions of its own bargaining power, resulting in a total of 25 possible joint perceptions. Labor (L) can believe it is way stronger than Management (M), L >> M; stronger than Management, L > M; roughly equal, L ≈ M; weaker than Management, L < M; or way weaker than Management, L << M. Management also holds one of these five perceptions, and the interaction of the two sides’ perceptions establishes the path negotiations will follow. Limiting our focus to today’s prevailing conditions, Figure 1 displays only the outcomes consistent with labor’s belief that it has the upper hand. For completeness, the exhibit lists all of management’s potential perceptions, but we deem the three away from the extremes to be most likely. Record job openings and quits rates (Chart 2) should convince even the most cocksure management negotiators that the landscape has tilted at least a little in labor’s favor. On the other hand, four consecutive decades of victories will make it hard for all but the most objective management negotiators to believe that the tables have completely turned. Figure 1Lots Of Room For Disagreement
Wage-Price Spiral? Not So Fast
Wage-Price Spiral? Not So Fast
Chart 2It's A(Labor)Seller's Market...
It's A(Labor)Seller's Market...
It's A(Labor)Seller's Market...
The Availability Of Substitutes Chart 3... And Mothballed Supply Is Coming Back On Line
... And Mothballed Supply Is Coming Back On Line
... And Mothballed Supply Is Coming Back On Line
Ultimately, leverage derives from the availability of substitutes. If employees can easily switch jobs and obtain better terms because employers are actively competing for scarce labor inputs, they should be able to extract concessions simply by threatening to strike. If employers can replace union members with cheaper non-union workers, substitute cheaper foreign labor for domestic labor while meeting less onerous working standards, or invest in automation to reduce the need for human inputs, employees will have little recourse but to accept whatever terms management dictates. The prevailing view is that there are precious few substitutes for domestic labor. The pandemic has exposed global supply chains' inherent vulnerability, forcing businesses to consider onshoring some functions. The labor market is exceedingly tight, as early retirements and the Great Resignation will suppress labor availability into the intermediate term. Quickening increases in labor force participation among those aged 55 to 59 (Chart 3, top panel) and 60 and 64 (Chart 3, bottom panel), however, are casting doubt on the narrative. We additionally expect that younger workers will not be able to hold themselves aloof from the work force indefinitely in the absence of new fiscal transfers. The explosion in nominal wage growth lends credence to the prevailing view (Chart 4). But none of the three main series, average hourly earnings (Chart 5, top panel), the Atlanta Fed wage tracker (Chart 5, middle panel) or the Employment Cost Index (Chart 5, bottom panel) is keeping pace with inflation. A wage-price spiral, as commonly understood, results when wages and consumer prices chase each other higher in something like a game of tag. Average hourly earnings got the game going in 2020, when essential workers received hazard pay for braving infection risks, but they’ve lagged consumer prices ever since. Chart 4Nominal Wages Are Surging ...
Nominal Wages Are Surging ...
Nominal Wages Are Surging ...
Chart 5... But They're Not Keeping Up With Inflation
... But They're Not Keeping Up With Inflation
... But They're Not Keeping Up With Inflation
This Is Not The Sixties And Seventies The wage-price spiral gained momentum when the unemployment rate spent eleven consecutive years (1964 through 1974) below or just barely above the CBO’s estimate of its natural rate (Chart 6, bottom panel). That helped feed consistently positive real wage gains through the seventies whenever the economy was expanding (Chart 6, top panel). Upward price pressures were stoked by profligate government spending (funding the war in Vietnam concurrently with Great Society programs) and a complacent Fed. The pandemic fiscal and monetary backdrop may look uncomfortably familiar, but today’s workers are far less equipped to turn it to its advantage. Chart 6The Wage-Price Spiral Of The Seventies Was A Long Time In The Making
The Wage-Price Spiral Of The Seventies Was A Long Time In The Making
The Wage-Price Spiral Of The Seventies Was A Long Time In The Making
Union membership is way down from the mid-to-late sixties (Chart 7), leaving unions with far fewer resources and much less of a corner on available labor. They also have less public support, less likelihood of benefiting from sympathy strikes or other support from unionized workers elsewhere in the chain and little to no lived experience with striking. They confront better organized and more determined opposition, as business concentration has reduced competition for their services to the point of establishing near-monopsonies in localized labor markets. The only way to confront the monopsony power of very few buyers is to organize a monopoly of suppliers, but private-sector union membership is mired at post-Depression lows despite The New York Times’ and other outlets’ relentless cheerleading. Chart 7It's Hard To Be An Influencer When You're Hemorrhaging Followers
It's Hard To Be An Influencer When You're Hemorrhaging Followers
It's Hard To Be An Influencer When You're Hemorrhaging Followers
I Walked A Picket Line For Four Weeks And All I Got Was This Lousy T-Shirt If workers are to change their fortunes (Chart 8), they need to achieve large-scale victories that win national attention, inspiring other workers to challenge management and laying out a roadmap for their own success. With that in mind, we examined the BLS’ detailed compilation of work stoppages since the beginning of 2020 to see what strikes were able to achieve. If striking reveals that labor truly has the whip hand, employers should accede en masse to employees’ demands, signaling that a broad compensation reset is afoot. Chart 8The Hazard-Pay Pop Was Short Lived
The Hazard-Pay Pop Was Short Lived
The Hazard-Pay Pop Was Short Lived
After backing out graduate student attempts to escape indentured servitude as sub-minimum-wage instructors, we examined the outcomes of the 22 large-scale strikes since 2020 (Table 1). In terms of base wage and salary gains, the results were decidedly underwhelming. Two of the union walkouts produced nothing (Swedish Medical Centers, 2020, and Kaiser Permanente Oakland sympathy strike, 2021) and prospects are not favorable for the United Mine Workers’ strike against Warrior Met Coal (2021) that is entering its fourteenth month. Public workers’ walkouts generally yielded nothing more than compensation increases around the Fed’s 2% annual inflation target. Teachers and front-line healthcare workers touted agreements to reduce class sizes, increase support staffs, formalize hazard pay and stockpile personal protective equipment but they’ve fallen further behind economically. Table 1Large-Scale Pandemic-Era Strikes
Wage-Price Spiral? Not So Fast
Wage-Price Spiral? Not So Fast
Private-sector workers have fared better, though one must often squint to see it. Kellogg’s cereal plant workers hit a home run, gaining cost-of-living adjustments on top of nominal salary increases, better retirement benefits and an accelerated path for new employees to transition to the more remunerative legacy employee tier, all without making a single concession. Seattle’s unionized carpenters also did well for themselves, gaining three 4.5% annual raises and a 50% increase in hourly parking reimbursements (no small matter in a full-to-bursting coastal city). Their fellows got some cash in their pockets via one-time bonuses for ratifying their deals, but whether they’ll be better off on an inflation-adjusted basis by the time they expire is an open question. In reading about the walkouts, negotiations and settlements, we were struck by how long it had been since many of these union locals had walked off the job. Minneapolis teachers last struck in 1970; the last nationwide Kellogg’s strike was in 1972; the UAW hadn’t struck John Deere since 1986; aside from a one-day 2017 walkout, Sacramento teachers hadn’t struck since 1989; and United Steelworkers hadn’t walked out from Allegheny Technologies in 30 years. Perhaps an unfamiliarity with striking among union leadership and rank-and-file made the unions timid and inclined to settle a little sooner than may have been optimal. Perhaps they were starting on the back foot and anchoring to that position, as many of the unions trumpeted that they refused management's concession demands. Workers in this round of negotiations may have been more concerned about working conditions than money and simply wanted to be heard and seen after running the COVID infection gauntlet. There’s no guarantee that will last, but it’s a good sign for corporate margins and municipal budgets in the near term. Management showed little inclination to cede its advantages: hospitals brought in temporary replacements like pricey traveling nurses at a cost far exceeding the raises unions sought, the two-tier compensation system for legacy and newer workers largely remains intact and companies preferred one-time bonuses to salary increases to pacify employees. It’s possible that workers simply lack much leverage; after securing 2% annual raises for 2020 and 2021 that woefully failed to keep pace with inflation, St. Paul teachers agreed to an eleventh-hour deal for 2022-23 that will provide another two years of 2% raises, though they also won $3,000 retention bonuses/recognition awards for their trouble. Looking Ahead When watching future negotiations between employers and unions, we will be looking out for the fate of the two-tier compensation model and the balance between salary/wage increases and one-time bonuses. Two-tier compensation has allowed employers to drive a wedge between senior employees and their successors. The model incents grandfathered employees to ratify deals that preserve their above-market compensation and benefits at the expense of less senior employees. “We can’t afford to pay all of you like UAW workers in the ‘70s and ‘80s, but we want to reward those who’ve demonstrated their loyalty to the company …” (and will disappear by attrition over the next ten years or so, bending our cost curve way down in real terms). We are also watching the mix of base salary and wage increases and bonus payments. We think of the former as akin to a public company’s dividends and the latter to their stock buybacks. Dividend payments (and wages) are sticky on the downside, as companies don’t want to signal financial weakness by cutting them and employees are loath to see their nominal pay decline. Once dividends and base salaries are raised, it’s hard to cut them. Buybacks, on the other hand, are purely discretionary and shareholders don’t count on them year after year. The same goes with bonuses – future base wages and salaries are a rigid function of previous base wages and salaries, but bonus payments are a one-off that don’t get directly factored into ongoing compensation. We thought John Deere’s agreement with the UAW preserved the status quo to management’s benefit. Per the terms of the new six-year contract, workers got splashy odd-year raises of 10%, 5% and 5%, interspersed with even-year bonuses. The compounded annual growth rate of their base pay is therefore 3.3% over the life of the contract [(1.1*1.05*1.05)^(1/6) – 1]. We’d bet the 3.3% growth will yield very close to zero real gains, and it seems like the 8.5% signing bonus workers received for ratifying the contract was a reasonable up-front price for Deere to pay to lock in six years of nearly flat real increases. The company must pay bonuses in years 2, 4 and 6 as well, but that might be a small price to pay to preserve the divide between workers hired before and after 1997. By the time the deal is up, the least senior of the expensive legacy employees will have been punching the clock for 30 years and their numbers will be thinning at a rapid rate. Ruth Milkman, a sociologist of labor and labor movements who has written or collaborated on over a dozen books in her half-century career, was recently asked when she last felt hopeful about workers’ outlook. After laughing, she said, “I remember when Obama was elected and I made a fool of myself predicting a big labor resurgence.”1 In a pattern reminiscent of Lucy pulling the football away from Charlie Brown, labor hopes pinned on the Obama administration failed to be realized. The Biden administration can direct the Department of Justice, Department of Labor, National Labor Relations Board and OSHA to enforce the laws on the books more vigorously, but it can’t write new ones without both houses of Congress and the Senate lacks the president's appetite to do so. “It’s a story of endless disappointments,” according to Milkman, “and it seems like that’s where we are now, too.” We will believe in labor’s renaissance only after we see it. The course of labor negotiations since the pandemic in no way suggests that a wage-price spiral is inevitable, nor that it is probable. Doug Peta, CFA Chief US Investment Strategist dougp@bcaresearch.com Footnotes 1 https://www.nytimes.com/2022/02/17/magazine/unions-amazon.html. Accessed 4/27/22.
Executive Summary Three Problems For European EPS
Three Problems For European EPS
Three Problems For European EPS
The Chinese economic slowdown in response to COVID lockdowns represents a major headwind for European profits in 2022. Weaker global growth creates another hurdle. The energy crisis is the third major problem for European profit growth this year. European profits must be revised downward for 2022, but the impact on 2023 EPS will be small. Cyclical sectors are particularly exposed to these three headwinds, which will hurt profitability this year. The recent relative strength in industrials and materials earnings is likely to buckle in response to weaker global growth, while the defensive characteristics of healthcare and communication services will shine. Within defensive sectors, favor healthcare and communication services versus utilities and consumer staples. Bottom Line: A downward revision of European profits will constrain the ability of European equities to rally in the coming quarters; however, it does not portend another major down leg in European stocks. Nonetheless, the downward revision still points to further underperformance of cyclical equities. Within the defensive sectors, healthcare and communication services are more appealing than utilities and consumer staples shares. The earnings season has begun. According to the MSCI index, Eurozone profit margins are at a 14-year high following a sharp rebound in profits after the pandemic-induced collapse of 2020. Faced with a war in Ukraine and surging inflation, investors worry that this robust profit picture will not last. We share these worries. The near-term outlook for European profits has deteriorated significantly. While the inflation surge amplified by the Ukrainian crisis is an important problem for European firms, it is not the only one. European businesses must also cope with the effect of a growth slowdown in the US goods sector. Moreover, Chinese growth is likely to plunge in response to the tightening lockdowns across the country. As a result, we fear that current earnings estimates for 2022 are too optimistic. Nonetheless, European stocks are unlikely to collapse further. The valuation cushion amassed during the first quarter market shake-out already embeds some downside for 2022 earnings. Additionally, 2023 earnings have much more limited downside than this year’s EPS. Three Problems For European EPS Chart 1European Earnings Profile
European Earnings Profile
European Earnings Profile
Three major problems indicate that the current European earnings estimates for 2022 are too optimistic: namely, China’s economic slowdown, a global economic deterioration, and the consequences of the Ukrainian war on the European economy (Chart 1). China’s Slowdown This publication has regularly highlighted that, even if the Chinese credit impulse is already trying to bottom, the lagged effect of the previous slowdown in credit flows would continue to hurt European growth in the first half of 2022. China’s COVID outbreak and Beijing’s severe policy response only accentuate this headwind. European profits are even more sensitive to Chinese economic fluctuation than European economic activity, which points to a meaningful drag on profitability. Many relationships highlight our concerns: So far, the weakness in the Chinese credit impulse is still consistent with a rapid deterioration of forward earnings growth and could lead to a contraction in forward EPS (Chart 2, top panel). The Chinese new orders index is falling rapidly. The elevated likelihood that China endures even more lockdowns in the coming months implies a sharper drop in orders and further weakness in European EPS (Chart 2, second panel). The CNY is depreciating again, which often coincides with a deflationary shock in global industrial goods that Europe produces. Unsurprisingly, a weaker RMB correlates well with narrowing operating profit margins in the Eurozone (Chart 2, bottom panel). Korean business conditions are deteriorating in response to the softening of the Chinese economy. A weaker RMB will further hurt business sentiment in the peninsula, especially if Chinese lockdowns broaden. The Korean economy is a key barometer of global business conditions because of its high cyclicality. BCA’s EM strategy team anticipates an additional softening in Korea, which portends weaker European profits and margins (Chart 3). Chart 2China's Troubles Trouble Europe Profits
China's Troubles Trouble Europe Profits
China's Troubles Trouble Europe Profits
Chart 3Listen to Korea
Listen to Korea
Listen to Korea
Global Economic Weakness The global growth weakness goes beyond China’s troubles. US economic activity is slowing down in response to higher yields, higher inflation, and the disappearance of pent-up demand following a splurge on goods by consumers during the pandemic. As a result, Q1 GDP growth fell to -1.4% from a quarterly annualized rate of 5.5% in Q4 2021. The weakness in the ISM New Orders-to-Inventory ratio points to continued softness through Q2. EM are not immune to these vulnerabilities either. EM consumers are suffering greatly from surging food and fuel costs. Moreover, EM interest rates continue to rise briskly and the ensuing liquidity removal points to fainter growth ahead. Chart 4The Weaker ISM NOI Is Worrisome
The Weaker ISM NOI Is Worrisome
The Weaker ISM NOI Is Worrisome
The impact of weaker global economic activity on European earnings is straightforward: A falling US ISM New Orders-To-Inventories ratio is a prelude both to slower earnings growth and to narrower profit margins in the Eurozone (Chart 4). Global exports growth has collapsed to 5.5% from more than 20% prior year and is likely to deteriorate further. Historically, weaker global shipments are associated with a slowdown in European forward earnings growth (Chart 4, third panel). Global economic surprises have rebounded this year, but, as we showed two weeks ago, they are likely to move back below zero in the near future. This is a noisy series, but negative surprises often prompt downward revisions to earnings estimates. The Energy Shock Europe is facing an exceptional energy shock that is hurting the region’s growth prospects. Now that Russia is curtailing gas shipments to Poland and Bulgaria, more energy disruptions are likely, which will further hamper domestic growth prospects across the region, while simultaneously elevating the cost of goods sold for firms. However, not all countries will be hit equally by a Russian energy embargo among the major economies. Germany and Italy have the most to lose, while France and the UK are the least at risk (Chart 5). The impact of an oil supply shock on European earnings is negative. When oil prices rise because of strong global aggregate demand, European earnings handle rising energy prices well because the increasing sales volume creates a powerful offset. However, our simple model that accounts for the evolution of oil demand and global policy uncertainty highlights that we do not face a demand shock, but rather a supply shock (Chart 6), which implies that most sectors will suffer from higher energy prices. Chart 5Varying Vulnerabilities To Russia’s Energy Showdown
The Three Forces Hurting European Earnings
The Three Forces Hurting European Earnings
Chart 6Oil's Rally Is Supply-Driven
Oil's Rally Is Supply-Driven
Oil's Rally Is Supply-Driven
Chart 7European Margins Under Pressure
European Margins Under Pressure
European Margins Under Pressure
The inflation passthrough from energy to everything else is not strong enough to protect profit margins. Yes, HICP is elevated, but European PPIs are rising much more rapidly. Historically, such an inability to pass on higher production costs results in slower European profits growth and contracting operating profit margins (Chart 7). The current weakness in consumer confidence and the expected drag on business confidence underscore that pricing power will likely deteriorate from here, which will accentuate the negative impact on profits from the current energy shock. Wage Costs: Not A Problem For Now Wage costs are the one bright spot for European profit margins. European negotiated wages are expanding at a very low rate of 1.6%. Unit labor costs are only expanding at 2.4%, a rate similar to last decade when European core inflation averaged 1%. Chart 8Wages Do Not Hurt Margins
Wages Do Not Hurt Margins
Wages Do Not Hurt Margins
Historically, rising wage rates correlate with rising profitability, not declining margins (Chart 8). This relationship seems paradoxical, but European wages only increase when global aggregate demand is very strong. Due to the degree of operating leverage of European equities, the impact of robust aggregate demand on revenues swamps the impact of accelerating wage growth on production costs. Hence, it will probably take a wage growth rate much higher than the experience of the past 20 years for salaries to start hurting margins. While this is possible, we are many quarters away from this risk becoming reality. Bottom Line: European forward earnings estimates for 2022 are far too elevated in view of the headwinds European businesses are currently facing. The combination of weaker Chinese economic activity, slowing global growth, and a supply-driven energy shock will force significant downward revisions to this year’s EPS. Related Report European Investment StrategyPlenty Of Risks For Cyclical Stocks 2023 EPS should fare better. Chinese authorities are increasingly supporting their economy and this stimulus will impact activity when the lockdowns end. This process will prompt a boom later this year. Global growth will recover once the energy shock recedes. Decelerating European PPI will also help profit margins recover. Following their severe decline in the first quarter, European equities have already embedded a significant valuation cushion to compensate for the transitory shock to earnings. European stocks will not be able to advance meaningfully while 2022 earnings estimates weaken, but they are unlikely to make new lows either. Three Problems For Cyclicals vs Defensives The same three factors that hurt the outlook for European profits for 2022 also confirm that cyclical equities should underperform defensives in the near term. China’s Slowdown Cyclicals are extremely sensitive to a Chinese economic slowdown: The past weakness in the Chinese credit impulse is consistent with a further downgrade of the profit expectations for European cyclicals stocks compared to that of their defensive peers (Chart 9). A deterioration in China’s PMI New Orders heralds a period of weakness in the earnings of cyclical equities. A weak Chinese yuan leads to poor relative earnings (Chart 9). The deterioration in Korean business confidence and the poor performance of Korean equities also leads to weakness in both the earnings and profit margins of cyclical equities relative to those of defensive stocks (Chart 9). Global Growth Weakness The earnings outlook for cyclical sectors relative to defensives is negatively affected by slowing global economic activity: A deterioration in global economic surprises often results in a period of anemic cyclicals’ earnings (Chart 10). The rapidly declining ISM New Orders-to-Inventories ratio is synonymous with underperforming cyclicals’ earnings as well as a contraction in their relative profit margins because of their heightened degree of operating leverage (Chart 10). Weaker global exports confirm the continued risks to cyclicals’ earnings. Chart 9China Is A Threat To Cyclical Equities
China Is A Threat To Cyclical Equities
China Is A Threat To Cyclical Equities
Chart 10Global Growth Threatens Cyclical Stocks
Global Growth Threatens Cyclical Stocks
Global Growth Threatens Cyclical Stocks
The Energy Shock There is no clear relationship between energy prices and the outlook for the profits of cyclical equities relative to those of defensive stocks. Nonetheless, we may deduce that, if elevated energy prices hurt aggregate profits, they will also hurt cyclical profits, since the latter exacerbate the fluctuation of the former. Moreover, Europe’s elevated stagflation risk is consistent with sagging profits for cyclicals relative to those of defensives, because cyclicals experience greater pain from deteriorating economic activity than the benefit they enjoy from higher inflation. Bottom Line: The problems faced by the Chinese economy as well as the risks to global growth are consistent with an underperformance of the profits of cyclical stocks compared to those of defensive equities. Moreover, while higher energy prices are not necessarily a problem for cyclical equities, the elevated perceived stagflation risk is consistent with downward revisions for the relative earnings of cyclicals. This picture indicates that cyclical equities are still vulnerable to some downside relative to the broad market in the near term. A Look at Individual Sectors Chart 11Sectoral Degrees Of Operating Leverage
The Three Forces Hurting European Earnings
The Three Forces Hurting European Earnings
We may distill the impact of China’s problems, the global economic slowdown, and the energy shock on sectoral earnings. A simple starting point is to look at their degree of operating leverage. Based on this observation, financials and consumer discretionary stocks are the sectors most at risk from weaker revenue growth, while utilities are the least exposed (Chart 11). A more complete picture may be gleaned from each sector’s pricing power. Energy Chart 12Improving Energy Margins
Improving Energy Margins
Improving Energy Margins
The energy sector enjoys a significant margin tailwind from the oil supply shock (Chart 12). Nonetheless, this boost is long in the tooth and a pullback is likely if Brent falls toward the $94/bbl level expected by BCA’s Commodity & Energy team in the second half of 2022, and $88/bbl level in 2023. Hence, it is likely that the near-term benefits for the energy sector’s profits are already fully discounted and that the sector could suffer a significant setback in the coming quarters. Industrials The pricing power of industrials (as approximated by the gap between CPI and PPI) is still strong, which creates a tailwind for relative earnings (Chart 13). However, this robustness is under threat in the current environment in which global industrial production, global trade, and global capital goods orders are decelerating (Chart 14). Hence, a period of downgrade for the earnings of industrials relative to the broad market is likely in the coming months. Chart 13Robust Pricing Power For Industrials...
Robust Pricing Power For Industrials...
Robust Pricing Power For Industrials...
Chart 14...But For How Long?
...But For How Long?
...But For How Long?
Financials Chart 15Financials Are Under Siege
Financials Are Under Siege
Financials Are Under Siege
The relative pricing power1 of financials is rapidly deteriorating, despite the recent increase in German yields (Chart 15). Moreover, it is likely to remain weak in a context in which core CPI has yet to decrease. Finally, the potential for a European recession in 2022, or at least, a severe growth slowdown, should lift non-performing loans. As a result, this sector’s earnings could experience a significant downgrade in the near term. Tech The sector’s pricing power was in an uptrend, but it has started to deteriorate in recent quarters (Chart 16). This evolution indicates that that tech earnings and profit margins are likely to suffer relative to the broad market, especially in light of the sector’s high degree of operating leverage. Consumer Discretionary Stocks This sector is suffering from a complete collapse of its pricing power (Chart 17). Additionally, tumbling consumer confidence in Europe and around the world is a significant drag on near-term sales. Consequently, earnings growth as well as profit margins are likely to lag the overall market. Chart 16Crucial Tech Tailwind Dwindling
Crucial Tech Tailwind Dwindling
Crucial Tech Tailwind Dwindling
Chart 17A Problem For Consumer Discretionary Stocks
A Problem For Consumer Discretionary Stocks
A Problem For Consumer Discretionary Stocks
Materials European materials sector’s profit margins stand at a 19-year high compared to that of the broad market. However, relative profit growth has collapsed. The bad news for the sector is that its pricing power is rapidly deteriorating because of surging input costs. It suggests that relative profit growth will become negative as relative profit margins contract (Chart 18). Utilities The pricing power of utilities is plunging because retail electricity prices are not rising as fast as input costs. The negative impact of this adverse pricing on profit margins is consequential (Chart 19). Governments around Europe are likely to continue to pressure this sector to limit the increase in electricity prices to households, which means that utilities are likely to lag other defensive sectors. Chart 18Materials' Outlook Deteriorating Materially
Materials' Outlook Deteriorating Materially
Materials' Outlook Deteriorating Materially
Chart 19Crunch Time For Utilities
Crunch Time For Utilities
Crunch Time For Utilities
Consumer Staples Chart 20Staples Under Duress
Staples Under Duress
Staples Under Duress
The consumer staples sector is facing a similar pricing power problem to that of consumer discretionary stocks: input costs are rising rapidly relative to selling prices (Chart 20). Nonetheless, the earnings of staples will prove more resilient than that of their discretionary counterparts because the staples’ sales volumes are less sensitive to both deteriorating global consumer confidence and falling household real incomes. However, consumer staples equities have already greatly outperformed consumer discretionary stocks. Thus, much of the good news in terms of relative earnings is well discounted and the additional outperformance will be limited. Healthcare Chart 21Healthcare Stocks Still Have Pricing Power
Healthcare Stocks Still Have Pricing Power
Healthcare Stocks Still Have Pricing Power
The pricing power of the healthcare sector remains positive, but it is not as strong as it was ten years ago. Hence, profits growth has scope to improve further compared to the rest of the market (Chart 21). Beyond favorable pricing power dynamics, the industry is insulated from weaker global growth relative to the rest of the broad market. Importantly, the healthcare sector sports one of the lowest degrees of operating leverage in Europe, which will also boost its relative profitability in the current environment. Healthcare is our top defensive sector right now, despite its valuation premium. Communication Services Chart 22Telecom Will Prove Resilient
Telecom Will Prove Resilient
Telecom Will Prove Resilient
The profit growth and profit margins of the European communication services sectors are already under duress because pricing power remains negative. Nonetheless, the contraction in relative growth rates of earnings is extended (Chart 22). Telecom revenues did not benefit from a boost when the economy rebounded after the economic contraction in 2020. This stability is now an asset because the sector will not struggle from slowing global economic activity. In this context, the cheap communication services sector remains an attractive defensive play in Europe. Bottom Line: Looking at sectors individually confirms that the outlook for profit growth is worse for cyclicals than it is for defensive stocks. The recent relative strength in industrials and materials earnings is likely to buckle in response to weaker global growth, while the defensive characteristics of healthcare and communication services will shine. Utilities are under stress, as they stand at the confluence of higher energy prices and the explicit desire of politicians to limit the impact of these higher energy costs on households. Favor healthcare and communication services versus utilities and consumer staples. Mathieu Savary, Chief European Strategist Mathieu@bcaresearch.com Footnotes 1 In the case of financials, we use core CPI as a proxy for the sector’s costs. Eurostat does not publish a PPI for the sector and the main costs are related to labor costs. Tactical Recommendations Cyclical Recommendations Structural Recommendations
Listen to a short summary of this report. Executive Summary Second Fastest Hiking Cycle Ever?
Monthly Portfolio Update: Can The Fed Achieve A Soft Landing? Hint: It Doesn’t Have A Good Track Record
Monthly Portfolio Update: Can The Fed Achieve A Soft Landing? Hint: It Doesn’t Have A Good Track Record
Can the Fed achieve a soft landing, bringing inflation back to its 2% target without causing growth to slow significantly below trend? It has managed this only once in the past (in 2004). Every other cycle triggered a recession or, at best, a fall in the PMI to below 50. Recession is not a certainty. A higher neutral rate than in the past – partly due to the build-up of household savings – means the economy may be unusually robust this time. But the risk is high. We recommend a neutral weighting in equities, with a tilt to more defensive positioning: Overweight the US, and a focus on quality and defensive growth sectors. China’s slowdown is particularly worrying. We expect the RMB to fall, which will put downward pressure on other Emerging Markets.
Monthly Portfolio Update: Can The Fed Achieve A Soft Landing? Hint: It Doesn’t Have A Good Track Record
Monthly Portfolio Update: Can The Fed Achieve A Soft Landing? Hint: It Doesn’t Have A Good Track Record
Bottom Line: Investors should maintain low-risk portfolio positioning until the outcome of the sharp tightening of financial conditions is clearer. Recommended Allocation
Monthly Portfolio Update: Can The Fed Achieve A Soft Landing? Hint: It Doesn’t Have A Good Track Record
Monthly Portfolio Update: Can The Fed Achieve A Soft Landing? Hint: It Doesn’t Have A Good Track Record
The key to the performance of financial markets over the next year is whether the Fed and other central banks can kill inflation without killing economic growth. This is not impossible. But the risk that aggressive tightening of monetary policy triggers a recession – or at best a sharp slowdown – is high. Investors should maintain relatively low-risk portfolio positioning. If the Fed raises rates in line with what the futures market is projecting – by 286 basis points over the next 12 months – it will be the second fastest tightening on record, after only the “full Volcker” of 1980-1981 (Chart 1). Other central banks, even in countries and regions with much weaker growth than the US, are predicted to tighten almost as aggressively (Table 1). At the same time, the Fed will start to run down its balance-sheet rapidly; we estimate its holdings of US Treasurys will fall by more than $1 trillion by end-2023 (Chart 2). What was the impact on the economy of previous Fed hiking cycles? It varied, but on only one occasion in the past 50 years (2004) was there neither a recession nor a fall of the Manufacturing ISM to below 50 in the two years or so following the first hike (Table 2).1 The ISM (and other global PMIs) falling to below 50 is important because that is typically the dividing line between equities outperforming bonds and vice versa (Chart 3). Chart 1Second Fastest Hiking Cycle Ever?
Monthly Portfolio Update: Can The Fed Achieve A Soft Landing? Hint: It Doesn’t Have A Good Track Record
Monthly Portfolio Update: Can The Fed Achieve A Soft Landing? Hint: It Doesn’t Have A Good Track Record
Table 1Futures Projected Interest Rate Hikes
Monthly Portfolio Update: Can The Fed Achieve A Soft Landing? Hint: It Doesn’t Have A Good Track Record
Monthly Portfolio Update: Can The Fed Achieve A Soft Landing? Hint: It Doesn’t Have A Good Track Record
Chart 2Fed Balance-Sheet Will Shrink Rapidly Too
Fed Balance-Sheet Will Shrink Rapidly Too
Fed Balance-Sheet Will Shrink Rapidly Too
Table 2What Happened To The Economy In Fed Hiking Cycles
Monthly Portfolio Update: Can The Fed Achieve A Soft Landing? Hint: It Doesn’t Have A Good Track Record
Monthly Portfolio Update: Can The Fed Achieve A Soft Landing? Hint: It Doesn’t Have A Good Track Record
Chart 3Will PMIs Fall Below 50?
Will PMIs Fall Below 50?
Will PMIs Fall Below 50?
A recent paper by Alex Domash and Larry Summers showed that, since 1955, when US inflation was above 4% and unemployment below 5%, there was a 73% probability of recession over the next four quarters, and 100% over the next eight quarters (Table 3). On each of the three occasions when inflation was above 5% and unemployment below 4% (as is the case now), recession followed within a year. How could the Fed avoid a hard landing? Inflation could come down quickly, which would allow the Fed to ease back on tightening. As consumption switches back to services from durables, and the supply side succeeds in increasing production, the price of manufactured goods could fall (Chart 4). There were signs of this happening already in March, when US durables prices fell by 0.9% month-on-month. The problem, however, is that because of rising energy costs and lockdowns in China, the supply-side response has been delayed. The fall in semiconductor and shipping costs, which we previously argued would happen this year, is not yet clearly coming through (Chart 5). There are also signs of a price-wage spiral, with US wages rising (with a lag) in line with prices (Chart 6). Table 3This Level of Inflation And Unemployment Usually Leads To Recession
Monthly Portfolio Update: Can The Fed Achieve A Soft Landing? Hint: It Doesn’t Have A Good Track Record
Monthly Portfolio Update: Can The Fed Achieve A Soft Landing? Hint: It Doesn’t Have A Good Track Record
Chart 4Can The Price Of Durables Now Fall?
Can The Price Of Durables Now Fall?
Can The Price Of Durables Now Fall?
Chart 5Supply-Side Recovery Delayed?
Supply-Side Recovery Delayed?
Supply-Side Recovery Delayed?
The economy could be more robust than in the past, leaving it unscathed by higher rates. Our model of the equilibrium level of short-term rates is 3.2%, well above the Fed’s estimate of 2.4% (Chart 7). Our colleague Peter Berezin has argued that the neutral rate could be as high as 4%.2 In particular, the $2 trillion-plus of excess US household savings (equal to 10% of GDP) could support consumption for some years even if real wage growth is negative (Chart 8). However, there are already signs that higher rates are hurting the housing market, the most interest-rate sensitive part of the economy. The average US 30-year fixed-rate mortgage rate has risen to 5.1% from 3.2% since the start of the year. This is negatively impacting home sales and mortgage applications (Chart 9). Moreover, even if the Fed can succeed in raising rates without killing the expansion, the markets – for a while – will worry that it cannot. Chart 6A Price-Wage Spiral?
A Price-Wage Spiral?
A Price-Wage Spiral?
Chart 7Rates Are Still A Long Way Below Neutral
Rates Are Still A Long Way Below Neutral
Rates Are Still A Long Way Below Neutral
Chart 8Excess Savings Could Support The Economy
Excess Savings Could Support The Economy
Excess Savings Could Support The Economy
Chart 9Higher Rates Already Impacting Home Sales
Higher Rates Already Impacting Home Sales
Higher Rates Already Impacting Home Sales
There are clear signs of a slowdown in the global economy. Europe may already be in recession, with sentiment indicators collapsing to recessionary levels (Chart 10). More esoteric indicators, which have historically signaled slowing growth ahead, such as the Swedish new orders/inventories ratio, are also flashing a warning signal (Chart 11). Global financial conditions have tightened at the fastest pace since 2008 (Chart 12). Corporate earnings forecasts have started to be revised down for the first time in this cycle (Chart 13). Chart 10Is Europe Already In Recession?
Is Europe Already In Recession?
Is Europe Already In Recession?
Chart 1111. Signs Of Trouble Ahead
11. Signs Of Trouble Ahead
11. Signs Of Trouble Ahead
Chart 12Financial Conditions Have Tightened Significantly
Financial Conditions Have Tightened Significantly
Financial Conditions Have Tightened Significantly
Chart 13Corporate Earnings Forecasts Being Revised Down
Corporate Earnings Forecasts Being Revised Down
Corporate Earnings Forecasts Being Revised Down
But what of the argument that investors have already turned ultra-pessimistic and that all the bad news is in the price? Global equities are down only 14% from their historic peak, barely in correction territory. It is true that sentiment (historically a contrarian indicator) is very poor, with twice as many respondents to the American Association of Individual Investors’ weekly survey expecting the stock market to fall over the next six months as expect it to rise (Chart 14). But, despite investor pessimism, there are few signs that investors have made their portfolios more defensive. The same AAII survey shows little decline in equity weightings, and no big shift into cash (Chart 15). Chart 14Investors Are Very Pessimistic...
Investors Are Very Pessimistic...
Investors Are Very Pessimistic...
Chart 15...But Haven't Moved More Defensive
...But Haven't Moved More Defensive
...But Haven't Moved More Defensive
Equities: The US is the best house on a tough street. Growth is likely to remain more robust than in the euro area or Japan. The US stock market has a lower beta (Chart 16). And, while the US is more expensive, valuations do not drive the 12-month relative performance of stocks and, anyway, the US premium valuation can be justified by higher ROE and the lower volatility of profits (Chart 17). Emerging markets continue to look vulnerable to the slowdown in China and tighter US financial conditions (Chart 18). We remain underweight. Chart 16US Stocks Are Lower Risk
US Stocks Are Lower Risk
US Stocks Are Lower Risk
Chart 17US Premium Valuation Is Justified
Monthly Portfolio Update: Can The Fed Achieve A Soft Landing? Hint: It Doesn’t Have A Good Track Record
Monthly Portfolio Update: Can The Fed Achieve A Soft Landing? Hint: It Doesn’t Have A Good Track Record
Chart 18Tightening Financial Conditions Are Bad For EM
Tightening Financial Conditions Are Bad For EM
Tightening Financial Conditions Are Bad For EM
Chart 19Consumer Staples Are Defensive
Consumer Staples Are Defensive
Consumer Staples Are Defensive
Chart 20IT Earnings Will Continue To Grow Strongly
IT Earnings Will Continue To Grow Strongly
IT Earnings Will Continue To Grow Strongly
Within sectors, our preference remains for quality and defensive growth. Consumer staples tend to outperform when PMIs are falling (Chart 19) and are supported by attractive dividend yields. Information Technology is a more controversial overweight, given that it is expensive and sensitive to rising rates. Nevertheless, investment in tech hardware and software is likely to continue, giving the sector strong structural earnings growth in coming years (Chart 20). Currencies: The dollar has risen by 7.3% year-to-date driven by interest-rate differentials and the Fed being expected to be more aggressive than other central banks. But we are only neutral, since the Fed will probably not raise rates by as much as the market is pricing in, and because the dollar looks very overvalued (Chart 21). We lower our recommendation on the Chinese yuan to underweight. Interest-rate differentials with the US clearly point to it falling further – also the outcome desired by the authorities to help bolster growth (Chart 22). The likely CNY weakness will put further downward pressure on other EM currencies, particularly in Asia, given their high correlation to the Chinese currency (Chart 23). Chart 21The Dollar Is Very Overvalued
The Dollar Is Very Overvalued
The Dollar Is Very Overvalued
Chart 22Rate Differentials Point To A Weaker RMB...
Rate Differentials Point To A Weaker RMB...
Rate Differentials Point To A Weaker RMB...
Chart 23...Which Is Bad News For Other EM Currencies
...Which Is Bad News For Other EM Currencies
...Which Is Bad News For Other EM Currencies
Fixed Income: With the 10-year US Treasury yield at 2.9% and that in Germany at 0.9%, there is a stronger argument for marginally raising weightings in government bonds. We are neutral on government bonds within the (underweight) fixed-income category. Remember, though, that real yields are still negative: -0.1% in the US and -2.1% in Germany. We do not expect long-term rates to rise much over the next 6-9 months, and so remain neutral on duration. The “golden rule of bond investing” says that government bond returns are driven by whether the central bank is more or less hawkish than expected over the next 12 months (Chart 24). We would expect the Fed to be slightly less hawkish than currently forecast. US high-yield bonds offer an attractive yield pick-up – as long as US growth does not collapse. In a way, HY bonds are like defensive equities, given their high correlation with equities but beta only one-third that of equities (Chart 25). Chart 24Will The Fed Be More Or Less Hawkish Than Expected?
Will The Fed Be More Or Less Hawkish Than Expected?
Will The Fed Be More Or Less Hawkish Than Expected?
Chart 25High Yield Bonds Are Like MinVol Equities
High Yield Bonds Are Like MinVol Equities
High Yield Bonds Are Like MinVol Equities
Chart 26Russian Oil Is Going Cheap
Russian Oil Is Going Cheap
Russian Oil Is Going Cheap
Commodities: Oil prices are likely to fall back to around $90 a barrel by year-end, as demand softens and increased supply (from Saudi Arabia, UAE, and North American shale, and maybe from Venezuela and Iran) enters the market. But the risk is to the upside if this extra supply does not emerge. In particular, possible bans on Russian oil and gas into the European Union (or Russia blocking sales) could disturb the market. It will take time for Russia’s 11 million b/d of oil production, which used to go mainly to Europe, to be rerouted to Asia. This is why the Urals benchmark is at a 30% discount to Brent (Chart 26). The long-term story for industrial commodities remains good, but there is downside risk – especially for iron ore and steel – from China’s slowdown (Chart 27). Gold is an obvious hedge against geopolitical risks and high inflation. But over the past 20 years, it has been negatively correlated to real interest rates and the US dollar, suggesting upside is capped. There is a chance, however, that the relationship between rates and gold breaks down, as it did in the 1970s and 1980s (Chart 28). We, therefore, remain neutral on gold, believing that a moderate holding is a good diversifier for portfolios. Chart 27Chinese Slowdown Is Negative For Commodities
Chinese Slowdown Is Negative For Commodities
Chinese Slowdown Is Negative For Commodities
Chart 28Will Gold Start To Behave As It Did Before 1990?
Will Gold Start To Behave As It Did Before 1990?
Will Gold Start To Behave As It Did Before 1990?
Garry Evans, Senior Vice President Global Asset Allocation garry@bcaresearch.com Footnotes 1 In 2015, the ISM was already below 50 when the Fed hiked in December. 2 Please see Global Investment Strategy Report, “Is A Higher Neutral Rate Good Or Bad For Stocks?” dated March 18, 2022. Recommended Asset Allocation Model Portfolio (USD Terms)
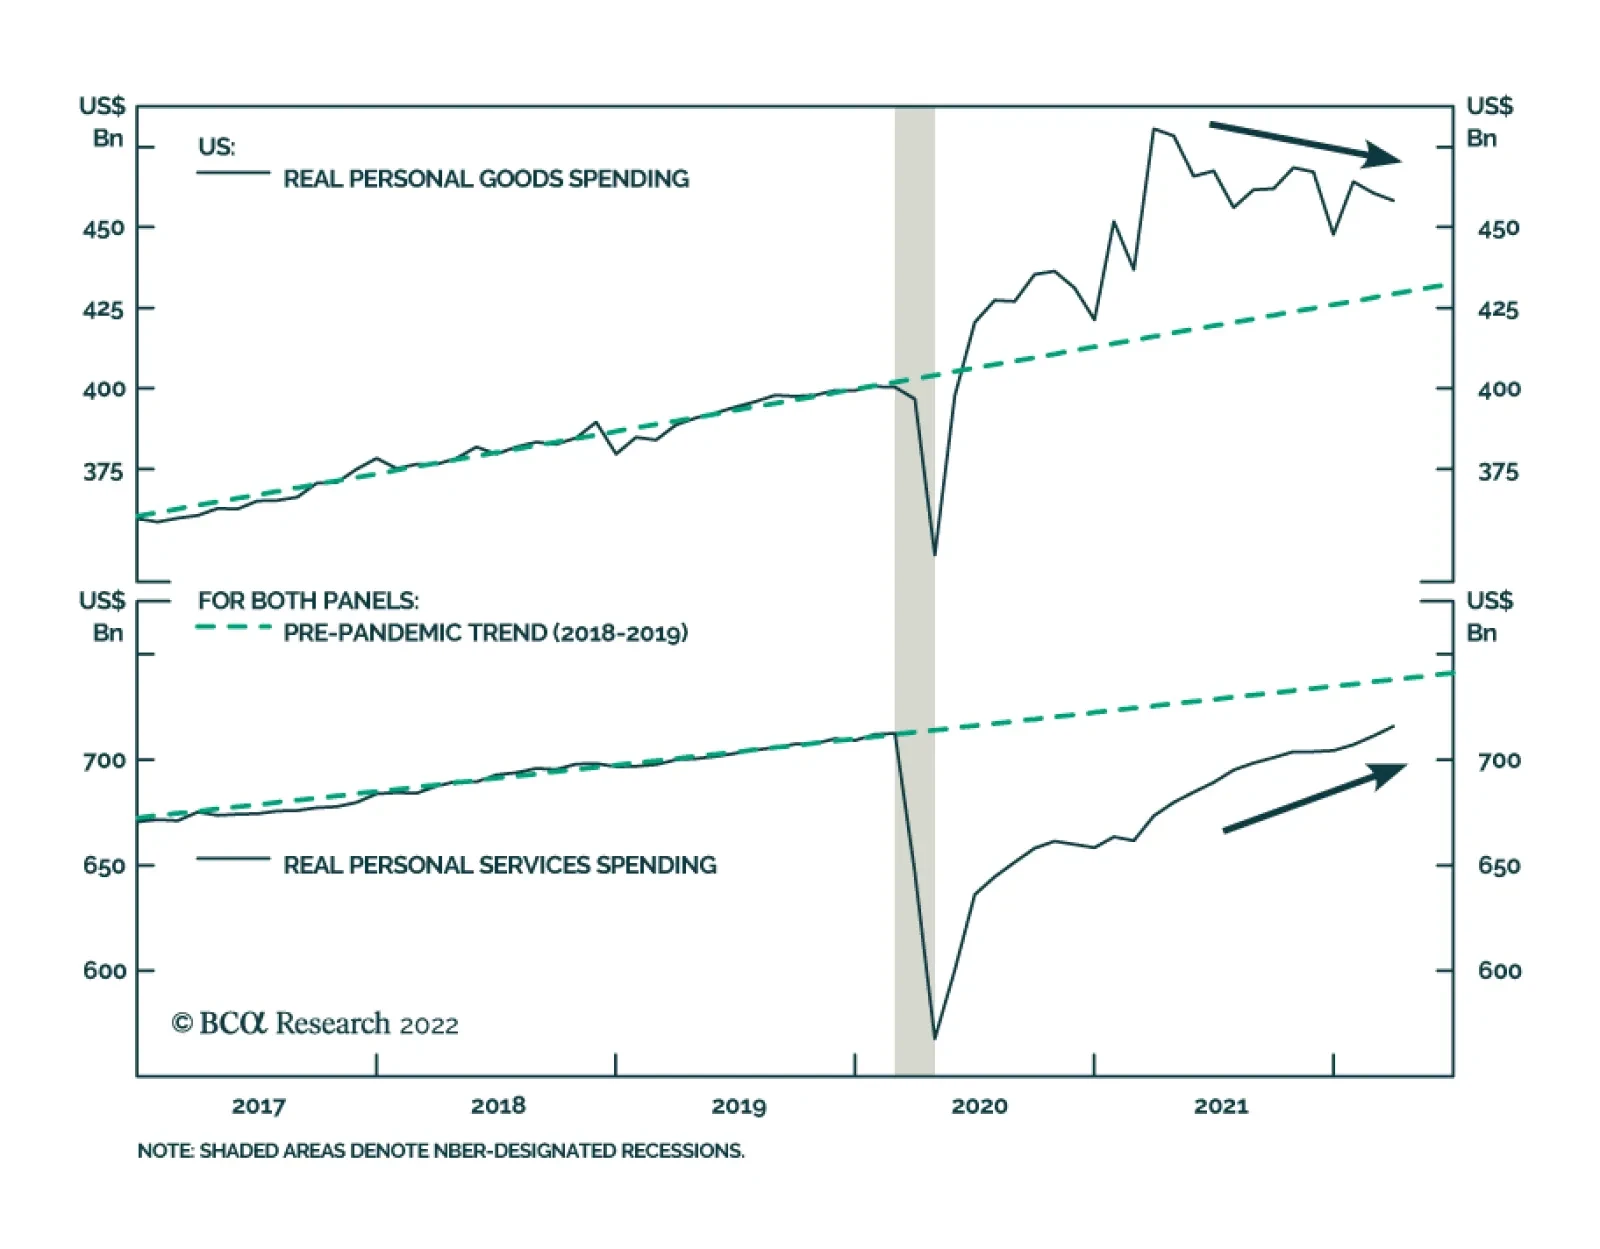
The US Personal Income and Outlays report for March confirms the signal from the Q1 GDP report that consumption continues to support the US economy. Notably, personal spending expanded by 0.2% m/m in real terms, surprising expectations of a 0.1% m/m…
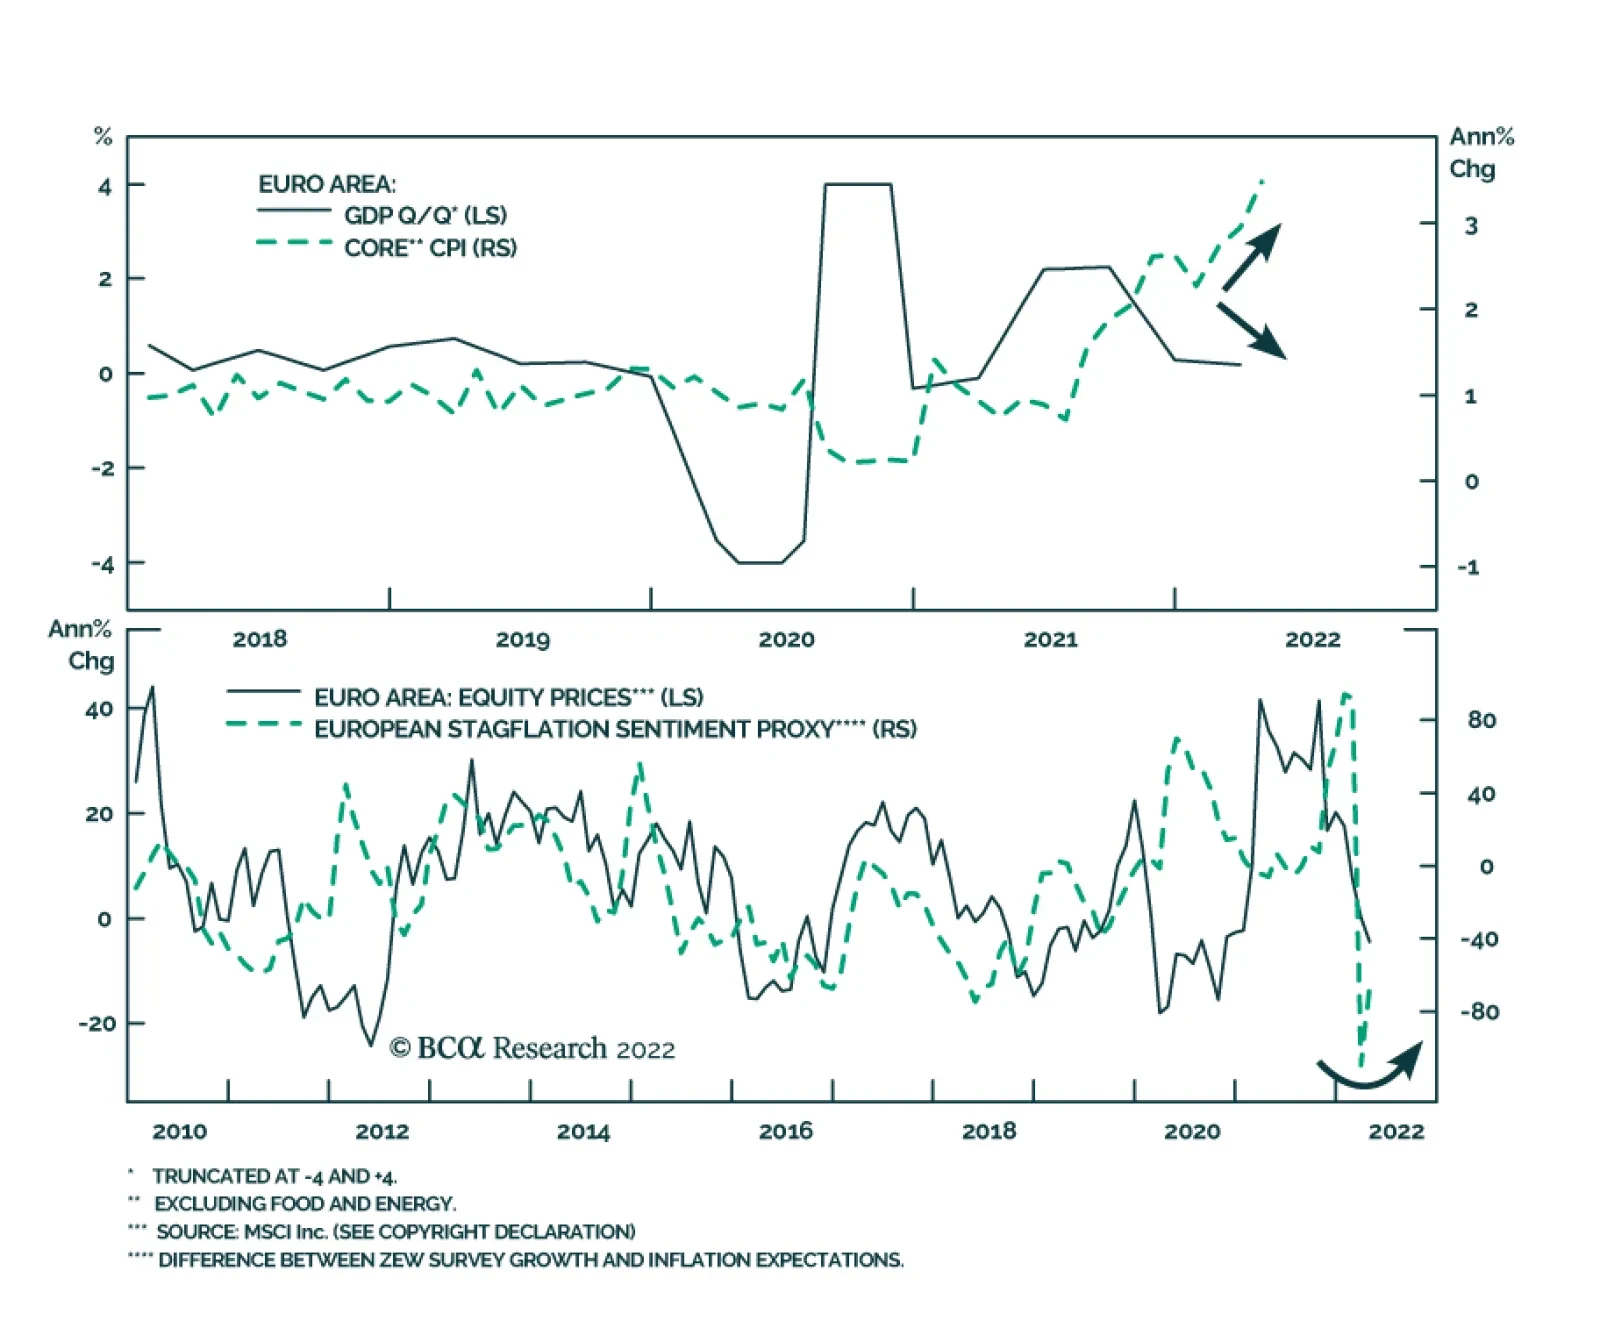
As expected, economic activity slowed in the Euro Area: GDP growth eased from 0.3% q/q in Q4 2021 to 0.2% q/q in Q1 2022. Meanwhile, core CPI inflation rose to a 29-year high of 3.5% y/y and headline inflation hit an all-time high of 7.5% y/y in April.…
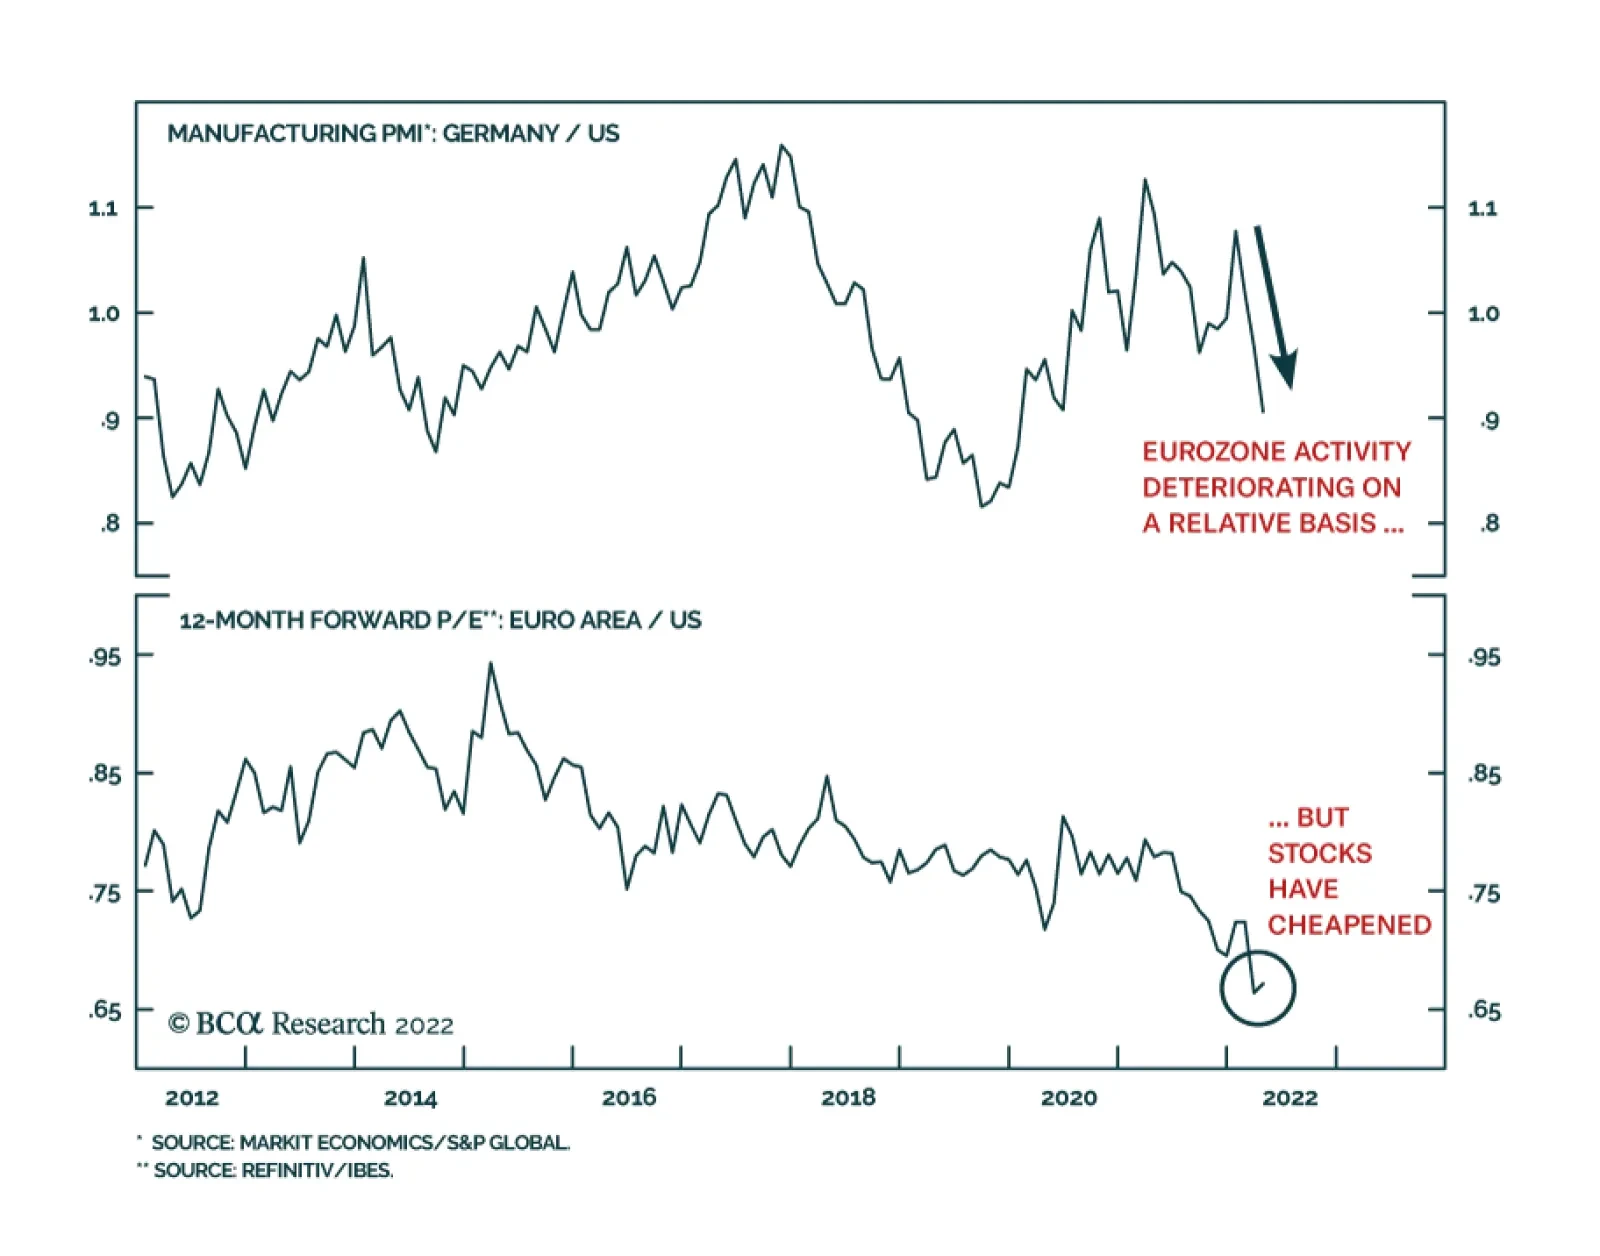
The German Manufacturing PMI has been declining relative to its US counterpart since January, underscoring that the Eurozone economy is facing stronger headwinds. Hard data corroborates this dynamic. The Euro Area’s Q1 GDP and CPI releases suggest that the…
Listen to a short summary of this report. Executive Summary The Number Of Babies Born In China Has Fallen By Close To 30% Since 2019
The Number Of Babies Born In China Has Fallen By Close To 30% Since 2019
The Number Of Babies Born In China Has Fallen By Close To 30% Since 2019
The number of births collapsed during the pandemic. While the preliminary evidence suggests that fertility rates are starting to recover in most developed economies, they remain well below the level necessary to maintain a stable population. Aging populations are putting strain on pension and health care systems. They are also threatening to undermine geopolitical influence. The conventional wisdom is that there is not much that can be done to lift fertility rates. While it is true that government subsidies to encourage parents to have more children are not especially effective, other policies, such as cheaper child care, are more promising. Rather than discouraging property investment, China is likely to increase housing supply in order to make family formation more affordable. This could boost commodity demand. More contentiously, the use of IVF technologies to select for certain traits such as higher intelligence in children could open up a new front on the geopolitical battlefield that few analysts are expecting. Regardless of government policy, birth rates will eventually rise of their own accord because both cultural and genetic evolution will select for families that wish to have more children. In the long run, faster population growth will lead to stronger corporate sales, which is a plus for equities. Over a shorter-term horizon, however, the global dependency ratio could end up increasing, as the number of retirees rises while the number of children that parents need to support goes up. This could put upward pressure on interest rates and bond yields. Bottom Line: Contrary to popular opinion, global fertility rates may be bottoming and could rise significantly over the long run. While this trend will eventually benefit stocks, it is likely to come at the expense of higher bond yields. Dear Client, We tactically downgraded global equities from overweight to neutral on February 28th. As we discussed last week in our report entitled “Here Comes Goldilocks,” we see a more fortuitous environment emerging in the second half of the year, which suggests that stocks will likely be higher over a 12-month horizon. This week, we step back from recent market action to focus on a long-term investment theme of great importance: demographic change. Contrary to the conventional wisdom that sees birth rates continuing to fall over the next few decades, we argue that developed economies may be on the cusp of a strong and sustained baby boom. I will be visiting clients in the San Francisco Bay Area next week. Instead of our regular report, we will be sending you a Special Report written by Irene Tunkel, BCA’s Chief US Equity Strategist. Irene will discuss inflation regimes and their implications for US equities. Best regards, Peter Berezin, Chief Global Strategist Baby Bust At the start of the pandemic, some speculated that with little else to do, couples would spend more time in bed, leading to a mini baby boom. As it turned out, the exact opposite happened: Birth rates plunged around the world. In the US, the number of babies born in January 2021 was about 10% lower than one would have expected based on the pre-pandemic trend. Similar shortfalls were observed in the UK, France, Italy, Spain, and Japan (Chart 1). In China, the number of births fell by almost 30% between 2019 and 2021 to the lowest level since 1949 (Chart 2). Chart 1The Birth Rate Has Recovered Since The Start Of The Pandemic But Remains Below Levels Consistent With A Stable Population
The Coming Stork Wars
The Coming Stork Wars
Chart 2The Number Of Babies Born In China Has Fallen By Close To 30% Since 2019
The Number Of Babies Born In China Has Fallen By Close To 30% Since 2019
The Number Of Babies Born In China Has Fallen By Close To 30% Since 2019
While the pandemic continues to restrain fertility in China, the latest data from developed economies suggest births have rebounded. Nevertheless, birth rates remain far below the level necessary to maintain stable populations. A recent study in The Lancet estimated that more than three-quarters of countries would have below-replacement fertility rates by the end of the century. The study estimated that the global population would peak at 9.7 billion in 2064 and decline to 8.8 billion by 2100. Alarm Over Low Birth Rates Low birth rates have become a major cause of concern for policymakers. Aging populations are putting strain on pension and health care systems. The OECD expects the old-age dependency ratio to double from 30% to 60% by 2075 (Chart 3). Pension spending in the OECD is projected to rise by 1.4% of GDP over the next 40 years. Chart 3Conventional Forecasts Expect The Population To Grey Over The Coming Decade
The Coming Stork Wars
The Coming Stork Wars
Chart 4The UN Projects China's Working-Age Population Will Shrink By 400 Million Over The Remainder Of The Century
The UN Projects China's Working-Age Population Will Shrink By 400 Million Over The Remainder Of The Century
The UN Projects China's Working-Age Population Will Shrink By 400 Million Over The Remainder Of The Century
Health care spending is likely to grow at an even faster pace. In the US, the Congressional Budget Office sees federal government-financed health care spending rising from 5.7% of GDP to 9.4% of GDP by 2050. As has been the case in Japan and Russia, and could be the case in China, a shrinking population threatens to undermine geopolitical influence. The UN estimates that China’s working-age population will decline from about 1 billion to less than 600 million by the end of the century. By 2100, Nigeria’s working-age population is projected to approach China’s (Chart 4). It is difficult to be an economic and military superpower if you do not have enough workers and soldiers. Pro-Natal Subsidies: Little Bang for the Buck Governments are responding by adopting increasingly aggressive pro-natal policies. According to the UN, more than 50 countries have officially declared their intention to increase fertility rates (Chart 5). Chart 5Governments Are Actively Trying To Raise Fertility Rates
The Coming Stork Wars
The Coming Stork Wars
Chart 6Fertility Rates Keep Dropping In OECD Countries Amid Rising Government Incentives
Fertility Rates Keep Dropping In OECD Countries Amid Rising Government Incentives
Fertility Rates Keep Dropping In OECD Countries Amid Rising Government Incentives
Various European countries, ranging from Estonia, Germany, Greece, Finland, France, Italy, and Lithuania to the UK offer varying bonus payments to new parents. Japan and Singapore both have baby bonus schemes. South Korea, which has the lowest fertility rate in the world, recently increased the reward it pays to mothers from US$500 to US$1,700. The most significant pro-natal shift has come from China. After having officially abandoned its one-child policy in 2016, China announced last year that it will allow couples to have up to three children. We expect China to introduce generous subsidies to encourage childbirth over the next few years. Will such policies arrest the decline in birth rates? There are certainly reasons to be skeptical. Chart 6 shows that spending on family benefits in OECD economies rose from 1.5% to 2.1% of GDP over the past 40 years. Yet, the fertility rate fell from 2.25 to 1.66 over this period. Can Anything Turn the Tide? A number of structural forces have contributed to lower fertility rates. These include increased female labor market participation, readily available birth control, falling child mortality, and rising housing and educational costs. The availability of government-provided income support and health care has also arguably reduced the historic role that children have played in supporting their parents in old age. The conventional wisdom is that these forces will only strengthen in the future, ensuring that fertility rates keep dropping. I am not so sure. Are Children Inferior, Normal, or Veblen goods? While it is rather awkward to think of the decision to have children in economic terms, there is some logic to this approach. Economists tend to distinguish between substitution and income effects. The substitution effect for children is negative: As wages rise, the opportunity cost of having children goes up. In contrast, a number of studies have documented that the income effect is positive: Give a couple an extra $1 million, no strings attached, and that could push them over the line in deciding to have an additional child (in economic parlance, children are “normal” rather than “inferior”). Economists have long known that labor supply curves tend to be “backward bending” (Charts 7A & B). The classic example is that of leisure. As wages initially rise from low levels, people may seek to work more (and hence, consume less leisure). Eventually, however, if wages rise enough, people will cut back on work in order to enjoy the fruits of their labor. Chart 7ABackward-Bending Demand Curves May Also Apply To Children
The Coming Stork Wars
The Coming Stork Wars
Chart 7BLower Child-Rearing Costs Would Improve The Demographic Problem
The Coming Stork Wars
The Coming Stork Wars
The same sort of backward-bending demand curve may apply to children. As wages rise above a certain threshold, parents may decide that they can afford to have more children. Chart 8 shows that the correlation between per capita income and realized fertility has turned positive in developed economies. Chart 8Correlation Between Incomes And Realized Fertility Has Turned Positive In Developed Countries
The Coming Stork Wars
The Coming Stork Wars
Looking out, it is possible that children will become “Veblen” goods, named after nineteenth-century economist Thorstein Veblen, who coined the term “conspicuous consumption.” With many luxury goods now available to the masses, what better way to signal that one has made it to the top than to have five kids in Manhattan or Beverly Hills? How Expensive Are Children, Really? Across most developed economies, women tend to end up having fewer children than they would like (Chart 9). While difficulty in finding a suitable spouse is sometimes cited as a reason, the financial hardship associated with parenting usually ranks higher. Chart 9Most Women Are Having Fewer Children Than They Desire
The Coming Stork Wars
The Coming Stork Wars
Chart 10Depression Rates Among Children And Teenagers Have Been Increasing Over The Past Decade
The Coming Stork Wars
The Coming Stork Wars
According to one recent estimate, it costs nearly $300,000, excluding college tuition, to raise a child in the US. This number, however, is conditional on what society currently deems appropriate for rearing children. If the incremental cost of a child were to decline, the slope of the budget constraint in Chart 7B would become flatter, implying that both the income and substitution effects would reinforce each other in the direction of having more children. Could society eventually conclude that the cost of having a child is not as large as widely perceived? The idea is not as far-fetched as it sounds. Having turned 50 this week, I find it interesting to look back at how much cultural norms towards kids have changed over the past few decades. Growing up in Hamilton Ontario, I remember taking the public bus alone at the age of 10 to school, the pool, or anywhere else I wanted to go. Are kids even allowed to leave the house unattended anymore? As Derek Thompson points out in a recent article in The Atlantic, American parents have nearly doubled the amount of time spent raising their kids. And what has the advent of helicopter parenting achieved? It is difficult to point to any concrete benefits. Depression rates among children and teenagers have soared (Chart 10). While the proliferation of social media has exacerbated childhood angst, the tendency for parents to try to shield their children from hardship and failure has probably only made things worse. Does Schooling Matter Much? Sticking with the issue of schooling, to what extent does the modern parental preoccupation with education actually benefit children? Probably a lot less than parents realize. IQ is highly correlated with educational achievement and many other favorable life outcomes (Chart 11). IQ scores are by far the best predictors of job performance, much better than fashionable concepts such as “emotional intelligence” (Chart 12). Chart 11IQ Tests Don’t Just Measure How Well You Can Do On An IQ Test
The Coming Stork Wars
The Coming Stork Wars
Chart 12Cognitive Ability Matters A Lot For Job Performance
The Coming Stork Wars
The Coming Stork Wars
In healthy, well-nourished populations, genetics explains about 50% of IQ variation at age ten and 80% in adulthood (Chart 13). In fact, IQ is almost as heritable as height (Chart 14). Chart 13The Heritability Of IQ Reaches 80% By Adulthood
The Coming Stork Wars
The Coming Stork Wars
Chart 14IQ Is Almost As Heritable As Height
The Coming Stork Wars
The Coming Stork Wars
When a child suffers from economic or social deprivation, improvements to their environment can have a large positive impact on their cognitive performance. However, beyond a certain environmental threshold, there is not much that parents can do. A recent study concluded that “there is only a marginal and inconsistent influence of parenting on offspring IQ in adolescence and young adulthood.” Table 1A Poisoned Chalice? Genetic Screening Can Raise IQ
The Coming Stork Wars
The Coming Stork Wars
Even musical training, which parents often spend a fortune on, does not appear to generate any knock-on benefits for math or language skills. As much as I hate to say it, the evidence suggests that the most reliable way to enhance a child’s educational prospects is to endow them with high IQ genes. I will not speak to the questionable ethics of doing so, but as I discussed in my report on the rise and fall of human intelligence a few years ago, the technology is coming. Carl Shulman and Nick Bostrom estimate that genetic screening could boost average IQs by up to 65 points in five generations (Table 1). The Stork Wars The ability to engineer high-IQ children through IVF technologies could open up a front on the geopolitical battlefield that few analysts are expecting. Such a battlefield for geopolitical supremacy will take place at a time when China and Russia, on the one side, and much of the West, on the other side, are moving in polar opposite directions on a variety of cultural issues. The empirical evidence suggests that there is a U-shaped relationship between gender equality and fertility rates. Both patriarchal societies, such as those in parts of the Middle East, and egalitarian societies, such as those in Scandinavia, have been able to maintain relatively high fertility levels. Between these two extremes, fertility rates are typically well below replacement. Whereas most Western nationals have sought to promote gender equality in recent years, China and Russia have shifted in a more traditionalist direction. Last April, China’s government shut down a number of feminist social media groups. This followed a statement by China's Education Ministry that the government would seek to “cultivate masculinity.” Boys were becoming “delicate, timid and effeminate,” a key government advisor declared. Ironically, both the traditionalist and egalitarian approaches could lift fertility rates, but at the cost of an ever-wider cleavage in the global culture wars. The Long-Term Outlook for Fertility Rates: Up, Up, and Away? In a world of abundant material resources, a steady or declining population is not an evolutionary stable equilibrium. As long as there are some selection pressures towards having more offspring, in the absence of offsetting forces, evolution will push up fertility rates. In the pre-industrial era, parents with many children often struggled to keep enough food on the table. The correlation between parent and child fertility was close to zero, meaning that children who came from big families did not have more surviving offspring than children from small families. After the Industrial Revolution, the correlation turned positive, and by most indications, has been rising over the past few decades. Were it not for the positive correlation between parent and child fertility, global population levels would be even lower today. How high could birth rates climb if the cultural forces, which have suppressed fertility over the past century, abate? The natural tendency is to think that evolution works too slowly to matter. However, this represents a misreading of the evidence. When there are evolutionary disequilibria – that is, when the environment changes in ways that renders existing reproductivity strategies suboptimal – natural selection can work surprisingly fast. Contrary to the widespread notion that human evolution stopped before the Agricultural Revolution, a recent study in Nature found that 88% of physiological traits have undergone polygenic change during the past 2,000 to 3,000 years. Using plausible estimates of intergenerational fertility correlations, Jason Collins and Lionel Page calibrate a model of global population growth. In contrast to more conventional demographic models, they conclude that global population growth, rather than turning negative later this century, will accelerate. In their baseline model without any heritability effects, the global total fertility rate falls to 1.82 by the end of the century. Once heritability effects are included, the projected total fertility rate rises to 2.21 (Chart 15). The largest effects are for Europe and North America, the first two regions to undertake a demographic transition to (temporarily) low birth rates. The authors see the European median total fertility rate rising to 2.46 by the end of the century, with the North American rate increasing to 2.67. Chart 15Natural Selection Could End Up Boosting Fertility Rates Over The Long Run
The Coming Stork Wars
The Coming Stork Wars
Notably, the support ratio – the ratio of workers-to-consumers – continues to fall in their model over the remainder of the century. They conclude: “Once the increase in number of children is taken into consideration, the higher number of children in the heritability model merely shifts the nature of the burden rather than ameliorating it.” Investment Conclusions The world is at a demographic inflection point. After rising steadily for four decades, the global support ratio has peaked (Chart 16). Baby boomers are beginning to leave the labor market en masse. While they were working, they accumulated a lot of assets. In the US, baby boomers hold more than half of all household wealth (Chart 17). Chart 16Less Workers And More Consumers Over The Next Decades
Less Workers And More Consumers Over The Next Decades
Less Workers And More Consumers Over The Next Decades
Chart 17Baby Boomers Hold More Than Half Of Wealth In The US
The Coming Stork Wars
The Coming Stork Wars
Going forward, rather than working and saving, baby boomers will spend down their wealth. The global pool of savings will shrink, putting upward pressure on equilibrium real interest rates and bond yields. Faced with the prospect of shrinking work forces, strained social security systems, and declining geopolitical influence, countries with low or negative population growth will offer increasingly generous subsidies to encourage couples to have more children. The resulting bigger budget deficits will further drain national savings. In and of themselves, government subsides are unlikely to significantly boost birth rates. More holistic policies will be needed, including steps to reduce the cost of child care and housing. Rather than discouraging property investment, China is likely to increase housing supply in order to make family formation more affordable. This could help support commodity demand. Governments will try to influence the social and cultural narrative on family matters.In some cases, the impact could be quite innocuous, such as China’s decision to ban for-profit tutoring companies in order to ease pressure on students and parents. In other cases, the impact could be very contentious, leading to an escalation in the so-called culture wars. Regardless of the policy measures that governments adopt, birth rates will eventually rise of their own accord because both cultural and genetic evolution will select for families that wish to have more children. In the long run, faster population growth will lead to stronger corporate sales, which is a plus for equities. Over a shorter-term horizon, however, the global dependency ratio could end up increasing, as the number of retirees rises while the number of children that parents need to support goes up. On balance, therefore, we see demographic trends as being somewhat negative for stocks over the next one-or-two decades. Peter Berezin Chief Global Strategist peterb@bcaresearch.com Follow me on LinkedIn Twitter View Matrix
The Coming Stork Wars
The Coming Stork Wars
Special Trade Recommendations Current MacroQuant Model Scores
The Coming Stork Wars
The Coming Stork Wars
Executive Summary German GeoRisk Indicator
German GeoRisk Indicator
German GeoRisk Indicator
Russia and Germany have begun cutting off each other’s energy in a major escalation of strategic tensions. The odds of Finland and Sweden joining NATO have shot up. A halt to NATO enlargement, particularly on Russia’s borders, is Russia’s chief demand. Tensions will skyrocket. China’s reversion to autocracy and de facto alliance with Russia are reinforcing the historic confluence of internal and external risk, weighing on Chinese assets. Geopolitical risk is rising in South Korea and Hong Kong, rising in Spain and Italy, and flat in South Africa. France’s election will lower domestic political risk but the EU as a whole faces a higher risk premium. The Biden administration is doubling down on its defense of Ukraine, calling for $33 billion in additional aid and telling Russia that it will not dominate its neighbor. However, the Putin regime cannot afford to lose in Ukraine and will threaten to widen the conflict to intimidate and divide the West. Trade Recommendation Inception Date Return LONG GLOBAL DEFENSIVES / CYCLICALS EQUITIES 2022-01-20 14.2% Bottom Line: Stay long global defensives over cyclicals. Feature Chart 1Geopolitical Risk And Policy Uncertainty Drive Up Dollar
Geopolitical Risk And Policy Uncertainty Drive Up Dollar
Geopolitical Risk And Policy Uncertainty Drive Up Dollar
The dollar (DXY) is breaking above the psychological threshold of 100 on the back of monetary tightening and safe-haven demand. Geopolitical risk does not always drive up the dollar – other macroeconomic factors may prevail. But in today’s situation macro and geopolitics are converging to boost the greenback (Chart 1). Global economic policy uncertainty is also rising sharply. It is highly correlated with the broader trade-weighted dollar. The latter is nowhere near 2020 peaks but could rise to that level if current trends hold. A strong dollar reflects slowing global growth and also tightens global financial conditions, with negative implications for cyclical and emerging market equities. Bottom Line: Tactically favor US equities and the US dollar to guard against greater energy shock, policy uncertainty, and risk-aversion. Energy Cutoff Points To European Recession Chart 2Escalation With Russia Weighs Further On EU Assets
Escalation With Russia Weighs Further On EU Assets
Escalation With Russia Weighs Further On EU Assets
Russia is reducing natural gas flows to Poland and Bulgaria and threatening other countries, Germany is now embracing an oil embargo against Russia, while Finland and Sweden are considering joining NATO. These three factors are leading to a major escalation of strategic tensions on the continent that will get worse before they get better, driving up our European GeoRisk indicators and weighing on European assets (Chart 2). Russia’s ultimatum in December 2021 stressed that NATO enlargement should cease and that NATO forces and weapons should not be positioned east of the May 1997 status quo. Russia invaded Ukraine to ensure its military neutrality over the long run.1 Finland and Sweden, seeing Ukraine’s isolation amid Russian invasion, are now reviewing whether to change their historic neutrality and join NATO. Public opinion polls now show Finnish support for joining at 61% and Swedish support at 57%. The scheduling of a joint conference between the country’s leaders on May 13 looks like it could be a joint declaration of their intention to join. The US and other NATO members will have to provide mutual defense guarantees for the interim period if that is the case, lest Russia attack. The odds that Finland and Sweden remain neutral are higher than the consensus holds (given the 97% odds that they join NATO on Predictit.org). But the latest developments suggest they are moving toward applying for membership. They fear being left in the cold like Ukraine in the event of an attack. Russia’s response will be critical. If Russia deploys nuclear weapons to Kaliningrad, as former President Dmitri Medvedev warned, then Moscow will be making a menacing show but not necessarily changing the reality of Russia’s nuclear strike capabilities. That is equivalent to a pass and could mark the peak of the entire crisis. The geopolitical risk premium would begin to subside after that. Related Report Geopolitical StrategyLe Pen And Other Hurdles (GeoRisk Update) However, Russia has also threatened “military-political repercussions” if the Nordics join NATO. Russia’s capabilities are manifestly limited, judging by Ukraine today and the Winter War of 1939, but a broader war cannot entirely be ruled out. Global financial markets will still need to adjust for a larger tail risk of a war in Finland/Sweden in the very near term. Most likely Russia will retaliate by cutting off Europe’s natural gas. Clearly this is the threat on the table, after the cutoff to Poland and Bulgaria and the warnings to other countries. In the near term, several companies are gratifying Russia and paying for gas in rubles. But these payments violate EU sanctions against Russia and the intention is to wean off Russian imports as soon as possible. Germany says it can reduce gas imports starting next year after inking a deal with Qatar. Hence Russia might take the initiative and start reducing the flow earlier. Bottom Line: If Europe plunges into recession as a result of an immediate natural gas cutoff, then strategic stability between Russia and the West will become less certain. The tail risk of a broader war goes up. Stay cyclically long US equities over global equities and tactically long US treasuries. Stay long defense stocks and gold. Stay Short CNY At the end of last year we argued that Beijing would double down on “Zero Covid” policy in 2022, at least until the twentieth national party congress this fall. Social restrictions serve a dual purpose of disease suppression and dissent repression. Now that the state is doubling down, what will happen next? The economy will deteriorate: imports are already contracting at a rate of 0.1% YoY. The manufacturing PMI has fallen to 48.1 and the service sector PMI to 42.0, indicating contraction. Furthermore, social unrest could emerge, as lockdowns serve as a catalyst to ignite underlying socioeconomic disparities. Hence the national party congress is less likely to go smoothly, implying that investors will catch a glimpse of political instability under the surface in China as the year progresses. The political risk premium will remain high (Chart 3). Chart 3China's Confluence Of Domestic And Foreign Risk Weighs On Stocks And Currency
China's Confluence Of Domestic And Foreign Risk Weighs On Stocks And Currency
China's Confluence Of Domestic And Foreign Risk Weighs On Stocks And Currency
While Chairman Xi Jinping is still likely to clinch another ten years in power, it will not be auspicious amid an economic crash and any social unrest. Xi could be forced into some compromises on either Politburo personnel or policy adjustments. A notable indicator of compromise would be if he nominated a successor, though this would not provide any real long-term assurance to investors given the lack of formal mechanisms for power transfer. After the party congress we expect Xi to “let 100 flowers bloom,” meaning that he will ease fiscal, regulatory, and social policy so that today’s monetary and fiscal stimulus can work effectively. Right now monetary and fiscal easing has limited impact because private sector actors are averse to taking risk. Easing policy to boost the economy could also entail a diplomatic charm offensive to try to convince the US and EU to avoid imposing any significant sanctions on trade and investment flows, whether due to Russia or human rights violations. Such a diplomatic initiative would only succeed, if at all, in the short run. The US cannot allow a deep re-engagement with China since that would serve to strengthen the de facto Russo-Chinese strategic alliance. In other words, an eruption of instability threatens to weaken Xi’s hand and jeopardize his power retention. While it is extremely unlikely that Xi will fall from power, he could have his image of supremacy besmirched. It is likely that China will be forced to ease a range of policies, including lockdowns and regulations of key sectors, that will be marginally positive for economic growth. There may also be schemes to attract foreign investment. Bottom Line: If China expands the range of its policy easing the result could be received positively by global investors in 2023. But the short-term outlook is still negative and deteriorating due to China’s reversion to autocracy and confluence of political and geopolitical risk. Stay short CNY and neutral Chinese stocks. Stay Short KRW South Koreans went to the polls on March 9 to elect their new president for a five-year term. The two top candidates for the job were Yoon Suk-yeol and Lee Jae-myung. Yoon, a former public prosecutor, was the candidate for the People Power Party, a conservative party that can be traced back to the Saenuri and the Grand National Party, which was in power from 2007 to 2017 under President Lee Myung-bak and President Park Geun-hye. Lee, the governor of the largest province in Korea, was the candidate for the Democratic Party, the party of the incumbent President Moon Jae-in. Yoon won by a whisker, garnering 48.6% of the votes versus 47.8% for Lee. The margin of victory for Yoon is the lowest since Korea started directly electing its presidents. President-elect Yoon will be inaugurated in May. He will not have control of the National Assembly, as his party only holds 34% of the seats. The Democratic Party holds the majority, with 172 out of 300 seats. The next legislative election will be in 2024, which means that President Yoon will have to work with the opposition for a good two years before his party has a chance to pass laws on its own. President-elect Yoon was the more pro-business and fiscally restrained candidate. His nomination of Han Duck-soo as his prime minister suggests that, insofar as any domestic policy change is possible, he will be pragmatic, as Han served under two liberal administrations. Yoon’s lack of a majority and nomination of a left-leaning prime minister suggest that domestic policy will not be a source of uncertainty for investors through 2024. Foreign policy, by contrast, will be the biggest source of risk for investors. Yoon rejects the dovish “Moonshine” policy of his predecessor and favors a strong hand in dealing with North Korea. “War can be avoided only when we acquire an ability to launch pre-emptive strikes and show our willingness to use them,” he has argued. North Korea responded by expanding its nuclear doctrine and resuming tests of intercontinental ballistic missiles with the launch of the Hwasong-17 on March 24 – the first ICBM launch since 2017. In a significant upgrade of North Korea’s deterrence strategy, Kim Yo Jong, the sister of Kim Jong Un, warned on April 4 that North Korea would use nuclear weapons to “eliminate” South Korea if attacked (implying an overwhelming nuclear retaliation to any attack whatsoever). Kim Jong Un himself claimed on April 26 that North Korea’s nuclear weapons are no longer merely about deterrence but would be deployed if the country is attacked. President-elect Yoon welcomes the possibility of deploying of US strategic assets to strengthen deterrence against the North. The hawkish turn is not surprising considering that North-South relations failed to make any substantive improvements during President Moon’s five-year tenure as a pro-engagement president. South Koreans, especially Yoon’s supporters, are split on whether inter-Korean dialogue should be continued. They are becoming more interested in developing their own nuclear weapons or at the very least deploying US nuclear weapons in South Korea. Half of South Korean voters support security through alliance with the US, while a third support security through the development of independent nuclear weapons. The nuclear debate will raise tensions on the peninsula. An even bigger change in South Korea’s foreign policy is its policy towards China. President-elect Yoon has accused President Moon of succumbing to China’s economic extortion. Moon had established a policy of “three No’s,” meaning no to additional THAAD missiles in South Korea, no to hosting other US missile defense systems, and no to joining an alliance with Japan and the United States. By contrast, Yoon’s electoral promises include deploying more THAAD and joining the Quadrilateral Dialogue (US, Japan, Australia, India). Polls show that South Koreans hold a low opinion of all of their neighbors but that China has slipped slightly beneath Japan and North Korea in favorability. Even Democratic Party voters feel more negative towards China. While negative attitudes towards China are not unique to Korea, there is an important difference from other countries: the Korean youth dislike China the most, not the older generations. Negative sentiment is less tied to old wounds from the Korean war and more related to ideology and today’s grievances. Younger Koreans, growing up in a liberal democracy and proud of their economic and cultural success, have been involved in campus clashes against Chinese students over Korean support for Hong Kong democrats. Negative attitudes towards China among the youth should alarm investors, as young people provide the voting base for elections to come, and China is the largest trading partner for Korea. Korea’s foreign policy will hew to the American side, at risk to its economy (Chart 4). Chart 4South Korean Geopolitical Risk Rising Under The Radar
South Korean Geopolitical Risk Rising Under The Radar
South Korean Geopolitical Risk Rising Under The Radar
President-elect Yoon’s policies towards North Korea and China will increase geopolitical risk in East Asia. The biggest beneficiary will be India. Both Korea and Japan need to find a substitute to Chinese markets and labor, which have become less reliable in recent years. South Korea’s newly elected president is aligned with the US and West and less friendly toward China and Russia. He faces a rampant North Korea that feels emboldened by its position of an arsenal of 40-50 deliverable nuclear weapons. The North Koreans now claim that they will respond to any military attack with nuclear force and are testing intercontinental ballistic missiles and possibly a nuclear weapon. The US currently has three aircraft carriers around Korea, despite its urgent foreign policy challenges in Europe and the Middle East. Bottom Line: Stay long JPY-KRW. South Korea’s geopolitical risk premium will remain high. But favor Korean stocks over Taiwanese stocks. Stay Neutral On Hong Kong Stocks Hong Kong’s leadership change will trigger a new bout of unrest (Chart 5). Chart 5Hong Kong: More Turbulence Ahead
Hong Kong: More Turbulence Ahead
Hong Kong: More Turbulence Ahead
On April 4, Hong Kong’s incumbent Chief Executive, Carrie Lam, confirmed that she would not seek a second term but would step down on June 30. John Lee, the current chief secretary of Hong Kong, became the only candidate approved to run for election, which is scheduled to be held on May 8. With the backing of the pro-Beijing members in the Election Committee, Lee is expected to secure enough nominations to win the race. Lee served as security secretary from when Carrie Lam took office in 2017 until June 2021. He firmly supported the Hong Kong extradition bill in 2019 and National Security Law in 2020, which provoked historic social unrest in those years. He insisted on taking a tough security stance towards pro-democracy protests. With Lee in power, Hong Kong will face more unrest and tougher crackdowns in the coming years, which will likely bring more social instability. Lee will provoke pro-democracy activists with his policy stances and adherence to Beijing’s party line. For example, his various statements to the news media suggest a dogmatic approach to censorship and political dissent. With the adoption of the National Security Law, Hong Kong’s pro-democracy faction is already deeply disaffected. Carrie Lam was originally elected as a popular leader, with notable support from women, but her popularity fell sharply after the passage of the extradition bill and National Security Law, as well as her mishandling of the Covid-19 outbreak. Her failure to handle the clashes between the Hong Kong people and Beijing damaged public trust in government. Trust never fully recovered when it took another hit recently from the latest wave of the pandemic. Putting another pro-Beijing hardliner in power will exacerbate the trend. Hong Kong equities are vulnerable not merely because of social unrest. During the era of US-China engagement, Hong Kong benefited as the middleman and the symbol that the Communist Party could cooperate within a liberal, democratic, capitalist global order. Hence US-China power struggle removes this special status and causes Hong Kong financial assets to contract mainland Chinese geopolitical risk. As a result of the 2019-2020 crackdown, John Lee and Carrie Lam were among a list of Hong Kong officials sanctioned by the US Treasury Department and State Department in 2020. Now, after the Ukraine war, the US will be on the lookout for any Hong Kong role in helping Russia circumvent sanctions, as well as any other ways in which China might further its strategic aims by means of Hong Kong. Bottom Line: Stay neutral on Hong Kong equities. Favor France Within European Equities French political risk will fall after the presidential election, which recommits the country to geopolitical unity with the US and NATO and potentially pro-productivity structural reforms (Chart 6). France is already a geopolitically secure country so the reduction of domestic political risk should be doubly positive for French assets, though they have already outperformed. And the Russia-West conflict is fueling a risk premium regardless of France’s positive developments. Chart 6France's Domestic Political Risk Will Subside But Russian War Will Keep Geopolitical Risk Elevated
France's Domestic Political Risk Will Subside But Russian War Will Keep Geopolitical Risk Elevated
France's Domestic Political Risk Will Subside But Russian War Will Keep Geopolitical Risk Elevated
The French election ended with a solid victory for the political establishment as we expected. President Emmanuel Macron gaining 58% of the vote to Marine Le Pen’s 42%. Macron beat his opinion polling by 4.5pp while Le Pen underperformed her polls by 4.5pp. A large number of voters abstained, at 28%, compared to 25.5% in 2017. The regional results showed a stark divergence between overseas or peripheral France (where Marine Le Pen even managed to get over half of the vote in several cases) and the core cities of France (where Macron won handily). Macron had won an outright majority in every region in 2017. Macron did best among the young and the old, while Le Pen did best among middle-aged voters. But Macron won every age group except the 50 year-olds, who want to retire early. Macron did well among business executives, managers, and retired people, but Le Pen won among the working classes, as expected. Le Pen won the lowest paid income group, while Macron’s margin of victory rises with each step up the income ladder. Macron’s performance was strong, especially considering the global context. The pandemic knocked several incumbent parties out of power (US, Germany) and required leadership changes in others (Japan, Italy). The subsequent inflation shock now threatens to cause another major political rotation in rapid succession, leaving various political leaders and parties vulnerable in the coming months and years (Australia, the UK, Spain). Only Canada and now France marked exceptions, where post-pandemic elections confirmed the country’s leader. The Ukraine war constitutes yet another shock but it helped Macron, as Le Pen had objective links and sympathies with Russian President Vladimir Putin. Macron’s timing was lucky but his message of structural reform for the sake of economic efficiency still resonates in contemporary France, where change is long overdue – at least compared with Le Pen’s proposal of doubling down on statism, protectionism, and fiscal largesse. The French middle class was never as susceptible to populism as the US, UK, and Italy because it had been better protected from the ravages of globalization. Populism is still a force to be reckoned with, especially if left-wing populists do well in the National Assembly, or if right-wing populists find a fresher face than the Le Pen dynasty. But the failure of populism in the context of pandemic, inflation, and war suggests that France’s political establishment remains well fortified by the economic structure and the electoral system. Whether Macron can sustain his structural reforms depends on legislative elections to be held on June 12-19. Early projections are positive for his party, which should keep a majority. Macron’s new mandate will help. Le Pen’s National Rally and its predecessors may perform better than in the past but that is not saying much as their presence in the National Assembly has been weak. Bottom Line: France is geopolitically secure and has seen a resounding public vote for structural reform that could improve productivity depending on legislative elections. French equities can continue to outperform their European peers over the long run. Our European Investment Strategy recommends French equities ex-consumer stocks, French small caps over large caps, and French aerospace and defense. Favor Spanish Over Italian Stocks Chart 7Italian And Spanish Political Risk Will Rise But Favor Spanish Stocks
Italian And Spanish Political Risk Will Rise But Favor Spanish Stocks
Italian And Spanish Political Risk Will Rise But Favor Spanish Stocks
What about Spain? It is still a “divided nation” susceptible to a rise in political risk ahead of the general election due by December 10, 2023 (Chart 7). In the past few months, a series of strategic mistakes and internal power struggles have led to a significant decline in the popularity of Spain’s largest opposition party, the People’s Party. Due to public infighting and power struggle, Pablo Casado was forced to step down as the leader of the People’s Party on February 23, as requested by 16 of the party’s 17 regional leaders. It is yet to be seen if the new party leader, Alberto Nunez Feijoo, can reboot People’s Party. The far-right VOX party will benefit from the People Party’s setback. The latter’s misstep in a regional election (Castile & Leon) gave VOX a chance to participate in a regional government for the very first time. Hence VOX’s influence will spread and it will receive greater recognition as an important political force. Meanwhile the ruling Socialist Worker’s Party (PSOE) faces anger from the public amid inflation and high energy prices. However, Spanish Prime Minister Pedro Sanchez’s decision to send offensive military weapons to Ukraine is widely supported among major parties, including even his reluctant coalition partner, Unidas Podemos. The People’s Party’s recent infighting gives temporary relief to the ruling party. The Russia-Ukraine issue caused some minor divisions within the government but they are not yet leading to any major political crisis, as nationwide pro-Ukraine sentiment is largely unified. The Andalusia regional election, which is expected this November, will be a check point for Feijoo and a pre-test for next year’s general election. Andalusia is the most populous autonomous community in Spain, consisting about 17% of the seats in the congress (the lower house). The problem for Sanchez and the Socialists is that the stagflationary backdrop will weigh on their support over time. Bottom Line: Spanish political risk is likely to spike sooner rather than later, though Spanish domestic risk it is limited in nature. Madrid faces low geopolitical risk, low energy vulnerability, and is not susceptible to trying to leave the EU or Euro Area. Favor Spanish over Italian stocks. Stay Constructive On South Africa The political and economic status quo is largely unchanged in South Africa and will remain so going into the 2024 national elections. Fiscal discipline will weaken ahead of the election, which should be negative for the rand, but the global commodity shortage and geopolitical risks in Russia and China will probably overwhelm any negative effects from South Africa’s domestic policies. Rising commodity prices have propped up the local equity market and will bring in much-needed revenue into the local economy and government coffers. But structural issues persist. Low growth outcomes amid weak productivity and high unemployment levels will remain the norm. The median voter is increasingly constrained with fewer economic opportunities on the horizon. Pressure will mount on the ruling African National Congress (ANC), fueling civil unrest and adding to overall political risk (Chart 8). Chart 8South Africa's Political Status Quo Is Tactically Positive For Equities And Currency
South Africa's Political Status Quo Is Tactically Positive For Equities And Currency
South Africa's Political Status Quo Is Tactically Positive For Equities And Currency
Almost a year has passed since the civil unrest episode of 2021. Covid-19 lockdowns have lifted and the national state of disaster has ended, reducing social tensions. This is evident in the decline of our South Africa GeoRisk indicator from 2021 highs. While we recently argued that fiscal austerity is under way in South Africa, we also noted that fiscal policy will reverse course in time for the 2024 election. In this year’s fiscal budget, the budget deficit is projected to narrow from -6% to -4.2% over the next two years. Government has increased tax revenue collection through structural reforms that are rooting out corruption and wasteful expenditure. But the ANC will have to tap into government spending to shore up lost support come 2024. Already, the ANC have committed to maintaining a special Covid-19 social-grant payment, first introduced in 2020, for another year. This grant, along with other government support, will feature in 2024 and possibly beyond. Unemployment is at 34.3%, its highest level ever recorded. The ANC cannot leave it unchecked. The most prevalent and immediate recourse is to increase social payments and transfers. Given the increasing number of social dependents that higher unemployment creates, government spending will have to increase to address rising unemployment. President Cyril Ramaphosa is still a positive figurehead for the ANC, but the 2021 local elections showed that the ANC cannot rely on the Ramaphosa effect alone. The ANC is also dealing with intra-party fighting. Ramaphosa has yet to assert total control over the party elites, distracting the ANC from achieving its policy objectives. To correct course, Ramaphosa will have to relax fiscal discipline. To this outcome, investors should expect our GeoRisk indicator to register steady increases in political risk moving into 2024. The only reason to be mildly optimistic is that South Africa is distant from geopolitical risk and can continue to benefit from the global bull market in metals. Bottom Line: Maintain a cyclically constructive outlook on South African currency and assets. Tight global commodity markets will support this emerging market, which stands to benefit from developments in Russia and China. Investment Takeaways Stay strategically long gold on geopolitical and inflation risk, despite the dollar rally. Stay long US equities relative to global and UK equities relative to DM-ex-US. Favor global defensives over cyclicals and large caps over small caps. Stay short CNY, TWD, and KRW-JPY. Stay short CZK-GBP. Favor Mexico within emerging markets. Stay long defense and cyber security stocks. We are booking a 5% stop loss on our long Canada / short Saudi Arabia equity trade. We still expect Middle Eastern tensions to escalate and trigger a Saudi selloff. Matt Gertken Chief Geopolitical Strategist mattg@bcaresearch.com Jesse Anak Kuri Associate Editor Jesse.Kuri@bcaresearch.com Yushu Ma Research Analyst yushu.ma@bcaresearch.com Guy Russell Senior Analyst GuyR@bcaresearch.com Footnotes 1 The campaign in the south suggests that Ukraine will be partitioned, landlocked, and susceptible to blockade in the coming years. If Russia achieves its military objectives, then Ukraine will accept neutrality in a ceasefire to avoid losing more territory. If Russia fails, then it faces humiliation and its attempts to save face will become unpredictable and aggressive. Strategic Themes Open Tactical Positions (0-6 Months) Open Cyclical Recommendations (6-18 Months) Regional Geopolitical Risk Matrix Geopolitical Calendar
Dear Client, This week, we present our inaugural report on ESG investing and the global energy transition. Henceforth, we will be publishing this research on the last Thursday of every month. Our principal ESG focus will be on the Environmental aspects of climate change, and the policies and actions undertaken to arrest the rise in the Earth's temperature via decarbonization. To date, the goal of Environmental policy in many jurisdictions – e.g., the US and EU – has been to disincentivize exploration, production, refining and transportation investment in hydrocarbons. At the same time, it has strongly incentivized investment in renewable-power generation. This has produced volatile marginal effects, forcing commodity markets to allocate increasingly scarce energy and metals supplies against a backdrop of increasing demand. It is at this nexus where investment opportunities will emerge. ESG's Social and Governance pillars are slower-moving change agents, with long-duration effects. Human-rights failures can destroy lives and lead to social unrest. Failed corporate governance and national governance can sharply alter firms' abilities and willingness to invest in environmentally responsible resource development. Failure in both dimensions can profoundly affect commodity supply-demand balances, and imperil the energy transition. Much of what passes for ESG measurement and compliance is self-reported – when data are available – and differs little from PR or virtue signaling. This is starting to change. Over the next 2-3 years, we expect a continued increase in government involvement in standardizing ESG reporting – cf, the SEC's recent proposal for reporting Scope 1, 2 and 3 emissions, and an increased focus on carbon pricing, which we believe will require a global carbon tax or carbon-price floor. This will be needed to incentivize investment in renewables and carbon-reduction and -capture technology, given the near-impossibility of harmonizing local and regional carbon-trading schemes. Otherwise climate clubs – i.e., trading blocs comprising states with shared ESG goals – will emerge, which will further fragment global trade. We are hopeful you will find this research useful in your decision making and investing. Bob Ryan Managing Editor, Commodity & ESG Strategy Executive Summary Fossil Fuels Dominate Global Energy Mix
Fossil Fuels Dominate Global Energy Mix
Fossil Fuels Dominate Global Energy Mix
Whether or not the SEC's proposal to disclose Scope 1, 2 and 3 emissions and other risk factors by firms it regulates will be adopted in whole or in part, we are confident it foreshadows deeper government involvement in the ESG arena in the near term in the US and EU. Carbon pricing will become increasingly important in global climate-change policy. We believe this will require a global carbon tax or carbon-price floor to incentivize investment in renewables and carbon-reduction and -capture technology. Failure to agree on at least a carbon price floor over the next 2-3 years almost surely will lead to the formation of climate clubs. In such clubs, like-minded states with similarly rigorous carbon-pricing and ESG disclosure requirements will allow trade among each other, but will levy tariffs against firms in states lacking such policies. Bottom Line: Governments are approaching a reckoning on their commitments to reduce or slow CO2 and greenhouse-gas (GHG) emissions. These are meant to hold the rise in the Earth's temperature to less than 2° C, or to approach the 1.5° C goal of the Paris Agreement. Reporting mandates like the EU's and the SEC's proposed CO2/GHG reports will help, as will increased subsidies and tax support for carbon-capture and hydrogen technology. However, a global carbon tax or carbon-price floor will be required to incentivize the investment needed to meet climate-change goals. Feature Voluntary programs and self-reporting are not reducing the concentration of CO2 and other GHGs fast enough to stay on track to meet Paris Agreement targets of holding the rise in the Earth's temperature to less than 2° C vs, pre-industrial levels, or preferably to 1.5° C. Over the next couple of years, we believe states will have to mandate additional ESG reporting – particularly on CO2 and other GHG emissions – and will require audits of programs and reports connected to GHG emissions, given the scope of what they are trying to accomplish. The EU got the ball rolling on reporting emissions, and now the US SEC is proposing new regulations as well. These will require the firms it regulates to disclose Scope 1, 2 and 3 emissions and other climate-related factors that constitute material risks to revenues and profits.1 Regardless of whether this proposal makes it through the legislative process, firms with operations in the EU will have to comply with similar reporting requirements if similar proposals are approved. Growing Energy Demand Fuels Higher CO2 Emissions World electricity demand – the principal focus of the global energy transition – grew 6% last year, on the back of strong GDP growth and weather-related demand. 2021 saw the highest electricity demand growth recorded by the IEA in the post-GFC recovery that began in 2010, amounting to 1,500 Twh year-on-year. Coal covered more than half of the growth in global electricity demand last year, and has constituted a major chunk of the electricity mix over a longer historical sample. Based on data starting in 2000, the world – primarily EM – has been net positive coal-fired power capacity (Chart 1) which reached an all-time high in 2021 as well, rising 9% y/y, while gas-fired generation grew 2%. The increase in fossil fuel generation pushed CO2 emissions globally up almost 6% to record highs. Renewable generation grew by 6% last year and is expected to meet most of the increase in electricity demand over the 2022-24 period with 8% p.a. growth, according to the IEA. Coal demand surged on the back of robust economic growth and weather-related factors, which helped propel global CO2 emissions to a record high at just over 36 billion MT in 2021, according to the IEA. This reversed the downturn in 2020 caused by the COVID-19 pandemic (Chart 2). Higher methane and nitrous oxide emissions, plus CO2 released by oil and gas flaring, lifted total energy-related GHG emissions to record levels last year as well. Chart 1Coal-Fired Power Has Been A Constant
Looking Through ESG Virtue Signaling
Looking Through ESG Virtue Signaling
Chart 2Fossil Fuels Dominate Global Energy Mix
Fossil Fuels Dominate Global Energy Mix
Fossil Fuels Dominate Global Energy Mix
We find evidence of a long-run relationship between real GDP and carbon dioxide emissions (Chart 3). This likely plays out through cointegration between oil consumption with real GDP, a relationship we exploit when estimating our monthly oil balances. While the income elasticity for emerging economies reliant on manufacturing – e.g., India and China – is positive, for the EU, a bloc of developed nations, that elasticity turns negative. This is consistent with the hypothesis of the Environmental Kuznets Curve, which states that initial increases in GDP per capita are associated with environmental degradation, however, beyond a point, income increases are associated with lower environmental damage.2 Interesting, as well, is the lack of any cointegration between GDP and US CO2 emissions. That may be due to the increased use of natgas vs. coal, and the fact that the energy intensity of US GDP continues to fall. Energy demand levels, including electricity, continues to exceed renewables supply. So even though renewable-energy generation growth is expected to meet 90% of energy demand growth from 2022 to 2024, the accumulation of CO2 and other GHGs will continue keeping the level of pollutants rising over that period. Chart 3CO2 Closely Tied To GDP
CO2 Closely Tied To GDP
CO2 Closely Tied To GDP
Recent research on global CO2 emissions growth for different countries based on historical values for population, GDP per capita and carbon intensity (measured as CO2 emissions per unit of GDP) projects median annual CO2 emissions in 2100 will be 34 Gigatons (Chart 4).3 This is significantly higher than the emissions required to keep temperature increases under 2° C by the end of the forecast period. The forecast is accompanied by four other CO2 emission scenarios provided by the Intergovernmental Panel on Climate Change (IPCC). Chart 4CO2 Projected Increases Overshoot Paris Agreement Targets
Looking Through ESG Virtue Signaling
Looking Through ESG Virtue Signaling
Carbon Tax Needed One of our high-conviction views is governments worldwide need to agree a global carbon tax that can be applied directly to CO2 emissions.4 If a global carbon tax cannot be agreed, a global carbon-price floor also could be used to incentivize the investment needed to meet climate-change goals. An IMF analysis entitled "Five Things To Know About Carbon Pricing" published in September notes: "An international carbon price floor can be strikingly effective. A 2030 price floor of $75 a ton for advanced economies, $50 for high-income emerging market economies such as China, and $25 for lower-income emerging markets such as India would keep warming below 2°C with just six participants (Canada, China, European Union, India, United Kingdom, United States) and other G20 countries meeting their Paris pledges." There may be legitimate grounds for arguing over the point at which the tax is collected – i.e., at the production or consumption stages – but, in our view, this would be far superior (and quicker to implement) than trying to harmonize the different carbon-trading schemes worldwide. In addition, the revenues generated by the tax would allow governments to protect the interests of lower-income constituencies, which are most adversely affected by such regressive taxes. We also have maintained failure to agree a carbon tax of some form over the next 2-3 years almost surely will lead to the formation of climate clubs, a notion pioneered by William Nordhaus, the 2018 Nobel Laurate.5 In Nordhaus's clubs, like-minded states with similarly rigorous carbon-pricing and ESG disclosure requirements will allow trade among each other, but will levy tariffs against firms in states lacking such measures. There is some evidence China already is preparing for this eventuality by limiting the export of high-carbon products to consumer states with strong climate-protection laws. For example, the EU last year rolled out a Carbon Border Adjustment Mechanism (CBAM), which it describes as "a climate measure that should prevent the risk of carbon leakage and supports the EU's increased ambition on climate mitigation, while ensuring WTO compatibility."6 Investment Implications Governments are moving quickly to address shortcoming in existing CO2 and GHG reduction policies. Among other things, the EU and US are proposing mandatory reporting on these emissions covering Scope 1, 2 and 3 emissions. In addition, China is refining its five-year plan to limit high-carbon exports, so that it does not run afoul of the EU's CBAM. We expect more of such measures going forward, as CO2 and GHG emissions continue to accumulate in the atmosphere at a rate that cannot be offset by existing policy. Robert P. Ryan Chief Commodity & Energy Strategist rryan@bcaresearch.com Ashwin Shyam Research Analyst Commodity & Energy Strategy ashwin.shyam@bcaresearch.com Paula Struk Research Associate Commodity & Energy Strategy paula.struk@bcaresearch.com Footnotes 1 Scope 1 covers GHG emissions firms directly generate on their own; Scope 2 applies to emissions indirectly created a purchasing electricity and other forms of energy; and Scope 3 covers indirect emissions produced up and down the firms' supply chain. These are deemed to be material risks that could impact firms' revenues and profitability, hence necessary information for investors and market participants generally. Please see SEC Proposes Rules to Enhance and Standardize Climate-Related Disclosures for Investors, published by the SEC on March 21, 2022. 2 For more information on this, please see ScienceDirect’s page on the Environmental Kuznets Curve. 3 Please see Country-based rate of emissions reductions should increase by 80% beyond nationally determined contributions to meet the 2 degree Celsius target (Liu and Rafter, 2021), published in Nature. 4 Please see Surging Metals Prices And The Case For Carbon-Capture, which we published on May 13, 2021. It is available at ces.bcaresearch.com. 5 Please see Nordhaus, William (2015), "Climate Clubs: Overcoming Free-riding in International Climate Policy," American Economic Review 105:4, pp. 1339–1370. 6 Please see Carbon Border Adjustment Mechanism: Questions and Answers, published by the European Commission on July 14, 2021. See also China issues guidelines under 14th 5-year plan to limit high-carbon product exports, published by S&P Global Platts on April 7, 2022. Platts notes this likely will be China's first FYP to include limits on "high-carbon products from the (refining and petrochemical) industry amid China's carbon neutrality journey. This comes amid expectations that foreign countries may levy tariffs like the EU's Cross Border Adjustment Mechanism, or CBAM, on such products in the future." Investment Views and Themes Recommendations Strategic Recommendations Trades Closed in 2022
Image
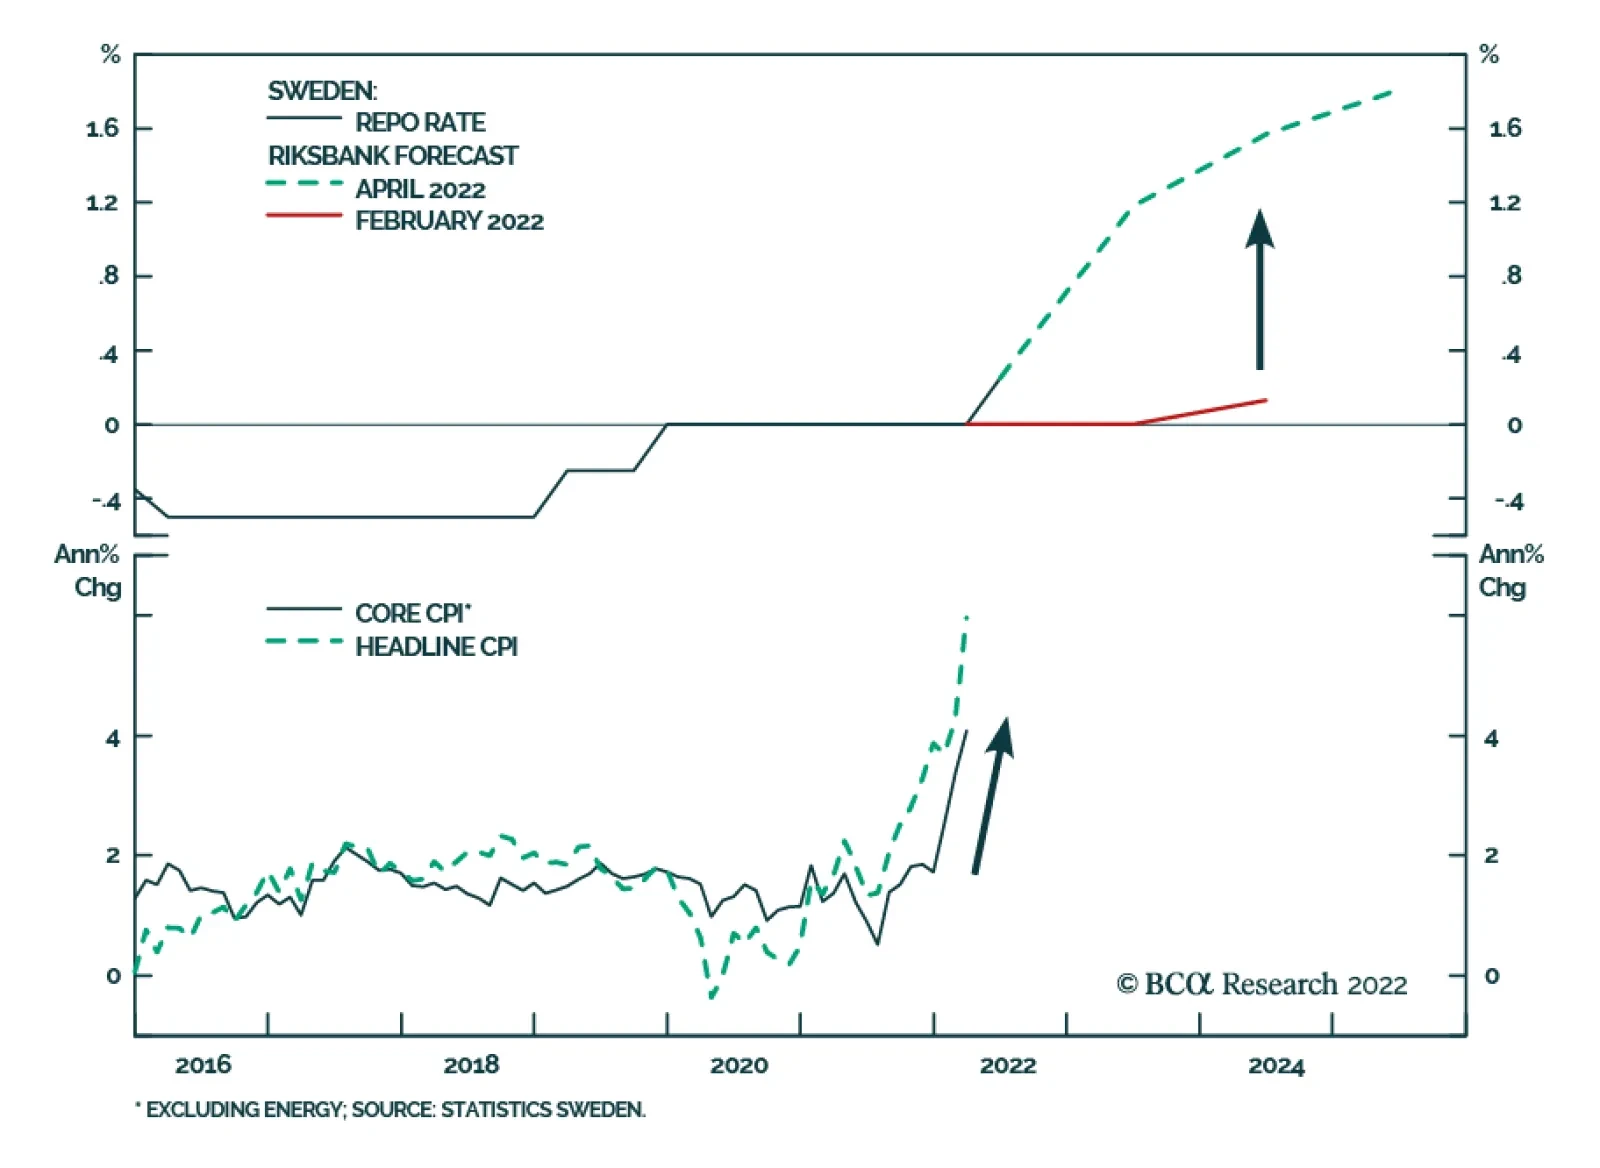
Sweden’s Riksbank unexpectedly lifted its policy rate from zero to 0.25% on Thursday – marking an earlier-than-anticipated start to the tightening cycle. The central bank also announced plans to reduce the pace of asset purchases in the second half of the…