Developed Countries
Last Wednesday’s post-FOMC rally proved short-lived. US equities lost all of the prior day’s gains on Thursday, with the selloff continuing on Friday. This sharp reversal tracks moves in the Treasury market. The 10-year bond yield declined by 4bps on…

Executive SummaryIn this report, we look at recent macroeconomic developments through the lens of the business cycle, inflation, and Treasury yield regimes to select winning sectors and styles.The US economy is currently in the slowdown stage of the business cycle, with all of its hallmark attributes, such as slowing growth, elevated inflation, and rising rates.We find that, despite being a real asset, equity performance deteriorates when inflation is on the rise. However, once inflation goes past its apex, the equity rebound is swift.During periods when both inflation and rates are rising, the Energy and Materials sectors tend to outperform, while the Financials and Consumer Discretionary sectors lag.The market is currently in a “high inflation and rising rates” regime but is about to transition to the “inflation is high but falling” regime, and today’s winners may turn into tomorrow’s losers. The new winners are likely to be the Financials, Consumer Discretionary, and Technology sectors.Bottom Line: As inflationary regimes shift, investors can tilt the odds of positive returns in their favor by taking a granular approach to sector selection.
We Are In High Inflation / Rising Rates Regime
We Are In High Inflation / Rising Rates Regime
So far, 2022 has not been a welcoming year for investors. All at once, slowing growth, surging inflation, impending monetary tightening, soaring energy prices, lockdowns in China, and a war in the heart of Europe have been thrown at them.With so much happening, it is difficult to separate signal from noise in the cross-currents of economic data. To make sense of the markets, we will look at recent developments through the lens of macroeconomic regimes, focusing on the stages of the business cycle, level and change in inflation, and the direction of Treasury yields.The Business Cycle Is In A Slowdown StageThe business cycle is a cornerstone of any investment decision as it underpins the fundamentals, and preordains the types of assets likely to outperform based on their level of risk and sensitivity to economic growth. The stage of the business cycle is a succinct way to summarize a wide range of economic data, such as capacity utilization, growth, policy, credit conditions, and valuation (Table 1). Table 1Business Cycle Is In A Slowdown Stage
Macroeconomic Regimes And Their Implications For US Equities
Macroeconomic Regimes And Their Implications For US Equities
While we are barraged with somewhat contradictory economic data, it is still fair to say that we are currently in the middle of the slowdown stage of the business cycle. Our proprietary business cycle indicator, constructed from a mix of soft and hard data across multiple economic dimensions, is trending down, consistent with that position (Chart 1). Furthermore:Growth is slowing, albeit off high levels, and the most recent disappointing ISM PMI is just another case in point. More concerning is that the new orders-to-inventories ratio has plunged (Chart 2);Unemployment is at a 2-year low of 3.6%, and there are currently two job openings per job seeker;Capacity utilization is high;Inflation is elevated;The Fed has commenced a monetary tightening cycle. Chart 1Economic Growth Is Slowing
Business Cycle Is In A Slowdown Stage
Business Cycle Is In A Slowdown Stage
Chart 2ISM PMI Disappointed
ISM PMI Disappointed
ISM PMI Disappointed
As such, during slowdown stage of a business cycle, returns tend to be lower than during recovery and expansion, while volatility is elevated (Chart 3).Chart 3During A Slowdown, Equity Returns Are Paltry, While Volatility Is Elevated
Macroeconomic Regimes And Their Implications For US Equities
Macroeconomic Regimes And Their Implications For US Equities
If equities are set to deliver pedestrian returns, we need to be more discerning in our sector and style selection. In an environment of slowing growth, growth stocks, large caps, and defensives tend to outperform (Chart 4). However, we have all observed that Growth has not fared that well due to rapidly rising interest rates and soaring inflation. In order to better understand the implication of the macroeconomic backdrop for equities, we need to drill further down into the inflation and interest-rate regimes.Chart 4During A Slowdown, Quality, Growth, And Defensives Outperform
Macroeconomic Regimes And Their Implications For US Equities
Macroeconomic Regimes And Their Implications For US Equities
Inflation And Rates RegimesHigh Inflation: Then And NowThe recent spike in inflation came as a shock to most money managers – the last time inflation hit this level was in the 1980s, which predated their investment careers.In the wake of major oil shocks, oil prices quadrupled in 1973-74 and doubled in 1979-80. The combination of high inflation with weak economic growth, fueled by repeated supply shocks, gave rise to the phenomenon of “stagflation”, i.e., soaring inflation accompanied by stagnating economic growth and high unemployment.The high inflation we are living through now was brought about by the pandemic, which ushered in unprecedented fiscal and monetary easing, soaring demand for consumer goods, and a disrupted global supply chain. More recently, inflation has been further exacerbated by the indirect effects of the war in Ukraine, such as skyrocketing energy, food, and materials prices. Despite the challenges of the current period, economic growth is still robust, and unemployment is at historically low levels. Energy and materials prices have soared, but not to the same extent as in the 1970s. And while economic growth is slowing, and stagflation is a risk, it is hardly inevitable.To ensure a more precise study of the sector and style analysis, we will separate the 1970-1984 period and look at it as a template for the performance of equities during a stagflation regime. We will use the 1984 to 2022 period to analyze sector performance during more ordinary inflation regimes.Equities Hate ItEquities are a real asset and, theoretically, should not be affected by inflation – sales and earnings growth are reported in nominal terms, and underlying economic growth is, by far, more important than inflation.Of course, reality is often different from theory, and businesses hate inflation: Not only do they have difficulty budgeting and planning ahead, but they are also often not able to convert sales growth into earnings growth, i.e., their costs may grow faster than their revenues. According to the most recent NFIB survey, 31% of small businesses consider inflation their biggest problem compared to 1-2% in 2019.In addition, high inflation is a harbinger of a hawkish Fed and rising interest rates. Hence, on balance, high inflation is bad news for equities (Chart 5). As inflation climbs, equity returns decline, as multiples contract in anticipation of lower earnings and higher discount rates (Chart 6). Chart 5Equities Underperform In A High-Inflation Environment
Macroeconomic Regimes And Their Implications For US Equities
Macroeconomic Regimes And Their Implications For US Equities
Chart 6High Inflation Leads To Multiple Contraction
Macroeconomic Regimes And Their Implications For US Equities
Macroeconomic Regimes And Their Implications For US Equities
Investing In Periods Of High-Inflation And Rising RatesHigh inflation is often accompanied by rising rates both because of strong economic growth and imminent monetary tightening which aims to arrest growth to combat inflation. As a result, high inflation comes hand in hand with elevated risk aversion and the repricing of more economically sensitive areas of the market.Indeed, when inflation is high (>3.5%) and rates are rising, median three-month equity returns are outright negative, and positive three-months returns occur less than 50% of the time (Chart 7). To beat the market, we need to tilt the return distribution in our favor.Chart 7We Are In High Inflation / Rising Rates Regime
We Are In High Inflation / Rising Rates Regime
We Are In High Inflation / Rising Rates Regime
When inflation is elevated (above 3.5%) and Treasury yields are climbing, the most appropriate portfolio stance is a tilt toward all-weather defensive sectors like Consumer Staples and Health Care, which hold their own in an environment of slowing growth, as well as sectors that command significant pricing power (Chart 8). The following is a brief summary of the winners and losers. Chart 8Sector Performance In High Inflation / Rising Rates Regime
Macroeconomic Regimes And Their Implications For US Equities
Macroeconomic Regimes And Their Implications For US Equities
High Inflation/Rising Rate WinnersEnergy: High oil prices are often one of the culprits behind runaway inflation, with the exception of the mid-1980s episode when Saudi Arabia drowned the world in oil, causing a collapse in oil prices, while inflation was on the rise. The energy sector has significant pricing power as it is upstream of the supply chain and can pass on costs to customers (Chart 9). This sector also benefits from high operating leverage. Outperformance usually peaks when inflation turns.Health Care: Health Care stocks tend to outperform when overall consumer prices advance. The non-cyclical nature of health care services reflects their resilience against economic volatility, irrespective of the direction of pricing pressures (Chart 10). Over the past few years, health care companies have struggled, mostly because of the pressure exerted on pharma by hospitals, insurers, and the government. However, recently, the sector’s pricing power has turned because of pent-up demand for medical procedures. Chart 9The Energy Sector Wields Significant Pricing Power
The Energy Sector Wields Significant Pricing Power
The Energy Sector Wields Significant Pricing Power
Chart 10Pricing Power Of The Health Care Sector Has Picked Up Thanks To Pent-up Demand
Pricing Power Of The Health Care Sector Has Picked Up Thanks To Pent-up Demand
Pricing Power Of The Health Care Sector Has Picked Up Thanks To Pent-up Demand
Consumer Staples: Historically, Consumer Staples have outperformed during periods of high inflation (Chart 11). Just like Health Care, this is a non-cyclical sector, because the demand for necessities is inelastic. While this sector is experiencing challenges because of the rising prices of raw materials, it is able to pass on its costs to customers, who have to allocate an increasing share of their budget to necessities. It has also helped multinationals in the S&P 500 index, as they invest in brand building, which now aids them to differentiate their offerings even when consumers are under duress.Utilities: Utilities is another quintessential defensive sector, with a stable revenue stream, significant pricing power, and profitability controlled by the regulators. Of course, one might argue that this is a highly leveraged sector which may be hurt by rising borrowing costs. However, it fares well, as regulators have a target return-on-investment for utilities companies, thus allowing them to raise prices to offset rising costs. Furthermore, with high inflation, long-term debt is smaller in real terms. Chart 11Consumer Staples Companies Have Invested In Brand-building
Consumer Staples Companies Have Invested In Brand-building
Consumer Staples Companies Have Invested In Brand-building
High Inflation/Rising Rates LosersConsumer Discretionary companies underperform in an environment of high and rising inflation as inflation reduces consumers’ purchasing power and forces them to shift spending away from discretionary goods and services, and toward necessities. The high negative correlation of the sector with the Consumer Drag Indicator is a case in point (Chart 12). Further, rising interest rates often follow high inflation, and weigh on demand for durable goods that require financing.Financials: High inflation is a headwind for the sector because monetary tightening which follows on the heels of high inflation tends to flatten the yield curve, affecting banks’ Net Income Margins (NIM), or the spread between loans and deposits. Inflation also hurts S&P Financials due to the mismatch between bank assets and liabilities. A typical bank has longer maturity for its assets (loans) than for its liabilities (deposits). Consequently, as inflation rises, this reduces the future net inflow because creditors demand higher interest rates, while the returns earned by the bank on its current loan book are mostly fixed by existing contracts. Chart 12Raging Inflation Cuts Into Consumers' Discretionary Spending
Raging Inflation Cuts Into Consumers' Discretionary Spending
Raging Inflation Cuts Into Consumers' Discretionary Spending
Inflation Will Turn Soon (Hopefully), And So Will Sector PerformanceInflation is likely to fade somewhat over the coming quarters, as supply chains normalize, and consumer demand wanes because of saturation and elevated prices. Arithmetic will also help, i.e., the base effect will kick in. Also, aggressive monetary policy is likely to slow economic growth and demand for labor further. With all of that, inflation will trend down but will reach the elusive 2% only years from now.However, when it comes to inflation, it is both the level of inflation and the direction of change that matter. While, overall, high inflation is bad for equities, it is necessary to differentiate between “inflation high and rising” and “inflation high and falling” regimes (Chart 13). As such, it is likely that we are about to shift into the “inflation is above 3.5% but falling” regime, where the median three-month return is 3.0% and returns are positive 69% of the time. We do anticipate a rebound in equities once the tighter monetary regime is priced in, and inflation shows signs of abating.Chart 13When Inflation Turns, Equities Will Rebound
Macroeconomic Regimes And Their Implications For US Equities
Macroeconomic Regimes And Their Implications For US Equities
With the Fed assuming an active role, we believe that going forward, equity returns will be more of a function of the monetary tightening cycle than of inflation. However, falling inflation readings may slow the pace of monetary tightening, or even put the Fed on hold.According to our analysis of sector performance in the “inflation is above 3.5% and is falling” regime, Energy and Materials will be the first sectors to reverse recent gains. The Consumer Discretionary sector is likely to rebound as pressure on consumer purses eases. Financials will also be among sectors that outperform in this regime, since fading inflation will help with asset/liability management. Consumer Staples and Health Care are likely to keep their outperformance going as inflation will continue to be an issue.Last, while empirical analysis does not show that the Technology sector outperforms when inflation is falling, we believe this will be the case based on the simple assumption that falling inflation will imply a lower discount rate (Chart 14). In this regime, we also anticipate a rotation from Value to Growth, and from Large to Small (Chart 15). Chart 14New Inflation Regime Will Usher In New Winners
Macroeconomic Regimes And Their Implications For US Equities
Macroeconomic Regimes And Their Implications For US Equities
Chart 15Changes In Inflation Regimes Brought About Market Rotations
Macroeconomic Regimes And Their Implications For US Equities
Macroeconomic Regimes And Their Implications For US Equities
Stagflation: Magnifying Glass On The 1970sStagflation, along with a recession, is now on investors’ minds – concern about the Fed making a policy mistake. After all, the Fed is already behind the curve, and it is hard to put the inflation genie back into the bottle. What would happen then?In this case, just as in the 1970s, we will see continued growth slowdown accompanied by raging inflation (Chart 16). Back then, equities pulled back every time inflation was on the rise (Chart 17), with Energy, Materials, and Health Care outperforming.The market rebounded at the first signs of inflation abating, reversing sector performance, and turning losers into winners, i.e., Consumer Discretionary and Real Estate started outperforming (Chart 18).Chart 16In The 1970s’ Stagflation Crushed Equities
Macroeconomic Regimes And Their Implications For US Equities
Macroeconomic Regimes And Their Implications For US Equities
Chart 17Energy And Materials Were Biggest Winners In the "Inflation High And Rising" Regime...
Macroeconomic Regimes And Their Implications For US Equities
Macroeconomic Regimes And Their Implications For US Equities
Chart 18...But They Gave Back Their Gains In "Inflation High But Falling" Regime
Macroeconomic Regimes And Their Implications For US Equities
Macroeconomic Regimes And Their Implications For US Equities
Bottom LineWe are in a slowdown stage of the business cycle, and Quality, Defensives, and Growth are expected to outperform. However, high inflation has mixed up all the cards and sent Growth into a tailspin. High inflation is unfavorable, not only for Growth but also for equities in general, even though they are a real asset. However, investors can shift the odds of positive returns in their favor by taking a granular approach to sector selection suitable for different inflation regimes.The market is currently in a “high inflation and rising rates” regime, with Energy and Materials outperforming. However, we are about to transition into the “inflation is high but falling” regime, and today’s winners may turn into losers. Defensives is the only group which holds up across all high inflation regimes, thanks to its earnings resilience even in the face of slowing growth. Irene TunkelChief Strategist, US Equity Strategyirene.tunkel@bcaresearch.com
Executive Summary Europe's Largest Import Bill: Oil
Die Cast By EU: Inflation, Recession Risks Rise
Die Cast By EU: Inflation, Recession Risks Rise
The EU crossed the Rubicon this week, proposing to eliminate Russian oil imports within six months. The speed of putting the sanctions into effect, and Russia’s retaliation, will be critical to whether the world endures continued inflationary pressures or whether a global recession ensues. Russia indicated it will launch its own round of sanctions in the near future, which could profoundly affect not only global oil and gas markets, but once again induce input price shocks to electricity markets – which will hit firms and households again with higher prices – and agricultural markets. Turmoil in commodity markets has opened a policy debate over whether the world will be forced to migrate to a new monetary order based on access to commodities and control of commodity flows, which would replace the fiat-money architecture that succeeded the post-WWII Bretton Woods system. This debate draws together numerous trends – the centrality of commodities to price levels and inflation; central-bank policy; failed regulation at commodity exchanges; and commodity scarcity due to weak capex. Bottom Line: Commodity markets are changing rapidly as fundamentals adapt to supply tightness and an extremely erratic demand recovery. However, this does not mark the beginning of a new Bretton Woods era. Markets adapt quickly to changing fundamentals and that will continue. Feature With its proposal this week to ban the import of Russian oil, the EU crossed the Rubicon and now will prepare for an escalation of its economic war with Russia. Oil imports are, by far, the EU's largest energy import expense, and Russia is its largest supplier (Chart 1). Russian natural gas exports to Europe account for 74% of its total natgas exports, although natgas comprises a much smaller share of Russia’s revenue than oil (Chart 2). In a pecuniary sense, oil is far more important, but in an economic sense gas is more meaningful for Europe. Chart 1Europe's Largest Import Bill: Oil
Die Cast By EU: Inflation, Recession Risks Rise
Die Cast By EU: Inflation, Recession Risks Rise
Chart 2Russia's Largest Market: Europe
Die Cast By EU: Inflation, Recession Risks Rise
Die Cast By EU: Inflation, Recession Risks Rise
Russia produced 10.1mm b/d of crude and condensates in 2021. Of the 4.7mm b/d of this that Russia exported, OECD Europe was its largest customer, at 50% of total, according to the US EIA. If Russia's production is curtailed by roughly 1mm b/d this year and next year due to sanctions, we estimate Brent prices could reach $120/bbl. Losing 1.8mm this year and another 700k b/d next year could push Brent prices above $140/bbl (Chart 3). On the natgas side, one-third of the ~ 25 Tcf of Russian production last year was exported via pipeline or as LNG, based on 2021 data from the EIA. This amounted to almost 9 Tcf. Most of this – 74% – was exported via pipeline to the OECD Europe. These are dedicated volumes flowing through Russia's network into Europe. Until the Power of Siberia pipeline is expanded – likely over the next 2-3 years — this gas will not be available for export. Chart 3Losing Russian Oil Exports Will Push Prices Sharply Higher
Losing Russian Oil Exports Will Push Prices Sharply Higher
Losing Russian Oil Exports Will Push Prices Sharply Higher
Oil and gas exports last year accounted for close to 40% of the Russian government's budget. Crude and product revenue last year came in at just under $180 billion, while pipeline and LNG shipments of natgas accounted for close to $62 billion of the Russian government's revenues. Clearly, the stakes are extremely high for Russia if Europe embargoes oil imports. Escalation Of Economic War Russian Energy Minister Alexander Novak last month threatened to shut off Russian exports of natural gas if the EU cut off oil imports. Whether – or how quickly – that threat is acted upon will be critical for Europe. Speculation around the EU's proposal to embargo oil imports of all kinds from Russia centers on the ban becoming effective by the end of this week, with a six-month phase-down of imports.1 It is still possible that the sanctions will be vetoed and revised. But with Germany changing its position and now willing to embargo oil, it is only a matter of time before the majority of the EU cuts off Russian oil imports. In response, Russia will launch its own round of embargoes, which could profoundly affect not only global oil and gas markets, but once again induce input-price shocks to electricity markets – which will hit household budgets and base-metals smelters and refiners – and agricultural markets, given the large share of natgas in fertilizers (Chart 4). It is not difficult to imagine base-metals refining operations closing again in Europe, along with crop-planting delays rising.2 On the back of this collateral damage from the cut-off of Russian oil and gas exports, we would expect inflation and inflation expectations to take another leg up. This comes against a backdrop in which central banks led by the US Fed already have initiated a rate-hiking program to address inflation that is running far hotter than previously forecast. Chart 4Tight Natgas Markets Drive Fertilizer/Grain Prices Higher Power, Fertilizer, Base Metals Could Be Shocked By Russian Cut-Offs
Tight Natgas Markets Drive Fertilizer/Grain Prices Higher Power, Fertilizer, Base Metals Could Be Shocked By Russian Cut-Offs
Tight Natgas Markets Drive Fertilizer/Grain Prices Higher Power, Fertilizer, Base Metals Could Be Shocked By Russian Cut-Offs
Policymakers Reassess Commodities This turmoil in commodity markets has ignited a policy debate over whether the world will be forced to migrate to a new monetary order. The new order, so the argument goes, would be based on access to commodities and control of commodity flows and would replace the fiat-money architecture that succeeded the post-WWII Bretton Woods system. This debate draws together numerous trends – the centrality of commodities to price levels and inflation; central-bank policy; failed regulation at commodity exchanges; non-USD invoicing and funding; and commodity scarcity – particularly in industrial commodities like oil, natgas and metals due to weak capex over almost a decade. The debates around these different crises are being framed around the heightened geopolitical awareness of the critical role of commodities in the language of financial markets. This is a novel innovation; however, it essentially is an argument by analogy and can obfuscate underlying causes and effects. Bretton Woods III In The Offing? Following WW II, the US and other advanced economies launched the Bretton Woods system, under which the US would operate and maintain a commodity-money regime – i.e., the gold standard – that maintained convertability of USD to gold upon demand. This post-World War II Bretton Woods (BW) system – call it BWI – remained in place until the early 1970s and made the USD the preeminent currency in the world during that period. Literally, the system, operated by the Fed, made the USD "as good as gold." That didn't last, as US domestic exigencies – the Vietnam War and the War on Poverty – forced the US to abandon gold-convertibility and adopt a fiat-money system to finance these multiple wars. Nevertheless the dollar retained its centrality to global markets. Call this fiat system BWII. As of 2022, the dollar remains the world’s dominant reserve currency, accounting for ~ 60% of the $12.25 trillion of foreign exchange reserves, according to IMF data (Chart 5).3 As a vehicle currency, it accounts for close to 90% of daily FX trading – amounting to ~ $6 trillion/day of turnover. The dollar also is the preeminent funding and invoice currency. Trade invoicing denominated in USD accounts for 93% of imports and 97% of exports worldwide. Chart 5USD Remains Dominant Reserve Currency
Die Cast By EU: Inflation, Recession Risks Rise
Die Cast By EU: Inflation, Recession Risks Rise
According to the WTO, global trade in 2019 (just before the COVID-19 pandemic) was just shy of $19 trillion (Chart 6). This global dominance of the USD means the dollar’s funding-currency role “mediates the transmission of U.S. monetary policy to global financing conditions.”4 This has been the case for the 23 years since the creation of the euro, including the periods before and after the 2008 global financial crisis. Chart 6USD Dominates World Trade
Die Cast By EU: Inflation, Recession Risks Rise
Die Cast By EU: Inflation, Recession Risks Rise
The dollar’s importance to the global economy has only grown since the BWI era.5 Obstfeld notes US gross external assets and liabilities relative to GDP “grow sharply (but roughly commensurately) up until the global financial crisis, reaching ratios to GDP in the neighborhood of 150 percent. Since then, assets have levelled off but liabilities have continued to grow.” The dollar faces a range of challenges, as we discuss below, but any discussion must begin with its resilience as the top currency – a resilience that spans the creation of the euro, the rise of China, vast US budget and trade deficits, multiple rounds of quantitative easing, and political instability in Washington. A Return To Commodity-Based Money? The full power of the Fed's role at the center of the global monetary system – as a reserve currency and as the preeminent medium for funding and invoicing trade – was revealed following the invasion of Ukraine by Russia. The US froze Russian foreign reserves, denied it access to the international SWIFT payments system, and imposed sanctions on Russian firms and individuals, and anyone trading with them. Following the US actions, Russia's economy was partially frozen out of global trade, banking and finance. Western partners abandoned their Russian investments, taking their capital and technology out of the country. Outside of the sanctions, individual firms such as refiners, shippers and trading companies “self-sanctioned” their dealings with Russia, and refused to handle inbound or outbound Russian commodities. Given the US capability revealed, and the threat posed to other countries should the US sanction them in a likely manner, new risks to the dollar system will emerge. The primacy of the USD, and the Fed's role in maintaining its central banking position to the world, are by no means assured. Indeed, other states – namely China – will try to insulate themselves from similar sanctions. India is apparently willing to trade with Russia in rubles. Saudi Arabia is exploring being paid in RMB for oil exports to China and a wide range of states could increase their acceptance of RMB at least to cover their growing trade with China. China has been pushing hard to have its RMB recognized and used as a global reserve currency, and a trade-invoicing and trade-funding currency. For this to happen, China also would have to allow its currency to become a vehicle currency – i.e., the anchor leg in FX trading. Zoltan Pozsar, a Credit Suisse analyst, recently penned an article exploring the new terrain exposed by the Russian invasion of Ukraine and the US and EU responses.6 For Pozsar, "Commodity reserves will be an essential part of Bretton Woods III, and historically wars are won by those who have more food and energy supplies – food to fuel horses and soldiers back in the day, and food to fuel soldiers and fuel to fuel tanks and planes today." Pozsar avers that his formulation of Bretton Woods III will reverse the disinflation created by globalization, and "serve up an inflationary impulse (de-globalization, autarky, just-in-case hoarding of commodities and duplication of supply chains, and more military spending to be able to protect whatever seaborne trade is left)." These conclusions are similar to conclusions we have reached over the course of the past few years, as it became increasingly apparent that the US was losing geopolitical clout relative to rising powers, mainly China, and that the international system was becoming multipolar and unstable. The Ukraine war confirmed the new environment of Great Power Rivalry. Nation-states will indeed amass and hoard commodities as they will need to gird for battle as this rivalry heats up. Preparation for war and war itself are historically inflationary (Chart 7). Chart 7War And Preparation For War Are Inflationary
War And Preparation For War Are Inflationary
War And Preparation For War Are Inflationary
However, countries still have to pay for commodities in a currency that exporters are willing to receive. Yet the biggest global oil and food exporters depend on the US for their security, except Russia. Even in base metals the US wields extraordinary influence over the non-aligned exporters. These states could reduce their dollar invoicing to cover their share of trade with countries outside the West, but their national security alliances and partnerships imply a hard-to-change view on which economies and currencies will be most stable over the long run. The dollar is again preeminent. China unquestionably wants to diversify away from the dollar. But China’s trade partners will have a limit on how much yuan cash they are willing to hold. If they want to recycle this cash into China’s economy, China must open its capital account. But this would reduce the Communist Party’s control of the domestic economy due to the Impossible Trinity (the yuan would have to float freely). So until China makes this change, the world is stuck in today’s monetary system. By contrast, if China totally closes its system due to domestic or foreign political threats, then the world faces a recession and investors will not be rushing to sell the dollar. For now China is trying to have it both ways: maintaining large foreign exchange reserves while gradually diversifying away from the dollar (Chart 8). China selling off its Treasury holdings and dollar reserves, which began in the aftermath of the Great Recession, is the biggest monetary shift since 1999, when the euro emerged and China’s purchases of Treasuries began to surge due to trade surpluses on the back of its joining the WTO. But there is little basis for China or anyone else to abandon fiat currencies and return to the gold standard. Fiat currencies enable states to control the money supply and hence to try to control their economies and societies. The Chinese are the least likely to abandon fiat currency given their laser focus on employment, manufacturing, and social stability. China is a commodity importer, so that if it seeks to amass commodities as strategic reserves in the midst of a commodity boom, it will pay top price. This means the yuan would need to be kept strong. But in fact China is allowing the yuan to depreciate, as it would face higher unemployment and instability if domestic demand were further suppressed by a rising yuan. China is already undergoing a painful transition away from export orientation – and Beijing has already acknowledged that de-industrialization should slow down because it poses a sociopolitical threat (Chart 9). A monetary revolution that strengthens the yuan at the expense of the dollar would force an immediate conclusion to China’s transition away from export-manufacturing. That would be politically destabilizing. Chart 8China Diversifies from USD - But Closed Capital Account Prevents Global RMB
China Diversifies from USD - But Closed Capital Account Prevents Global RMB
China Diversifies from USD - But Closed Capital Account Prevents Global RMB
Chart 9Stronger RMB Would De-Industrialize China At Great Political Risk
Stronger RMB Would De-Industrialize China At Great Political Risk
Stronger RMB Would De-Industrialize China At Great Political Risk
If China or other countries attempt to create a commodity base for their currencies, but simultaneously try to prevent a fixed exchange rate that constrains their money supply, then there will be little difference from a fiat currency regime. Today’s major reserve currency issuers already possess reserves of physical wealth (e.g. commodities) beneath their flexible monetary policy regimes – this dynamic would not inherently change. Of course, Europe, Japan, and the United Kingdom are the leading providers of reserve currencies outside the US and yet they are relatively lacking in commodity reserves. If global investors begin chasing currencies primarily on the basis of commodity reserves, the USD will not suffer the most, as the United States is a resource-rich country. China’s policy and strategy may become clearer after the twentieth party congress this fall, but most likely the current contradictions will persist. China will want to prolong the period of economic engagmeent with the West for as long as possible even as it prepares for a time when engagement is utterly broken. While China knows that the US will pursue strategic containment, and US-China engagement is over, it also knows that European leaders have a different set of interests. They have enough difficulty dealing with Russia and are not eager to expand their sanctions to China. Yet switching from dollar to euro reserves offers China little protection against sanctions in any major confrontation in the coming years. A radical decision by China to buy high and sell low (realize big losses on Treasuries and buy high-priced commodities) would show that Beijing is expecting Russian-style confrontation with the West immediately, which would scare foreign investors away from China. Net foreign direct investment in China has surged since the downfall of the Trump presidency (Chart 10). But that process would reverse as companies saw China going down Russia’s path and disengaging from the global monetary system. In that context, western governments would also penalize their own companies for investing in a geopolitical rival that was apparently preparing for conflict (while buttressing Russia). In short, private capital will flee countries that abandon the global financial system because that would be an economically inefficient decision taken for reasons of state security, and hence it would imply higher odds of conflict. Wealthy nations see China’s and other emerging markets’ foreign exchange reserves as “collateral” against asset seizures and geopolitical risks: if China reduces the collateral, private capital will feel less secure flowing into China.7 Chart 10If China Abandonds USD To Prepare For Sanctions, FDI Will Reverse
If China Abandonds USD To Prepare For Sanctions, FDI Will Reverse
If China Abandonds USD To Prepare For Sanctions, FDI Will Reverse
Ultimately China will try to wean itself off the dollar – but it will keep doing so gradually to avoid a catastrophic social and economic change at home and abroad. This is continuation of post-2008 status quo. An accelerated shift away from USD will be interpreted by global actors as preparation for war (just like Russia’s shift). This will drive investors to swap Chinese assets for American or other assets. History suggests that USD devaluations followed US wars and budget expansions. Investors should wait until the next US military adventure, in Iran or elsewhere, before expecting massive dollar depreciation. If the US pursues an offshore balancing strategy, as it appears to be doing today, then other countries will become less stable and the dollar will remain appealing as a safe haven. Bottom Line: Russia’s and China’s diversification away from the dollar over the past decade has not caused global flight from the dollar. International trust in the economy and government of Russia and China is not very high. The euro, the viable alternative to the dollar, is less attractive in the face of the Ukraine war and broader geopolitical instability. The path toward monetary revolution is for China to open up its capital account, make its currency convertible, and sell USD assets while appreciating the yuan. Yet China’s leaders have not embarked on this course for fear of domestic instability. In lieu of that, the current monetary regime continues. Robert P. Ryan Chief Commodity & Energy Strategist rryan@bcaresearch.com Matt Gertken Chief Geopolitical Strategist mattg@bcaresearch.com Footnotes 1 Please see Brussels proposes EU import ban on all Russian oil published by ft.com on May 4, 2022 for summary of the EU's export-ban proposals. 2 Please see our report from March 31, 2022 entitled Germany Closer To Rationing Natgas for further discussion. It is available at ces.bcaresearch.com. 3 See Obstfeld, Maurice (2020), Global Dimensions of U.S. Monetary Policy, International Journal of Central Banking, 16:1, pp. 73-132. 4 Obstfeld (2020, p. 113). 5 Obstfeld (2020, p. 77-78). 6 Please see Pozsar, Zoltan (2022), "Money, Commodities, and Bretton Woods III," published by Credit Suisse Economics. 7 For the “collateral” interpretation of US dollar-denominated foreign exchange reserves, see Michael P. Dooley, David Folkerts-Landau, and Peter M. Garber, “US Sanctions Reinforce The Dollar’s Dominance,” NBER Working Paper Series 29943, April 2022, nber.org.
Chart 1
PMIs Surprise To The Downside
PMIs Surprise To The Downside
Both the US and Global PMIs surprised to the downside this week with the US ISM Manufacturing PMI printing 55.4 vs 57.6 expected. The ISM PMI fell by 1.7 points from 57.1 while its employment sub-component fell by impressive 5 points (from 56 to 50.9). Worse still, the new orders-to-inventories ratio (NOI) remains in the free fall, foreshadowing further weakness in manufacturing activity (see chart). The disappointing NOI ratio is unlikely to be a one-off anomalous print considering a backdrop of the slowing demand for durable goods, falling consumer purchasing power, and surging oil prices. The NOI ratio contraction is also reminiscent of the 2004 episode – one of the few instances when the Fed tightened monetary policy into a slowing economy. Notably, 2004 marked the peak in cyclical/defensive equities for the entire pre-GFC cycle. When it comes to portfolio positioning, weak manufacturing data validates our recent rotation away from cyclical sectors and towards defensives (please see our most recent Strategy Report for a more detailed discussion). Bottom Line: We continue to recommend investors remain cautious and add defensive exposure to reduce portfolio volatility as the global manufacturing cycle slows down.
In lieu of next week’s report, I will be presenting a webcast titled ‘The 5 Big Mispricings In The Markets Right Now, And How To Profit From Them’. I do hope you can join. Executive Summary Just as the railway timetables set in train the First World War, central bank timetables for aggressive rate hikes are setting in train a global recession. Demand is already cool, so aggressive rate hikes will take it to outright cold. The risk is elevated because central banks are desperate to repair their damaged credibility on fighting inflation, and it may be their last chance. Inflationary fears and hawkishness from central banks are weighing on bonds and stocks, and it may take some weeks, or months, for inflation fears to recede. But we could be approaching a turning point. By the summer, core inflation should be receding. Furthermore, the fractal structures of the sell-offs in both the 30-year T-bond and the tech-heavy NASDAQ index are approaching points of extreme fragility that have signalled inflection points. Fractal trading watchlist: 30-year T-bond, NASDAQ, FTSE 100 versus Euro Stoxx 50, Netherlands versus Switzerland, and Petcare (PAWZ). US Inflation Is Hot, But Demand Is Not
US Inflation Is Hot, But Demand Is Not
US Inflation Is Hot, But Demand Is Not
Bottom Line: Tactically cautious, but long-term investors who do not need to time the market bottom should overweight bonds and overweight long-duration defensive equities versus short-duration cyclical equities – for example, overweight US versus non-US equities. Feature The First World War, the historian AJP Taylor famously argued, was “imposed on the statesmen of Europe by railway timetables.” Taylor proposed that the railways and their timetables were so central to troop mobilisation – and specifically, the German Schlieffen Plan – that a plan once set in motion could not be stopped. “Once started the wagons and carriages must roll remorselessly and inevitably to their predestined goal.” Otherwise, the whole process would unravel, and an opportunity to demonstrate military credibility would be lost that might never come again. Today, could a global recession be imposed upon us by central bank timetables for aggressive rate hikes? Just as it was difficult to unwind the troop mobilisation that led to the Great War, it will be difficult to back down from the aggressive rate hikes that the central banks have timetabled, at least in the near term. Otherwise, an opportunity to demonstrate inflation fighting credibility would be lost that might never come again. Just as the railway timetables set in train the First World War, central bank timetables for aggressive rate hikes may set in train another global recession. Unfortunately, central banks do not have precision weapons. Quite the contrary, monetary tightening is a blunt instrument which works by cooling overall demand. But demand is already cool, as evidenced by the contraction of the US economy in the first quarter. In their zeal to repair their damaged credibility on fighting inflation, the danger is that central banks take the economy from cool to outright cold. Granted, the US economy was dragged down by a drop in inventories and net exports. But even US domestic demand – which strips out inventories and net exports – is barely on its pre-pandemic trend (Chart I-1). Meanwhile, the euro area economy is still 5 percent below its pre-pandemic trend (Chart I-2). To reiterate, by hiking rates aggressively into economies that are at best lukewarm, central banks are risking an outright recession. Chart I-1US Inflation Is Hot, But Demand Is Not
US Inflation Is Hot, But Demand Is Not
US Inflation Is Hot, But Demand Is Not
Chart I-2Euro Area Inflation Is Hot, But Demand Is Not
Euro Area Inflation Is Hot, But Demand Is Not
Euro Area Inflation Is Hot, But Demand Is Not
Our Three-Point Checklist For A Recession Has Three Ticks My colleague Peter Berezin has created a three-point checklist for a recession: The build-up of an imbalance makes the economy vulnerable to downturn. A catalyst exposes this imbalance. Amplifiers exacerbate the downturn. Is there a major imbalance? You bet there is. The post-pandemic 26 percent overspend on durable goods in the US constitutes one of the greatest imbalances in economic history. Other advanced economies also experienced unprecedented binges on durable goods. The catalyst that is exposing this major imbalance is the realisation that durable goods are, well, durable. So, if you overspent on durables in 2020/21, then the risk is that you symmetrically underspend in 2022/23 (Chart I-3). The post-pandemic 26 percent overspend on durable goods in the US constitutes one of the greatest imbalances in economic history. Meanwhile, a future underspend on goods cannot be countered by an overspend on services because the consumption of services is constrained by time, opportunity, and biology. There is a limit to how often you can eat out, go to the movies, or go to the doctor (Chart I-4). Indeed, for certain services, an underspend will persist, because we have made some permanent post-pandemic changes to our lifestyles: for example, hybrid office/home working and more online shopping and online medical care. Chart I-3An Overspend On Goods Can Be Corrected By A Subsequent Underspend...
An Overspend On Goods Can Be Corrected By A Subsequent Underspend...
An Overspend On Goods Can Be Corrected By A Subsequent Underspend...
Chart I-4...But An Underspend On Services Cannot Be Corrected By A Subsequent Overspend
...But An Underspend On Services Cannot Be Corrected By A Subsequent Overspend
...But An Underspend On Services Cannot Be Corrected By A Subsequent Overspend
Finally, the amplifier that will exacerbate the downturn is monetary tightening. If central banks follow their railway timetables for aggressive rate hikes, a goods downturn will magnify into an outright recession. So, in Peter’s three-point checklist, we now have tick, tick, and tick. Inflation Is Hot, But Demand Is Not If economic demand is at best lukewarm, then what caused the post-pandemic inflation that central banks are now fighting? The simple answer is massive fiscal stimulus combined with the equally massive shift in spending to durable goods. Locked at home and flush with government supplied cash, we couldn’t spend it on services, so we spent it on goods. This created a massive shock in the distribution of demand, out of services whose supply could easily adjust downwards, and into goods whose supply could not easily adjust upwards. For example, airlines could cut back their flights, but auto manufacturers couldn’t make more cars. So, airfares didn’t collapse but used car prices went vertical! The causality from stimulus payments to durable goods spending to core inflation is irrefutable. The causality from stimulus payments to durable goods spending to core inflation is irrefutable. The biggest surges in US durable goods spending all coincided with the government’s stimulus checks (Chart I-5). And the three separate surges in month-on-month core inflation all occurred after surges in durable goods demand (Chart I-6). As further proof, core inflation is highest in those economies where the stimulus checks and furlough schemes were the most generous – like the US and the UK. Chart I-5Stimulus Checks Caused The Surges in Durable Goods Spending
Stimulus Checks Caused The Surges in Durable Goods Spending
Stimulus Checks Caused The Surges in Durable Goods Spending
Chart I-6The Surges In Durable Goods Spending Caused The Surges In Core Inflation
The Surges In Durable Goods Spending Caused The Surges In Core Inflation
The Surges In Durable Goods Spending Caused The Surges In Core Inflation
What Does All This Mean For Investment Strategy? Our high conviction view is that the pandemic’s inflationary impulse combined with the Ukraine war will turn out to be demand-destructive, and thereby ultimately morph into a deflationary impulse. Yet central banks are all pumped up to demonstrate their inflation fighting credibility. Given that this credibility is badly damaged, it may be their last opportunity to repair it before it is shattered forever. To repeat, just as the railway timetables set in train the First World War, central bank timetables for aggressive rate hikes may set in train another global recession. That said, a recession is not inevitable. The interest rate that matters most for the economy and the markets is not the policy rate that central banks want to hike aggressively, it is the long-duration bond yield. A lower bond yield can underpin both the economy and the financial markets, just as it did during the pandemic in 2020. But to the extent that the bond market is following the real economic data, we are in a dangerous phase. Because, as is typical at an inflection point, the real data will be noisy and ambiguous. Meaning it may take some weeks, or months, for inflation fears to be trumped by growth fears. On March 10th, in Are We In A Slow-Motion Crash? we predicted: “On a tactical (3-month) horizon, the inflationary impulse from soaring energy and food prices combined with the choke on growth from sanctions will weigh on both the global economy and the global stock market. As such, bond yields could nudge higher, the global stock market has yet to reach its crisis bottom, and the US dollar will rally” That prediction proved to be spot on! Recession, or no recession, we are still in a difficult period for markets because inflationary fears and hawkishness from central banks are weighing on bonds and stocks, while buoying the US dollar. As such, tactical caution is still warranted. Fractal structures of the sell-offs in both the 30-year T-bond and the tech-heavy NASDAQ index are approaching points of extreme fragility. But we could be approaching a turning point. By the summer, core inflation should be receding. Furthermore, the fractal structures of the sell-offs in both the 30-year T-bond and the tech-heavy NASDAQ index are approaching points of extreme fragility that have reliably signalled previous inflection points (Chart I-7 and Chart I-8). Chart I-7The Sell-Off In The 30-Year T-Bond Is Approaching Fractal Fragility
The Sell-Off In The 30-Year T-Bond Is Approaching Fractal Fragility
The Sell-Off In The 30-Year T-Bond Is Approaching Fractal Fragility
Chart I-8The Sell-Off In The NASDAQ Is Approaching Fractal Fragility
The Sell-Off In The NASDAQ Is Approaching Fractal Fragility
The Sell-Off In The NASDAQ Is Approaching Fractal Fragility
The advice for long-term investors who do not need to time the market bottom is: Bonds will ultimately rally. Overweight the 30-year T-bond and the 30-year Chinese bond. Equities will be conflicted between slowing growth which will weigh on cyclical profits, and falling bond yields which will buoy long-duration valuations. Therefore, overweight long-duration defensive sectors and markets versus short-duration cyclical sectors and markets. For example, overweight US versus non-US equities. Fractal Trading Watchlist As just discussed, the sell-offs in the 30-year T-bond and the NASDAQ are approaching points of fractal fragility that have signalled previous turning points. Hence, we are adding both investments to our watchlist. Also added to our watchlist is the outperformance of the FTSE100 versus Euro Stoxx 50, and the underperformance of Netherlands versus Switzerland, both of which are approaching potential reversals. Our final addition is Petcare (PAWZ). After a stellar 2020, Petcare gave back most of its gains in 2021. But this underperformance is now approaching a point of fragility which might provide a new entry point. There are no new trades this week, but the full watchlist of investments at, or approaching, turning points is available on our website: cpt.bcaresearch.com Fractal Trading Watchlist: New Additions A Potential New Entry Point Into Petcare
A Potential New Entry Point Into Petcare
A Potential New Entry Point Into Petcare
FTSE100 Outperformance Vs. Euro Stoxx 50 Vulnerable To Reversal
FTSE100 Outperformance Vs. Euro Stoxx 50 Vulnerable To Reversal
FTSE100 Outperformance Vs. Euro Stoxx 50 Vulnerable To Reversal
Netherlands Underperformance Vs. Switzerland Close To Exhaustion
Netherlands Underperformance Vs. Switzerland Close To Exhaustion
Netherlands Underperformance Vs. Switzerland Close To Exhaustion
Chart 1The Strong Trend In The 18-Month-Out US Interest Rate Future Is Fragile
The Strong Trend In The 18-Month-Out US Interest Rate Future Is Fragile
The Strong Trend In The 18-Month-Out US Interest Rate Future Is Fragile
Chart 2The Strong Trend In The 3 Year T-Bond Is Fragile
The Strong Trend In The 3 Year T-Bond Is Fragile
The Strong Trend In The 3 Year T-Bond Is Fragile
Chart 3AUD/KRW Is Vulnerable To Reversal
AUD/KRW Is Vulnerable To Reversal
AUD/KRW Is Vulnerable To Reversal
Chart 4Canada Versus Japan Is Reversing
Canada Versus Japan Is Reversing
Canada Versus Japan Is Reversing
Chart 5Canada's TSX-60's Outperformance Might Be Over
Canada's TSX-60's Outperformance Might Be Over
Canada's TSX-60's Outperformance Might Be Over
Chart 6US Healthcare Providers Vs. Software At Risk of Reversal
US Healthcare Providers Vs. Software At Risk of Reversal
US Healthcare Providers Vs. Software At Risk of Reversal
Chart 7A Potential Switching Point From Tobacco Into Cannabis
A Potential Switching Point From Tobacco Into Cannabis
A Potential Switching Point From Tobacco Into Cannabis
Chart 8Biotech Is A Major Buy
Biotech Is A Major Buy
Biotech Is A Major Buy
Chart 9CAD/SEK Reversal Has Started
CAD/SEK Reversal Has Started
CAD/SEK Reversal Has Started
Chart 10Financials Versus Industrials To Reverse
Financials Versus Industrials To Reverse
Financials Versus Industrials To Reverse
Chart 11Norway's Outperformance Could End
Norway's Outperformance Could End
Norway's Outperformance Could End
Chart 12Greece's Brief Outperformance To End
Greece's Brief Outperformance To End
Greece's Brief Outperformance To End
Chart 13BRL/NZD At A Resistance Point
BRL/NZD At A Resistance Point
BRL/NZD At A Resistance Point
Chart 14The Outperformance Of Resources Versus Healthcare Is Vulnerable To Reversal
The Outperformance Of Resources Versus Healthcare Is Vulnerable To Reversal
The Outperformance Of Resources Versus Healthcare Is Vulnerable To Reversal
Chart 15The Outperformance Of Resources Versus Biotech Has Started To Reverse
The Outperformance Of Resources Versus Biotech Has Started To Reverse
The Outperformance Of Resources Versus Biotech Has Started To Reverse
Chart 16Cotton's Outperformance Is Vulnerable To Reversal
Cotton's Outperformance Is Vulnerable To Reversal
Cotton's Outperformance Is Vulnerable To Reversal
Chart 17US Homebuilders' Underperformance Has Reached A Potential Turning Point
US Homebuilders' Underperformance Has Reached A Potential Turning Point
US Homebuilders' Underperformance Has Reached A Potential Turning Point
Chart 18Switzerland's Outperformance Vs. Germany Has Started To End
Switzerland's Outperformance Vs. Germany Has Started To End
Switzerland's Outperformance Vs. Germany Has Started To End
Chart 19The Rally In USD/EUR Could End
The Rally In USD/EUR Could End
The Rally In USD/EUR Could End
Chart 20The Outperformance Of MSCI Hong Kong Versus China Is Vulnerable To Reversal
The Outperformance Of MSCI Hong Kong Versus China Is Vulnerable To Reversal
The Outperformance Of MSCI Hong Kong Versus China Is Vulnerable To Reversal
Chart 21A Potential New Entry Point Into Petcare
A Potential New Entry Point Into Petcare
A Potential New Entry Point Into Petcare
Chart 22FTSE100 Outperformance Vs. Euro Stoxx 50 Vulnerable To Reversal
FTSE100 Outperformance Vs. Euro Stoxx 50 Vulnerable To Reversal
FTSE100 Outperformance Vs. Euro Stoxx 50 Vulnerable To Reversal
Chart 23Netherlands Underperformance Vs. Switzerland Close To Exhaustion
Netherlands Underperformance Vs. Switzerland Close To Exhaustion
Netherlands Underperformance Vs. Switzerland Close To Exhaustion
Dhaval Joshi Chief Strategist dhaval@bcaresearch.com Fractal Trading System Fractal Trades
Central Bank ‘Railway Timetables’ Are Dragging Us Into Recession
Central Bank ‘Railway Timetables’ Are Dragging Us Into Recession
Central Bank ‘Railway Timetables’ Are Dragging Us Into Recession
Central Bank ‘Railway Timetables’ Are Dragging Us Into Recession
6-Month Recommendations Structural Recommendations Closed Fractal Trades Indicators To Watch - Bond Yields Chart II-1Indicators To Watch - Bond Yields - Euro Area
Indicators To Watch - Bond Yields - Euro Area
Indicators To Watch - Bond Yields - Euro Area
Chart II-2Indicators To Watch - Bond Yields - Europe Ex Euro Area
Indicators To Watch - Bond Yields - Europe Ex Euro Area
Indicators To Watch - Bond Yields - Europe Ex Euro Area
Chart II-3Indicators To Watch - Bond Yields - Asia
Indicators To Watch - Bond Yields - Asia
Indicators To Watch - Bond Yields - Asia
Chart II-4Indicators To Watch - Bond Yields - Other Developed
Indicators To Watch - Bond Yields - Other Developed
Indicators To Watch - Bond Yields - Other Developed
Indicators To Watch - Interest Rate Expectations Chart II-5Indicators To Watch - Interest Rate Expectations
Indicators To Watch - Interest Rate Expectations
Indicators To Watch - Interest Rate Expectations
Chart II-6Indicators To Watch - Interest Rate Expectations
Indicators To Watch - Interest Rate Expectations
Indicators To Watch - Interest Rate Expectations
Chart II-7Indicators To Watch - Interest Rate Expectations
Indicators To Watch - Interest Rate Expectations
Indicators To Watch - Interest Rate Expectations
Chart II-8Indicators To Watch - Interest Rate Expectations
Indicators To Watch - Interest Rate Expectations
Indicators To Watch - Interest Rate Expectations
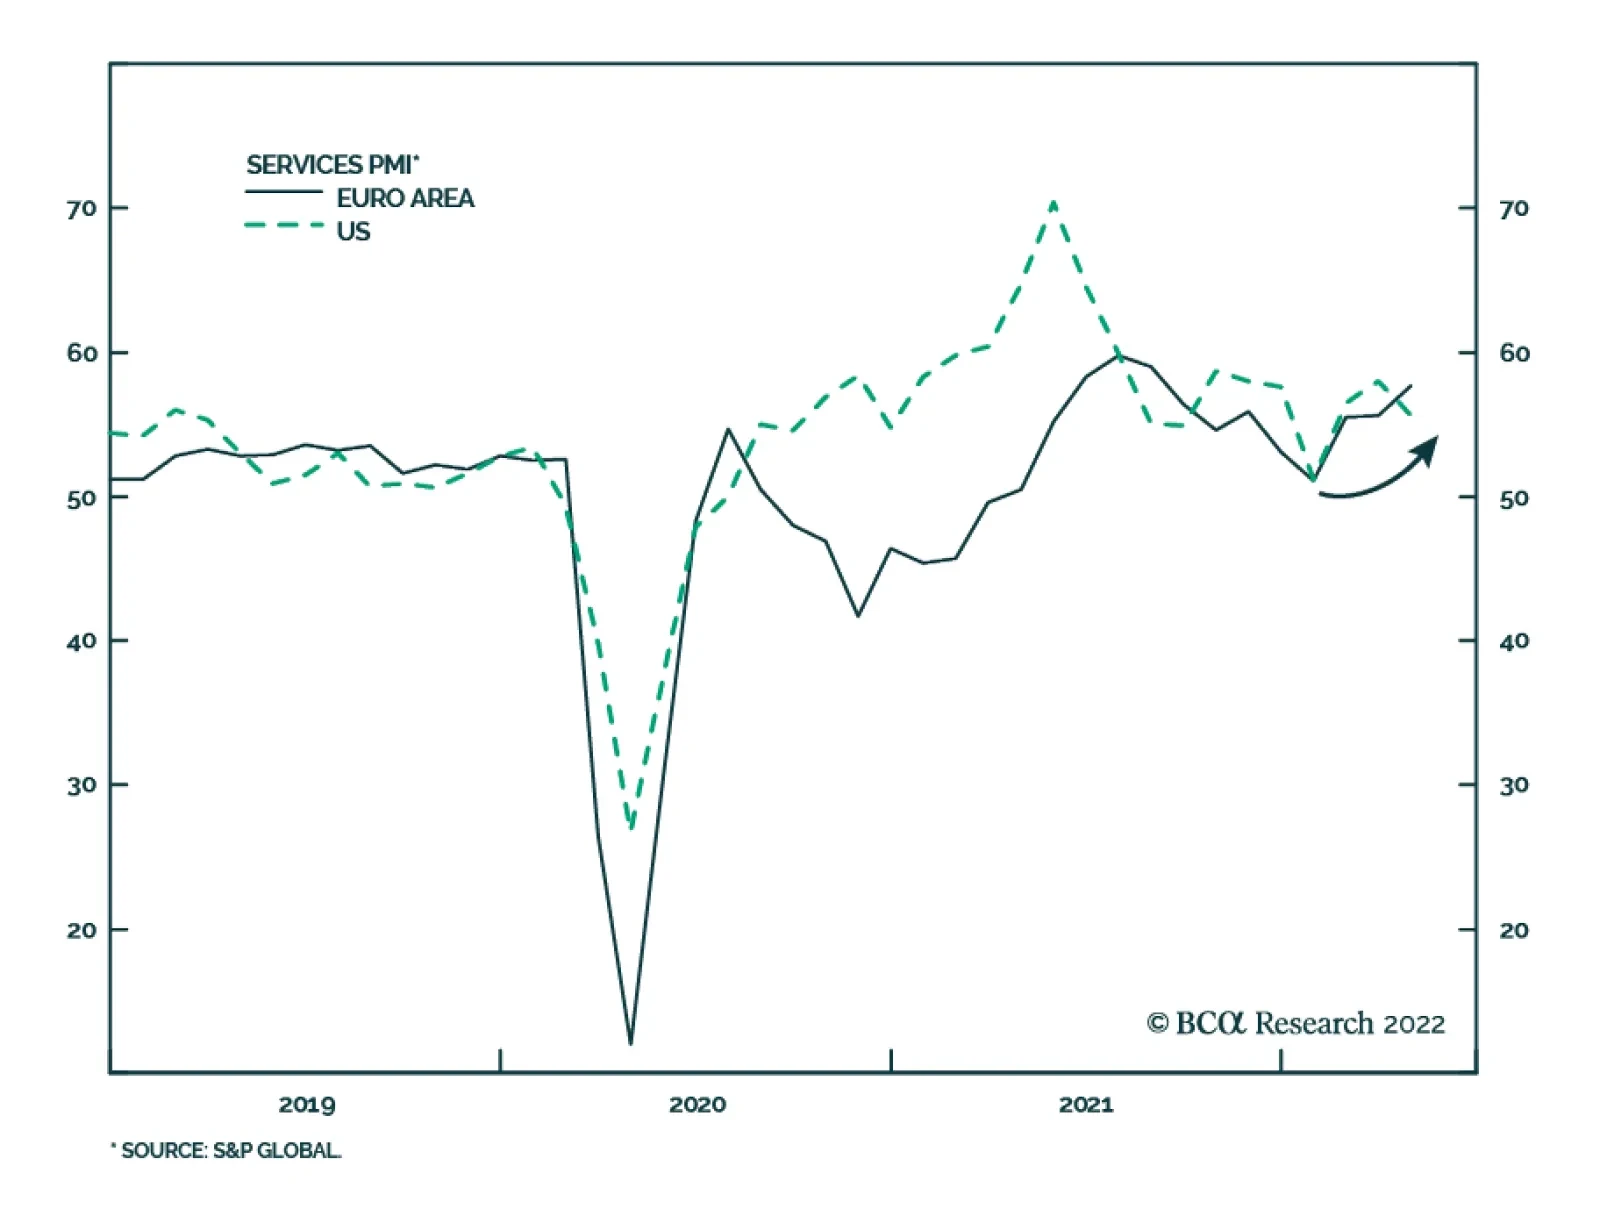
April services PMIs generally testify to the ongoing consumption pivot from goods to services. The S&P Global Eurozone Services PMI rose to 57.7 in April from 55.6 in the prior month, marking the strongest growth in Eurozone services activity since…
As expected, the Fed hiked interest rates by 50 basis points on Wednesday, lifting the target federal funds rate to a range of 0.75% to 1%. In addition, the central bank released details of its balance sheet reduction plan, which will begin in June. For…
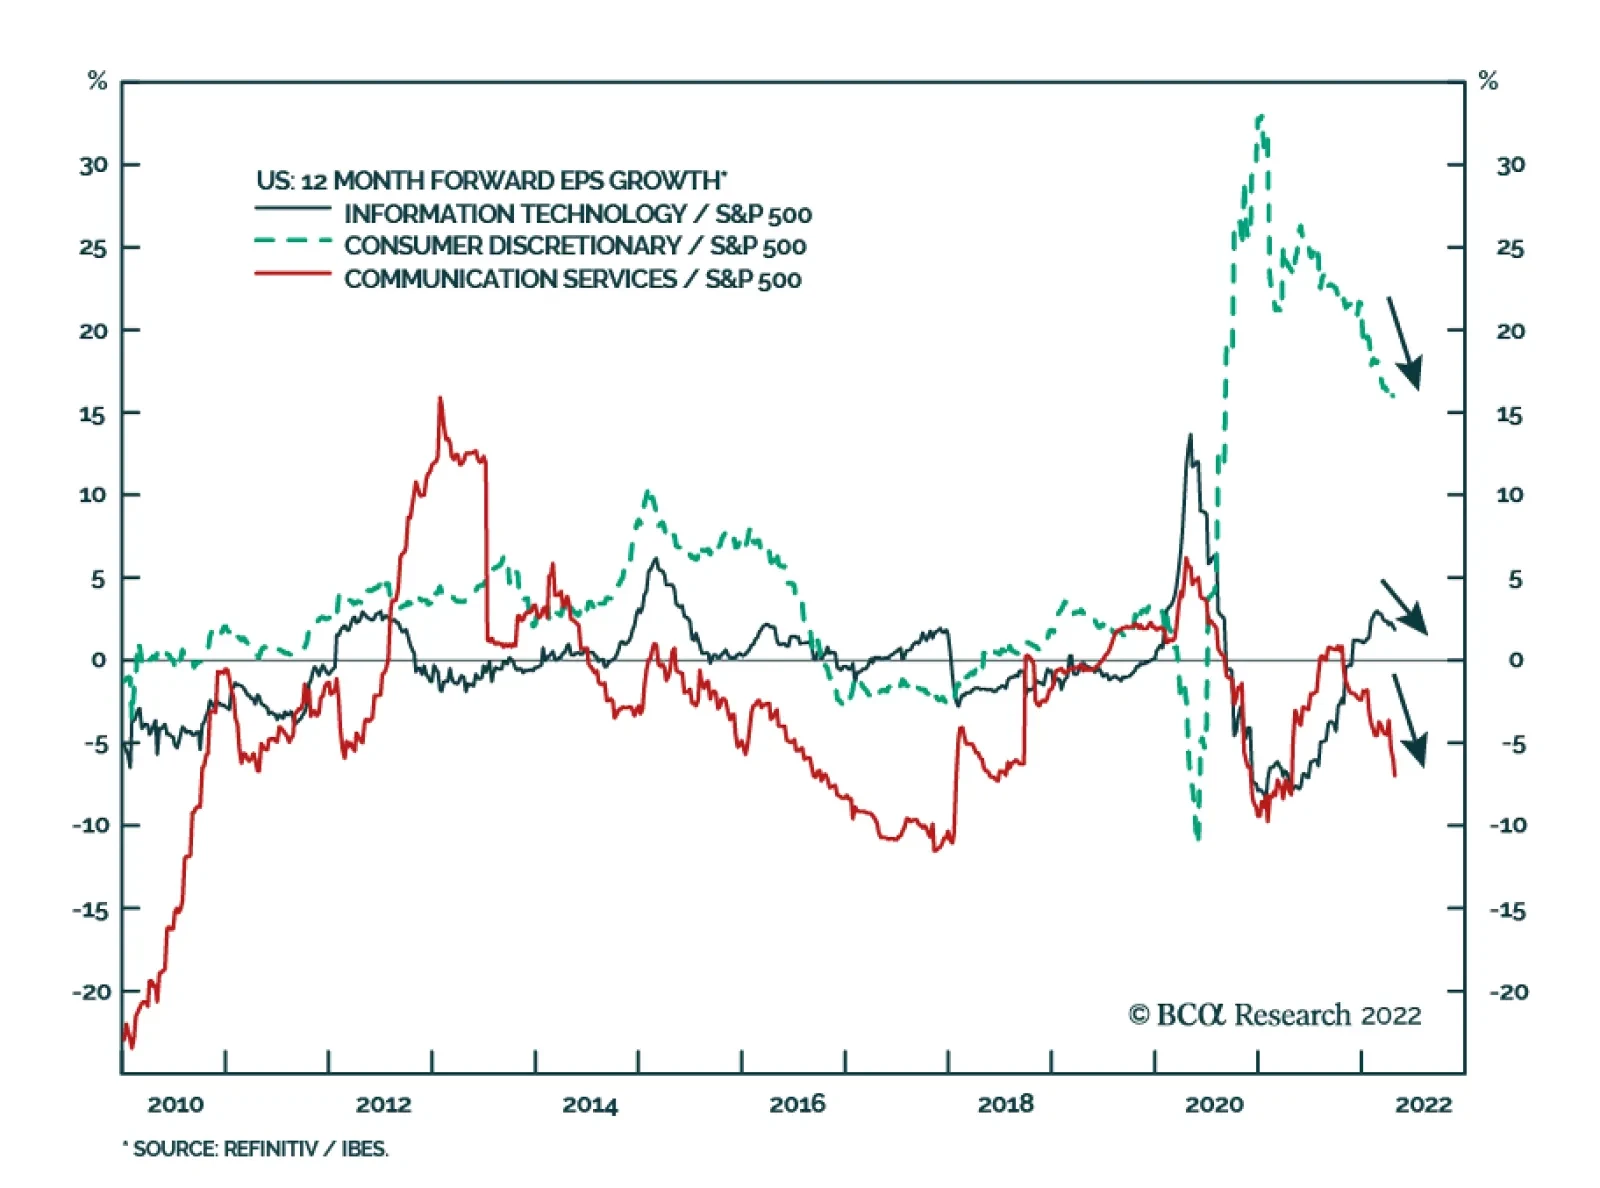
Broadly-defined US technology stocks have been consistently underperforming the S&P 500 since the beginning of the year. Communication Services, Consumer Discretionary, and IT have shed 24%, 20%, and 18% of their value, respectively. Two main headwinds…
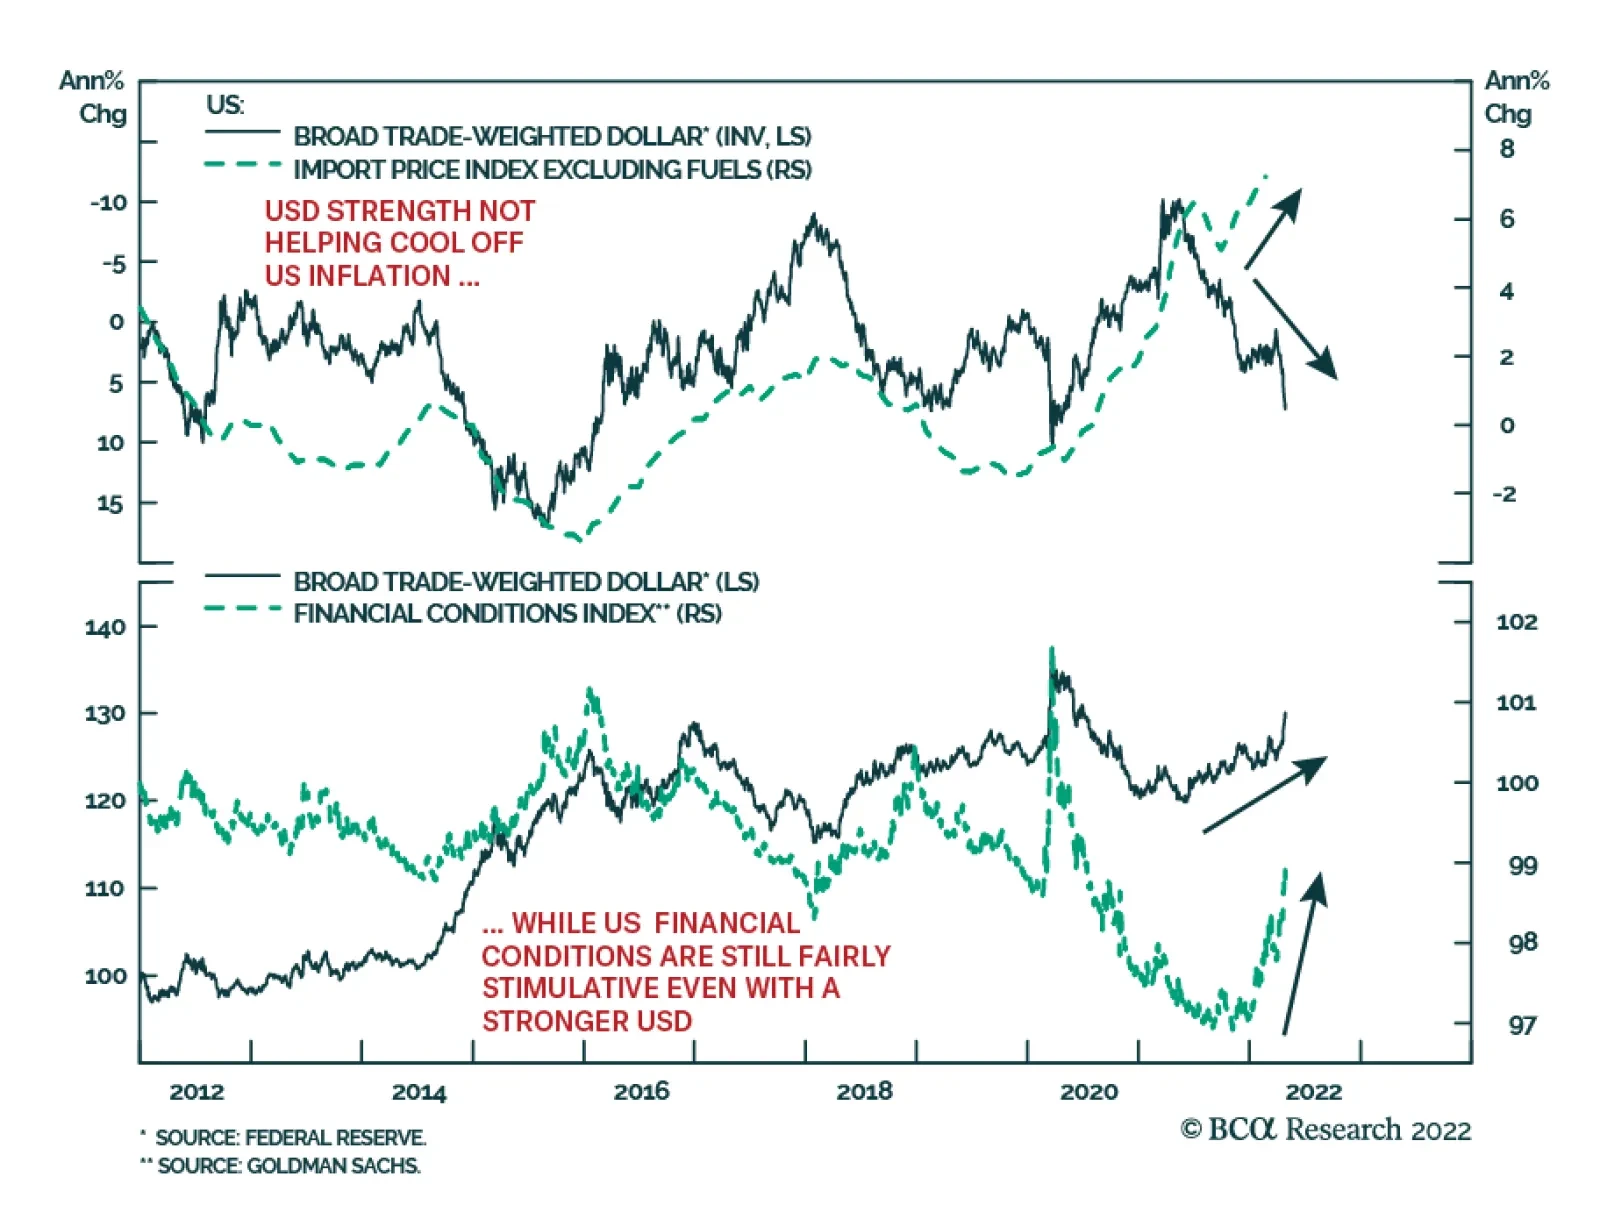
BCA Research’s Global Fixed Income Strategy service concludes that an appreciating US dollar is not yet a reason to expect a peak in US inflation or Treasury yields. Right now, there is not much evidence suggesting that the stronger dollar should…
Executive Summary Stocks Not Linked To Presidential Approval
Stocks Not Linked To Presidential Approval
Stocks Not Linked To Presidential Approval
President Kennedy’s performance in 1962 would be ideal for the Biden administration in this year’s midterm elections – but today the Russian conflict is less likely to help the Democrats. A threat to the homeland could lift President Biden’s job approval. But most likely inflation and foreign crises will weigh on his approval. A contrarian stock rally would not help Biden’s approval but Biden’s attempts to boost his rating could deliver negative surprises for stocks. US “peak polarization” and Democratic Party policies are negative for the stock market and investor risk appetite over the next zero-to-six months. Our quantitative election models suggest Republicans will win the Senate, though uncertainty will rise as a result of the controversy over the Supreme Court and abortion. Democratic odds of keeping the White House in 2024 are 54.6% but eroding. CLOSE Recommendation (Cyclical) CLOSING Level CLOSING Date RETURN Long Municipal Bonds Vs. Duration Matched Treasuries 93.53 2-MAY-22 -1.50% Bottom Line: Overall Biden policies plus global events are neutral or bullish for US Treasuries while neutral or bearish for US stocks over a tactical time horizon (zero-to-six months). Feature President Biden is doubling down on his support for Ukraine and thus adopting the John F. Kennedy foreign policy playbook of confronting Russia ahead of the US’s midterm elections. Related Report US Political StrategyWar Not Helping Biden So Far Biden’s position today is weaker than Kennedy’s in 1962, so his reaction to Russian aggression will create more market hurdles than it removes. Bad news will come before good news, compounding bearish investor sentiment in the near term. Policy uncertainty should decline after the midterm election on November 8, which is positive for equities in 2023. Democrats Scramble Amid Recession Fear The US economy contracted unexpectedly in the first quarter at an annualized 1.4% rate. The underlying data contained some silver lining – personal consumption grew at 2.7%. But the contraction is bad news for the economy and the ruling Democratic Party. Public approval of Biden’s handling of the economy has fallen to -16.2%. The global economy continues to sputter. Risks to growth are high in Europe and China as well (Chart 1). The US policy response will take shape on the monetary and fiscal level but also on the foreign policy level. First, global risks will not dissuade the Federal Reserve from normalizing interest rates. Chairman Jerome Powell signaled on April 21 that he is willing to hike interest rates 50 basis points at a time to combat core PCE inflation at 5.2%. The market currently expects core inflation to peak at 5.2% while the Fed funds rate will hit 3.3% in 2023 before falling in 2024. The implication is that monetary policy will tighten quickly, even as the economy stutters, which is negative for the US equity market and investor sentiment. However, Fed hawkishness is largely priced. US long-duration treasuries are at or near fair value at 3%, according to our US Bond Strategy. Our US Investment Strategy believes that with the S&P500 already down by 13% so far this year, stocks can begin to grind upward, barring other negative surprises. Chart 1US Slows Amid Global Growth Risks
US Slows Amid Global Growth Risks
US Slows Amid Global Growth Risks
Second, the White House will scramble to try to limit the damage to the Democratic Party in the midterms – with the unintentional result that negative surprises could arise from fiscal policy and especially foreign policy. On the fiscal front, congressional Democrats will redesign their budget reconciliation bill to try to gain a legislative victory. They will need to make it as close to deficit-neutral as possible to avoid fanning inflation. The odds of passage are higher than consensus expectations (26% on PredictIt). But the stock market does not want more government spending or higher taxes in a stagflationary environment. Fiscal policy is still a significant source of uncertainty in 2022, if not in 2023. On the foreign policy front, the greatest trouble looms. Russian aggression has prompted the US and its NATO allies to double down on their support for Ukraine, providing additional arms and aid. Biden’s Secretary of Defense Lloyd Austin said that the US wants to see Ukraine “a democratic country able to protect its sovereign territory … [and] Russia weakened to the point where it can't do things like invade Ukraine.”1 Finland and Sweden are increasingly likely to join NATO, which will antagonize Russia. Russia’s response is not yet known but it has issued aggressive warnings. By cutting off natural gas to Poland and Bulgaria, Moscow is warning that it may cut off natural gas to all Europe. Meanwhile Germany is embracing an oil embargo. A larger energy shock is increasingly likely. Chart 2More Bad News Before Good News
More Bad News Before Good News
More Bad News Before Good News
Bottom Line: Monetary policy hawkishness is largely priced whereas additional fiscal uncertainty and America’s reactive foreign policy are not fully priced. This news is neutral or bullish for US Treasuries while neutral or bearish for US stocks over a tactical time horizon (zero-to-six months) (Chart 2). Biden Can Hurt Stocks, Stocks Cannot Help Biden Before addressing how Biden will try to boost his job approval, we should ask whether approval ratings have any direct impact on financial markets. The answer is largely no – or fleeting at best. During the Trump administration it was easy to get the impression that the president’s approval rating had a substantive impact on the stock market, or at least benefited stocks relative to bonds. After the first year, a correlation developed between presidential approval and the stock-to-bond ratio (Chart 3A, top panel). The passage of tax cuts juiced corporate profits but also suggested that President Trump could get things done, boosting his approval rating. Oddly, however, the relationship continued even after Republicans lost Congress in 2018. Spurious or not, the correlation persisted until Covid-19 erupted. At that point Trump’s approval tanked while the stock market roared on the back of gargantuan monetary and fiscal stimulus. President Biden’s administration started off the same way, with presidential approval falling (the usual honeymoon ended) while stocks rallied relative to bonds (Chart 3A, bottom panel). But Biden’s passage of the American Rescue Plan Act and the bipartisan Infrastructure Investment and Jobs Act in 2021 did not boost his approval rating. Going forward, Biden’s approval rating will probably stabilize at a low level in an inflationary or stagflationary context. Stocks may continue to underperform bonds over a tactical time frame but will not underperform bonds over the cyclical time frame as long as the US avoids a recession. Thus there is not likely to be close correlation between Biden’s approval and the stock-to-bond ratio. From the sector and style perspective, there is also no clear relationship with presidential approval. There may be some basis for seeing Trump’s tax cuts as positive for cyclicals relative to defensives. His term coincided with the second half of a business cycle when growth expanded. But ultimately cyclicals vacillated and went sideways. Moreover growth stocks outperformed value stocks, in accordance with President Obama’s term in office. Yet there was no correlation between Trump’s approval and growth stocks relative to value (Chart 3B, top two panels). In Biden’s case, presidential job approval has no clear correlation with cyclicals relative to defensives. There may be some relationship with value relative to growth stocks but it is far from convincing. Most likely the underlying macroeconomic dynamics that favored value stocks (i.e. recovery, inflation) coincided with Biden’s honeymoon period and then outlasted it. However, if Biden passes a reconciliation bill with tax hikes, the implication should be positive both for value versus growth stocks and for his approval rating (Chart 3B, bottom two panels). Chart 3AStocks Not Linked To Presidential Approval
Stocks Not Linked To Presidential Approval
Stocks Not Linked To Presidential Approval
Chart 3BStocks Not Linked To Presidential Approval
Stocks Not Linked To Presidential Approval
Stocks Not Linked To Presidential Approval
From the above data we can draw a few conclusions. On one hand, the stock-to-bond ratio and cyclicals-versus-defensives could rally again on the back of a resilient global economy and yet Biden’s approval rating could fail to recover. The distribution of wealth means that inflation and rising mortgage rates hit low-to-middle income groups who comprise the bulk of voters. Cyclical assets will rise if the global economy improves relative to the US economy, whereas presidential approval may not. Inflation could subside incrementally with limited benefit to the president. On the other hand, if stocks and cyclical sectors continue to underperform, it will probably be due to even worse economic outcomes that will simultaneously prevent Biden’s approval from recovering. If the economy slows further and inflation remains persistent, disapproval will rise. The problem for investors is that the latter is the likeliest scenario based on the energy supply risks in Europe and China’s difficulties stabilizing growth. The US economy cannot entirely avoid the knock-on effects of slower global growth over the next six months. Bottom Line: There is no stable relationship between presidential approval and the stock market, whether regarding bonds, sectors, or styles. There are occasional correlations that reflect coincidences of macro, market, and political cycles or major policy changes. In today’s context a rebound in cyclical assets may not help the president while a further downturn would hurt him. But the president’s attempts to boost his approval rating could hurt stocks. Inflation And Foreign Wars Tend To Hurt Presidents What can Biden do to boost his approval rating and his party’s odds in the midterm election? Not much. Foreign policy is his best option, though he is limited to a defensive or reactive foreign policy and even then the underlying economy will drive voters the most. Looking at presidential approval over time, upswings occur during periods of economic prosperity and peaks occur amid foreign belligerence that threatens the homeland. Presidential approval has slumped since the subprime mortgage crisis and today it is even lower than under President Obama (Chart 4A). Chart 4APresidential Approval Follows Peace And Prosperity, Not War And Poverty
Biden's Cold War And Culture War
Biden's Cold War And Culture War
Similarly presidential disapproval rises during recessionary and inflationary periods as well as wars and scandals (Chart 4B). The Obama/Trump era saw a rise in disapproval that could resume due to inflation. Foreign wars that do not present a threat to the homeland can increase disapproval. Chart 4BPresidential Approval Follows Peace And Prosperity, Not War And Poverty
Biden's Cold War And Culture War
Biden's Cold War And Culture War
The takeaway is that a homeland threat from abroad could temporarily lift the president’s approval but it will not last for long unless the underlying economic malaise is cured. The problem for Biden is that the most immediate foreign policy challenges emanate from oil producers whose reactions exacerbate the inflation problem (Russia, Iran). Biden may or may not keep relations steady with China, where disputes could drive up import prices. Bottom Line: A reactive foreign policy could provoke a threat to the homeland that boosts the president’s job approval. But more likely the weakening economy, high inflation, and foreign crises that add to inflation will hurt the president. Biden And The Kennedy Playbook President Kennedy’s experience in 1962 presents the best case for Democrats but the underlying economic and political context are different and damaging for Biden. Comparing today’s situation to comparable midterm election years, the negative outlook for Biden and the Democrats becomes clear. Comparable midterm elections feature high international tensions, high inflation, or low presidential approval on a net basis. Today the “Misery Index” (unemployment plus inflation) is comparable to the minimum levels in midterm years in the 1970s – and higher than the maximum levels in other midterm years (Table 1). The House and Senate losses during periods of high misery and low presidential approval are substantial. Table 1Misery And Midterms
Biden's Cold War And Culture War
Biden's Cold War And Culture War
The 1962 midterm election is a notable exception. The Cuban Missile Crisis and Kennedy’s handling of it minimized the Democratic Party’s losses that year, with only four seats lost in the House, plus a gain of three seats in the Senate. Compare this to the typical midterm election, with an average of 27 lost seats in the House (31 for Democrats) and four seats lost in the Senate (five for Democrats) (Table 2). Table 2Kennedy’s Cuban Missile Crisis Midterm, 1962
Biden's Cold War And Culture War
Biden's Cold War And Culture War
Kennedy’s net approval averaged 55% that year, whereas Biden’s today stands at -11%. A threat to the homeland could boost Biden’s approval but today’s likeliest conflicts would worsen inflation if they occurred. The Misery Index stands at 11% this year compared to 6% in 1962. Most importantly, in the Cuban Missile Crisis, the Russians recognized that America would always care about Cuba’s status more than Russia because it posed a proximate strategic threat. Americans had more at stake and could take greater risks to prevent Cuba from hosting nuclear arms. Today, while the US is not trying to supply Ukraine or Finland with nuclear weapons, NATO membership would expand the US nuclear umbrella. Americans do not seem prepared to recognize that Russia will always care more about Ukraine’s and Finland’s status than Americans will. Russians have more at stake and can take greater risks. Thus while Biden’s foreign policy could easily provoke a crisis with Russia, Biden may not get the better end of the crisis like Kennedy did. Meanwhile financial markets will suffer from the spike in tensions. Bottom Line: Biden’s doubling down on support for Ukraine and NATO enlargement suggest that he does not have an interest in reducing tensions with Russia ahead of the midterm election. Yet Biden is unlikely to get the better of any reactive foreign policy that escalates tensions – at least not in time for the midterms. This dynamic is negative for US and global stocks and risk assets. Election Quant Model Updates The Philadelphia Federal Reserve released a second update to its state-level coincident indicators in April, enabling us to update our quant models for the Senate election in 2022 and presidential election in 2024. The model still predicts that Democrats will lose two Senate seats, producing a Republican majority of 52-48 (Chart 5). Arizona and Georgia are the two states in which Democrats won Senate seats in 2022 but are expected to flip to the Republican side. Arizona and Pennsylvania remain toss-up states (odds of Democratic victory range from 45%-55%) but are inching downward toward likely Republican victories. Chart 5GOP Tipped To Take The Senate (Quant Election Model, April 2022)
Biden's Cold War And Culture War
Biden's Cold War And Culture War
Democrats shed probability in all states once again. Odds fell the most in Arizona (-1.08 percentage point since the last update in early April) followed by North Carolina (-1.03ppt) and Pennsylvania (-0.98ppt). In seven states the Democratic odds of victory fell by more than 0.5ppts, including Arizona and Nevada (Chart 6). Overall the probability for Democrats retaining control of the Senate now stands at 48.2% (down 0.2ppt). These odds are higher than consensus even though they agree with the consensus on expecting Republican victory. Online betting markets like PredictIt are pricing in Republican control at around 79%, up 3ppt from our last update. This is overstated and the new controversy over the Supreme Court and abortion will fire up Democratic voters, making the Senate race closer to what our model suggests. Chart 6Democrats Falter Across Senate Races: AZ, PA, NC
Biden's Cold War And Culture War
Biden's Cold War And Culture War
Looking ahead to 2024, our presidential election model still predicts 308 Electoral College votes for the Democratic Party, a number that has not changed since the 2020 election (Chart 7). Democrats have a 54.6% chance overall of retaining the White House. Chart 7Biden Still Tipped For 2024 (Quant Election Model, April 2022)
Biden's Cold War And Culture War
Biden's Cold War And Culture War
The trend is negative for the incumbent party. North Carolina slipped out of the toss-up category and into Republican category – i.e. Democrats now have only a 44% chance of winning it. Democrats’ odds of winning Florida moved lower – it is now in toss-up territory at 54%, which comes closer to our subjective judgment that Republicans are favored there. The toss-up states have remained well anchored in the range of 40%-60% since 2020 and will play a pivotal role in future predictions. Generally the trend is for falling odds that Democrats will win these states (PA, FL, NC, AZ, and GA). Both Pennsylvania and Florida account for a combined 49 electoral votes and Florida is probably more Republican-leaning than the model says. If the three critical Rust Belt states (Pennsylvania, Wisconsin, Michigan) slip into toss-up territory then the model will be flagging serious trouble for Democrats. But a lot can happen between now and 2024. In the latest update Democrats are shedding probability of winning in all states, although to a lesser degree than the past two updates. Economic data, while still negative for the incumbent party, may be deteriorating less rapidly. Biden’s approval rating improved marginally since our last update and we expect it to stabilize, albeit at a low level. Michigan recorded the largest decline in Democratic odds of victory (-1.07ppt) followed by Minnesota (-0.79ppt) and New Hampshire (-0.78ppt). Democrats shed more than 0.5ppts from their odds of victory in twelve states, nine of which they won in 2022 (Chart 8). Chart 8Democrats Shedding Odds Of Winning States In 2024
Biden's Cold War And Culture War
Biden's Cold War And Culture War
Bottom Line: Republicans are favored to take the Senate (as well as the House) in 2022. Democrats are slightly favored to retain the White House in 2024, though the model is optimistic by granting Florida to the Democrats and the election odds look to be razor-thin yet again. Investment Takeaways As we go to press, the unusual leak of a draft opinion of Supreme Court Justice Samuel Alito has roiled US politics. The draft argues that the landmark court case of Roe Versus Wade should be overturned. This incident reflects our “Peak Polarization” theme – that polarization will remain very disruptive in the short term yet subside over the long term. It also suggests an activist effort to escalate the culture wars ahead of the midterm election, which we have argued would be the case and implies that more unrest will follow from this event. Whether the Supreme Court overturns the landmark Roe versus Wade ruling of 1973, the battle for women voters will help sustain election-year policy uncertainty, as women’s approval for Democrats will start to recover (Chart 9). Investor sentiment will remain bearish in the very near term. A series of hurdles need to be cleared before we close our tactical long DXY trade and defensive sector tilt. We are closing our long municipal bond relative to Treasury trade for a loss of 1.5% (Chart 10). Chart 9Women Are Key Constituencies In The Midterm
Biden's Cold War And Culture War
Biden's Cold War And Culture War
Chart 10Municipal Trade Fizzled Out Despite Strong Local Government Finance
Municipal Trade Fizzled Out Despite Strong Local Government Finance
Municipal Trade Fizzled Out Despite Strong Local Government Finance
The overall analysis of US politics is neutral or bullish for US Treasuries while neutral or bearish for US stocks over a tactical time horizon (zero-to-six months). If recession is avoided at the critical juncture this year, then 2023 will see a rising stock market as the economy expands and political risks fall. Matt Gertken Senior Vice President Chief US Political Strategist mattg@bcaresearch.com Footnotes 1 Peter Weber, “Defense Secretary Lloyd Austin says U.S. believes Ukraine can win, wants to 'see Russia weakened,'” The Week, April 25, 2022, theweek.com. Strategic View Open Tactical Positions (0-6 Months) Open Cyclical Recommendations (6-18 Months) Table A2Political Risk Matrix
Biden's Cold War And Culture War
Biden's Cold War And Culture War
Table A3US Political Capital Index
Biden's Cold War And Culture War
Biden's Cold War And Culture War
Chart A1Presidential Election Model
Biden's Cold War And Culture War
Biden's Cold War And Culture War
Chart A2Senate Election Model
Biden's Cold War And Culture War
Biden's Cold War And Culture War
Table A4APolitical Capital: White House And Congress
Biden's Cold War And Culture War
Biden's Cold War And Culture War
Table A4BPolitical Capital: Household And Business Sentiment
Biden's Cold War And Culture War
Biden's Cold War And Culture War
Table A4CPolitical Capital: The Economy And Markets
Biden's Cold War And Culture War
Biden's Cold War And Culture War