Developed Countries
Japanese headline inflation increased from 1.2% y/y to 2.5% y/y in April. Similarly, core CPI inflation jumped from 0.8% y/y to 2.1% y/y. The April acceleration in consumer prices mostly reflects the fading effect of cheaper phone fees last year, which…
According to BCA Research’s Global Investment Strategy service, although the unemployment rate has never risen by more than one-third of a percentage point in the US without a recession occurring, there are three reasons to think that a soft landing can be…

Inflation continues to put pressure on the US consumers. Negative real wage growth (Chart 1) and soaring prices of food and energy are pushing many low and middle-class Americans to shift spending away from discretionary items toward necessities (Chart 2). We have written about this here. Chart 1CHART 1
CHART 1
CHART 1
Chart 2
On The US Consumer, Powell, And Retailers Carnage
On The US Consumer, Powell, And Retailers Carnage
Table 1
On The US Consumer, Powell, And Retailers Carnage
On The US Consumer, Powell, And Retailers Carnage
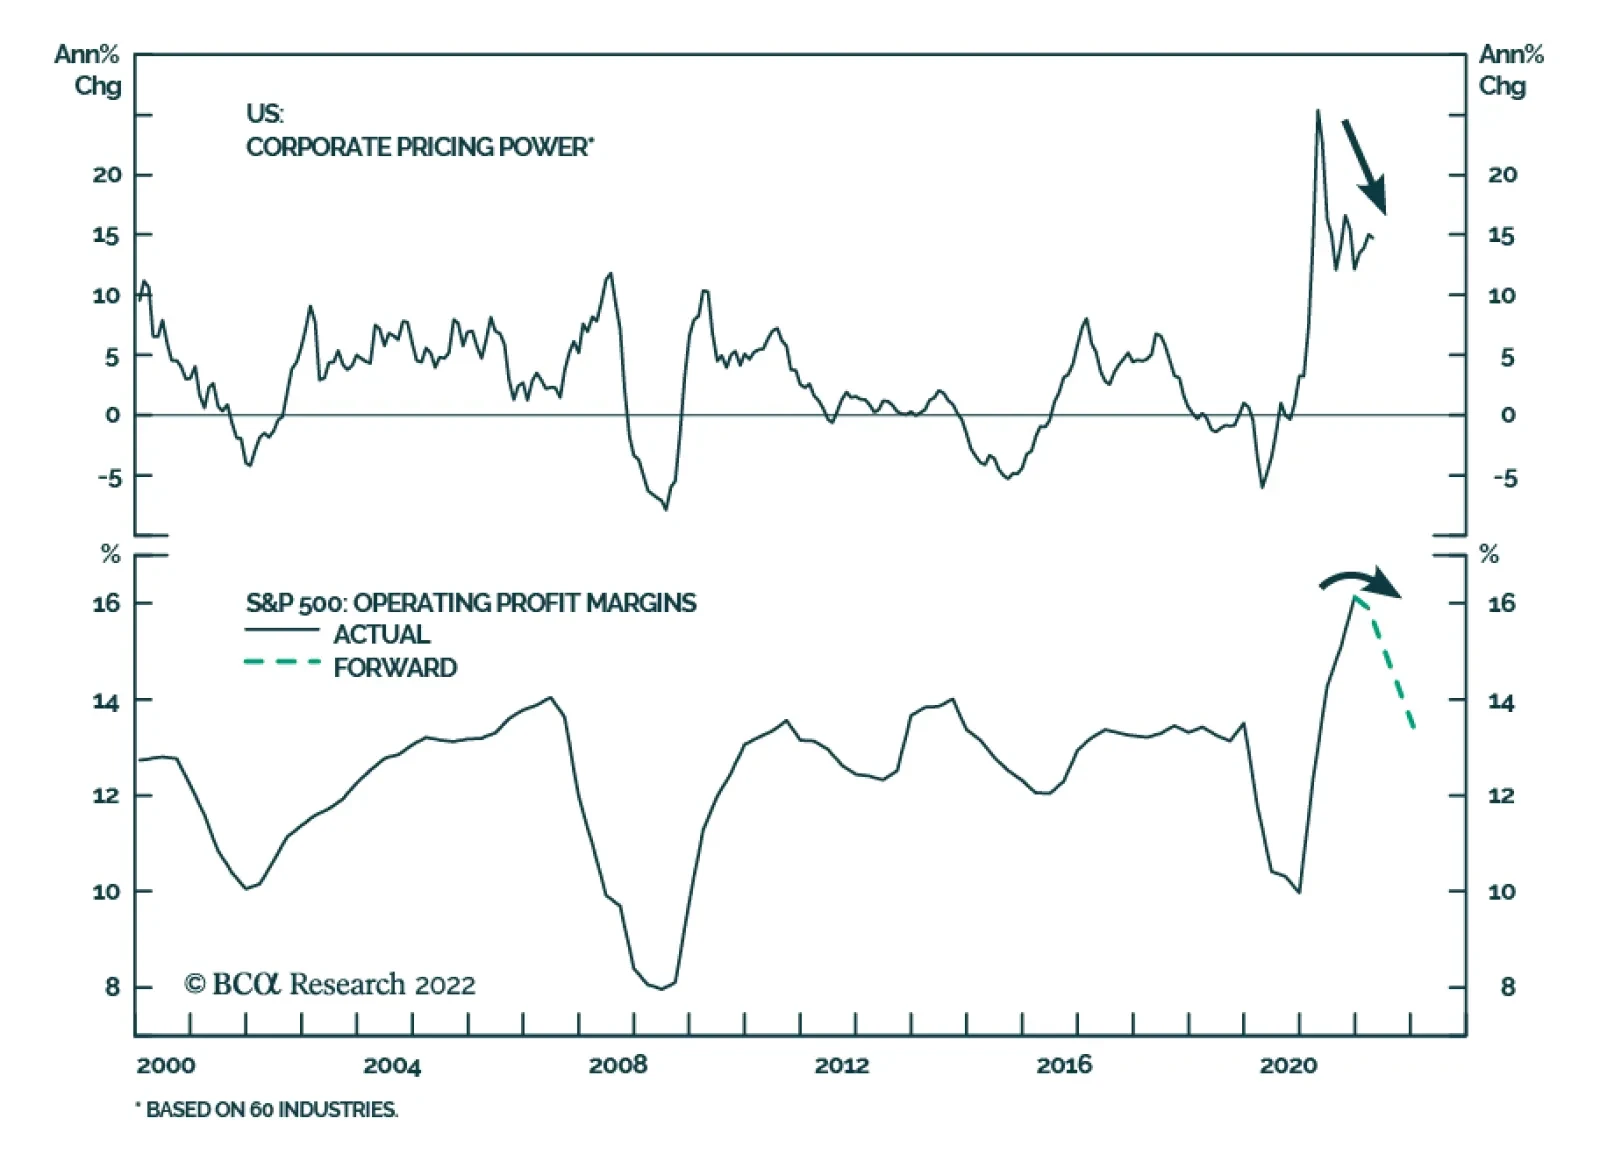
The recent earnings commentary from Walmart and Target are attesting the trend. Both noted that consumers are switching from the high-margin items (non-necessities) to the lower-margin necessity items like food. Both companies have also commented on the ongoing supply chain challenges and rising costs of both goods (COGS) and wages. Target reported a 430bps contraction in gross margins. Peak margins for the sector are surely in the rear-view mirror. Both Walmart and Target provided negative guidance. As a result, a retail “carnage” has ensued, WMT is down 20%, COST 15%, and TGT 30% over the past three days. The sell-off was exacerbated by the Powell’s comments that combating inflation is likely to incur economic pain, hinting at a possibility of a recession on the back of the Fed’s actions. These comments have reiterated the Fed’s hawkish stance, and have removed any hope of the Fed’s put, i.e., the Fed coming to the rescue of the spluttering equity market. What’s next? We believe that the markets can continue to fall. A few conditions of our Equity Capitulation scorecard have not been yet met (Table 1). Rate stabilization – The Fed’s hawkish stance and a plan to front-load a rate hiking cycle suggest that monetary conditions will continue to tighten (-1) Economic growth expectations do not yet reflect the deteriorating economic backdrop. US GDP forecasts will be further downgraded (-1) Earnings growth expectations need to come down to reflect supply disruptions, raging input prices, and the stronger dollar (-1) Oil prices have somewhat stabilized (+1) Valuations have retraced, signaling that the market is reasonably priced. However, earnings downgrades will push forward multiples higher (0) Technicals signal that the market is oversold (+2) “Black swans” – headwinds from the war in Ukraine and lockdowns in China (-2) Bottom Line: On balance, risks for US equities slightly outweigh the upside opportunity. A market bottom is still a few weeks, or even months, away.
Listen to a short summary of this report. Executive Summary The US Inflation Surprise Index Has Rolled Over
Goldilocks: A Skeptical Q&A
Goldilocks: A Skeptical Q&A
Global equities are nearing a bottom and will rally over the coming months as inflation declines and growth reaccelerates. While equity valuations are not at bombed-out levels, they have cheapened significantly. Global stocks trade at 15.3-times forward earnings. We are upgrading tech stocks from underweight to neutral. The NASDAQ Composite now trades at a forward P/E of 22.6, down from 32.9 at its peak last year. The 10-year Treasury yield should decline to 2.5% by the end of the year, which will help tech stocks at the margin. The US dollar has peaked. A weakening dollar will provide a tailwind to stocks, especially overseas bourses. US high-yield spreads are pricing in a default rate of 6.2% over the next 12 months, well above the trailing default rate of 1.2%. Favor high-yield credit over government bonds within a fixed-income portfolio. Bottom Line: The recent sell-off in stocks provides a good opportunity to increase equity allocations. We expect global stocks to rise 15%-to-20% over the next 12 months. Back to Bullish We wrote a report on April 22nd arguing that global equities were heading towards a “last hurrah” in the second half of the year as a Goldilocks environment of falling inflation and supply-side led growth emerges. Last week, we operationalized this view by tactically upgrading stocks to overweight after having downgraded them in late February. This highly out-of-consensus view change, coming at a time when surveys by the American Association of Individual Investors and other outfits show extreme levels of bearishness, has garnered a lot of attention. In this week’s report, we answer some of the most common questions from the perspective of a skeptical reader. Q: Inflation is at multi-decade highs, global growth is faltering, and central banks are about to hike rates faster than we have seen in years. Isn’t it too early to turn bullish? A: We need to focus on how the world will look like in six months, not how it looks like now. Inflation has likely peaked and many of the forces that have slowed growth, such as China’s Covid lockdown and the war in Ukraine, could abate. Q: What is the evidence that inflation has peaked? And may I remind you, even if inflation does decline later this year, this is something that most investors and central banks are already banking on. Inflation would need to fall by more than expected for your bullish scenario to play out. A: That’s true, but there is good reason to think that this is precisely what will happen. Overall spending in the US is close to its pre-pandemic trend. However, spending on goods remains above trend while spending on services is below trend (Chart 1). Services prices tend to be stickier than goods prices. Thus, the shift in spending patterns caused goods inflation to rise markedly with little offsetting decline in services inflation. To cite one of many examples, fitness equipment prices rose dramatically, but gym membership fees barely fell (Chart 2). Chart 1Total US Consumer Spending Is Almost Exactly At Its Pre-Pandemic Trend, But The Composition Of Spending Remains Skewed
Total US Consumer Spending Is Almost Exactly At Its Pre-Pandemic Trend, But The Composition Of Spending Remains Skewed
Total US Consumer Spending Is Almost Exactly At Its Pre-Pandemic Trend, But The Composition Of Spending Remains Skewed
Chart 2Asymmetries Matter: Firms Manufacturing Sports Equipment Jacked Up Prices, But Gyms Barely Cut Prices
Asymmetries Matter: Firms Manufacturing Sports Equipment Jacked Up Prices, But Gyms Barely Cut Prices
Asymmetries Matter: Firms Manufacturing Sports Equipment Jacked Up Prices, But Gyms Barely Cut Prices
As goods demand normalizes, goods inflation will come down. Meanwhile, the supply of goods should increase as the pandemic winds down, and hopefully, a detente is reached in Ukraine. There are already indications that some supply-chain bottlenecks have eased (Chart 3). Q: Even if supply shocks abate, which seems like a BIG IF to me, wouldn’t the shift in spending towards services supercharge what has been only a modest acceleration in services inflation so far? A: Wages are the most important driver of services inflation. Although the evidence is still tentative, it does appear as though wage inflation is peaking. The 3-month annualized growth rate in average hourly earnings for production and nonsupervisory workers slowed from 7.2% in the second half of 2021 to 3.8% in April (Chart 4). Assuming productivity growth of 1.5%, this is consistent with unit labor cost inflation of only slightly more than 2%, which is broadly consistent with the Fed’s CPI inflation target.1
Image
Chart 4Wage Pressures May Be Starting To Ease
Wage Pressures May Be Starting To Ease
Wage Pressures May Be Starting To Ease
Image
Moreover, a smaller proportion of firms expect to raise wages over the next six months than was the case late last year according to a variety of regional Fed surveys (Chart 5). The same message is echoed by the NFIB small business survey (Chart 6). Consistent with all this, the US Citi Inflation Surprise Index has rolled over (Chart 7). Chart 6... Small Business Owners Included
... Small Business Owners Included
... Small Business Owners Included
Chart 7The US Inflation Surprise Index Has Rolled Over
The US Inflation Surprise Index Has Rolled Over
The US Inflation Surprise Index Has Rolled Over
Q: What about the “too cold” risk to your Goldilocks scenario? The risks of recession seem to be rising. A: The market is certainly worried about this outcome, and that has been the main reason stocks have fallen of late. However, we do not think this fear is justified, certainly not in the US (Chart 8). US households are sitting on $2.3 trillion excess savings, equal to about 14% of annual consumption. The ratio of household debt-to-disposable income is down 36 percentage points from its highs in early 2008, giving households the wherewithal to spend more. Core capital goods orders, a good leading indicator for capex, have surged. The homeowner vacancy rate is at a record low, suggesting that homebuilding will be fairly resilient in the face of higher mortgage rates. Q: It seems like the Fed has a nearly impossible task on its hands: Increase labor market slack by enough to cool the economy but not so much as to trigger a recession. You yourself have pointed out that the Fed has never achieved this in its history. A: It is correct that the unemployment rate has never risen by more than one-third of a percentage point in the US without a recession occurring (Chart 9). That said, there are three reasons to think that a soft landing can be achieved this time.
Image
Chart 9When Unemployment Starts Rising, It Usually Keeps Rising
When Unemployment Starts Rising, It Usually Keeps Rising
When Unemployment Starts Rising, It Usually Keeps Rising
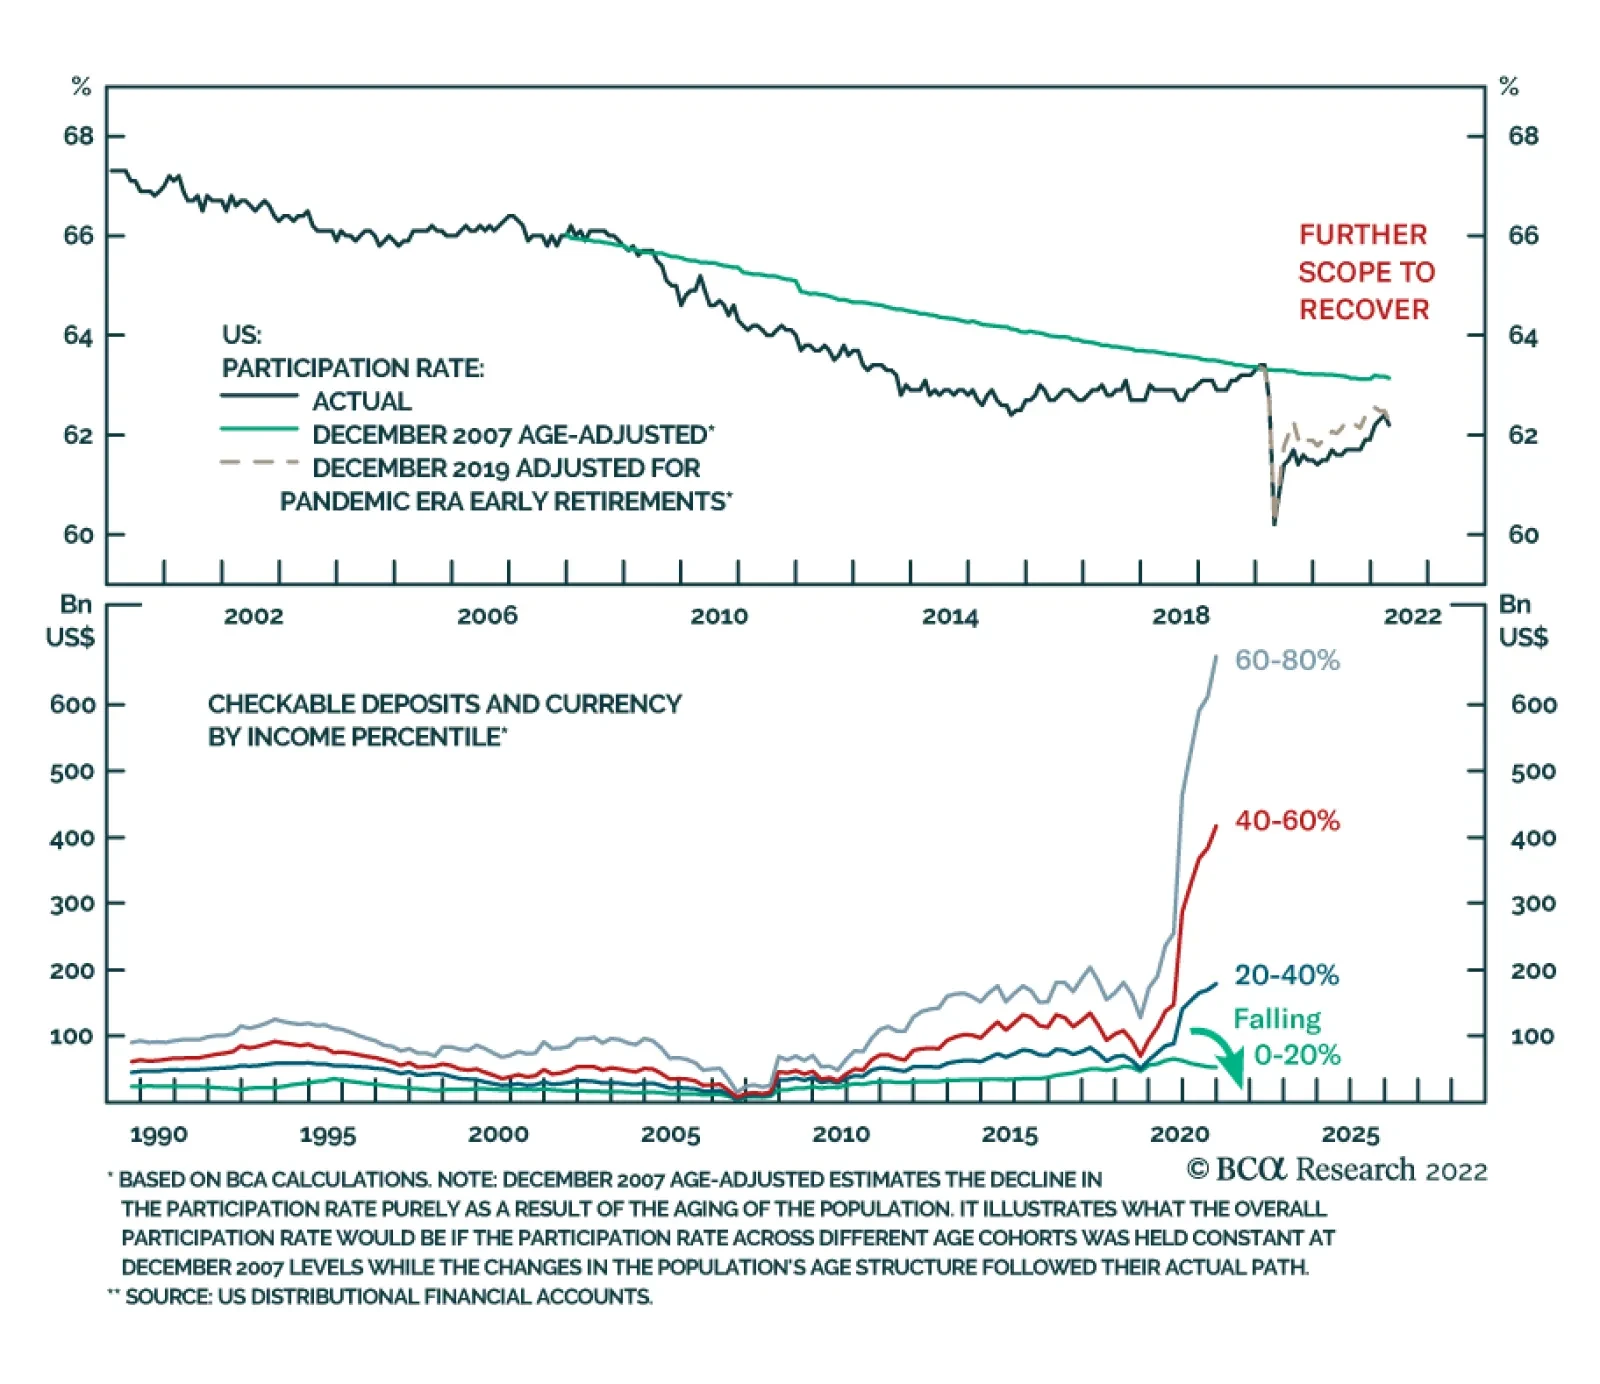
First, increasing labor market slack is easier if one can raise labor supply rather than reducing labor demand. Right now, the participation rate is nearly a percentage point below where it was in 2019, even if one adjusts for increased early retirement during the pandemic (Chart 10). Wages have risen relatively more at the bottom end of the income distribution. This should draw more low-wage workers into the labor force. Furthermore, according to the Federal Reserve, accumulated bank savings for the lowest-paid 20% of workers have been shrinking since last summer, which should incentivize job seeking (Chart 11). Chart 10Labor Participation Has Further Scope To Recover
Labor Participation Has Further Scope To Recover
Labor Participation Has Further Scope To Recover
Chart 11Depleted Savings Will Force More Lower-Wage Workers Into The Labor Market
Depleted Savings Will Force More Lower-Wage Workers Into The Labor Market
Depleted Savings Will Force More Lower-Wage Workers Into The Labor Market
Second, long-term inflation expectations remain well contained, which makes a soft landing more likely. Median expected inflation 5-to-10 years out in the University of Michigan survey stood at 3% in May, roughly where it was between 2005 and 2013 (Chart 12). Median expected earnings growth in the New York Fed Survey of Consumer Expectations was only slightly higher in April than it was prior to the pandemic (Chart 13). Chart 12Consumer Long-Term Inflation Expectations Have Risen But Remain Relatively Low
Consumer Long-Term Inflation Expectations Have Risen But Remain Relatively Low
Consumer Long-Term Inflation Expectations Have Risen But Remain Relatively Low
Chart 13US Consumers Do Not Expect Wages To Grow At A Much Higher Rate Than In The Pre-Pandemic Period
US Consumers Do Not Expect Wages To Grow At A Much Higher Rate Than In The Pre-Pandemic Period
US Consumers Do Not Expect Wages To Grow At A Much Higher Rate Than In The Pre-Pandemic Period
A third reason for thinking that a soft landing may be easier to achieve this time around is that the US private-sector financial balance – the difference between what the private sector earns and spends – is still in surplus (Chart 14). This stands in contrast to the lead-up to both the 2001 and 2008-09 recessions, when the private sector was living beyond its means. Q: You have spoken a lot about the US, but the situation seems dire elsewhere. Europe may already be in recession as we speak! A: The near-term outlook for Europe is indeed challenging. The euro area economy grew by only 0.8% annualized in the first quarter. Mathieu Savary, BCA’s Chief European Strategist, expects an outright decline in output in Q2. To no one’s surprise, the war in Ukraine is weighing on European growth. The Bundesbank estimates that a full embargo of Russian oil and gas would reduce German real GDP by an additional 5% on top of the damage already inflicted by the war (Chart 15). Chart 14The US Private-Sector Financial Balance Remains In Surplus
The US Private-Sector Financial Balance Remains In Surplus
The US Private-Sector Financial Balance Remains In Surplus
Chart 15Germany’s Economy Will Sink Without Russian Energy
Goldilocks: A Skeptical Q&A
Goldilocks: A Skeptical Q&A
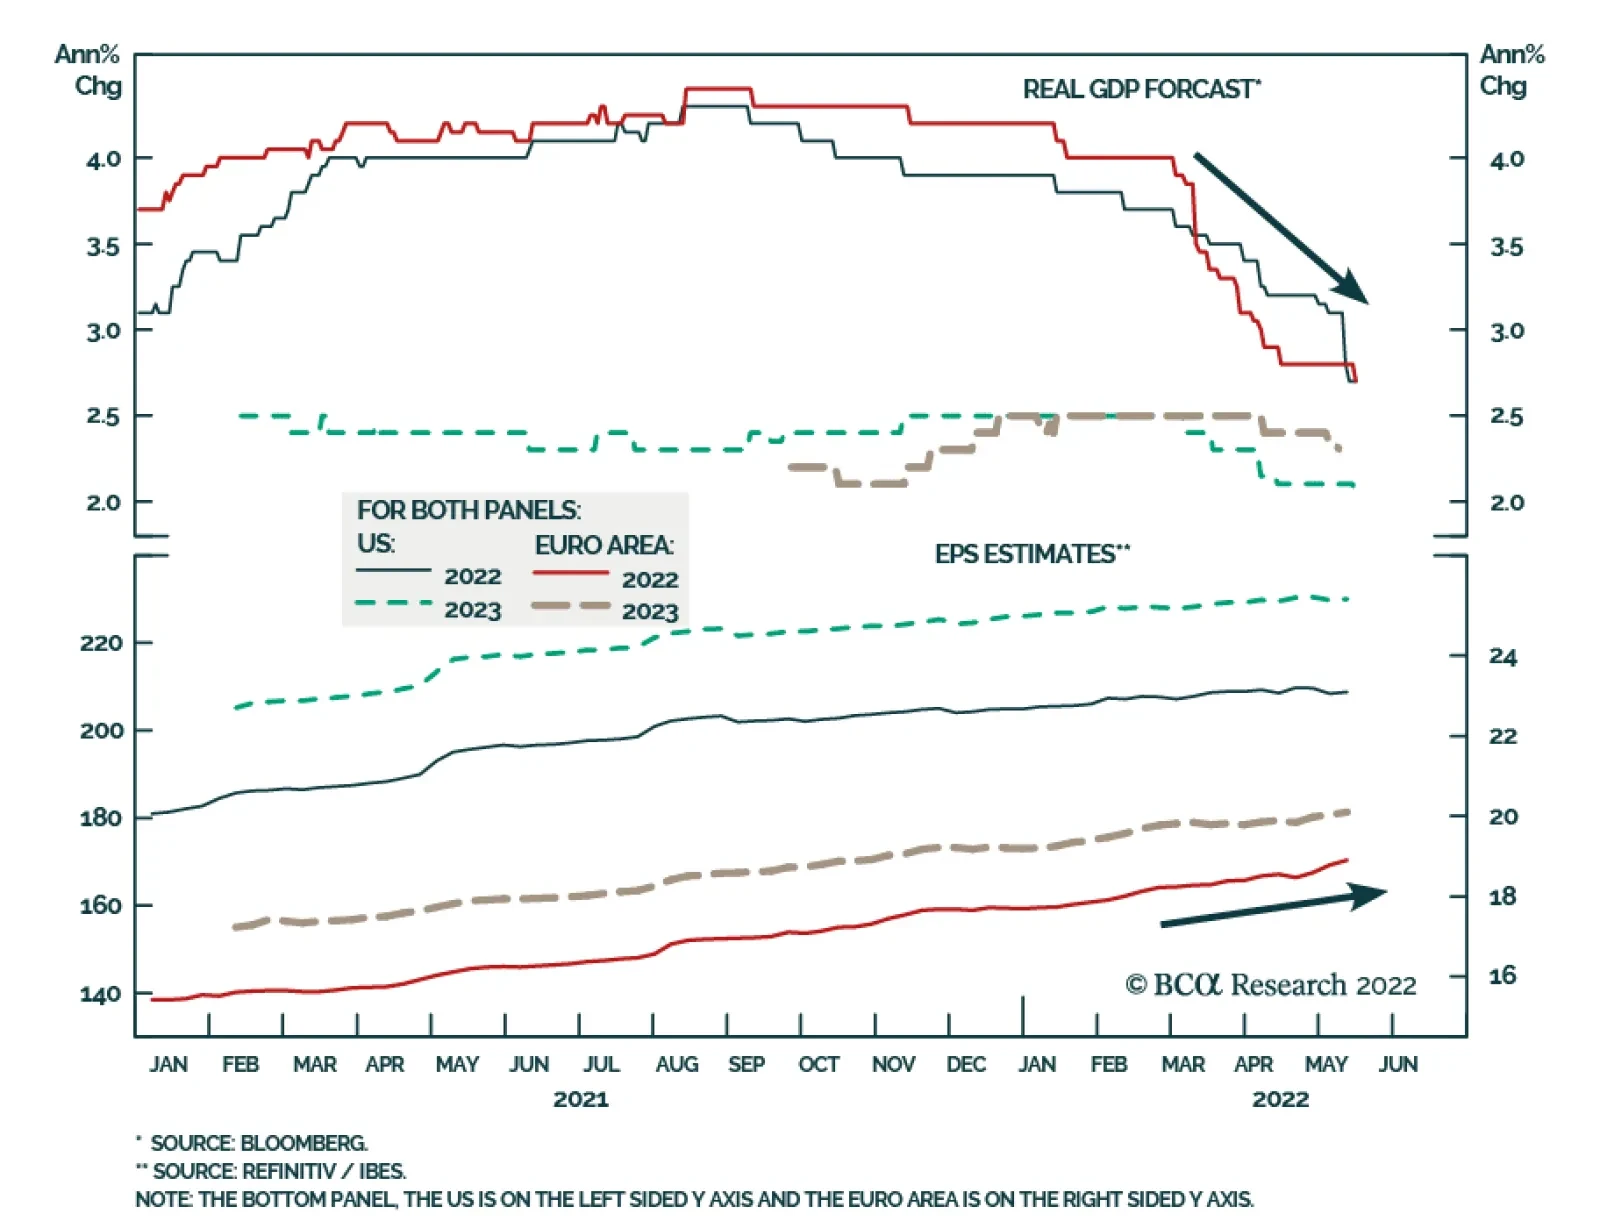
While such a full embargo is possible, it is not our base case. In a remarkable about-face, Putin now says he has “no problems” with Finland and Sweden joining NATO, provided that they do not place military infrastructure in their countries. He had previous threatened a military response at the mere suggestion of NATO membership. In any case, there are few signs that Putin’s increasingly insular and dictatorial regime would respond to an oil embargo or other economic incentives. The wealthy oligarchs who were supposed to rein him in are cowering in fear. It is also not clear if Europe would gain any political leverage over Russia by adopting policies that push its own economy into a recession. It is worth noting that the price of the December 2022 European natural gas futures contract is down 39% from its peak at the start of the war (Chart 16). It is also noteworthy that European EPS estimates have been trending higher this year even as GDP growth estimates have been cut (Chart 17). This suggests that the analyst earnings projections were too conservative going into the year. Chart 16European Natural Gas Futures Are High But Below Their Peak
European Natural Gas Futures Are High But Below Their Peak
European Natural Gas Futures Are High But Below Their Peak
Chart 17European And US EPS Estimates Have Been Trending Higher This Year
European And US EPS Estimates Have Been Trending Higher This Year
European And US EPS Estimates Have Been Trending Higher This Year
Chart 18Chinese Property Sector: Signs Of Contraction
Chinese Property Sector: Signs Of Contraction
Chinese Property Sector: Signs Of Contraction
Q: What about China? The lockdowns are crippling growth and the property market is in shambles. A: There is truth to both those claims. The government has all but said that it will not abandon its zero-Covid policy anytime soon, even going as far as to withdraw from hosting the 2023 AFC Asian Cup. While the number of new cases has declined sharply in Shanghai, future outbreaks are probable. On the bright side, China is likely to ramp up domestic production of Pfizer’s Paxlovid drug. Increased availability of the drug will reduce the burden of the disease once social distancing restrictions are relaxed. As far as the property market is concerned, sales, starts, completions, as well as home prices are all contracting (Chart 18). BCA’s China Investment Strategy expects accelerated policy easing to put the housing sector on a recovery path in the second half of this year. Nevertheless, they expect the “three red lines” policy to remain in place, suggesting that the rebound in housing activity will be more muted than in past recoveries.2 Ironically, the slowdown in the Chinese housing market may not be such a bad thing for the rest of the world. Remember, the main problem these days is inflation. To the extent that a sluggish Chinese housing market curbs the demand for commodities, this could provide some relief on the inflation front. Q: So bad news is good news. Interesting take. Let’s turn to markets. You mentioned earlier that equity sentiment was very bearish. Fair enough, but I would note the very same American Association of Individual Investors survey that you cited also shows that investors’ allocation to stocks is near record highs (Chart 19). Shouldn’t we look at what investors are doing rather than what they’re saying? A: The discrepancy may not be as large as it seems. As Chart 20 illustrates, investors may not like stocks, but they like bonds even less. Chart 19Individual Investors Still Hold A Lot Of Stock
Individual Investors Still Hold A Lot Of Stock
Individual Investors Still Hold A Lot Of Stock
Image
Chart 20B... But They Like Bonds Even Less
... But They Like Bonds Even Less
... But They Like Bonds Even Less
Chart 21Global Equities Are More Attractively Valued After The Recent Sell-Off
Global Equities Are More Attractively Valued After The Recent Sell-Off
Global Equities Are More Attractively Valued After The Recent Sell-Off
Global equities currently trade at 15.3-times forward earnings; a mere 12.5-times outside the US. The global forward earnings yield is 6.7 percentage points higher than the global real bond yield. In 2000, the spread between the earnings yield and the real bond yield was close to zero (Chart 21). It should also be mentioned that institutional data already show a sharp shift out of equities. The latest Bank of America survey revealed that fund managers cut equity allocations to a net 13% underweight in May from a 6% overweight in April and a net 55% overweight in January. Strikingly, fund managers were even more underweight bonds than stocks. Cash registered the biggest overweight in two decades. Q: Your bullish equity bias notwithstanding, you were negative on tech stocks last year, arguing that the NASDAQ would turn into the NASDOG. Given that the NASDAQ Composite is down 29% from its highs, is it time to increase exposure to some beaten down tech names? A: Both the cyclical and structural headwinds facing tech stocks that we discussed in These Three High-Flying Equity Sectors Could Come Crashing Back Down To Earth and The Disruptor Delusion remain in place. Nevertheless, with the NASDAQ Composite now trading at 22.6-times forward earnings, down from 32.9 at its peak last year, an underweight in tech is no longer appropriate (Chart 22). A neutral stance is now preferable. Chart 22Tech Stock Valuations Have Returned To Earth
Tech Stock Valuations Have Returned To Earth
Tech Stock Valuations Have Returned To Earth
Q: I guess if bond yields come down a bit more, that would help tech stocks? A: Yes. Tech stocks tend to be growth-oriented. Falling bond yields raise the present value of expected cash flows more for growth companies than for other firms. While we do expect global bond yields to eventually rise above current levels, yields are likely to decline modestly over the next 12 months as inflation temporarily falls. We expect the US 10-year yield to end the year at around 2.5%. Q: A decline in US bond yields would undermine the high-flying dollar, would it not? A: It depends on how bond yields abroad evolve. US Treasuries tend to be relatively high beta, implying that US yields usually fall more when global yields are declining (Chart 23). Thus, it would not surprise us if interest rate differentials moved against the dollar later this year. Chart 23US Treasuries Have A Higher Beta Than Most Other Government Bond Markets
US Treasuries Have A Higher Beta Than Most Other Government Bond Markets
US Treasuries Have A Higher Beta Than Most Other Government Bond Markets
It is also important to remember that the US dollar is a countercyclical currency (Chart 24). If global growth picks up as pandemic dislocations fade and the Ukraine war winds down, the dollar is likely to weaken. Chart 24The Dollar Is A Countercyclical Currency
The Dollar Is A Countercyclical Currency
The Dollar Is A Countercyclical Currency
Image
A wider trade deficit could also imperil the greenback. The US trade deficit has increased from US$45 billion in December 2019 to US$110 billion. Equity inflows have helped finance the trade deficit, but net flows have turned negative of late (Chart 25). Finally, the dollar is quite expensive – 27% overvalued based on Purchasing Power Parity exchange rates. Q: Let’s sum up. Please review your asset allocation recommendations both for the next 12 months and beyond. A: To summarize, global inflation has peaked. Growth should pick up later this year as supply-chain bottlenecks abate. The combination of falling inflation and supply-side led growth will provide a springboard for equities. We expect global stocks to rise 15%-to-20% over the next 12 months. Historically, non-US stocks have outperformed their US peers when the dollar has been weakening (Chart 26). EM stocks, in particular, have done well in a weak dollar environment Chart 26Non-US Stocks Will Benefit From A Weaker US Dollar
Non-US Stocks Will Benefit From A Weaker US Dollar
Non-US Stocks Will Benefit From A Weaker US Dollar
Chart 27The Market Is Too Pessimistic On Default Risk
The Market Is Too Pessimistic On Default Risk
The Market Is Too Pessimistic On Default Risk
Within fixed-income portfolios, we recommend a modest long duration stance over the next 12 months. We favor high-yield credit over safer government bonds. US high-yield spreads imply a default rate of 6.2% over the next 12 months compared to a trailing 12-month default rate of only 1.2% (Chart 27). Chart 28Falling Inflation Will Buoy Consumer Sentiment
Falling Inflation Will Buoy Consumer Sentiment
Falling Inflation Will Buoy Consumer Sentiment
Our guess is that this Goldilocks environment will end towards the end of next year. As inflation comes down, real wage growth will turn positive. Consumer confidence, which is now quite depressed, will improve (Chart 28). Stronger demand will cause inflation to reaccelerate in 2024, setting the stage for another round of central bank rate hikes. Peter Berezin Chief Global Strategist peterb@bcaresearch.com Follow me on LinkedIn Twitter Footnotes 1 The Federal Reserve targets an average inflation rate of 2% for the Personal Consumption Expenditures (PCE) index. Due to compositional differences between the two indices, CPI inflation has historically averaged 30-to-50 basis points higher than PCE inflation. This is why the Fed effectively targets a CPI inflation rate of 2.3%-to-2.5%. 2 The People’s Bank of China and the housing ministry issued a deleveraging framework for property developers in August 2020, consisting of a 70% ceiling on liabilities-to-assets, a net debt-to-equity ratio capped at 100%, and a limit on short-term borrowing that cannot exceed cash reserves. Developers breaching these “red lines” run the risk of being cut off from access to new loans from banks, while those who respect them can only increase their interest-bearing borrowing by 15% at most. Global Investment Strategy View Matrix
Goldilocks: A Skeptical Q&A
Goldilocks: A Skeptical Q&A
Special Trade Recommendations Current MacroQuant Model Scores
Goldilocks: A Skeptical Q&A
Goldilocks: A Skeptical Q&A
Listen to a short summary of this report. Executive Summary EUR/JPY And The DXY: Unsustainable Gap
EUR/JPY And The DXY: Unsustainable Gap
EUR/JPY And The DXY: Unsustainable Gap
Three interrelated themes are likely to play out by the end of 2022 – peak Fed hawkishness, continued central bank convergence, and nascent green shoots in global economic growth. We are playing the first theme via an outright short DXY position. We are also hedging this bet through a short EUR/JPY trade, a corresponding play on the second theme. Betting on nascent green shoots in economic growth can be expressed via a long Aussie position, or more prudently, a short CHF/SEK bet. We are long a CAD and NOK basket against the RUB, a play on an eventual recovery in oil demand, and the premium that these blends will continue to command relative to Russian oil. Finally, most of our trades remain at the crosses due to elevated FX volatility which has boosted safe-haven demand for the dollar. The admission of Sweden and Finland into NATO could increases the risk of miscalculation on the part of Russia, which will continue to prop near-term safe-haven demand for the dollar. RECOMMENDATIONS INCEPTION LEVEL inception date RETURN Short EUR/JPY 133.28 2022-05-12 -0.73 Bottom Line: Continue to focus on relative value trades at the crosses, until signs emerge that FX volatility is peaking, which will be more conducive for direct USD bets. Feature Chart 1Dollar Capitulation Occurs At Record Valuation And A Record Deficit
Dollar Capitulation Occurs At Record Valuation And A Record Deficit
Dollar Capitulation Occurs At Record Valuation And A Record Deficit
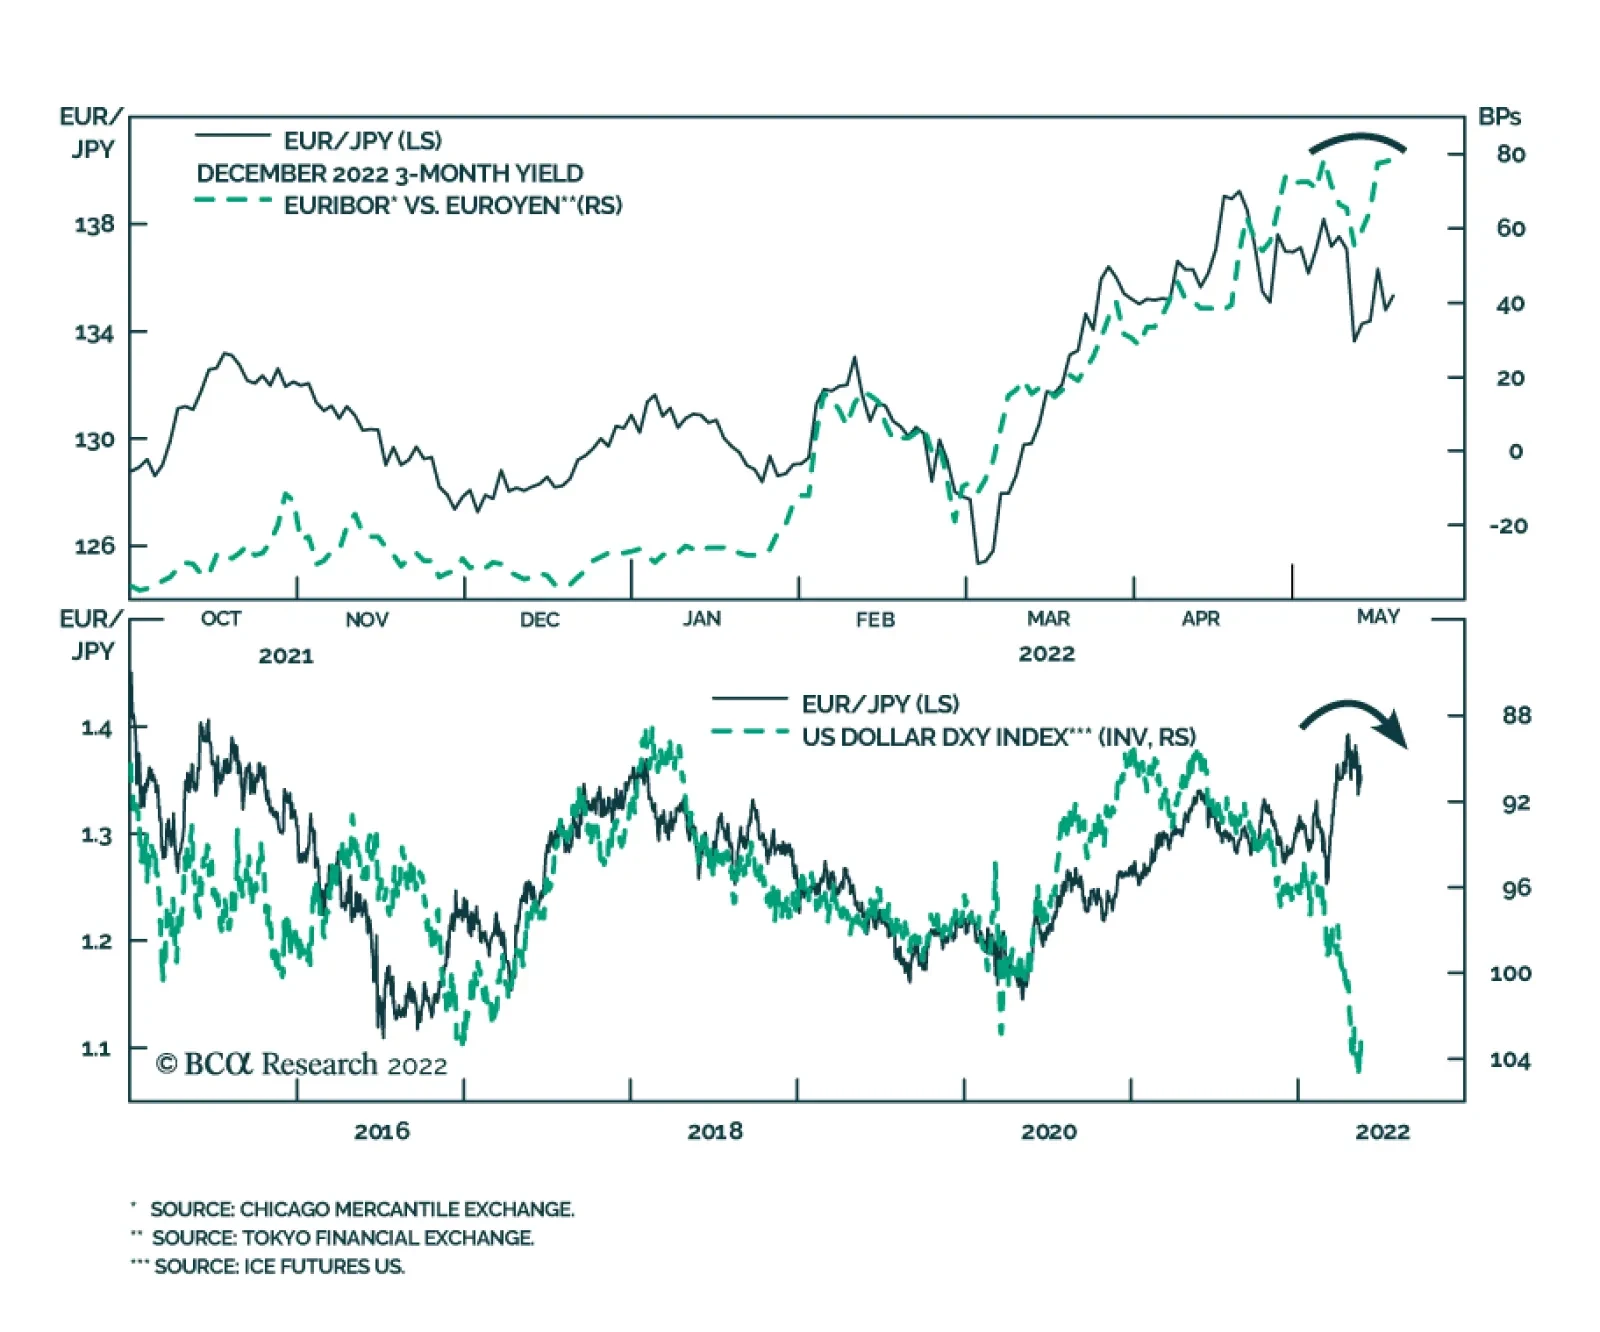
Last week’s report focused on the key reasons why longer-term investors should begin to fade dollar strength. For one, the dollar already imbeds a hefty safe-haven premium. This premium manifests itself in an overvalued exchange rate (Chart 1). A simple PPP model shows that the dollar is overvalued by 27%. This is higher than the peak in the US dollar which preceded the bear market that began in the early 2000s. While valuations tend to matter little until they trigger a tipping point, such an inflection point could be around the corner. One catalyst has been the widening trade deficit which needs to be financed via foreign capital inflows. The US trade deficit continues to deteriorate, hitting a record low of $109.8bn in March. Over the last few years, it has become increasingly difficult to fund this widening trade deficit through foreign purchases of US Treasuries. That said, FX markets are likely to focus on three interrelated themes in the near term – peak Fed hawkishness, continued central bank convergence, and the potential for nascent green shoots in global economic growth. We are playing the first theme via an outright short DXY position. We are also hedging this bet with a short EUR/JPY trade, a corresponding play on the second theme. In the next few sections, we go through a few trades that would benefit from these themes. Short EUR/JPY: A Defensive Play Most of our trades in the portfolio are pro-risk. As such, a short EUR/JPY position acts as an attractive hedge in the near term. The DXY index has historically traded in perfect inverse correlation to the euro-yen exchange rate, but an unusually wide gap has opened up (Chart 2). In our view, this suggests that the collapse in the yen, relative to the euro, is very much overdone. In a risk-off environment, as we witnessed on Wednesday, EUR/JPY will sell off. Meanwhile, there are also fundamental reasons to suggest that this cross is stretched on a longer-term time horizon. First, the cross is expensive on a PPP basis. Chart 3 shows that EUR/JPY usually peaks when the real effective exchange rate is 1.5 standard deviations above its long-term mean. Today’s valuation pins it close to that, among the highest levels since the 1980s. Standard economic theory suggests that a reversal in the cross will be warranted to realign euro area competitiveness relative to Japan. Chart 2EUR/JPY And The DXY: Unsustainable Gap
EUR/JPY And The DXY: Unsustainable Gap
EUR/JPY And The DXY: Unsustainable Gap
Chart 3EUR/JPY Is Not Cheap
EUR/JPY Is Not Cheap
EUR/JPY Is Not Cheap
Meanwhile, there is a case to be made that an expensive EUR/JPY exchange rate is already affecting relative competitiveness. European exports are relapsing relative to those in Japan, which usually ensues after a period of euro-yen strength. Case in point: German factory orders are already contracting, while machinery orders in Japan remain relatively robust (Chart 4). Second, the European Central Bank has been relatively hawkish, vis-à-vis the Bank of Japan. The yield on December 2022 Euribor contracts is 78bps above the TIBOR equivalent, suggesting the ECB will hike rates 4-5 times this year versus the BoJ. Granted, inflation is overshooting in Europe relative to Japan (Chart 5). But as we have been witnessing around the world from the UK to Canada, and all the way to Australia, rising inflation is a global problem. If it persists, it will also begin to meaningfully show up in the Japanese numbers. This will nudge the BoJ away from the ultra-dovish camp. More likely, inflation will moderate, which will allow the ECB to dial back its hawkish rhetoric. Chart 4Europe Is Losing Competitiveness To Japan
Europe Is Losing Competitiveness To Japan
Europe Is Losing Competitiveness To Japan
Chart 5Eurozone Inflation Could Subside In The Coming Months
Eurozone Inflation Could Subside In The Coming Months
Eurozone Inflation Could Subside In The Coming Months
Even if inflation moderates in the eurozone, short-term real rates will remain deeply negative compared to Japan. This will be a significant drag for relative fixed income flows and the currency (Chart 6). At the same time, higher inflation in Europe also suggests the fair value for EUR/JPY should continue its structural downtrend. Chart 6Real Rates Are Very Low In The Eurozone
Real Rates Are Very Low In The Eurozone
Real Rates Are Very Low In The Eurozone
Third, oil price volatility will remain high in the near term but will subside longer term. We are cognizant of the fact that, our Chief Commodity Strategist, Robert Ryan, expects the geopolitical risk premium in oil to increase in the near term. When rising oil coincides with rebounding economic activity, the yen tends to lag as a defensive currency (Chart 7). This time around, the premium in energy markets has come from a cutoff in Russian supplies. Japan imports almost all its energy and has structurally been more dependent on fossil fuels than Europe (Chart 8). This has boosted EUR/JPY and is a risk to a short position. Chart 7EUR/JPY Tracks Oil
EUR/JPY Tracks Oil
EUR/JPY Tracks Oil
Chart 8Japan Will Accelerate A Shift From Fossil Fuels
Japan Will Accelerate A Shift From Fossil Fuels
Japan Will Accelerate A Shift From Fossil Fuels
That said, adjustments are already underway. Japanese and European LNG imports from the US are rising. As a result, the price arbitrage between US Henry Hub prices and the Dutch TTF equivalent are collapsing (Chart 9). The Japanese have already ramped up nuclear power production, reducing their dependence on fossil fuels (Chart 10). That will be a welcome fillip for the Japanese trade balance. In a nutshell, a lot of bad news is already priced in the yen. As such, it has become an attractive hedge. Asian clients not willing to short the euro can short CNY/JPY as a close proxy. Interestingly, CNY/JPY has made a classic double-top and could meaningfully depreciate from current levels (Chart 11), along with EUR/JPY. Chart 9The European And Asian Natgas Premium Is Deflating
The European And Asian Natgas Premium Is Deflating
The European And Asian Natgas Premium Is Deflating
Chart 10A Nuclear Renaissance In Japan?
A Nuclear Renaissance In Japan?
A Nuclear Renaissance In Japan?
Chart 11CNY/JPY: A Double Top?
CNY/JPY: A Double Top?
CNY/JPY: A Double Top?
Short CHF/JPY: Still Attractive, But Taking Profits We also played a long yen leg via a short CHF position but our trailing stop was triggered this week at 130 for a profit of 3.74%. While we believe the cross still faces meaningful downside, we will opportunistically look to sell CHF/JPY again at 135. First, historically, CHF/JPY has inversely tracked the inflation profiles between Switzerland and Japan. Given the collapse in the yen, and much higher Swiss inflation, CHF/JPY has become incrementally more expensive, especially relative to history (Chart 12). To realign competitiveness, the cross should depreciate. Second, from a technical perspective, CHF/JPY is in a classic double-top formation (Chart 13), akin to CNY/JPY. This suggests the safe-haven premium is much higher in the franc than it is in the yen. Chart 12Swiss Inflation Is Lowering CHF"s Puchasing Power
Swiss Inflation Is Lowering CHF"s Puchasing Power
Swiss Inflation Is Lowering CHF"s Puchasing Power
Chart 13CHF/JPY: Look To Go Short Again
CHF/JPY: Look To Go Short Again
CHF/JPY: Look To Go Short Again
The key risk to this trade is that the Swiss equity market is more defensive relative to Japanese bourses. As such, the hefty safe-haven premium in the franc could persist (Chart 14), pushing the cross to our initial entry short point at 135. Chart 14Swiss Equities Could See Inflows Near Term
Swiss Equities Could See Inflows Near Term
Swiss Equities Could See Inflows Near Term
Short CHF/SEK: A Play On The Riksbank’s U-Turn Chart 15Short CHF/SEK Is The Great Value/Growth Play Value/Growth Turns Before The Dollar
Short CHF/SEK Is The Great Value/Growth Play Value/Growth Turns Before The Dollar
Short CHF/SEK Is The Great Value/Growth Play Value/Growth Turns Before The Dollar
Last month, we argued that the dip in the Swedish krona had already priced a recession in the domestic economy. Meanwhile, with a mandate of price stability, we argued the Riksbank will have no choice but to turn more hawkish or lose credibility. As a play on this trend, we recommended going long the SEK relative to the CHF. In a major policy U-turn, the Riksbank raised rates and announced a faster pace of balance-sheet reduction. Most of the arguments made in the original report remain valid, so we will not revisit them here. The one point we will stress is that Sweden’s small open economy makes the SEK very sensitive to global economic conditions. One benefit of a short CHF/SEK position is that while value has been outperforming growth during this selloff, CHF/SEK remains strong which is a departure from the traditional relationship (Chart 15). Ergo, a major safety discount is imbedded in the SEK. Related Report Foreign Exchange StrategyMonth In-Review: A Hefty Safe-Haven Premium In The Dollar Sweden’s bourse is heavy in cyclicals, with large overweight positions in financials and industrials, that will benefit from a renewed capital spending cycle, and higher global rates. Meanwhile, the outperformance of value during a market riot point suggests a change in market leadership could be underway, even if bond yields temporarily crater. The krona remains vulnerable to geopolitical risk, especially if Russia retaliates against Sweden and Finland joining NATO. So far, Russia’s response has been muted. As such, while this pro-cyclical trade faces near-term risk, it remains a safer way, in our view, to play SEK strength. Long AUD: Bet On An Eventual China Rebound Chart 16The AUD And China
The AUD And China
The AUD And China
We will be discussing Australia in an in-depth report next week, so we will keep our comments brief this week. What we will say is that the Aussie is one of the best candidates to play a rebound in global growth, given that it sits near the epicenter of where that growth will likely emanate from – China (Chart 16). Right now, the picture is not pretty, but it is always dark before dawn. Stay tuned. Long (CAD+NOK)/RUB: A Relative Value Play As many countries reroute their oil supplies from Russia to other countries, Canada and Norway could stand to benefit from a relative perspective. Understandably, many clients might not be able to trade the RUB, so we are filing this trade under speculative. First, both Brent and Western Canadian Select oil are trading at a significant premium to the Urals blend, which is likely to be sustained in the next 6 months. This will benefit NOK and CAD, relative to the ruble (Chart 17). Chart 17CAD And NOK Will Benefit From Premium Oil
CAD And NOK Will Benefit From Premium Oil
CAD And NOK Will Benefit From Premium Oil
Second, from an FX point of view, Russia faces the trilemma of the impossible trinity – having decided to limit the free flow of capital, it has chosen independent monetary policy and managing the exchange rate. This will come at a cost, however: As the economy comes grinding to a halt and inflation surges, interest rates will have to stay high to maintain currency stability. This will crush the domestic economy for years to come. Luckily, Russia has a healthy current account surplus, but as production in Canada and Norway improve to offset embargoes on Russian crude, this will also boost their external balance. Long EUR/GBP: The Euro Is More Priced For A Recession We have discussed at length the rationale behind our long EUR/GBP position, so we will not reiterate the arguments here. Our Global Fixed Income colleagues upgraded Gilts to overweight last week, in line with expectations that markets will continue pricing a dovish tilt from the BoE. In our view, the EUR/GBP cross still heavily underprices the risks to the UK economy in the near term. As such, if interest rates in the UK continue to fall relative to those in the eurozone, EUR/GBP will benefit (Chart 18). Chart 18EUR/GBP Has Upside
EUR/GBP Has Upside
EUR/GBP Has Upside
Chester Ntonifor Foreign Exchange Strategist chestern@bcaresearch.com Trades & Forecasts Strategic View Cyclical Holdings (6-18 months) Tactical Holdings (0-6 months) Limit Orders Forecast Summary
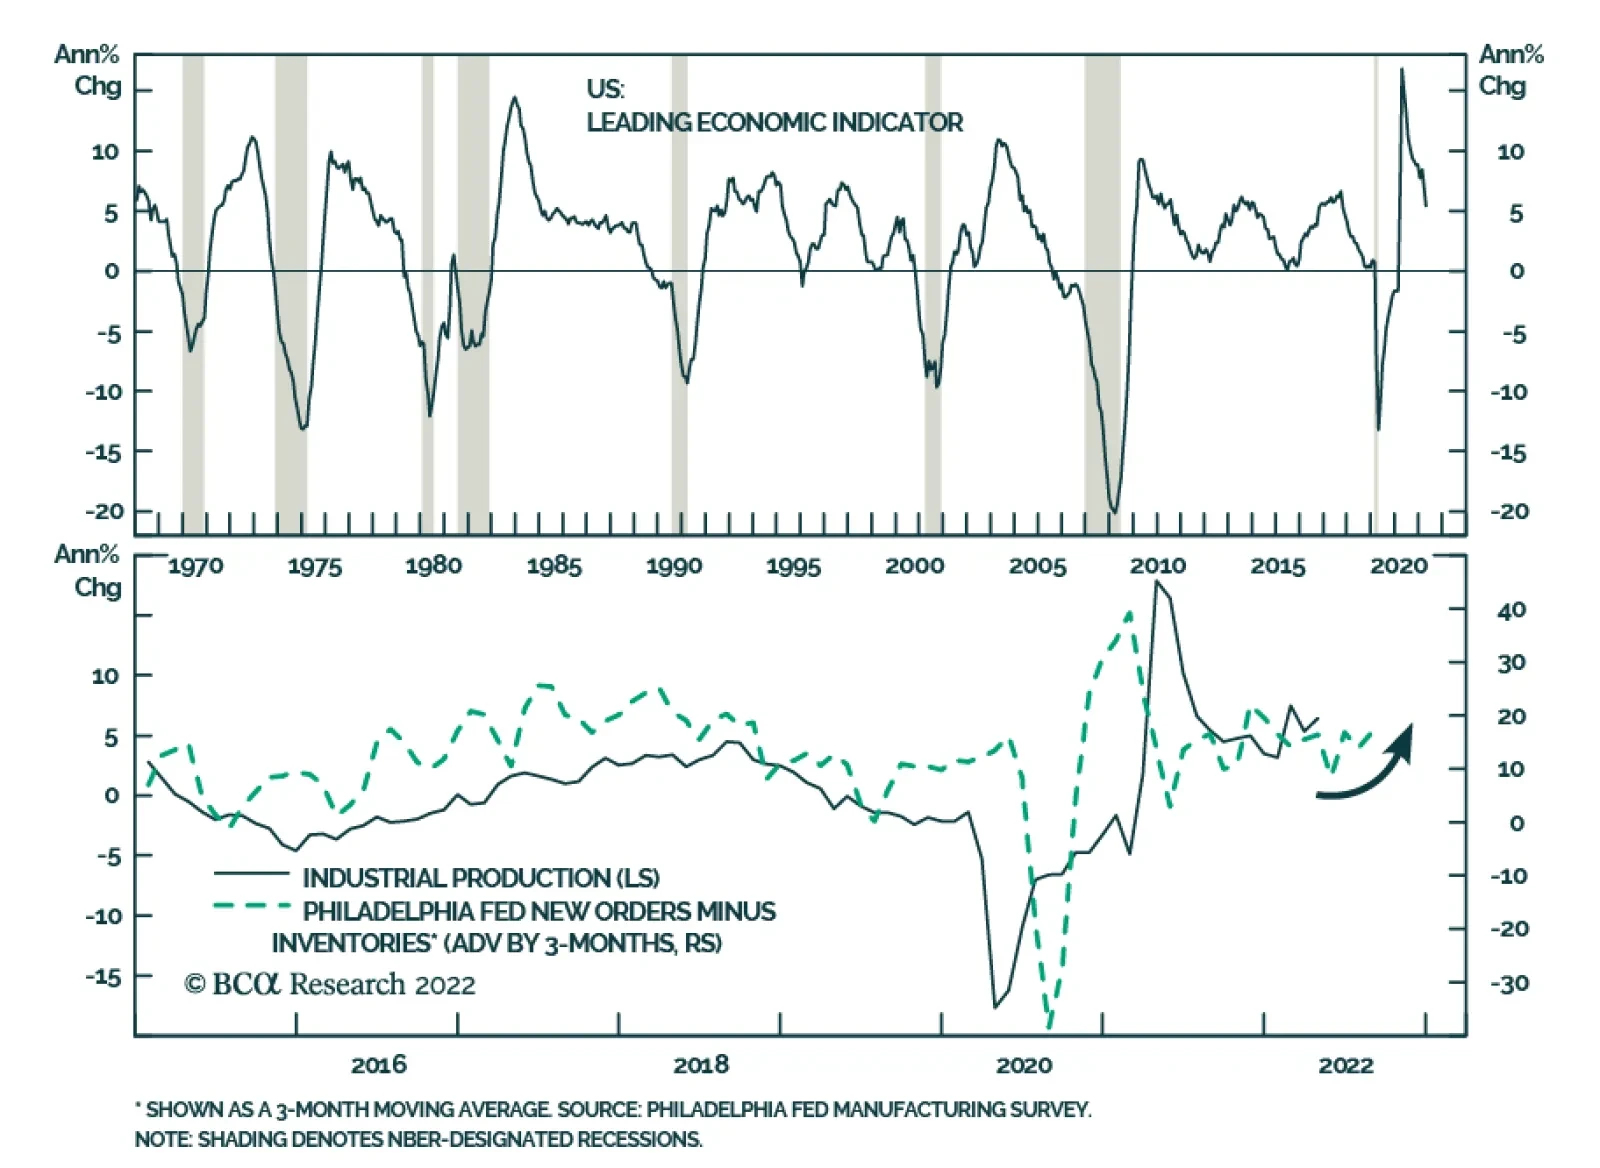
The Conference Board US Leading Economic Index (LEI) unexpectedly contracted by 0.3% m/m in April. A deterioration in consumer expectations for business conditions and residential building permits are responsible for the bulk of the decline. Moreover, the…
US retailers Target and Walmart presented a grim outlook at their earnings calls this week. Although Q1 topline growth surprised to the upside, lingering pandemic supply chain issues as well as higher freight, fuel and labor costs weighed down on both…
Global growth headwinds have increased since the start of the year. Commodity prices have soared on the back of the war in Ukraine. The Eurozone’s near-term economic outlook has dimmed and is at risk of a more severe deterioration if Russia deprives it of its…
Executive Summary Loss Of Russian Production Will Lift Brent
Loss Of Russian Production Will Lift Brent
Loss Of Russian Production Will Lift Brent
With German imports of Russian oil close to 10% of its total requirements – following an impressive decline from 35% pre-invasion – we expect the EU to declare an embargo on Russian oil imports this week or next. Smaller states – e.g., Hungary and Slovokia – will be granted embargo waivers; their import volumes will not affect the EU effort. Russia will be forced to shut in ~ 1.6mm b/d of production, rising to 2mm b/d next year (vs. pre-invasion levels). Demand will fall as Brent prices surpass $120/bbl by 2H22, in our revised base case. Prices above $140/bbl are likely if Russia immediately halts EU oil exports. Our revised forecast calls for Brent to average $113/bbl this year, and $122/bbl next year. WTI will trade $3/bbl lower. Per earlier threats, Russia will cut EU natgas exports following the EU embargo. Benchmark euro natgas prices will go back above €225/MWh, and trigger an EU recession. Bottom Line: An EU embargo on Russian oil imports is close. Brent crude will rally above $120/bbl by 2H22, with $140/bbl or higher likely, depending on how quickly Russia reacts to the EU oil embargo. Eurozone natgas will trade above €225/MWh again. We remain long the S&P GSCI index, the COMT ETF, and the XOP and CRAK ETFs to retain exposure to higher prices. We are getting long 1Q23 ICE Brent futures and 4Q22 TTF futures at tonight's close. Feature Related Report Commodity & Energy StrategyDie Cast By EU: Inflation, Recession Risks Rise The stage is set for the EU to announce an embargo on Russian oil imports this week or next. Odds of an EU embargo being declared sooner rather than later increased, in our view, in the wake of Germany's success in cutting Russian oil imports by more than half in a very short period – from ~ 35% prior to Russia's invasion of Ukraine on 24 February to ~ 12% earlier this month (Chart 1). Further reductions in Russian oil imports we expect from Germany will make it easier for the EU's largest economy to walk away from Russian crude and product imports sooner rather than later.1 Other EU member states already stand with Germany on the issue of an embargo on Russian imports. Those that do not – Hungary and Slovakia, e.g. – do not import Russian oil on a scale that can meaningfully derail EU solidarity on the embargo, which means waivers for these states can be expected to keep the embargo on track. In addition, four of the Five-Eyes states – the US, UK, Australia and Canada – already have imposed embargoes on Russian oil imports. Chart 1EU Energy Import Dependency (2021)
EU Energy Import Dependency (2021)
EU Energy Import Dependency (2021)
Russian Shut-ins Will Tighten Supply The immediate fallout of the EU embargo will be to accelerate the rate at which Russia is forced to shut in production, as increasing volumes of its oil remain stranded on the water looking for a home. We reckon 1mm b/d or so of Russian crude oil output already has been cut. This will continue to increase. Russia will be forced to shut in ~ 1.6mm b/d of crude output this year, rising to 2mm b/d next year (averages vs. pre-invasion levels), in our modelling. This takes Russian oil production down to 8.4mm b/d this year, on average, and 8.0mm b/d next year.2 As more and more Russian crude is shut in, the pipelines carrying Urals and Eastern Siberia-Pacific Ocean (ESPO) crude from the Siberian oil fields to ports will fill, along with inventory in the ports where ships are loaded for export. When storage and pipelines fill, the only alternative Russian producers will have will be to shut in crude and condensate production. While some states obviously will benefit from the increasing availability of Russian crude on offer at 30% discounts or more – e.g., India and China – there is a limit as to how much surplus Russian output they can take in. China, in particular, will not want to jeopardize long-term contracts with key suppliers – e.g., the Kingdom of Saudi Arabia (KSA) – nor will India, which will limit the total volumes both are willing to take from Russia longer term. Security of supply becomes an increasingly important consideration as Russia's oil output continues a long-term decline going forward: Costs were rising prior to Russia's invasion of Ukraine from 2008 to 2019. Falling drilling efficiency and production, were accompanied by rising water cuts – i.e., the amount of water being produced drilling for oil – in Russia's largest fields, which rose to as high as 86%. Shutting production from these older fields will force hard choices as to whether these fields are ever revived.3 Demand Will Be Stressed Shortly after Russia invaded Ukraine, the country's Energy Ministry Alexander Novak warned the EU it would cut off natural gas pipeline supplies being sent to the continent, in retaliation for embargoing oil imports.4 Oil exports of close to 5mm b/d accounted for just under half of Russia's revenue from energy exports last year, with OECD Europe representing half of that amount.5 For Russia, oil exports are far more important than gas exports, which will incline it to immediately cut pipeline flows to Europe as soon as an oil embargo is announced. For the EU, natgas exports from Russia are critical to the economies of its member states (Chart 2). The EU imported ~ 155 bcm of natgas from Russia in 2021, or just over 40% of its total natgas consumption. Germany's share amounted to 45 bcm, or 45% of domestic gas use . If, as we expect, the EU is close to announcing its oil embargo on Russia, an immediate retaliation from Moscow in the form of a cutoff of pipeline exports to the EU most likely will follow. This will throw the EU into a recession, as natgas prices surge. Chart 2Losing Russia's Natgas Will Be Painful For EU
Oil, Natgas Prices Set To Surge
Oil, Natgas Prices Set To Surge
Revised Forecast Reflects Falling Russian Output We are revising our Brent forecast and crude oil balances in line with our expectation Russian oil output will decline meaningfully. As noted above, we now expect Russian crude oil output to fall to 8.4mm b/d this year and 8.0mm b/d in 2023. This pushes non-core OPEC 2.0 production – which now includes Russia – lower, as a result (Chart 3). We moved Russia out of the core OPEC 2.0 producer group, given the production declines we expect this year and next, and into the "Other Guys" group. Our base case demand reflects a shift in OECD vs. non-OECD consumption estimates, with the OECD gaining incrementally, while EM demand (via non-OECD consumption) falls incrementally (Chart 4). Chart 3Falling Russia Output Pushes Non-Core OPEC 2.0 Output Lower
Oil, Natgas Prices Set To Surge
Oil, Natgas Prices Set To Surge
Chart 4DM Demand Shifts Higher, EM Shifts Lower
DM Demand Shifts Higher, EM Shifts Lower
DM Demand Shifts Higher, EM Shifts Lower
The lower EM demand growth reflects weaker China oil consumption resulting from the country's zero-COVID policy. In addition, because we expect Russia to act quickly on cutting off EU natgas exports, benchmark TTF natgas prices will move back above €225/MWh. Higher oil and natgas prices in the EU will lead to recession later this year. How quickly this shows up depends on how quickly Russia reacts to an EU oil embargo. In addition, a strong USD – bid higher by global economic uncertainty and safe-haven demand – will pushing the local-currency costs of refined products like gasoline, diesel and jet fuel higher, also will contribute to lower EM demand (Chart 5). Chart 5USD Remains Well Bid
Oil, Natgas Prices Set To Surge
Oil, Natgas Prices Set To Surge
In our base case, we expect a tighter market on balance (Chart 6). Oil inventories remain under pressure, owing to falling as Russian output and declines in production outside core OPEC 2.0 and the US (Chart 7). We cannot rule out additional SPR releases from the US or IEA to offset tightening global inventories. Chart 6Global Balances Tighten
Global Balances Tighten
Global Balances Tighten
Chart 7Inventories Draw As Supply Tightens
Inventories Draw As Supply Tightens
Inventories Draw As Supply Tightens
Our forecast for Brent this year has been lifted on the back of a much stronger expectation of an EU oil embargo against Russia. This will result in 2mm b/d of Russian production being shut in by next year, which will not be fully replaced (Table 1). We are lifting our Brent forecast to $110/bbl for 2022, and $115/bbl for next year as a result (Chart 8). Chart 8Loss Of Russian Production Will Lift Brent
Loss Of Russian Production Will Lift Brent
Loss Of Russian Production Will Lift Brent
Table 1BCA Global Oil Supply - Demand Balances (MMb/d, Base Case Balances) To Dec23
Oil, Natgas Prices Set To Surge
Oil, Natgas Prices Set To Surge
Investment Implications An EU embargo on Russian oil imports is close at hand, in our view. Brent crude will rally above $120/bbl by 2H22, with $140/bbl or higher possible, depending on Russia's reaction to the EU oil embargo. We expect Brent prices to average $113/bbl this year, and $122/bbl in 2023. WTI will trade $3/bbl lower on average. Eurozone natgas will trade above €225/MWh again and stay at elevated levels, likely moving higher following a Russian cutoff of natgas supplies to the continent. This will throw the EU into recession. We remain long the S&P GSCI index, the COMT ETF, and the XOP and CRAK ETFs to retain exposure to higher prices. We are getting long 1Q23 ICE Brent futures and TTF natgas futures at tonight's close. A word of caution is in order: We are assuming Russia will follow through on its threat to shut off natgas exports to the EU in the event of an embargo against importing its oil is declared. This, we believe, is Russia's red line. If the EU fails to declare an embargo, or if Russia fails to follow through on its threat to cut off gas supplies in the wake of an EU oil embargo of its exports we will have to re-assess our outlook. Robert P. Ryan Chief Commodity & Energy Strategist rryan@bcaresearch.com Ashwin Shyam Research Analyst Commodity & Energy Strategy ashwin.shyam@bcaresearch.com Paula Struk Research Associate Commodity & Energy Strategy paula.struk@bcaresearch.com Commodities Round-Up Energy: Bullish European natural gas inventories are building at a rapid rate, as competition from Asia – typically led by Chinese demand – remains weaker than in previous seasons. EU natgas storage stood at ~446 MWh as of May 16, 2022, the latest available reports indicate (Chart 9). The EU has weathered two extremely difficult winters in 2020-21 and 2021-22. Natgas storage levels were drawn hard to meet space heating demand, which, owing to a winter energy crisis in China at the time, forced European buyers into a competition for liquified natural gas (LNG) during the former period. Following unexpected spring-summer demand in 2021 when cold weather lingered in Europe and wind power generation fell sharply, storage owners again were hard pressed to secure LNG to rebuild storage levels going into this past winter, which caused European TTF natgas prices to soar, as demand surged (Chart 10). With the threat of a cutoff of Russian natgas hanging over the EU, there is a singular focus right now on getting storage as full as possible ahead of next winter. The EU aims to replace two-thirds of Russian gas imports before yearend. Precious Metals: Bullish The Fed has adopted a more hawkish rhetoric, as it acts more aggressively to reduce US inflation. Interest rates have increased from near-zero levels in March to 0.75%, and BCA’s US Bond strategy service expects two more 50 bps rate hikes in June and July. Post July, rate hikes will depend on the Fed’s assessment of inflation, inflation expectations and financial conditions. The Fed faces the risk of either remaining behind the inflation curve or sparking a recession in case it’s either not hawkish enough, or too hawkish. Base Metals: Bullish High power prices in Europe will continue to plague refined base metals production in the continent and keep refined metal prices buoyed. LME Europe aluminum stocks are close to 17-year lows. In China – whose metal smelters were also hit by high power prices in 2021 – aluminum smelting has revived, with the country reportedly producing a record amount of primary aluminum in April. Lockdowns, however, have reduced economic activity, demand for the metal and its domestic price. China has taken advantage of this arbitrage opportunity, sending most of its primary aluminum exports to Europe. This aluminum price spread between the two states has contributed to China’s steady rise in primary aluminum exports this year, after having exported nearly none in 2020 and 2021. Chart 9
Oil, Natgas Prices Set To Surge
Oil, Natgas Prices Set To Surge
Chart 10Dutch Title Transfer Facility Going Down
Dutch Title Transfer Facility Going Down
Dutch Title Transfer Facility Going Down
Footnotes 1 German officials have stated the country will wind down all oil imports from Russia by year end, even if the rest of the EU does not join it in an embargo. We highly doubt Germany will act alone, given the support an embargo already has received from EU member states. Please see Germany to Stop Russian Oil Imports Regardless of EU Sanctions, published by bloomberg.com on May 15, 2022. 2 Our expectation for shut-in volumes is lower than the IEA's, which sees Russia being forced to shut in 3mm b/d of production by 2H22. We continue to monitor this closely via satellite and reporting services and will adjust our estimates as needed. Obviously, if the IEA is correct oil markets will tighten even more than we expect. 3 Please see "The Future of Russian Oil Production in the Short, Medium, and Long Term," published by the Oxford Institute for Energy Studies in September 2019. The OIES study notes production in Russia's highest-producing area – the Khanty-Mansi Autonomous (KMA) district – actually fell 15% between 2008-19, even as drilling activity surged 66%. While output in 2018 rose due to intensified oil recovery (IOR), the OIES noted that the water cut rose sharply in 2018 as well in the KMA district. 4 Please see Russia warns of $300 oil, threatens to cut off European gas if West bans energy imports, published by cnbc.com on March 8, 2022. The article notes Novak threatened to close the Nord Stream 1 pipeline delivering gas to Germany in retaliation for an EU oil embargo. Almost three-quarters of Russia's natgas exports were sent to Europe prior to its invasion of Ukraine. Natgas export revenues accounted for $62 billion of the $242 billion funding Russia's budget last year, while crude oil revenues made up $180 billion (just under 75%). 5 Please see Die Cast By EU: Inflation, Recession Risks Rise, which we published on May 5, 2022. It is available at ces.bcaresearch.com. Investment Views and Themes Recommendations Strategic Recommendations Trades Closed in 2022
Next Thursday May 26, we will hold the BCA Debate – High Inflation: Here To Stay,Or Soon In The Rear-View Mirror? – a Webcast in which I will debate my colleague, Chief Commodity & Energy Strategist, Bob Ryan on the outlook for inflation, and take the side that inflationary fears will soon recede. I do hope you can join us. As such, the debate will replace the weekly report, though we will renew the fractal trading watchlist on our website. Dhaval Joshi Executive Summary The second quarter’s synchronised sell-off in stocks, bonds, inflation protected bonds, industrial metals and gold is an extremely rare star alignment. The last time that the ‘everything sell-off’ star alignment happened was in early 1981 when the Paul Volcker Fed ‘broke the back’ of inflation and turned stagflation into an outright recession. In 2022, the Jay Powell Fed risks doing the same. If history repeats itself, then the template of 1981-82 could provide a useful guide for 2022-23. In which case, bond prices are now entering a bottoming process. Stocks would bottom next. While the near term outlook is cloudy, we expect stock prices to be higher on a 12-month horizon, especially long-duration stocks that are most sensitive to bond yields. But just as in 1981-82, the biggest casualty will be industrial metals, which are likely to suffer at least double-digit losses over the coming year. Fractal trading watchlist: FTSE 100 versus Stoxx Europe 600, Czech Republic versus Poland, Food and Beverages, US REITS versus Utilities, CNY/USD. 2022-23 Could Be An Echo Of 1981-82
2022-23 Could Be An Echo Of 1981-82
2022-23 Could Be An Echo Of 1981-82
Bottom Line: The 1981-82 template for 2022-23 suggests that bonds will bottom first, followed by stocks. But steer clear of gold and industrial metals. Feature Investors have had a torrid time in the second quarter, with no place to hide.1 Stocks are down -10 percent. Bonds are down -6 percent. Inflation protected bonds are down -6 percent. Industrial metals are down -13 percent. Gold is down -6 percent. To add insult to injury, even cash is down in real terms, because the interest rate is well below the inflation rate! (Chart I-1) Chart I-1The 'Everything Sell-Off' In 2022 Last Happened In 1981, When Stagflation Morphed Into Recession
The 'Everything Sell-Off' In 2022 Last Happened In 1981, When Stagflation Morphed Into Recession
The 'Everything Sell-Off' In 2022 Last Happened In 1981, When Stagflation Morphed Into Recession
Such a star alignment of asset returns, in which stocks, bonds, inflation protected bonds, industrial metals, and gold all sell off together, is unprecedented. In the eighty calendar quarters since the inflation protected bond market data became available in the early 2000s there has never been a quarter with an ‘everything sell-off’. Everything Has Sold Off, But Does That Make Sense? The rarity of an ‘everything sell-off’ is because there are virtually no economic or financial scenarios in which all five asset-classes should fall together (Chart I-2 and Chart I-3). Chart I-2An 'Everything Sell-Off' Is Extremely Rare
An 'Everything Sell-Off' Is Extremely Rare
An 'Everything Sell-Off' Is Extremely Rare
Chart I-3An 'Everything Sell-Off' Is Extremely Rare
An 'Everything Sell-Off' Is Extremely Rare
An 'Everything Sell-Off' Is Extremely Rare
A scenario dominated by rising inflation is bad for bonds, but good for inflation protected bonds, especially relative to conventional bonds. Yet inflation protected bonds have not outperformed either in absolute or relative terms. A scenario of rising inflation should also support the value of stocks, industrial metals and certainly gold, given that all three are, to varying degrees, ‘inflation hedges.’ Yet the prices of stocks, industrial metals, and gold have all plummeted. The rarity of an ‘everything sell-off’ is because there are virtually no economic or financial scenarios in which all asset classes should fall together. Conversely, a scenario dominated by slowing growth is bad for industrial metal prices, but good for conventional bond prices – as bond yields decline on diminished expectations for rate hikes. Yet conventional bonds have sold off. What about a scenario dominated by both rising inflation and slowing growth – which is to say, stagflation? In this case, we would expect inflation protected bonds to perform especially well. Meanwhile, with the economy still growing, the prices of industrial metals should not be collapsing, as they have been recently. In a final scenario of an imminent recession we would expect stocks, industrial metals and even gold to sell off, but conventional bonds to perform especially well. The upshot is there are virtually no economic scenarios in which stocks, bonds, inflation protected bonds, industrial metals, and gold plummet together, as they have recently. So, what’s going on? To answer, we need to take a trip back to the 1980s. 1981 Was The Last Time We Had An ‘Everything Sell-Off’ Inflation protected bonds did not exist before the late 1990s. But considering the other four asset-classes – stocks, bonds, industrial metals, and gold – to find the last time that they all fell together we must travel back to 1981, the time of Margaret Thatcher, Ronald Reagan, and the Paul Volcker Fed. And suddenly, we discover spooky similarities with the current Zeitgeist. Just like today, the world’s central banks were obsessed with ‘breaking the back’ of inflation, which, like a monster in a horror movie, kept appearing to die before coming back with second and third winds (Chart I-4). Chart I-4In 1981, Just As In 2022, Central Banks Would 'Do Whatever It Takes' To Kill Inflation
In 1981, Just As In 2022, Central Banks Would 'Do Whatever It Takes' To Kill Inflation
In 1981, Just As In 2022, Central Banks Would 'Do Whatever It Takes' To Kill Inflation
Just like today, the central banks were desperate to repair their badly damaged credibility in managing the economy. As the biography “Volcker: The Triumph of Persistence” puts it: “He restored credibility to the Federal Reserve at a time it had been greatly diminished.” And just like today, central bankers hoped that they could pilot the economy to a ‘soft landing’, though whether they genuinely believed that is another story. Asked at a press conference if higher interest rates would cause a recession, Volcker replied coyly “Well, you get varying opinions about that.” 2022 has spooky similarities with 1981. In fact, in its single-minded aim ‘to do whatever it takes’ to kill inflation, the Volcker Fed hiked the interest rate to near 20 percent, thereby triggering what was then the deepest economic recession since the Depression of the 1930s (Chart I-5 and Chart I-6). With hindsight, it was a price worth paying because the economy then began a quarter century of low inflation, steady growth, and mild recessions – a halcyon period for which the Volcker Fed’s aggressive tightening in the early 1980s have been lauded. Chart I-5In 1981, The Fed Hiked Rates To Near 20 Percent...
In 1981, The Fed Hiked Rates To Near 20 Percent...
In 1981, The Fed Hiked Rates To Near 20 Percent...
Chart I-6...And Thereby Morphed Stagflation Into Recession
...And Thereby Morphed Stagflation Into Recession
...And Thereby Morphed Stagflation Into Recession
Granted, the problems of 2022 are a much scaled down version of those in 1981, yet there are spooky similarities – a point which will not have gone unnoticed by the current crop of central bankers. It is no secret that Jay Powell is a big fan of Paul Volcker. The Echoes Of 1981-82 In 2022-23 The answer to why everything sold off in early 1981 is that central banks took their economies from stagflation to outright recession, and the risk is that the same happens again in 2022-23 (Chart I-7). Chart I-7The Echoes Of 1981-82: Aggressive Rate Hikes In 2022-23 Will Morph Stagflation Into Recession
The Echoes Of 1981-82: Aggressive Rate Hikes In 2022-23 Will Morph Stagflation Into Recession
The Echoes Of 1981-82: Aggressive Rate Hikes In 2022-23 Will Morph Stagflation Into Recession
In the transition from stagflation fears to recession fears, everything sells off because first the stagflation casualties get hammered, and then the recession plays get hammered. This leaves investors with no place to hide, as no mainstream asset is left unscathed. Just as in 1981, a transition from stagflation fears to recession fears likely explains the recent ‘everything sell-off’ because the sell-off in April was most painful for the stagflation casualties – bonds. Whereas, the sell-off in May has been most painful for the recession casualties – industrial metals and stocks. In a stagflation that morphs to recession, everything sells off. What happens next? The template of 1981-82 could provide a useful guide. Bond prices bottomed first, in the late summer of 1981, as it became clear that the economy was entering a downturn which would exorcise inflation. Of the three other asset classes – all recession casualties – stocks continued to remain under pressure for the next few months but were higher 12 months later. Gold fell another 30 percent, though rebounded sharply in 1982. But the greatest pain was in the industrial metals, which fell another 30 percent and did not recover their highs for several years (Chart I-8). Chart I-82022-23 Could Be An Echo Of 1981-82
2022-23 Could Be An Echo Of 1981-82
2022-23 Could Be An Echo Of 1981-82
2022-23 could be an echo of 1981-82, with bond prices now entering a bottoming process. Stocks would bottom next, with one difference being a quicker recovery than in 1981-82 because of their higher sensitivity to bond yields. While the near term outlook is cloudy, we expect stock prices to be higher on a 12 month horizon, especially long-duration stocks that are most sensitive to bond yields. But just as in 1981-82, the biggest casualty of a stagflation that morphs into a recession will be the overvalued industrial metals, which are likely to suffer at least double-digit losses over the coming year. Fractal Trading Watchlist This week’s new additions are Czech Republic versus Poland, and Food and Beverages versus the market, which appear overbought. And US REITS versus Utilities, and CNY/USD, which appear oversold. Finally, our new trade recommendation is to underweight the FTSE 100 versus the Stoxx Europe 600. The resource heavy FTSE 100 is especially vulnerable to our anticipated sell-off in commodities, and its recent outperformance is at a point of fragility that has marked previous turning points (Chart I-9). Set the profit target and symmetrical stop-loss at 5 percent. Chart I-9FTSE 100 Outperformance Is Near Exhaustion
FTSE 100 Outperformance Is Near Exhaustion
FTSE 100 Outperformance Is Near Exhaustion
Fractal Trading Watchlist: New Additions Chart I-10Czech Outperformance Near Exhaustion
Czech Outperformance Near Exhaustion
Czech Outperformance Near Exhaustion
Chart I-11Food And Beverage Outperformance Near Exhaustion CHART 1
Food And Beverage Outperformance Near Exhaustion CHART 1
Food And Beverage Outperformance Near Exhaustion CHART 1
Chart I-12US REITS Are Oversold Versus Utilities CHART 12
US REITS Are Oversold Versus Utilities CHART 12
US REITS Are Oversold Versus Utilities CHART 12
Chart I-13CNY/USD At A Support Level
CNY/USD At A Support Level
CNY/USD At A Support Level
Chart 1The Strong Trend In The 18-Month-Out US Interest Rate Future Is Fragile
The Strong Trend In The 18-Month-Out US Interest Rate Future Is Fragile
The Strong Trend In The 18-Month-Out US Interest Rate Future Is Fragile
Chart 2The Strong Trend In The 3 Year T-Bond Is Fragile
The Strong Trend In The 3 Year T-Bond Is Fragile
The Strong Trend In The 3 Year T-Bond Is Fragile
Chart 3AUD/KRW Is Vulnerable To Reversal
AUD/KRW Is Vulnerable To Reversal
AUD/KRW Is Vulnerable To Reversal
Chart 4Canada Versus Japan Is Reversing
Canada Versus Japan Is Reversing
Canada Versus Japan Is Reversing
Chart 5Canada's TSX-60's Outperformance Might Be Over
Canada's TSX-60's Outperformance Might Be Over
Canada's TSX-60's Outperformance Might Be Over
Chart 6US Healthcare Providers Vs. Software At Risk of Reversal
US Healthcare Providers Vs. Software At Risk of Reversal
US Healthcare Providers Vs. Software At Risk of Reversal
Chart 7A Potential Switching Point From Tobacco Into Cannabis
A Potential Switching Point From Tobacco Into Cannabis
A Potential Switching Point From Tobacco Into Cannabis
Chart 8Biotech Is A Major Buy
Biotech Is A Major Buy
Biotech Is A Major Buy
Chart 9CAD/SEK Reversal Has Started
CAD/SEK Reversal Has Started
CAD/SEK Reversal Has Started
Chart 10Financials Versus Industrials To Reverse
Financials Versus Industrials To Reverse
Financials Versus Industrials To Reverse
Chart 11Norway's Outperformance Could End
Norway's Outperformance Could End
Norway's Outperformance Could End
Chart 12Greece's Brief Outperformance To End
Greece's Brief Outperformance To End
Greece's Brief Outperformance To End
Chart 13BRL/NZD At A Resistance Point
BRL/NZD At A Resistance Point
BRL/NZD At A Resistance Point
Chart 14The Outperformance Of Resources Versus Healthcare Is Vulnerable To Reversal
The Outperformance Of Resources Versus Healthcare Is Vulnerable To Reversal
The Outperformance Of Resources Versus Healthcare Is Vulnerable To Reversal
Chart 15The Outperformance Of Resources Versus Biotech Has Started To Reverse
The Outperformance Of Resources Versus Biotech Has Started To Reverse
The Outperformance Of Resources Versus Biotech Has Started To Reverse
Chart 16Cotton's Outperformance Is Vulnerable To Reversal
Cotton's Outperformance Is Vulnerable To Reversal
Cotton's Outperformance Is Vulnerable To Reversal
Chart 17Homebuilders Versus Healthcare Services Has Turned
Homebuilders Versus Healthcare Services Has Turned
Homebuilders Versus Healthcare Services Has Turned
Chart 18Switzerland's Outperformance Vs. Germany Has Started To End
Switzerland's Outperformance Vs. Germany Has Started To End
Switzerland's Outperformance Vs. Germany Has Started To End
Chart 19The Rally In USD/EUR Could End
The Rally In USD/EUR Could End
The Rally In USD/EUR Could End
Chart 20The Outperformance Of MSCI Hong Kong Versus China Is Vulnerable To Reversal
The Outperformance Of MSCI Hong Kong Versus China Is Vulnerable To Reversal
The Outperformance Of MSCI Hong Kong Versus China Is Vulnerable To Reversal
Chart 21A Potential New Entry Point Into Petcare
A Potential New Entry Point Into Petcare
A Potential New Entry Point Into Petcare
Chart 22FTSE100 Outperformance Vs. Euro Stoxx 50 Vulnerable To Reversal
FTSE100 Outperformance Vs. Euro Stoxx 50 Vulnerable To Reversal
FTSE100 Outperformance Vs. Euro Stoxx 50 Vulnerable To Reversal
Chart 23Netherlands Underperformance Vs. Switzerland Close To Exhaustion
Netherlands Underperformance Vs. Switzerland Close To Exhaustion
Netherlands Underperformance Vs. Switzerland Close To Exhaustion
Chart 24The Sell-Off In The 30-Year T-Bond Is Approaching Fractal Fragility
The Sell-Off In The 30-Year T-Bond Is Approaching Fractal Fragility
The Sell-Off In The 30-Year T-Bond Is Approaching Fractal Fragility
Chart 25The Sell-Off In The NASDAQ Is Approaching Fractal Fragility
The Sell-Off In The NASDAQ Is Approaching Fractal Fragility
The Sell-Off In The NASDAQ Is Approaching Fractal Fragility
Chart 26Czech Outperformance Near Exhaustion
Czech Outperformance Near Exhaustion
Czech Outperformance Near Exhaustion
Chart 27Food And Beverage Outperformance Near Exhaustion CHART 1
Food And Beverage Outperformance Near Exhaustion CHART 1
Food And Beverage Outperformance Near Exhaustion CHART 1
Chart 28US REITS Are Oversold Versus Utilities CHART 12
US REITS Are Oversold Versus Utilities CHART 12
US REITS Are Oversold Versus Utilities CHART 12
Chart 29CNY/USD At A Support Level
CNY/USD At A Support Level
CNY/USD At A Support Level
Dhaval Joshi Chief Strategist dhaval@bcaresearch.com Footnotes 1 The returns are based on the S&P 500, the 10-year T-bond, the 10-year Treasury Inflation Protected Security (TIPS), the LMEX index, and gold. Fractal Trading System Fractal Trades
Markets Echo 1981, When Stagflation Morphed Into Recession
Markets Echo 1981, When Stagflation Morphed Into Recession
Markets Echo 1981, When Stagflation Morphed Into Recession
Markets Echo 1981, When Stagflation Morphed Into Recession
6-Month Recommendations Structural Recommendations Closed Fractal Trades Indicators To Watch - Bond Yields Chart II-1Indicators To Watch - Bond Yields - Euro Area
Indicators To Watch - Bond Yields - Euro Area
Indicators To Watch - Bond Yields - Euro Area
Chart II-2Indicators To Watch - Bond Yields - Europe Ex Euro Area
Indicators To Watch - Bond Yields - Europe Ex Euro Area
Indicators To Watch - Bond Yields - Europe Ex Euro Area
Chart II-3Indicators To Watch - Bond Yields - Asia
Indicators To Watch - Bond Yields - Asia
Indicators To Watch - Bond Yields - Asia
Chart II-4Indicators To Watch - Bond Yields - Other Developed
Indicators To Watch - Bond Yields - Other Developed
Indicators To Watch - Bond Yields - Other Developed
Indicators To Watch - Interest Rate Expectations Chart II-5Indicators To Watch - Interest Rate Expectations
Indicators To Watch - Interest Rate Expectations
Indicators To Watch - Interest Rate Expectations
Chart II-6Indicators To Watch - Interest Rate Expectations
Indicators To Watch - Interest Rate Expectations
Indicators To Watch - Interest Rate Expectations
Chart II-7Indicators To Watch - Interest Rate Expectations
Indicators To Watch - Interest Rate Expectations
Indicators To Watch - Interest Rate Expectations
Chart II-8Indicators To Watch - Interest Rate Expectations
Indicators To Watch - Interest Rate Expectations
Indicators To Watch - Interest Rate Expectations