Developed Countries

Executive Summary Selloffs across financial markets and evidence of decelerating growth have reminded us to play it close to the vest, but they haven't made us bearish. The stability of intermediate- and long-run inflation expectations suggests that the inflation genie has not yet gotten out of the bottle and that the Fed will be able to hold off on squashing the expansion until late 2023 or early 2024. Households' willingness to dip into their excess savings to maintain their spending in the face of inflationary pressures bodes well for the economy for the remaining year and a half that the excess savings cushion can be expected to last. The definitive causes of reduced labor force participation continue to elude researchers but we expect participation will improve over the rest of the year as the low-paid workers responsible for the exodus return to the grind. The Fed Fever Has Broken
The Fed Fever Has Broken
The Fed Fever Has Broken
Bottom Line: Investors have no end of things to worry about, but we remain disposed to see the glass as half-full. We expect the expansion to continue at least into the second half of 2023 and that risk assets will generate positive excess returns over Treasuries and cash for the next twelve months. Feature We have begun meeting clients face-to-face again, in addition to continuing with conference calls. Our discussions with investors and colleagues highlight how uncertain the market and economic landscapes remain. Conditions remain especially uncertain and our views depend on the flow of data; as more pieces of the puzzle emerge, the way we assemble it is subject to change. Conviction Levels In Uncertain Times You are among the optimists at BCA and have been for a while. Are the equity selloff and the current slowdown making you nervous? Do you still see the glass as half-full? It’s our job to be nervous. The way we see the money management ecosystem, managers are responsible for worrying for their clients and we’re responsible for worrying for the managers. We continually ask how we could be getting it wrong and actively seek out information that challenges our view. We are neither foolish nor inexperienced enough to be overconfident; we’re always looking over our shoulder and our head has been on a swivel ever since the pandemic arrived. Related Report US Investment StrategyIt All Depends On Whom You Ask The recent equity decline and growth deceleration have not materially changed our already low conviction level. All investment researchers look backward to look forward. That is to say that we review past interactions between macro variables and financial assets for guidance about future interactions. We even build regression models to formalize our empirical studies, though we keep them in their proper place. We know that models have blind spots and do not rely solely on them any more than we would change lanes on the highway based only on a glance at our rear-view mirrors. A central challenge of the last two-plus years has been that real-time conditions are so unusual that there is little historical framework for evaluating them. Much of what has occurred over that stretch has lacked a close precedent: vast swaths of the economy had not previously been idled in the interest of public safety; Congress did not appropriate 25% of a year’s GDP for distribution to households, businesses and state and local governments in any prior 13-month stretch; job losses had not been so starkly concentrated among unskilled workers while leaving knowledge workers largely unscathed; aggregate household savings and net worth have never risen so much, so fast; and central banks have launched campaigns that would make William McChesney Martin’s head spin, much less Walter Bagehot’s. The scope of the economic challenges and the novelty of the policy responses limit the usefulness of analytical methods that depend on the notion that the future will largely resemble the past. It is therefore too soon to tell if we should be more nervous. As we write, the S&P 500 has blasted 8% off its intraday lows five sessions ago and incoming economic data continue to resist a blanket bullish or bearish interpretation. We empathize with investors’ impatience; one would think that the key macro questions should be settled by now, given how long we’ve been discussing them. They are not settled, though, and we will revisit open debates as new data arrive. The Term Structure Of Inflation Expectations Real-time inflation prints are terrible and much more concerning than tame inflation expectations. Why are you focusing almost exclusively on inflation expectations? We have been keeping a close eye on the course of inflation expectations over time, or their term structure, ever since inflation began to emerge from its extended hibernation. As unsettling as it has been to witness 40-year highs in inflation, we have taken solace from the fact that market prices have uniformly indicated that businesses and investors expect that inflation will recede to familiar levels over the longer run. As indicated by the arrows in the right-hand column, long-term inflation expectations are considerably lower than near-term expectations as implied by the TIPS and nominal Treasury markets (Table 1, top panel) and directly indicated by CPI swaps (Table 1, bottom panel). Expressed as a continuous time series, neither the Treasury (Chart 1, top panel) nor the CPI swaps (Chart 1, bottom panel) market has wavered in its view that high inflation will not persist beyond the near term. Table 1The Inflations Expectations Curve Is Sharply Inverted
Another Round Of Questions
Another Round Of Questions
That is important because it suggests that neither businesses nor investors will need to adjust their strategies to accommodate a lasting upward inflection in price pressures. For businesses, that means that they don’t foresee a need to fight tooth and nail to pass along increased costs. Investors continue to be content with nominal long-term Treasury yields vastly below current year-over year inflation, investment-grade corporate yields that are about half of it and high-yield corporate yields that are a percentage point below it. Chart 1Investors And Businesses Don't Foresee A Lasting Change ...
Another Round Of Questions
Another Round Of Questions
Chart 2... And Neither Do Households
... And Neither Do Households
... And Neither Do Households
Although high inflation seems to have spooked the households responding to University of Michigan consumer sentiment survey takers, they remain unperturbed about its long-run direction. The difference between University of Michigan respondents’ long-run and near-term inflation expectations remains around multi-year lows (Chart 2), as 5-year expectations have held steady at 3% for three straight months. The inference that University of Michigan survey respondents expect high inflation to be fleeting is supported by their views on the advisability of big-ticket purchases. The share of respondents who deem it a bad time to buy a car because prices are (temporarily) high remains near all-time high levels (Chart 3, middle panel), while those who think buying now is auspicious because prices won’t come down is near all-time lows (Chart 3, top panel). The difference between the two continues to set record lows (Chart 3, bottom panel). The consensus view on consumer durables purchases is the same – now is a bad time to buy because high prices won’t last (Chart 4). The economic takeaway is that consumers are willing to bide their time until prices come back to earth and will not exacerbate upward price pressures by clamoring to buy before prices go even higher. Chart 3Consumers Are Willing To Wait Out Supply-And-Demand Imbalances, ...
Consumers Are Willing To Wait Out Supply-And-Demand Imbalances, ...
Consumers Are Willing To Wait Out Supply-And-Demand Imbalances, ...
Chart 4... Instead Of Exacerbating Them By Rushing To Buy Now
... Instead Of Exacerbating Them By Rushing To Buy Now
... Instead Of Exacerbating Them By Rushing To Buy Now
Bottom Line: Economic participants adjust their behavior based on their long-run inflation expectations. If they think the current fever will break, businesses, investors and consumers will not act in ways that fuel a self-reinforcing cycle in which high prices beget still higher prices. The longer that economic actors expect inflation pressures will abate, the greater the chance that they will. Interest Rates And The Fed You’ve been calling for interest rates to stop backing up, but it still feels like they only want to rise. It has been quite a ride from 1.72% on 10-year Treasuries from the beginning of March to 3.12% at the beginning of May, but we have gotten 40 basis points of retracement over the last three weeks (Chart 5). The nearly unanimous view that rates would keep rising was a contrarian sign that the move may have been played out. Reduced expectations for Fed rate hikes have also played a part in bringing yields down. After peaking at 3.45% on May 3rd, the day before the FOMC wrapped up its May meeting, the expected fed funds rate in twelve months is down to 3.09% (Chart 6). Chart 5The Benchmark Treasury Yield ...
The Benchmark Treasury Yield ...
The Benchmark Treasury Yield ...
Chart 6... Has Moved With Rate-Hike Expectations
... Has Moved With Rate-Hike Expectations
... Has Moved With Rate-Hike Expectations
Chart 7Everything, All At Once
Everything, All At Once
Everything, All At Once
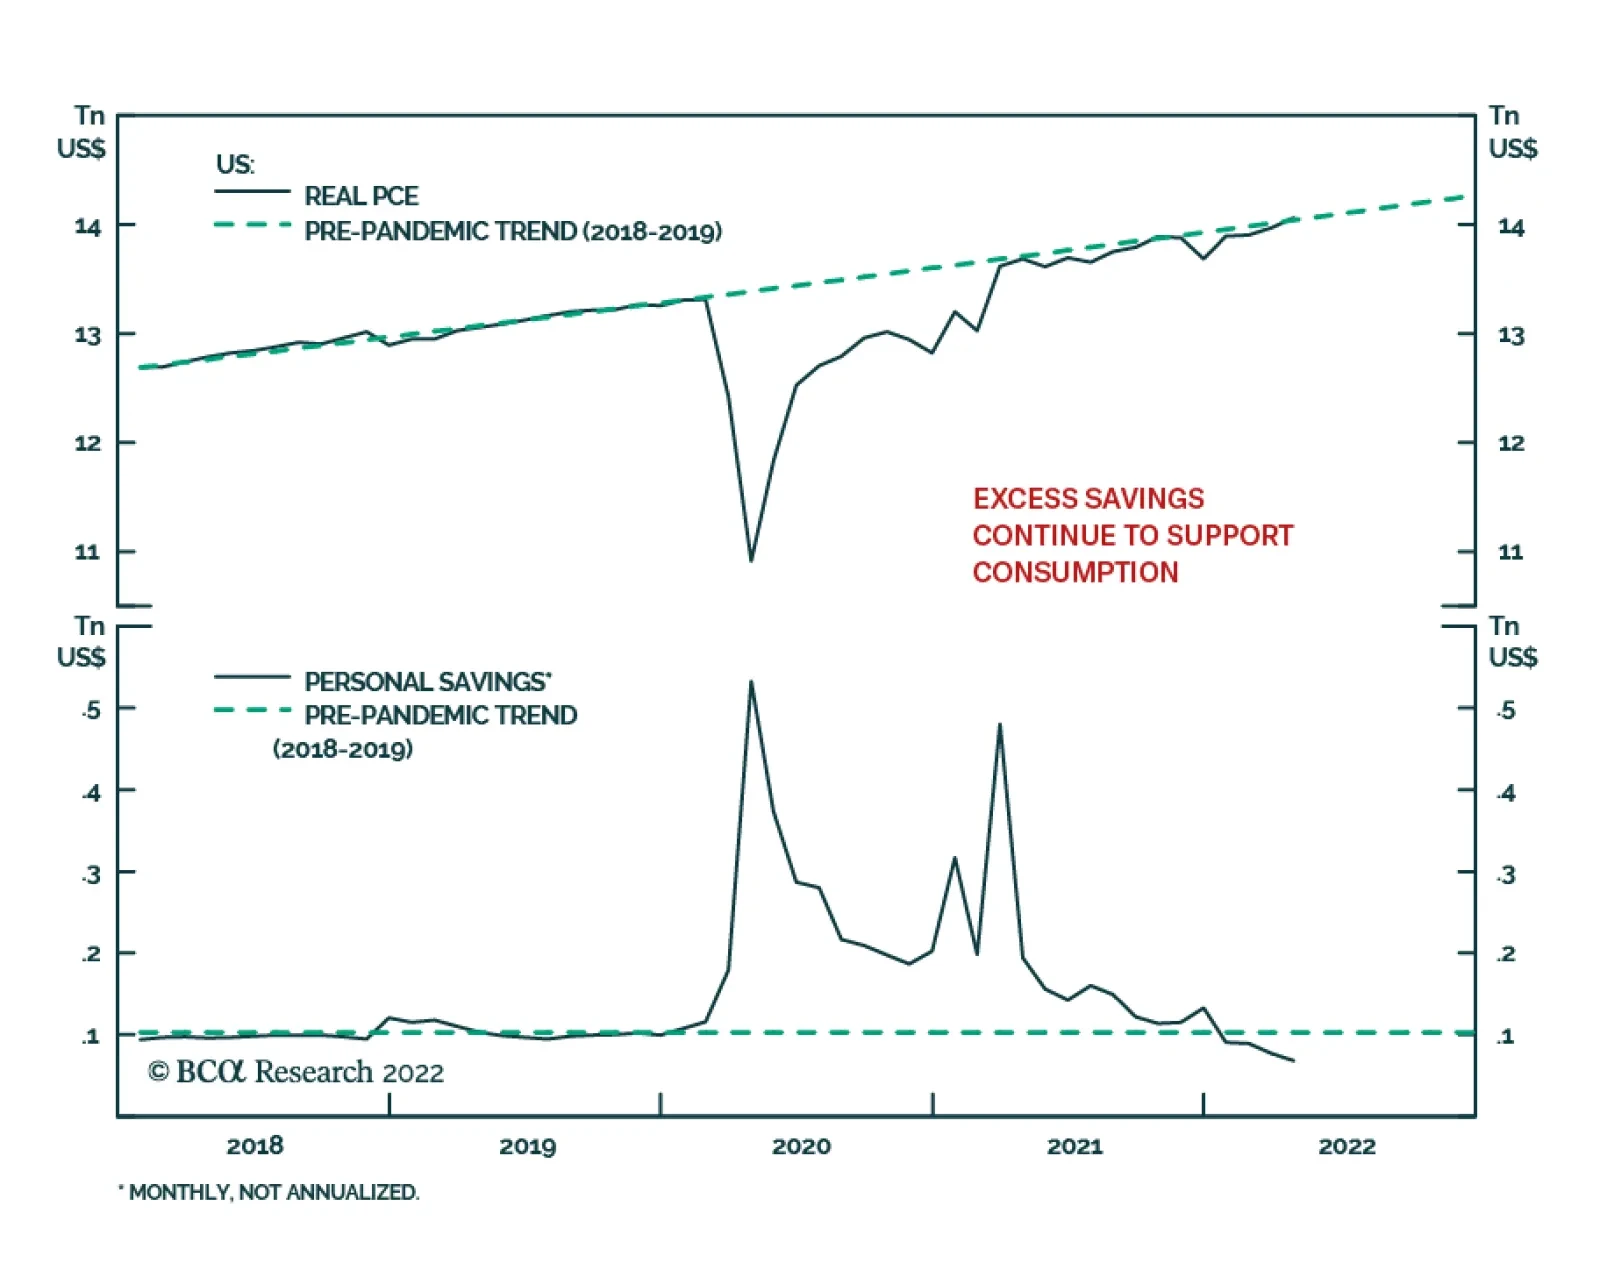
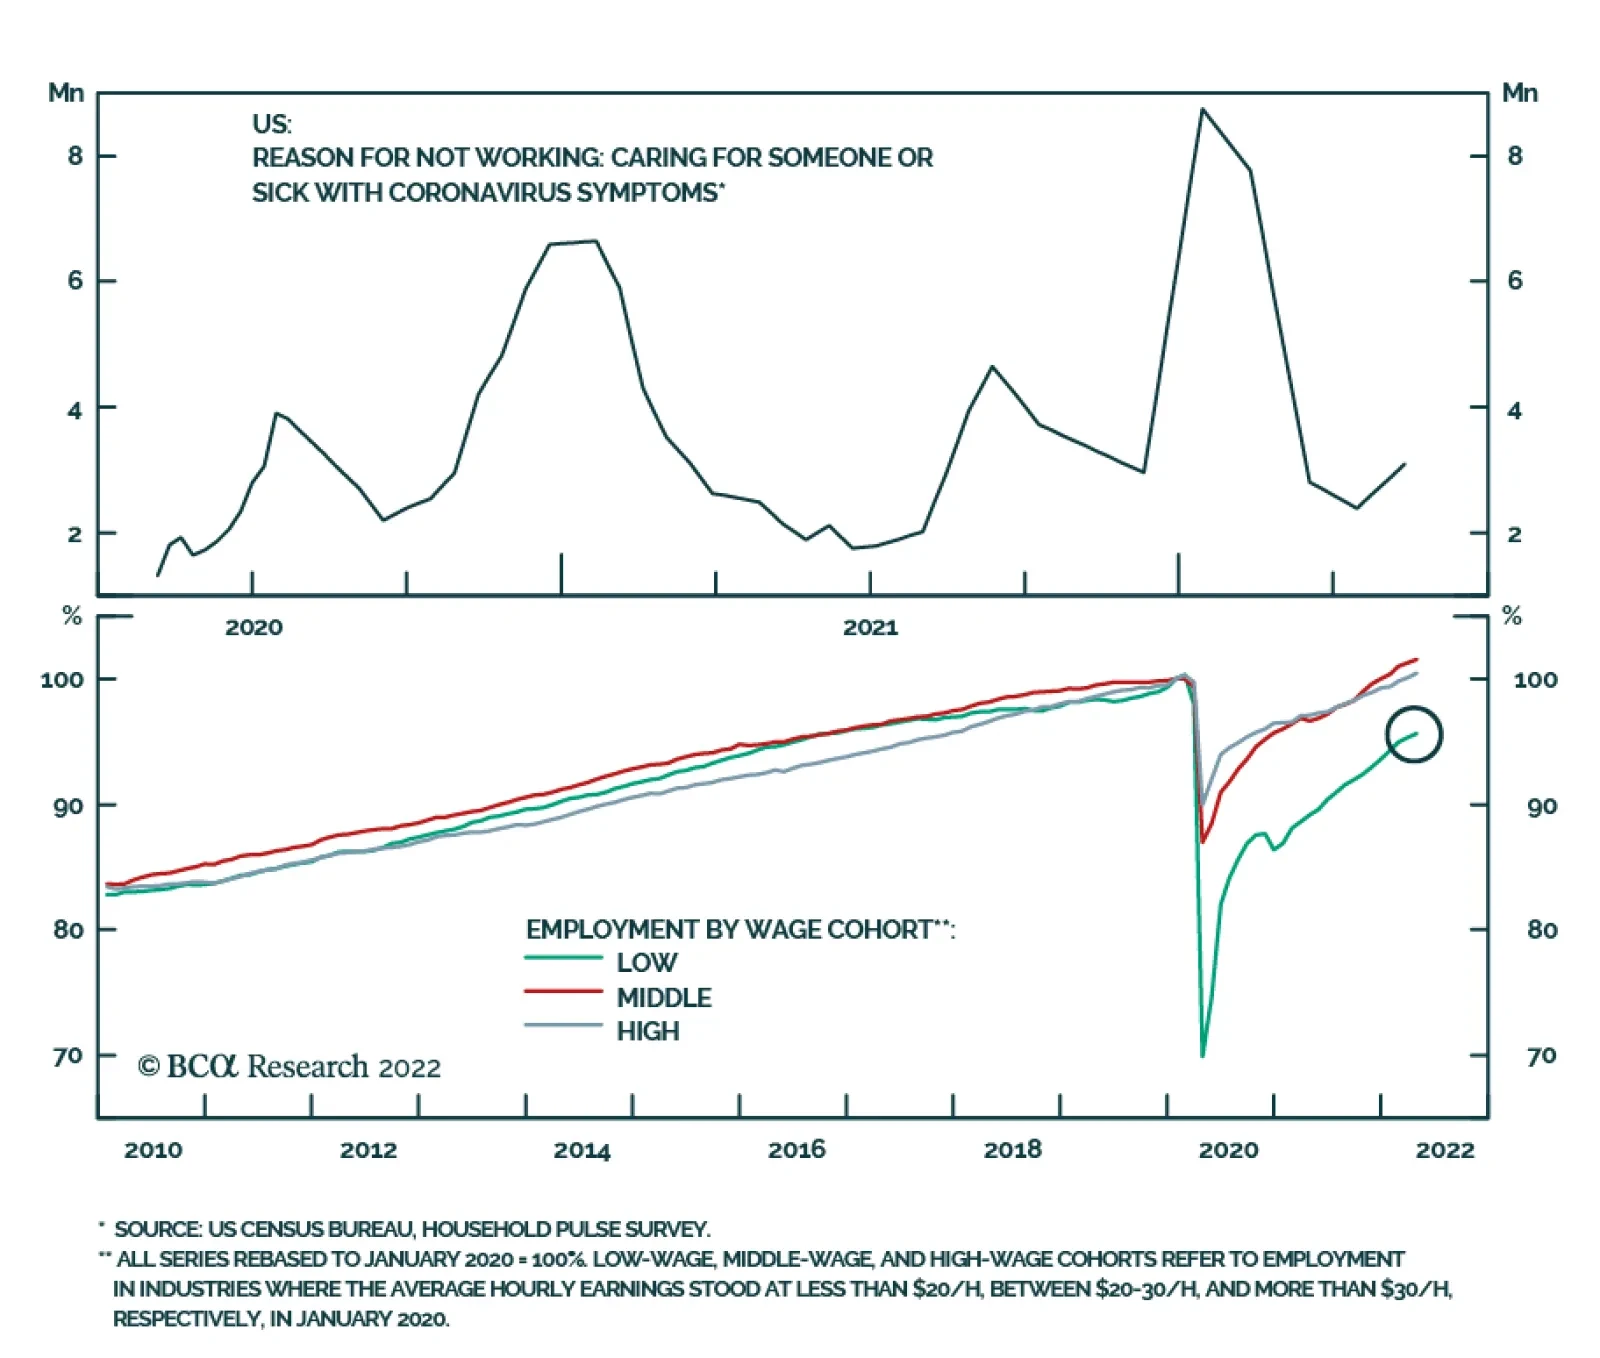
While the prevailing view among commentators is that the Fed waited too long to begin removing monetary accommodation, financial markets have moved swiftly to price in a policy shift. Chair Powell and his colleagues have been taking every opportunity to communicate their seriousness about combating inflation and financial conditions have responded to their public relations campaign without delay (Chart 7, top panel) – yields have backed up (Chart 7, second panel), spreads have widened (Chart 7, third panel), stocks have fallen (Chart 7, fourth panel) and the dollar has surged (Chart 7, bottom panel). Our Global Investment Strategy colleagues argue that the Fed may soon perceive that tighter financial conditions threaten its soft landing goals and dial back the hawkish rhetoric if inflation eases in line with our house view. The Fed’s hawkish surprises might be behind us for the time being. Lightning Round You have argued that households will be more inclined to spend their excess pandemic savings than hoard them and that those savings will provide a buffer against inflation’s bite. The latest Personal Income Report showed that April’s savings rate was nearly half of its pre-pandemic level; are you now worried that the savings are going too fast to cushion the economy? We stand by our view that households will spend their excess savings and continue to think our guesstimate that they will spend half of them will prove to be conservative. We consider the declining savings rate – 6% in January, 5.9% in February, 5% in March and 4.4% in April, versus February 2020’s 8.3% – to be good news, indicating that socked-away stimulus payments are having the beneficial time-release effect of keeping the consumer afloat despite high inflation. We calculate that April’s accelerated consumption as a share of disposable income amounted to $60 billion of dis-savings relative to our no-pandemic baseline estimate, knocking excess savings down to $2,150 billion. At that rate, one-half of the excess balance will last for another 17 months. Will labor force participation ever get back to its pre-pandemic levels? If it doesn’t, upward wage pressures could be greater than you expect, and a wage-price spiral could be brewing. No one has satisfactorily determined why participation remains muted. It seems most likely to us that COVID fears, as indicated by the Census Bureau’s Household Pulse Survey, are the principal driver. Lavish stimulus measures may have played a role as well, though their tailwind has surely faded for households at the bottom rungs of the wealth and income distribution. We expect that participation will recover across the rest of the year as COVID morphs from acute threat to manageable nuisance and as the low-income workers who account for the shrinkage in the labor force (Chart 8) are pressed by financial exigency to return to the grind (Chart 9). Chart 8Those Who Have Left The Work Force ...
Those Who Have Left The Work Force ...
Those Who Have Left The Work Force ...
Chart 9... May Have To Come Back Soon
... May Have To Come Back Soon
... May Have To Come Back Soon
What is your view on inflation? If you think recession fears are overblown, you must not think inflation will be bad enough over the rest of the year to induce the Fed to kill the expansion. The difference between our view and the recession-is-imminent crowd’s is merely one of timing. We expect inflation will abate enough over the rest of the year that the Fed won’t have to break up the party until late 2023/early 2024. We do think, however, that Congress and the Fed overstimulated demand in the wake of the pandemic and sowed the seeds for the eventual end of the expansion and the bull markets in equities and credit. We don’t think the overstimulation will manifest itself until late 2023 or early 2024, however, so we expect that the expansion and the bull markets in risk assets will trundle along for another year. Housekeeping We planned to dial up the risk exposures in our ETF portfolio this week, in line with BCA’s recent tactical equity upgrade to overweight from neutral. It isn’t always easy to make tactical recommendations on a weekly publication schedule and while waiting out a five-and-a-half-hour flight delay at O'Hare last Friday, we wished that we could have pushed a button to increase our equity allocation. Now that the S&P 500 has rallied over 6.5% week-to-date as we go to press, we are going to hold off on making any adjustments until next week at the earliest. With apparent short-term resistance just 1% away at 4,200 (the previous triple-bottom support level), we expect that we may find a better entry point and are willing to wait patiently for it. Doug Peta, CFA Chief US Investment Strategist dougp@bcaresearch.com
Executive Summary Inflationary Pressures To Fade
Inflationary Pressures To Fade
Inflationary Pressures To Fade
The biggest problem for the European economy is surging inflation. Inflation has eroded household real disposable income and is hurting consumption. Inflation is set to roll over this summer, which should allow European economies to begin recovering in the fourth quarter of 2022. The ECB is likely to pause after exiting negative interest rates in Q3. European credit is becoming more attractive, but the risks to our view of European growth could still cause major problems for this asset class. Swiss stocks are vulnerable to a pullback relative to German ones. In France, President Emmanuel Macron is likely to get a legislative majority in June. Bottom Line: European growth should recover after inflation rolls over this summer. The peak in inflation will allow the ECB to pause after its deposit rate gets to zero. Despite this positive view, the large risks hanging over Europe suggest prudence is still warranted. European assets are rebounding in conjunction with the decline in risk aversion visible around global markets. The euro is catching a welcome bid too. However, as we wrote last week, while the conditions are falling in place to see a rally in Europe, too many risks continue to lurk in the background. Therefore, we maintain our conservative approach to European markets, and we still recommend a defensive portfolio. Related Report European Investment StrategyDon’t Be A Hero To shift to a less defensive stance, we want first to observe a peak in European inflation. Inflation represents the greatest problem for the European economy. If inflation continues to surge, the purchasing power of households will deteriorate further and the ECB will ratchet up its hawkish rhetoric, which will cause considerable mayhem in the European economy. A Reprieve For Europe? Only when the income suppressing impact of inflation recedes will European growth strengthen. Chart 1Paying More For The Same
Paying More For The Same
Paying More For The Same
Higher prices continue to hurt European consumption. As witnessed in the US, European retail sales are rising in nominal terms (Chart 1). However, households are not consuming more; they are spending more to purchase the same amount of goods, which is illustrated by the stagnation in retail sales volumes over the past twelve months. Households are not increasing the size of their consumption baskets, because their incomes are not keeping up with inflation. Unlike in the US, Eurozone households never saw their real disposable income spike during the pandemic because European governments focused on preserving jobs rather than distributing large handouts to households. As a result, European real disposable income began to lag its pre-pandemic trend (Chart 2). As the economy recovered, disposable income did not converge back to trend. Now that food and energy prices have spiked, the gap between real disposable income and its trend is only widening. Wages are not coming to the rescue either. The European labor market has been incapable of generating the same kind of wage growth that the US labor market has enjoyed. Even the recent uptick in negotiated wages is not as strong as it seems. German workers benefited from a one-off payment that caused wages to spike by 6.7%, elevating the Euro Area average to 2.8% from 1.6%. However, without that adjustment, German underlying wage growth fell from 3.9% to 1.6% (Chart 3), which means that the underlying European wage only rose by 2%. Chart 2Inflation Destroys Purchasing Power
Inflation Destroys Purchasing Power
Inflation Destroys Purchasing Power
Chart 3Not As Strong As It Seems
Not As Strong As It Seems
Not As Strong As It Seems
The distinction between one-off payments and underlying wages matters. As per Milton Friedman’s permanent income hypothesis, households are unlikely to shift their consumption pattern based on a temporary boost to income. They will save it, or in today’s case, use their one-off payment to cover their food and energy price increases. If today’s wage boost is not repeated, but inflation remains elevated, consumption will suffer. Europe’s tourism industry would be another major beneficiary from the peak in inflation. Prior to the pandemic, tourism contributed to 13%, 14% and 9% of the Italian, Spanish, and French economies, respectively. This sector was decimated during the pandemic after travel came to a halt. We are seeing positive signs emerge on this front. In the spring of 2021, nights spent at hotels were 80% below their spring 2019 levels for the Euro Area (Chart 4). As of March 2022, this variable is now between 15% and 30% below their March 2019 levels in Italy and France, respectively. Moreover, Google Mobility indices for the retail and recreation sectors have almost fully recovered (Chart 5). Thus, we can expect these trends to gather steam once inflation slows, because it will free up household disposable income. Europe’s periphery is particularly well placed to benefit from this eventual positive development. Chart 4Improving Tourism Sector
Improving Tourism Sector
Improving Tourism Sector
Chart 5Mobility Pick-Up
Mobility Pick-Up
Mobility Pick-Up
Positively, European inflation will peak soon. Commodity prices remain elevated, but commodity inflation has decelerated significantly. Hence, the commodity impulse is consistent with an imminent decline in Euro Area HICP (Chart 6). A simulation using BCA’s Commodity & Energy forecast for Brent, which also assumes that European natural gas prices will continue to hover around EUR100/MWh and that EUR/USD will hit 1.1 by year-end, confirms that energy inflation will swoon (Chart 7). Even if we assume a sudden surge in energy prices due to a Russian natural gas cutoff, energy inflation will recede in the second half of 2022 after spiking this summer. Chart 6Peak Inflation?
Peak Inflation?
Peak Inflation?
Chart 7Beware The Russia Cutoff Risk
Beware The Russia Cutoff Risk
Beware The Russia Cutoff Risk
Chart 8Less Pressure From The Consumer Of Last Resort
Less Pressure From The Consumer Of Last Resort
Less Pressure From The Consumer Of Last Resort
Beyond the energy market, global forces also point toward a peak in European inflation in the coming months. The surge in US goods consumption over the past 24 months was felt globally and generated inflationary pressures in Europe as well. However, US durable goods consumption is declining (Chart 8). As a result, this important driver of European inflation will recede. Bottom Line: European consumption will not recover until inflation peaks. Without a deceleration in inflation, household disposable income will remain weak and consumers will remain careful. The good news is that European inflation is still on track to begin its descent this summer, which will boost the prospect for consumer spending and tourism. ECB Update: A Fall Pause? In a blog post last Monday, ECB president Christine Lagarde confirmed that the central bank will lift interest rates in July and will push the deposit rate to zero by September. Chart 9Too Much Priced In
Too Much Priced In
Too Much Priced In
The economy is likely able to handle those two rate hikes. Our ECB monitor highlights the need to remove monetary accommodation in the Eurozone (Chart 9). Moreover, the German 2-/10-year yield curve has steepened this year, despite the hawkish shift in the ECB’s rhetoric, which confirms that monetary conditions are extremely accommodative. We expect the ECB to pause its rate hike campaign after exiting negative rates this fall to reassess economic conditions. Constraints on the ECB remain potent. If the central bank ignores these limiting factors, a policy mistake will ensue. Inflation is likely to decelerate by the end of the summer, which will undercut the hawks driving the consensus at the Governing Council today. Inflation is the factor pushing the ECB Monitor higher right now, not growth conditions (Chart 9, second panel). Thus, the case for lifting rates will weaken considerably when inflation slows. Growth is unlikely to have recovered enough by September to justify additional rate hikes after inflation slows. The expected improvement in consumption and household finances discussed earlier will be embryonic by the end of the summer and will not offer a clear case to lift rates further. Instead, the ECB will still have to juggle the tightening in financial conditions created by wider bond spreads in the European periphery and the impact of China’s slowdown on European exports. Meanwhile, capex is unlikely to strengthen meaningfully as long as global trade softens. As a result, we stay long the June 2023 Euribor futures. An extended pause after the September meeting will prevent the ECB from hiking rates as much as money markets expect over the coming twelve months (Chart 9, bottom panel). If the ECB goes ahead and continues to lift rates in the fall and early winter, the European economy will weaken considerably more and the previous rate hikes will have to be undone. Both scenarios are bullish for the June 2023 Euribor contract. Bottom Line: The ECB is likely to pause after pushing its deposit rate to zero in the third quarter in order to reassess economic conditions. Inflation is the main factor behind higher rates, and it will peak this summer. Meanwhile, the economy is still not strong enough to justify significantly higher interest rates. The market’s pricing in the ESTR curve is much too aggressive considering this context. Stay long June 2023 Euribor futures. Credit Update: Don’t Be A Hero Chart 10Cautious In Absolute Terms, Positive On Relative Performance
Cautious In Absolute Terms, Positive On Relative Performance
Cautious In Absolute Terms, Positive On Relative Performance
Credit markets are experiencing a second episode of spread widening this year. The first episode was triggered by the invasion of Ukraine by Russia. The current one reflects strong inflation, weaker growth prospects, and the ECB’s policy shift. Year-to-date, European investment grade and high-yield corporate bond option-adjusted spreads have widened by 74bps and 188bps, respectively (Chart 10, top panel). As we wrote last week, if the global economic situation were to stabilize, then European assets would be a buy at current levels. This is especially true for European credit. Beyond attractive valuations, corporate bond issuers’ balance sheets are in good shape and the default risk is low. However, the same risks that prevent us from being buyers of the euro and European stocks today also hang over the credit market. Specifically, a further deterioration of the energy flows between Russia and the EU and/or a policy mistake, whereby the ECB delivers the seven rate hikes priced in the overnight index swap market, would cause spreads to widen meaningfully from their current elevated levels. Therefore, we recommend investors remain on the sidelines and wait for a safer entry point over the coming weeks. Once inflation has peaked and stagflation/recession fears recede, then credit spreads will have ample room to narrow, especially if the ECB decides to pause after lifting the deposit rate to 0% (Chart 10, second panel). In the meantime, expected policy rate differentials are still supportive of an overweight on European credit relative to US credit (Chart 10, bottom panel). Bottom Line: European spreads are most likely peaking. However, the same risks that hang over EUR/USD and European equities prevent us from buying this asset class just yet. Swiss Stocks Are Getting Expensive Chart 11Swiss Stocks Getting Ahead Of Earnings
Swiss Stocks Getting Ahead Of Earnings
Swiss Stocks Getting Ahead Of Earnings
The defensive Swiss market has greatly outperformed its Euro Area counterpart this year. However, the recent bout of Swiss outperformance has been completely dissociated from the trend in Swiss EPS relative to those of the Euro Area (Chart 11). Now, Swiss equities are particularly expensive and sport multiples 45% greater than the P/E ratio of the Eurozone MSCI benchmark. This bifurcation between the relative performance of Swiss stocks and their relative earnings represents a trading opportunity. Specifically, Swiss shares look vulnerable against German ones, which have been seriously beaten down in recent years. Chart 12Priced For The Apocalypse
Priced For The Apocalypse
Priced For The Apocalypse
Swiss stocks have been re-rated on the back of many forces. First, the valuations of Swiss stocks relative to German ones have risen in tandem with the Eurozone’s headline and core inflation (Chart 12, top and second panel). Swiss relative valuations have also benefited from the significant tailwind created by higher 2-year rates in the Eurozone (Chart 12, third panel) and from the weakness in the euro (Chart 12, fourth panel). Finally, Swiss relative valuations seem to have already priced in a significant deterioration in European manufacturing activity, which would have lifted their appeal as a defensive play (Chart 12, bottom panel). We recommend selling Swiss stocks against German ones. We anticipate European inflation to peak this summer. Our ECB view is consistent with a decline in Germany’s 2-year bond yields. We also expect the euro to bottom and, even though we have written about a deterioration in European manufacturing activity, the recent explosion of Swiss multiples relative to German ones looks overdone. This trade may be seen as our first attempt to dip our toe into cyclical assets, even if we generally favor capital preservation over risk taking at this juncture. Bottom Line: The outperformance of Swiss equities is overextended and is already pricing in a dire outcome for European economies. Selling Swiss shares relative to German stocks is an attractive way to add tentatively some risk to a European portfolio. France Update: Likely Legislative Majority For Macron Chart 13French Polls Suggest Macron Will Get His Legislative Majority
Looking Beyond Europe’s Inflation Peak
Looking Beyond Europe’s Inflation Peak
President Emmanuel Macron’s political party, Renaissance (previously En Marche!), may surprise to the upside in this year’s legislative election. An aggregate of recent polls (Chart 13) suggests that the presidential coalition (which includes Renaissance and its allies) will obtain between 295 and 340 seats in the Assemblée Nationale, more than the 289 seats needed to achieve a majority. The odds of seeing an historically low voter turnout should also play in the French president’s favor. Chart 14Favor French Small-Caps & Avoid Consumer Stocks
Favor French Small-Caps & Avoid Consumer Stocks
Favor French Small-Caps & Avoid Consumer Stocks
Macron will not have to compromise to build a coalition in favor of his reform agenda, which bodes well for French productivity and trend growth. This election should not have an impact on French assets beyond that. We continue to recommend investors favor French small-caps, as they will benefit from an improvement in domestic consumer confidence and an eventual strengthening in the euro (Chart 14). Meanwhile, we still see more downside for French consumer stocks (Chart 14, bottom panel). Mathieu Savary, Chief European Strategist Mathieu@bcaresearch.com Jeremie Peloso, Editor/Strategist JeremieP@bcaresearch.com Tactical Recommendations Cyclical Recommendations Structural Recommendations
Executive Summary Equities Are Closer To Capitulation
What Is Next For US Equities? They Will Be Fat And Flat
What Is Next For US Equities? They Will Be Fat And Flat
The market appears to be moving away from concerns about inflation toward worries about slowing growth. The initial stage of the sell-off in risky assets, pricing in tighter monetary policy, may now be complete. The next and final stage of the bear market will be pricing in a global growth slump. Slowing growth is not yet built into consensus expectations, neither for earnings nor GDP – downgrades and negative surprises are in store. The US consumers are under duress and are unlikely to lend a “spending hand” to support economic growth. Inflation is easing. Positive inflation surprises will ignite powerful rallies but are unlikely to alter the trajectory of monetary policy. The Fed “put” is no longer at play – falling equities will help the Fed tame inflation via the “wealth effect”. The next chapter for the market is down but in a “fat and flat” manner, with “growth disappointment” equity sell-off being punctuated by short-lived rallies on hopes that the Fed may change its course. Our updated Equities Capitulation Scorecard is marginally more positive on equities but is still signaling that not all conditions for a sustainable rebound are yet met. Bottom Line: Repricing of tighter monetary policy is likely complete. The next leg down for equities will be pricing in slower economic growth and a potential earnings recession. We expect the market to be “fat and flat” over the next few months, i.e., alternating between pullbacks and short-lived rallies. Monetary Tightening Is Probably Priced In Until now, the sell-off in equity markets was a repricing of tighter monetary conditions. One may argue that most of the damage has been done: Since the beginning of the year, the NASDAQ is down 30% while the S&P is down 20%. Nearly 34% of stocks in the S&P 500, and 14% of stocks in the NASDAQ are trading below their 200-day moving average. Does this mean that the sell-off is over and that hawkish Fed fears are overdone? After all, over the past few days, Fed rate expectations appear to have topped out (Chart 1), and Treasury yields have come down 37 bps from their recent peak to 2.75% (Chart 2). Monetary conditions have tightened substantially year to date, although more tightening is still on the way (Chart 3). The Citi Inflation Surprise Index has turned decisively down (Chart 4) and some of the series most affected by supply chain bottlenecks, such as shipping costs, have been deflating. Chart 1Fed Rate Expectations Have Stabilized
Fed Rate Expectations Have Stabilized
Fed Rate Expectations Have Stabilized
Chart 2Treasury Yield Has Come Down
Treasury Yield Has Come Down
Treasury Yield Has Come Down
Chart 3Financial Conditions Are Getting Tighter
Financial Conditions Are Getting Tighter
Financial Conditions Are Getting Tighter
Chart 4Inflation Is Starting To Surprise To The Downside
Inflation Is Starting To Surprise To The Downside
Inflation Is Starting To Surprise To The Downside
Is it clear sailing for longer-duration assets like growth equities? Not so fast: While much adversity has been priced in, a sustainable rebound in equities is probably still elusive. Worries About Economic Growth Are Starting To Dominate The Market Narrative We posit that long-term rates have come down because the markets have moved on from worries about raging inflation and the hawkish Fed to concerns about a downshift in growth both in the US and globally. As such, both earnings and economic growth disappointments are on the cards, potentially leading the markets down further. Overall, the next phase of the sell-off in global risk assets will likely be characterized by heightened growth worries. This phase will also mark the final chapter of this bear market. Thunder Clouds On The Horizon During the J.P. Morgan Investor Day, Jamie Dimon, in his otherwise upbeat speech, said that there are “thunder clouds on the horizon.” Indeed, the list of investor concerns is long: A global growth slowdown, build-up of inventories, inflation damaging consumer purchasing power, the soaring costs of raw materials, declining corporate profitability, tightening monetary conditions and, to top it all, a stronger dollar. However, from Dimon’s standpoint, these are just that: Clouds that could dissipate at any time. Of course, there is always a chance that things will turn out better than expected, and a “softish landing” is on the cards. We hope Dimon is right… Economic Growth Surprises To The Downside For now, our working assumption is that the economy is still strong, but growth is decelerating. To us, this is a story about the second derivative. The troubling part is that slowing growth is not yet built into consensus expectations: It is confounding that GDP growth forecasts have still barely budged from the beginning of the year and do not yet reflect all the headwinds listed above (Chart 5). Moreover, the Q1-2022 GDP revision has shown that growth was weaker than initially reported, with the latest reading of -1.5%, growth reduced by investments weaker than initially anticipated. The Atlanta Fed Nowcast GDP tracker points to only 1.8% annualized growth in Q2-2022. Elevated expectations are setting investors up for disappointment, which will lead to the next leg of the sell-off. The Citigroup Economic Surprise Index has recently shifted into negative territory (Chart 6). Chart 5GDP Forecasts Need To Be Revised Down Further
GDP Forecasts Need To Be Revised Down Further
GDP Forecasts Need To Be Revised Down Further
Chart 6Economic Data Disappoints
Economic Data Disappoints
Economic Data Disappoints
What is the evidence of slowing growth? Walking down the main street of any major city and seeing restaurants overflowing with customers and people buzzing in and out of shops, one may think that the economy is booming. Yet, there is plenty of evidence to the contrary. The ISM PMI is on a downward trajectory, hitting 55 in May, which was also 2.4 points below consensus. The S&P Global (former Markit) May flash PMI readings have also declined from 59.2 in April to 57.5 in May. This is hardly surprising: As night follows day, monetary tightening leads to slowing growth (Chart 7). Inventory overhang: It is noteworthy that the ISM PMI new orders-to-inventories ratio (NOI) is in a free-fall: It is foreshadowing further weakness in manufacturing activity as demand for durable goods is fading (Chart 8). May durable goods orders were also soft. Chart 7Monetary Tightening Leads To Slower Growth
Monetary Tightening Leads To Slower Growth
Monetary Tightening Leads To Slower Growth
Chart 8Inventories Are Building Up
Inventories Are Building Up
Inventories Are Building Up
Freight volumes are also contracting, pointing to weakening growth, and are consistent with the NOI ratio (Chart 9). Global growth is also slowing as evidenced by the contraction in global trade volumes (Chart 10): US and European demand for goods ex-autos is shrinking following the pandemic binge, while China’s recovery has been delayed. Chart 9Freight Volumes Also Point To Weaker Growth
Freight Volumes Also Point To Weaker Growth
Freight Volumes Also Point To Weaker Growth
Chart 10Global Export Volumes Are Set To Shrink
Global Export Volumes Are Set To Shrink
Global Export Volumes Are Set To Shrink
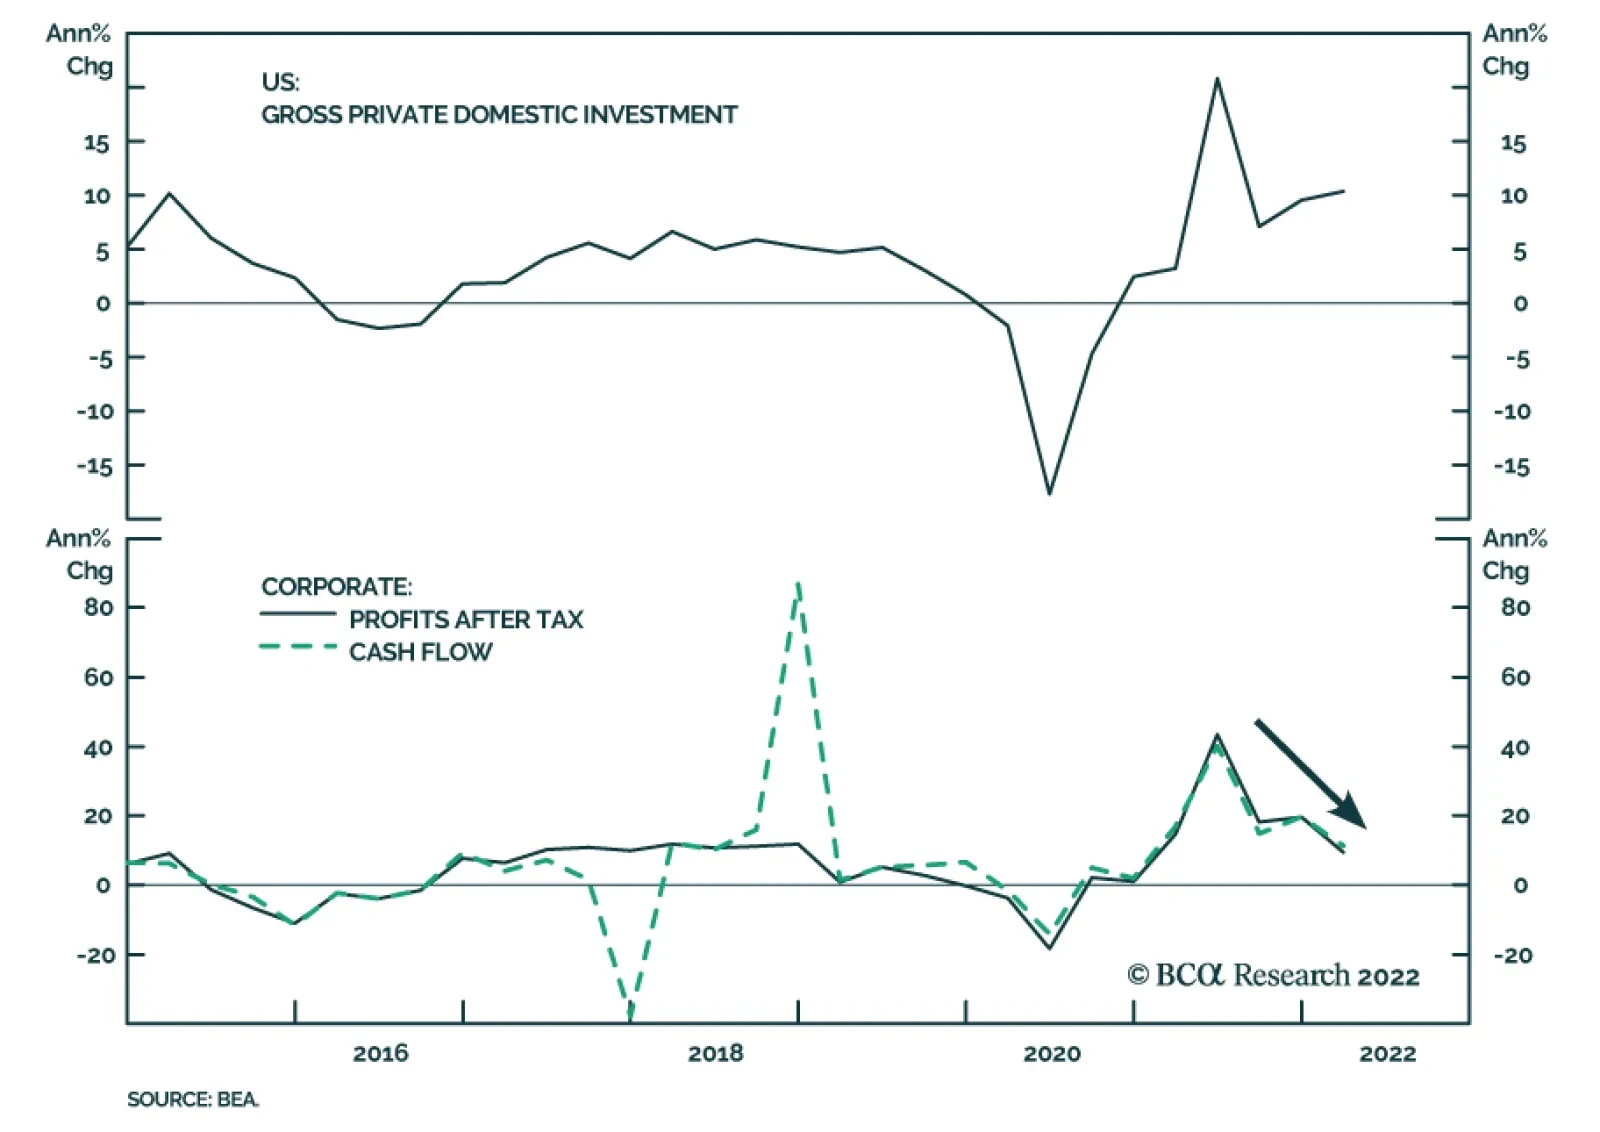
Economic growth is slowing, and more negative surprises are in store. Earnings Growth Expectation Have Gotta Come Down While the stock market is not the economy, they are closely intertwined. One of the key differences between the two, however, is that the US economy is dominated by services, while the S&P 500 has higher exposure to goods. With the current demand for services outstripping demand for goods, the economy should fare better than the market (Chart 11). Therefore, it does not bode well for S&P 500 earnings expectations that the Q1-2022 GDP revision flagged earnings contracting 2.3% on a quarter-on-quarter basis, under the weight of slowing sales and rising costs. And while the S&P 500 Q1-22 results were just fine, the ratio of negative/positive guidance for Q2-22 was roughly two to one. Slowing growth at home and abroad, rising costs of raw materials and wages, as well as fading demand for goods will weigh on earnings over the balance of the year (Chart 12). Chart 11Slowing Growth Will Weigh On Earnings
Slowing Growth Will Weigh On Earnings
Slowing Growth Will Weigh On Earnings
Chart 12US EPS Expectations Have Not Yet Been Downgraded
US EPS Expectations Have Not Yet Been Downgraded
US EPS Expectations Have Not Yet Been Downgraded
Also, there is the not-so-small issue of a strong dollar, which has gained nearly 13% since January 2021. This makes US goods more expensive and also reduces companies’ bottom lines via the currency translation effect. According to our rough estimates, every percentage change in the USD reduces earnings growth by roughly 33 bps, i.e., 4.3% off earnings caused by the entire dollar move. We expect slower top-line growth and shrinking profit margins to translate into flat to negative real earnings growth over the next 12 months. Importantly, US economic growth does not need to contract for a profit recession to take hold. However, S&P 500 EPS expectations have not yet been downgraded and 12-month forward EPS growth expectations are at about 10%; despite the recent market rout, US stocks have not yet priced in negative profit growth. However, either downgrades or earnings disappointments are coming, neither of which bodes well for US equity performance. Earnings growth expectations need to come down to reflect reality on the ground. Valuations Are Only Optically Cheap And one more salient point: If earnings expectations are set to unrealistically high levels, then the recent forward multiple of the S&P 500 is not 17x, but 2 to 3 points higher, and, voilà, US equities no longer look cheap. Will US Consumers Save The Day? Perhaps things are not as dire as we describe. After all, US consumers are healthy, their balance sheets are pristine, and retail sales look good. There is also the not-so-small issue of $2.2 trillion in excess savings. This argument rings true. Chart 13Negative Real Wage Growth Is Sapping Consumer Confidence
Negative Real Wage Growth Is Sapping Consumer Confidence
Negative Real Wage Growth Is Sapping Consumer Confidence
However, inflation continues to put pressure on US consumers. Negative real wage growth is sapping their confidence (Chart 13) and is cutting into their purchasing power. Soaring inflation also makes people concerned about the future as they watch their life savings melt away. Underwhelming reports from Walmart and Target are cases in point: Lower-income consumers are shifting spending away from discretionary items and towards necessities. Strong reports from Dollar General and Family Dollar indicate that many Americans are price sensitive and are shopping around. Home Depot commented that fewer customers walked through its doors (but the ones that did, tended to spend more in nominal terms). And retail sales are reported in nominal terms: Rising prices inflate growth rates. Indeed, excess savings may help achieve the “soft landing.” However, there are early signs that either many lower-income Americans have spent the money, or their savings accounts are earmarked for a rainy day, and many people aim to spend only what they earn. However, higher-income Americans are still willing to spend, but this group is shifting spending away from goods and towards services, which is consistent with strong results from the US airline carriers, which report a significant gain in pricing power. A similar message came from both Nordstrom and Macy’s. Clearly, American consumers are highly heterogeneous, and there is a significant bifurcation between “haves” and “have nots.” It is, however, concerning that many of the wealthier Americans have lost a significant percentage of their nest eggs in the stock market. The theory goes that the wealth effect is one of the main mechanisms through which monetary tightening affects consumer demand (Chart 14). It stands to reason that it is only a matter of time (unless the stock market rebounds) before even the wealthier cohorts start tightening their belts, dampening demand for consumer services. Chart 14Nest Eggs Are Dwindling
Nest Eggs Are Dwindling
Nest Eggs Are Dwindling
Another obvious implication is the effect of dwindling investments on the housing market: Americans are watching their down payments disappear, with cash buyers subject to the same negative forces. The US consumer is under duress, and the more embedded the inflation and the deeper the market rout, the greater proportion of the US population is affected, making them less and less likely to lend a “spending hand” to support economic growth. Inflation Will Turn: Too Little, Too Late One may also argue that inflation will turn, which would help both the economy and the markets, and will reset the Fed trajectory. Inflation will come down assisted by the arithmetic of the base effect. Supply chain bottlenecks are clearing, shipping costs are coming down, and demand is weakening – all of these developments point to inflation coming down over the next few months. However, this process may be rather slow: Inflation permeates the entire economy (Chart 15), and there are also signs that a vicious wage-price spiral is taking hold (Chart 16). Therefore, inflation is unlikely to revert to levels that the Fed and the US consumer will consider acceptable any time soon. Chart 15Inflation Is Broad-based And It Will Take Time For It To Revert To Acceptable Levels
Inflation Is Broad-based And It Will Take Time For It To Revert To Acceptable Levels
Inflation Is Broad-based And It Will Take Time For It To Revert To Acceptable Levels
Chart 16Wage-Price Spiral Is Taking Hold
Wage-Price Spiral Is Taking Hold
Wage-Price Spiral Is Taking Hold
Just recently, Fed Chairman Jerome Powell reiterated the Fed’s commitment to hiking interest rates until core consumer price inflation gets closer to 2%. Notably, in his speech at a WSJ event on May 17, Powell noted: “This is not a time for tremendously nuanced readings of inflation… We need to see inflation coming down in a convincing way. Until we do, we’ll keep going.” Given that US core consumer price inflation is currently at around 6.2%, a mere rollover in core inflation from current levels will not be enough for the Fed to tone down its hawkishness. While we believe that the Fed will be steadfast in its objective to combat inflation, any positive news on inflation will be perceived by a hopeful market as a sign that the Fed may alter its course, which would lead to a rally, only to be punctured by the negative news from either growth or the Fed. Positive inflation surprises will ignite powerful rallies but are unlikely to alter the trajectory of monetary policy. The Fed “Put” Is No More The Fed “put” is no longer at play as the Fed has signaled that it cares far more about combating inflation than the performance of the stock market. In fact, falling equities will play into Powell’s hand as a negative wealth effect is likely to put a lid on inflationary pressures, with the wealthier Americans paying the toll. When Bad News Is Good News We make a case that disappointing growth will be the next chapter of this market saga. One might wonder if poor growth readings would actually be perceived by the market as a positive: Not only does disappointing growth put downward pressure on Treasury yields but also creates an expectation that the Fed will pause and monetary policy will end up looser than initially projected. Our take is that stable or lower rates will offer support for equities, and that is the reason why we conclude that the first stage of the repricing is complete. Will slower growth invite a more gentle and considerate Fed? We don’t think so as the Fed has already telegraphed that it now aims for a “softish landing” and that fighting inflation will incur some “pain”. Investment Implications Chart 17In 1980-82, The Market Was "Fat And Flat"
In 1980-82, The Market Was "Fat And Flat"
In 1980-82, The Market Was "Fat And Flat"
We expect the market to be “fat and flat” over the next few months, i.e., alternating between pullbacks and short-term rallies. Rallies are frequent during bear markets and other severe corrections and are generally significant in magnitude. Markets showed a similar pattern in 1980-1982 as Chairman Volker was battling inflation (Chart 17). The bull market took hold only in 1982. Rallies will follow pullbacks because the market is not yet ready for a sustainable rebound. This first leg of the correction was pricing in tighter monetary policy. The next leg down will be the market pricing in slowing growth both at home and abroad, corporate earnings disappointments, and weakening consumer demand. Over the next few months, the market is likely to trend down but in a “fat and flat” manner, with “growth disappointment” equity sell-off being punctuated by fast and furious rallies on hopes that inflation is abating, and that a gentler, data-driven Fed would be more supportive of the economy and the markets. Thus, with markets looking oversold, a short-lived rally is now likely. It will be accompanied by a change in leadership: Energy and Materials will give back gains, while Big Tech and other cyclicals will bounce. And US equities may still plumb new lows on the back of economic growth or earnings growth disappointments. The market will also not take it kindly if inflation turns out to be stickier than expected and is accompanied by slowing growth: Stagflation is one of the most challenging regimes for US equities (Chart 18). Sticky inflation would call for an even more aggressive rate hiking cycle. Chart 18Stagflation Would Be The Worst Possible Outcome For The Markets
What Is Next For US Equities? They Will Be Fat And Flat
What Is Next For US Equities? They Will Be Fat And Flat
Table 1Equities Are Closer To Capitulation
What Is Next For US Equities? They Will Be Fat And Flat
What Is Next For US Equities? They Will Be Fat And Flat
We believe that a sustainable rebound will take place once most of the negative “news” is priced in. Compared to two months ago, we conclude that the first part of the adjustment process, i.e., pricing in tighter monetary policy, has run its course. Now it is a matter of adjusting growth expectations. Our “Equities Capitulation” scorecard (“Have We Hit Rock Bottom” report), adds up to -1, a slightly less negative reading than the -2 just a few weeks ago — but a reading which still signals negative equity returns (Table 1). We conclude that staying close to the benchmark, with a small tilt towards defensive growth, remains the most sensible strategy. Bottom Line The first stage of the market correction is probably complete and tighter monetary policy is getting priced in. The next leg down for equities will be pricing in slower economic growth and a potential earnings recession. We expect the market to be “fat and flat” over the next several months as rallies ignited by soothing inflation readings are punctured by growth disappointments and a resolute Fed. Irene Tunkel Chief Strategist, US Equity Strategy irene.tunkel@bcaresearch.com Recommended Allocation Recommended Allocation: Addendum
What Is Next For US Equities? They Will Be Fat And Flat
What Is Next For US Equities? They Will Be Fat And Flat
Data released on Friday about the state of US consumers were mixed. On the one hand, the already dismal University of Michigan consumer sentiment index was revised lower in May to 58.4 from a preliminary estimate of 59.1. However, US personal spending…
The pandemic pushed a significant number of workers out of the labor force. Back in January, the US Census Bureau’s Household Pulse Survey reported that a record 8.7 million employees were absent from work because they were sick or looking after someone with…
American consumers’ 1-year ahead inflation expectations were revised slightly lower in the final release of the May University of Michigan Consumer Sentiment survey. The median estimate is now 5.3% y/y, down from 5.4% in April, marking the first decline this…
BCA Research’s Global Investment Strategy service concludes that US financial conditions have tightened by enough that the Fed no longer needs to talk up interest rate expectations. Like many central banks, the Fed sees financial conditions as a key driver…
Listen to a short summary of this report. Executive Summary US Financial Conditions Have Tightened Significantly This Year
US Financial Conditions Have Tightened Significantly This Year
US Financial Conditions Have Tightened Significantly This Year
US financial conditions have tightened by enough that the Fed no longer needs to talk up interest rate expectations. If inflation decelerates faster than anticipated over the coming months, as we expect will be the case, the Fed’s messaging will soften further. Bond yields in the US and abroad are likely to fall over the next 6-to-12 months, even if they do rise over a longer-term horizon. Stay overweight stocks, favoring non-US equities over their US peers. We are closing our short 10-year Gilts trade, initiated at a yield of 0.85%, for a gain of 7.5%. We are also opening a new trade going long Canadian short-term interest rate futures versus their US counterparts. Investors expect Canadian rates to exceed US rates in 2024, which seems unlikely to us given that the Canadian housing market is much more sensitive to higher rates than the US market. Bottom Line: After having tightened significantly over the past seven months, financial conditions should loosen modestly during the remainder of the year. This should benefit risk assets. Fed Focused on Financial Conditions Chart 1Tighter Financial Conditions Will Hurt Growth
Tighter Financial Conditions Will Hurt Growth
Tighter Financial Conditions Will Hurt Growth
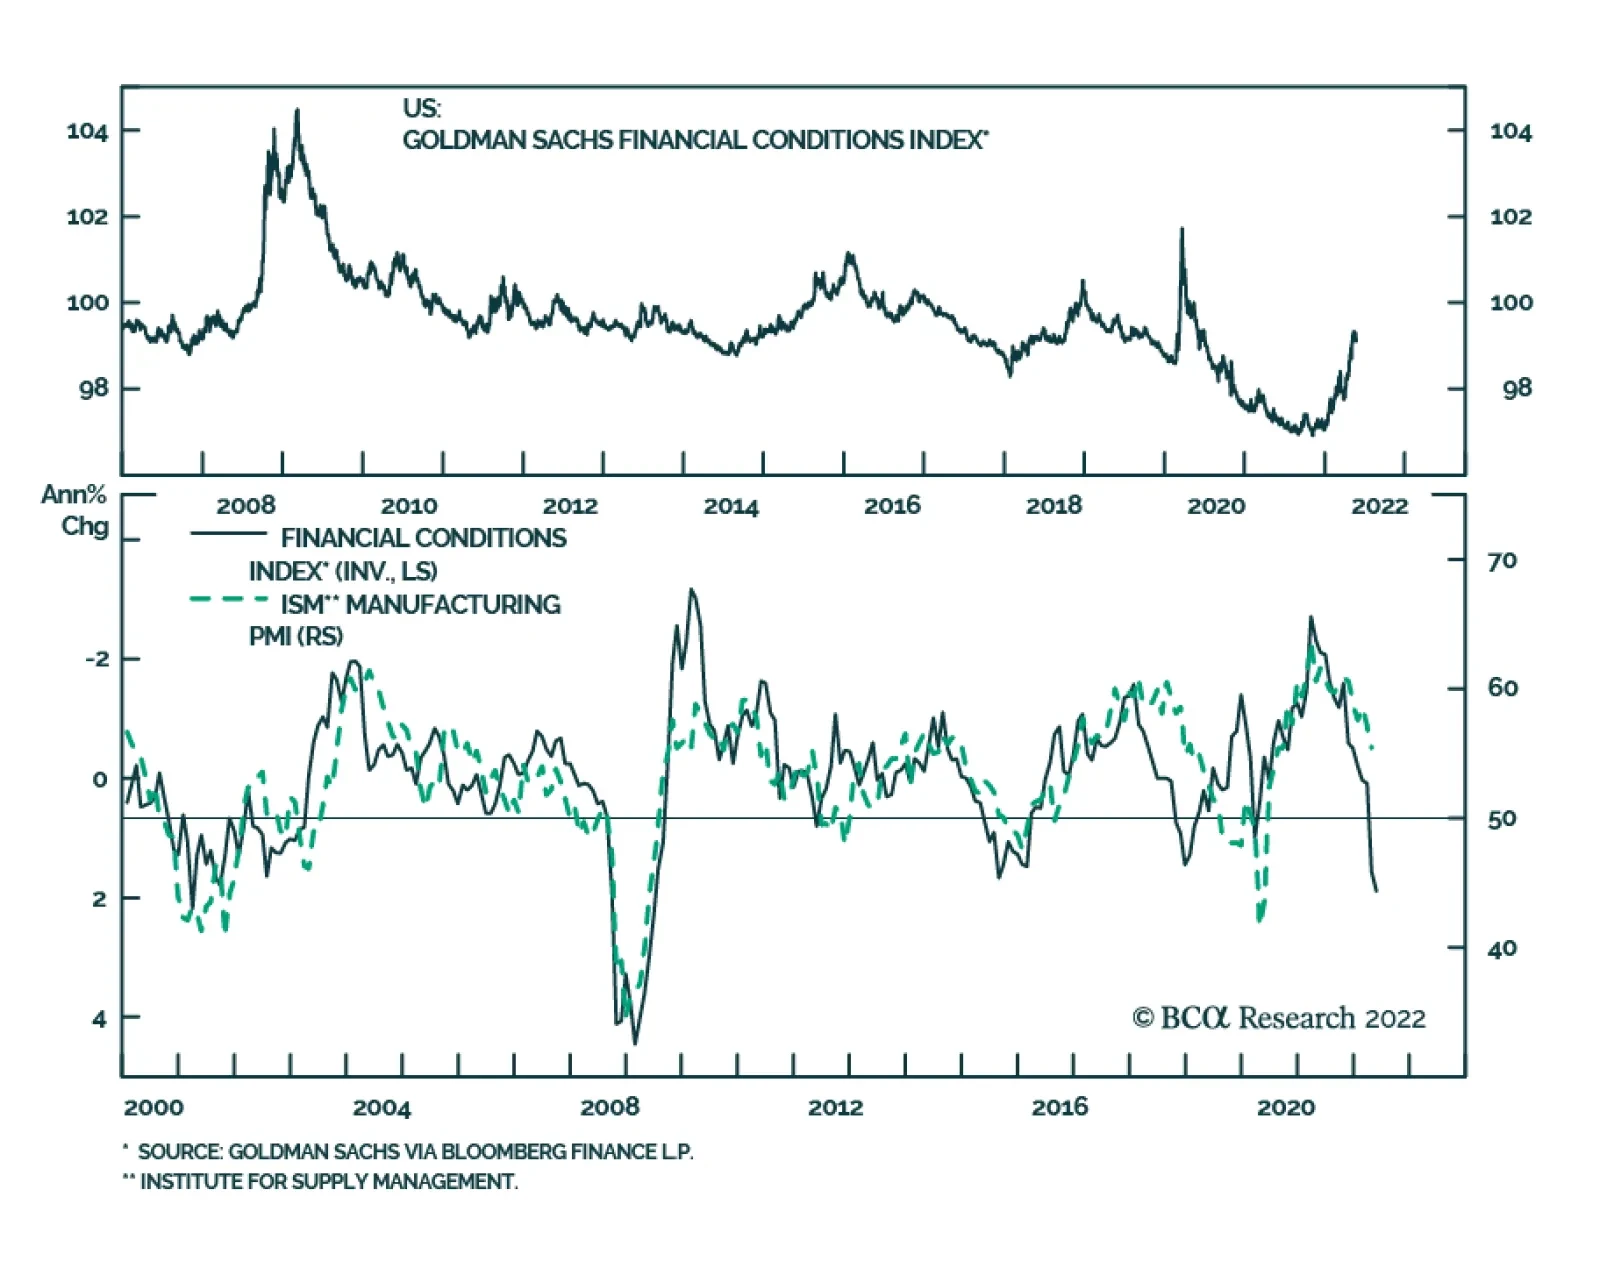
Like many central banks, the Fed sees financial conditions as a key driver of the real economy. While there are many financial conditions indices (FCIs), most include bond yields, credit spreads, equity prices, and the exchange rate as inputs. Higher bond yields, wider credit spreads, lower equity prices, and a strong currency all lead to tighter financial conditions and a weaker economy, and vice versa. Goldman’s US FCI is especially popular among market participants. It is calibrated so that 100 bps in tightening corresponds, all things equal, to a 100 basis-point decline in US real GDP growth over the subsequent four quarters. The Goldman FCI has tightened by 212 bps since the start of the year and by 225 points from its loosest level in November 2021. If the historic relationship between the FCI and the economy holds, the tightening in financial conditions would be enough to push US growth to a below-trend pace by the second quarter of 2023. In fact, the tightening in the Goldman FCI over the past 12 months already suggests that the manufacturing ISM will fall below 50 (Chart 1). Along the same lines, the Chicago Fed’s Adjusted National FCI, which measures financial conditions relative to current economic conditions, has moved slightly into restrictive territory. Aside from a brief period at the outset of the pandemic, the index has been consistently in expansionary territory since early 2013 (Chart 2). Chart 2The Chicago Fed Financial Conditions Index Has Moved Into Slightly Restrictive Territory
Are Financial Conditions Tight Enough?
Are Financial Conditions Tight Enough?
Other data are consistent with the message from the FCIs. Most notably, growth estimates for the US and for other major economies have come down over the past few months (Chart 3). Economic surprise indices have also fallen, especially in the US. Chart 3AGrowth Forecasts Have Softened As Economic Data Have Surprised To The Downside (I)
Growth Forecasts Have Softened As Economic Data Have Surprised To The Downside (I)
Growth Forecasts Have Softened As Economic Data Have Surprised To The Downside (I)
Chart 3BGrowth Forecasts Have Softened As Economic Data Have Surprised To The Downside (II)
Growth Forecasts Have Softened As Economic Data Have Surprised To The Downside (II)
Growth Forecasts Have Softened As Economic Data Have Surprised To The Downside (II)
Mission Accomplished? Chart 4The Fed Expects To Lift Rates Above Its Estimate Of Neutral
The Fed Expects To Lift Rates Above Its Estimate Of Neutral
The Fed Expects To Lift Rates Above Its Estimate Of Neutral
Given the recent tightening in financial conditions and weaker growth expectations, the Fed is likely to soften its tone. Already this week, Atlanta Fed President Raphael Bostic suggested that the Fed could pause raising rates in September in order to assess the impact of the Fed’s tightening campaign. The Fed minutes also conveyed a sense of flexibility and data-dependence about the timing and magnitude of future hikes once rates reach 2%. It’s worth stressing that the Fed expects rates to rise in 2023 to about 40 bps above its estimate of the terminal rate (Chart 4). Jawboning rate expectations higher would potentially undermine the Fed’s goal of achieving a soft landing for the economy. Inflation Will Dictate How Much Easing Lies Ahead There is a big difference between not wanting financial conditions to tighten further and wanting them to loosen. The Fed would only want to see an easing in financial conditions if inflation were to fall faster than expected. Chart 5 shows how the year-over-year change in the core PCE deflator would evolve over the remainder of the year depending on different assumptions about the month-over-month change in the deflator. The Fed would be able to reach its expectation of year-over-year core PCE inflation of 4.1% for end-2022 if the month-over-month change averages 0.33%. Monthly core PCE inflation averaged 0.3% in February and March and is expected to clock in at around the same level for April once the data is released tomorrow. Chart 5AUS Inflation Will Fall By More Than The Fed Expects If The Monthly Change In Core PCE Is Less Than 0.3% (I)
US Inflation Will Fall By More Than The Fed Expects If The Monthly Change In Core PCE Is Less Than 0.3% (I)
US Inflation Will Fall By More Than The Fed Expects If The Monthly Change In Core PCE Is Less Than 0.3% (I)
Chart 5BUS Inflation Will Fall By More Than The Fed Expects If The Monthly Change In Core PCE Is Less Than 0.3% (II)
US Inflation Will Fall By More Than The Fed Expects If The Monthly Change In Core PCE Is Less Than 0.3% (II)
US Inflation Will Fall By More Than The Fed Expects If The Monthly Change In Core PCE Is Less Than 0.3% (II)
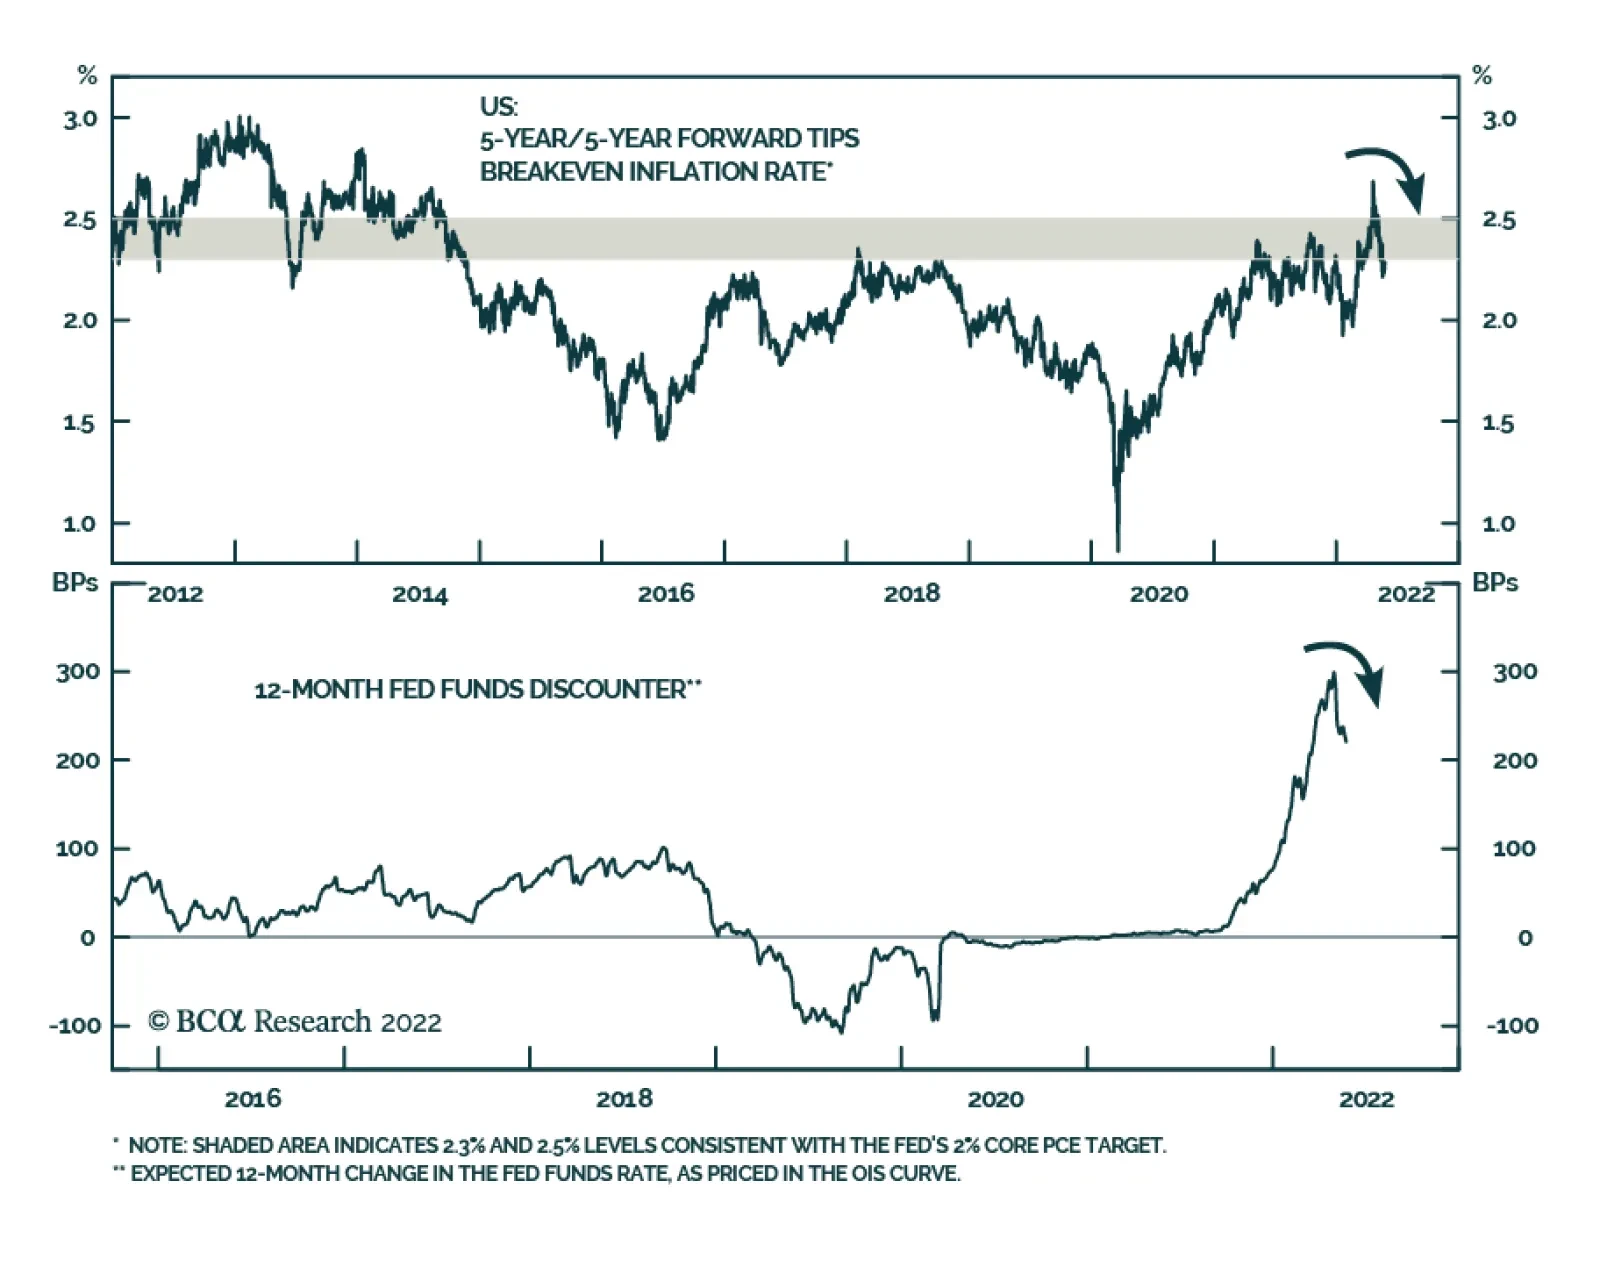
Regardless of tomorrow’s data print, as we discussed last week, we expect the monthly inflation rate to average less than 0.3 in the back half of the year. If that happens, inflation will surprise to the downside relative to the Fed’s expectations. Consistent with the observation above, market-based inflation expectations have already declined. The 5-year TIPS inflation breakeven has fallen from 3.64% in March to 2.98% at present. The widely watched 5-year/5-year forward breakeven rate is back down to 2.29%, at the bottom of the Fed’s comfort zone of 2.3%-to-2.5% (Chart 6).1 The Citi US Inflation Surprise Index has also rolled over (Chart 7). Chart 6Market-Based Inflation Expectations Have Come Down Of Late
Market-Based Inflation Expectations Have Come Down Of Late
Market-Based Inflation Expectations Have Come Down Of Late
Chart 7The US Inflation Surprise Index Has Rolled Over
The US Inflation Surprise Index Has Rolled Over
The US Inflation Surprise Index Has Rolled Over
Financial Conditions Abroad Financial conditions indices in the other major developed economies have tightened somewhat less than in the US because equities represent a smaller share of household net worth abroad and also because most currencies have weakened against the US dollar (Chart 8). Nevertheless, with growth momentum having already deteriorated sharply, central banks are signaling a more balanced approach towards policy normalization. Chart 8Financial Conditions Have Tightened More In The US Than Elsewhere This Year
Are Financial Conditions Tight Enough?
Are Financial Conditions Tight Enough?
ECB: Wait and See? In a blog post published on Monday, Christine Lagarde observed that inflation expectations have risen from pre-pandemic levels, implying that real policy rates are currently lower than they were two years ago. In her mind, this warrants ending net purchases under the Asset Purchase Programme early in the third quarter. It also warrants raising the deposit rate by 25 bps at both the July and September meetings, bringing it back to zero from -0.5% at present. Beyond then, Lagarde was circumspect about what should be done, stressing the need for “gradualism, optionality and flexibility.” She noted that “The euro area is clearly not facing a typical situation of excess aggregate demand or economic overheating … Both consumption and investment remain below their pre-crisis levels, and even further below their pre-crisis trends.” She then added: “The outlook is now being clouded by the negative supply shocks hitting the economy … households’ expectations of their future financial situation dropped to their second-lowest level on record in March and remained close to that level in April.” The market expects the ECB to raise rates by 170 bps over the next 12 months, bringing the deposit rate to 1.2% by mid-2023 (Chart 9). BCA’s Global Fixed Income team, led by Rob Robis, foresees only 50 bps of tightening over the next 12 months. Chart 9Markets Expect Rates To Rise The Most In The Anglo-Saxon World
Are Financial Conditions Tight Enough?
Are Financial Conditions Tight Enough?
The UK, Canada, and Australia: Frothy Housing Markets Will Limit Rate Hikes The Bank of England (BoE) hiked rates by 90 bps over the past 12 months. The UK OIS curve is priced for another 140 bps of rate hikes over the next year. According to the BoE’s forecasting models, this would raise the unemployment rate by two percentage points while lowering inflation to below 2% within the next two-to-three years. In our opinion, that is more tightening than the BoE would like to see. BCA’s strategists expect the BoE to deliver only another 75 bps of hikes over the next year. Chart 10Buildup In Leverage And Frothy Housing Markets Pose A Challenge To Monetary Policy In Some Developed Market Countries
Buildup In Leverage And Frothy Housing Markets Pose A Challenge To Monetary Policy In Some Developed Market Countries
Buildup In Leverage And Frothy Housing Markets Pose A Challenge To Monetary Policy In Some Developed Market Countries
The Canadian economy has been quite strong, with the unemployment rate falling to 5.2% in April, the lowest since 1974. The Canadian OIS curve is discounting 195 bps of interest rate hikes over the next 12 months, substantially more than the 150 bps of tightening our fixed income team foresees. By mid-2024, investors expect Canadian policy rates to be about 25 bps above US rates. This seems unreasonable to us, and as of this week, we are expressing this view by going long the June 2024 3-month Canadian Bankers’ Acceptance (BAX) futures contract (BAM4) versus the corresponding 3-month US SOFR futures contract (SFRM4). A more liquid option is to simply go long the 10-year Canadian government bond versus the 10-year US Treasury note. At present, Canadian 10-year government bonds are yielding 5 bps more than their US counterparts. Unlike in the US, where household debt has fallen over the past 14 years, debt in Canada has risen, fueled by a massive housing boom (Chart 10). High indebtedness and the prevalence of variable rate/short-term fixed-rate mortgages will limit the ability of the BoC to raise rates. The Australian OIS curve is currently discounting 262 bps of rate hikes over the next year which, if realized, would take the cash rate to 3.3% – a level last seen in 2013 when the neutral rate in Australia was much higher by the RBA’s own reckoning. BCA’s fixed income strategists expect only 150 bps of tightening over the next 12 months. Japan: Yield Curve Control Will Continue Chart 11Japan: Long-Term Inflation Expectations Are Far Lower Than In The Rest Of The World
Japan: Long-Term Inflation Expectations Are Far Lower Than In The Rest Of The World
Japan: Long-Term Inflation Expectations Are Far Lower Than In The Rest Of The World
The Bank of Japan expects inflation excluding fresh food prices to remain at about 2% in the second half of 2022, but then to slow to 1.1% in the fiscal year starting April 2023. The Japan OIS curve is discounting almost no tightening over the next 12 months. Long-term inflation expectations are far lower in Japan than in any other major economy, which makes ultra-low rates a necessity for the foreseeable future (Chart 11). China: Outright Easing Chart 12Covid Restrictions Have Eased Only Modestly In China
Are Financial Conditions Tight Enough?
Are Financial Conditions Tight Enough?
China faces a trifecta of problems: A weakening housing market; slowing external demand for manufactured goods; and the ongoing threat of Covid-related lockdowns. Despite a steep drop in the number of new Covid cases over the past month, China’s lockdown index has only eased modestly, as the authorities continue to fret about the next outbreak (Chart 12). The leadership in Beijing has responded with policy easing. The PBoC lowered the 5-year loan prime rate by 15 bps last week, the largest such cut since 2019. This followed a cut in the floor rate for first-home mortgages that was announced on May 15. BCA’s China strategists believe these measures will arrest the deep contraction in the property market but will not spark a full-blown recovery due to the ongoing commitment of the government to the “three red lines” policy.2 In normal times, a Chinese real estate slump would be a cause of grave concern for global investors. These are not normal times, however. Public enemy number one these days is inflation. A weaker Chinese property market would curb commodity demand, thus helping to cool inflation. That would be a welcome development for global investors. Investment Conclusions Global financial conditions have tightened to the point that betting on ever-higher rates, at least for the next 12 months, no longer makes sense. If global inflation decelerates faster than anticipated during the remainder of the year, as we expect will be the case, central banks will dial back the hawkish rhetoric. We took partial profits on our short 10-year Treasury trade earlier this month (initiated at a yield of 1.45%). As of this week, consistent with the earlier decision of BCA’s fixed income strategists to upgrade UK Gilts, we are closing our short 10-year Gilt position (initiated at a yield of 0.85%) for a gain of 7.5%. The coming Goldilocks environment of falling inflation and supply-side led growth will buttress equities. We expect global stocks to rise 15%-to-20% over the next 12 months, with non-US markets outperforming the US. Looking further out, the fate of Goldilocks will rest on where the neutral rate of interest resides. If the neutral rate in the US turns out to be substantially lower than 2.5%, then any growth recovery will falter as the lagged effects of restrictive monetary policy work their way through the economy. Conversely, if the neutral rate turns out to be substantially higher than 2.5%, then inflation will reaccelerate as the economy overheats. Given the choice, we would wager on the latter outcome. Thus, while we expect global bond yields to decline over a 12-month horizon, we foresee them rising over a 2-to-5-year time frame. Similarly, while stocks will strengthen over the next 12 months, they are likely to encounter another bout of turbulence starting late next year or in 2024 as central banks initiate a second round of rate hikes. Peter Berezin Chief Global Strategist peterb@bcaresearch.com Follow me on LinkedIn Twitter Footnotes 1 The Federal Reserve targets an average inflation rate of 2% for the Personal Consumption Expenditures (PCE) index. The TIPS breakeven is based on the CPI index. Due to compositional differences between the two indices, CPI inflation has historically averaged 30-to-50 basis points higher than PCE inflation. This is why the Fed effectively targets a CPI inflation rate of 2.3%-to-2.5%. 2 The People’s Bank of China and the housing ministry issued a deleveraging framework for property developers in August 2020, consisting of a 70% ceiling on liabilities-to-assets, a net debt-to-equity ratio capped at 100%, and a limit on short-term borrowing that cannot exceed cash reserves. Developers breaching these “red lines” run the risk of being cut off from access to new loans from banks, while those who respect them can only increase their interest-bearing borrowing by 15% at most. Global Investment Strategy View Matrix
Are Financial Conditions Tight Enough?
Are Financial Conditions Tight Enough?
Special Trade Recommendations Current MacroQuant Model Scores
Are Financial Conditions Tight Enough?
Are Financial Conditions Tight Enough?
The US GDP declined at a 1.5% annual pace, a downward revision to the previous estimate of 1.4%. Consumption spending grew at 3.1% on an annual basis – stronger than the previously reported 2.7% and the Q4 2021 pace of 2.5%. Both goods and services…
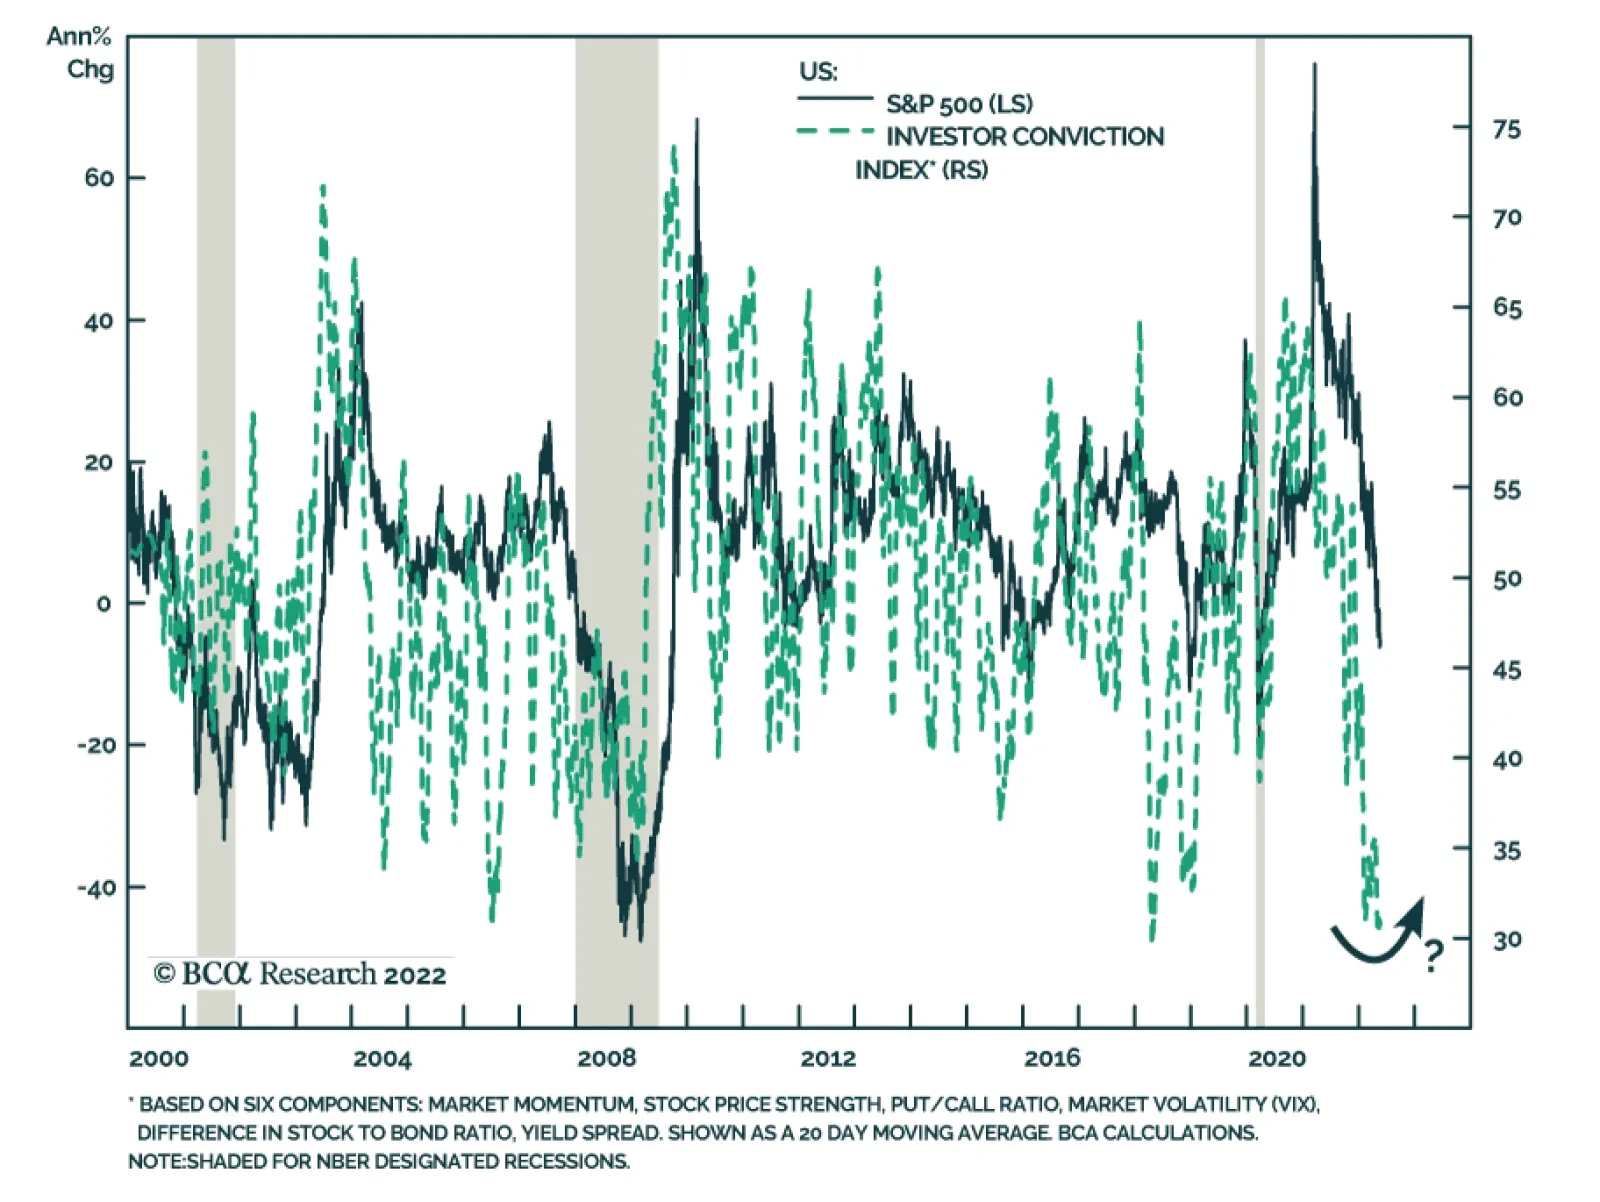
Market-based measures of investor confidence have deteriorated sharply this year. The VIX has trended higher, high-yield bond spreads have widened, and equity momentum is deteriorating. Our Investor Conviction Index – which aggregates six components to…