Developed Countries
As expected, the Bank of Canada raised its key overnight interest rate by 50bps to 1.5% on Wednesday, its second consecutive half-point hike. The post-meeting statement highlighted that at 6.8% in April, CPI inflation exceeds the central bank’s forecast.…
According to BCA Research’s Global Asset Allocation service, the jury is out on the probability of a recession – and is likely to stay out for a while. Global equities will probably move sideways, with significant volatility. Equity markets – with US…

Executive Summary EU Embargoes Russian Oil
Energy Cutoff Continues (GeoRisk Update)
Energy Cutoff Continues (GeoRisk Update)
The EU imposed an embargo on 90% of Russian oil imports, which will provoke retaliation. Russia will squeeze Europe’s economy ahead of critical negotiations over the coming 6-12 months. Russian gains on the battlefield in Ukraine point to a ceasefire later, but not yet – and Russia will need to retaliate against NATO enlargement. The Middle East and North Africa face instability and oil disruptions due to US-Iran tensions and Russian interference. China’s autocratic shift is occurring amid an economic slowdown and pandemic. Social unrest and internal tensions will flare. China will export uncertainty and stagflation. Inflation is causing disparate effects in South Asia – instability in Pakistan and Sri Lanka, and fiscal populism in India. Asset Initiation Date Return Long Brazilian Financials / Indian Equities (Closed) Feb 10/22 22.5% Bottom Line: Markets still face three geopolitical hurdles: Russian retaliation; Middle Eastern instability; Chinese uncertainty. Feature Global equities bounced back 6.1% from their trough on May 12 as investors cheered hints of weakening inflation and questioned the bearish consensus. BCA’s Global Investment Strategy correctly called the equity bounce. However, as BCA’s Geopolitical Strategy service, we see several sources of additional bad news. Throughout the Ukraine conflict we have highlighted two fundamental factors to ascertain regarding the ongoing macroeconomic impact: Will the war cut off the Russia-EU energy trade? Will the war broaden beyond Ukraine? Chart 1Russian-Exposed Assets Will Suffer More
Russian-Exposed Assets Will Suffer More
Russian-Exposed Assets Will Suffer More
In this report we update our views on these two critical questions. The takeaway is that the geopolitical outlook is still flashing red. The US dollar will remain strong and currencies exposed to Russia and geopolitical risk will remain weak (Chart 1). In addition, China’s politics will continue to produce uncertainty and negative surprises this year. Taken together, investors should remain defensive for now but be ready to turn positive when the market clears the hurdles we identify. The fate of the business cycle hangs in the balance. Energy Ties Eroding … Russia Will Retaliate Over Oil Embargo Chart 2AEU Embargoes Russian Oil
Energy Cutoff Continues (GeoRisk Update)
Energy Cutoff Continues (GeoRisk Update)
Europe is diversifying from Russian oil and natural gas. The European Union adopted a partial oil embargo on Russia that will cut oil imports by 90% by the end of 2022. It also removed Sberbank from the SWIFT banking communications network and slapped sanctions on companies that insure shipments of Russian crude. The sanctions will cut off all of Europe’s seaborne oil imports from Russia as well as major pipeline imports, except the Southern Druzhba pipeline. The EU made an exception for landlocked eastern European countries heavily dependent on Russian pipeline imports – namely Hungary, Slovakia, the Czech Republic, and Bulgaria (Chart 2A). Focus on the big picture. Germany changed its national policy to reduce Russian energy dependency for the sake of national security. From Chancellors Willy Brandt to Angela Merkel, Germany pursued energy cooperation and economic engagement as a means of lowering the risk of war with Russia. Ostpolitik worked in the Cold War, so when Russia seized Crimea in 2014, Merkel built the Nord Stream 2 pipeline. But Merkel’s policy failed to persuade Russia that economic cooperation is better than military confrontation – rather it emboldened President Putin, who viewed Europe as divided and corruptible. Chart 2BRussia Squeezes EU’s Natural Gas
Energy Cutoff Continues (GeoRisk Update)
Energy Cutoff Continues (GeoRisk Update)
Russia’s regime is insecure and feels threatened by the US and NATO. Russia believed that if it invaded Ukraine, the Europeans would maintain energy relations for the sake of preserving overall strategic stability. Instead Germany and other European states began to view Russia as irrational and aggressive and hence a threat to their long-term security. They imposed a coal ban, now an oil ban the end of this year, and a natural gas ban by the end of 2027, all formalized under the recently announced RePowerEU program. Russia retaliated by declaring it would reduce natural gas exports to the Netherlands and probably Denmark, after having already cut off Finland, Poland, and Bulgaria (Chart 2B). As a pretext Russia points to its arbitrary March demand that states pay for gas in rubles rather than in currencies written in contracts. This ruble payment scheme is being enforced on a country-by-country basis against those Russia deems “unfriendly,” i.e. those that join NATO, adopt new sanctions, provide massive assistance to Ukraine, or are otherwise adverse. Chart 3Russia Actively Cutting Gas Flows
Russia Actively Cutting Gas Flows
Russia Actively Cutting Gas Flows
Russia and Ukraine are already reducing natural gas exports through the Ukraine and Turkstream pipelines while the Yamal pipeline has been empty since May – and it is only a matter of time before flows begin to fall in the Nord Stream 1 pipeline to Germany (Chart 3). German government and industry are preparing to ration natural gas (to prioritize household needs) and revive 15 coal plants if necessary. Europe is attempting to rebuild stockpiles for the coming winter, when Russian willingness and capability to squeeze natural gas flows will reach a peak. The big picture is demonstrated by game theory in Diagram 1. The optimal situation for both Russia and the EU is to maintain energy exports for as long as possible, so that Russia has revenues to wage its war and Europe avoids a recession while transitioning away from Russian supplies (bottom right quadrant, each side receives four points). The problem is that this solution is not an equilibrium because either side can suffer a sudden shock if the other side betrays the tacit agreement and stops buying or selling (bottom left and top right quadrants). Diagram 1EU-Russia Standoff: What Does Game Theory Say?
Energy Cutoff Continues (GeoRisk Update)
Energy Cutoff Continues (GeoRisk Update)
The equilibrium – the decision sets in which both Russia and the EU are guaranteed to lose the least – is a situation in which both states reduce energy trade immediately. Europe needs to cut off the revenues that fuel the Russian war machine while Russia needs to punish and deter Europe now while it still has massive energy leverage (top left quadrant, circled). Once Europe diversifies away, Russia loses its leverage. If Europe does not diversify immediately, Russia can punish it severely by cutting off energy before it is prepared. Russian energy weaponization is especially useful ahead of any ceasefire talks in Ukraine. Russia aims for Ukrainian military neutrality and a permanently weakened Ukrainian state. To that end it is seizing territory for the Luhansk and Donetsk People’s Republics, seizing the southern coastline and strategic buffer around Crimea, and controlling the mouth of the Dnieper river so that Ukraine is forever hobbled (Map 1). Once it achieves these aims it will want to settle a ceasefire that legitimizes its conquests. But Ukraine will wish to continue the fight. Map 1Russian Invasion Of Ukraine, 2022
Energy Cutoff Continues (GeoRisk Update)
Energy Cutoff Continues (GeoRisk Update)
Russia will need leverage over Europe to convince the EU to lean on Ukraine to agree to a ceasefire. Something similar occurred in 2014-15 when Russia collaborated with Germany and France to foist the Minsk Protocols onto Ukraine. If Russia keeps energy flowing to EU, the EU not only gets a smooth energy transition away from Russia but also gets to keep assisting Ukraine’s military effort. Whereas if Russia imposes pain on the EU ahead of ceasefire talks, the EU has greater interest in settling a ceasefire. Finally, given Russia’s difficulties on the battlefield, its loss of European patronage, and potential NATO enlargement on its borders, Moscow is highly likely to open a “new front” in its conflict with the West. Josef Stalin, for example, encouraged Kim Il Sung to invade South Korea in 1950. Today Russia’s options lie in the Middle East and North Africa – the regions where Europe turns for energy alternatives. Not only Libya and Algeria – which are both inherently fertile ground for Russia to sow instability – but also Iran and the broader Middle East, where a tenuous geopolitical balance is already eroding due to a lack of strategic understanding between the US and Iran. Russia’s capabilities are limited but it likely retains enough influence to ignite existing powder kegs in these areas. Bottom Line: Investors still face a few hurdles from the Ukraine war. First, the EU’s expanding energy embargo and Russian retaliation. Second, instability in the Middle East and North Africa. Hence energy price pressures will remain elevated in the short term and kill more demand, thus pushing the EU and the rest of the world toward stagflation or even recession. War Contained To Ukraine So Far … But Russia To Retaliate Over NATO Enlargement At present Russia is waging a full-scale assault on eastern and southern Ukraine, where about half of Donetsk awaits a decision (Map 2). If Russia emerges victorious over Donetsk in the summer or fall then it can declare victory and start negotiating a ceasefire. This timeline assumes that its economic circumstances are sufficiently straitened to prevent a campaign to the Moldovan border.1 Map 2Russia May Declare Victory If It Conquers The Rest Of Donetsk
Energy Cutoff Continues (GeoRisk Update)
Energy Cutoff Continues (GeoRisk Update)
There are still ways for the Ukraine war to spill over into neighboring areas. For example, the Black Sea is effectively a Russian lake at the moment, which prevents Ukrainian grain from reaching global markets where food prices are soaring. Eventually the western maritime powers will need to attempt to restore freedom of navigation. However, Russia is imposing a blockade on Ukraine, has more at stake there than other powers, and can take greater risks. The US and its allies will continue to provide Ukraine with targeting information against Russian ships but this assistance could eventually provoke a larger naval conflict. Separately, the US has agreed to provide Ukraine with the M142 High Mobility Artillery Rocket System (HIMARS), which could lead to attacks on Russian territory that would prompt a ferocious Russian reaction. Even assuming that the Ukraine war remains contained, Russia’s strategic conflict with the US and the West will remain unresolved and Moscow will be eager to save face. Russian retaliation will occur not only on account of European energy diversification but also on account of NATO enlargement. Finland and Sweden are attempting to join NATO and as such the West is directly repudiating the Putin regime’s chief strategic demand for 22 years. Finland shares an 830 mile border with Russia, adding insult to injury. The result will be another round of larger military tensions that go beyond Ukraine and prolong this year’s geopolitical risk and uncertainty. Russia’s initial response to Finland’s and Sweden’s joint application to NATO was to dismiss the threat they pose while drawing a new red line. Rather than forbidding NATO enlargement, Russia now demands that no NATO forces be deployed to these two states. This demand, which Putin and other officials expressed, may or may not amount to a genuine Russian policy change. Russia’s initial responses should be taken with a grain of salt because Turkey is temporarily blocking Finland’s and Sweden’s applications, so Russia has no need to respond to NATO enlargement yet. But the true test will come when and if the West satisfies Turkey’s grievances and Turkey moves to admit the new members. If enlargement becomes inevitable, Russia will respond. Russia will feel that its national security is fundamentally jeopardized by Sweden overturning two centuries of neutrality and Finland reversing the policy of “Finlandization” that went so far in preventing conflict during the Cold War. Chart 4Military Balances Stacking Up Against Russia
Energy Cutoff Continues (GeoRisk Update)
Energy Cutoff Continues (GeoRisk Update)
Russia’s military options are limited. Russia has little ability to expand the war and fight on multiple fronts judging by the army’s recent performance in Ukraine and the Red Army’s performance in the Winter War of 1939. This point can be illustrated by taking the military balance of Russia and its most immediate adversaries, which add up to about half of Russian military strength even apart from NATO (Chart 4). Russian armed forces already demonstrated some pragmatism in April by withdrawing from Kyiv and focusing on more achievable war aims. Unless President Putin turns utterly reckless and the Russian state fails to restrain him, Russia will opt for defensive measures and strategic deterrence rather than a military offensive in the Baltics. Hence Russia’s military response will come in the form of threats rather than outright belligerence. However, these threats will probably include military and nuclear actions that will raise alarm bells across Europe and the United States. President Dmitri Medvedev has already warned of the permanent deployment of nuclear missiles in the Kaliningrad exclave.2 This statement points to only the most symbolic option of a range of options that will increase deterrence and elevate the fear of war. Otherwise Russia’s retaliation will consist of squeezing global energy supply, as discussed above, including by opening a new front in the Middle East and North Africa. Instability should be expected as a way of constraining Europe and distracting America. Higher energy prices may or may not convince the EU to negotiate better terms with Russia but they will sow divisions within and among the allies. Ultimately Russia is highly unlikely to sacrifice its credibility by failing to retaliate for the combination of energy embargo and NATO enlargement on its borders. Since its military options are becoming constrained (at least its rational ones), its economic and asymmetrical options will grow in importance. The result will be additional energy supply constraints. Bottom Line: Even assuming that the war does not spread beyond Ukraine – likely but not certain – global financial markets face at least one more period of military escalation with Russia. This will likely include significant energy cutoffs and saber-rattling – even nuclear threats – over NATO enlargement. China’s Political Situation Has Not Normalized China continues to suffer from a historic confluence of internal and external political risk that will cause negative surprises for investors. Temporary improvements in government policy or investor sentiment – centered on a relaxation of “Zero Covid” lockdowns in major cities and a more dovish regulatory tone against the tech giants – will likely be frustrated, at least until after a more dovish government stance can be confirmed in the wake of the twentieth national party congress in October or November this year. At that event, Chinese President Xi Jinping is likely to clinch another ten years in power and complete the transformation of China’s governance from single-party rule to single-person rule. This reversion to autocracy will generate additional market-negative developments this year. It has already embedded a permanently higher risk premium in Chinese financial assets because it increases the odds of policy mistakes, international aggression, and ultimately succession crisis. The most successful Asian states chose to democratize and expand free markets and capitalism when they reached a similar point of economic development and faced the associated sociopolitical challenges. But China is choosing the opposite path for the sake of national security. Investors have seen the decay of Russia’s economy under Putin’s autocracy and would be remiss not to upgrade the odds of similarly negative outcomes in China over the long run as a result of Xi’s autocracy, despite the many differences between the two countries. China’s situation is more difficult than that of the democratic Asian states because of its reviving strategic rivalry with the United States. US Secretary of State Antony Blinken recently unveiled President Biden’s comprehensive China policy. He affirmed that the administration views China as the US’s top strategic competitor over the long run, despite the heightened confrontation with Russia.3 The Biden administration has not eased the Trump administration’s tariffs or punitive measures on China. It is unlikely to do so during a midterm election year when protectionist dynamics prevail – especially given that the Xi administration will be in the process of reestablishing autocracy, and possibly repressing social unrest, at the very moment Americans go to the polls. Re-engagement with China is also prohibited because China is strengthening its strategic bonds with Russia. President Biden has repeatedly implied that the US would defend Taiwan in any conflict with China. These statements are presented as gaffes or mistakes but they are in fact in keeping with historical US military actions threatening counter-attack during the three historic Taiwan Strait crises. The White House quickly walks back these comments to reassure China that the US does not support Taiwanese independence or intend to trigger a war with China. The result is that the US is using Biden’s gaffe-prone personality to reemphasize the hard edge (rather than the soft edge) of the US’s policy of “strategic ambiguity” on Taiwan. US policy is still ambiguous but ambiguity includes the possibility that a president might order military action to defend Taiwan. US attempts to increase deterrence and avoid a Ukraine scenario are threatening for China, which will view the US as altering the status quo and penalizing China for Russia’s actions. Beijing resumed overflights of Taiwan’s air defense identification zone in the wake of Biden’s remarks as well as the decision of the US to send Senator Tammy Duckworth to Taiwan to discuss deeper economic and defense ties. Consider the positioning of US aircraft carrier strike groups as an indicator of the high level of strategic tensions. On January 18, 2022, as Russia amassed military forces on the Ukrainian border – and the US and NATO rejected its strategic demands – the US had only one publicly acknowledged aircraft carrier in the Mediterranean (the USS Harry Truman) whereas it had at least five US carriers in East Asia. On February 24, the day of Russia’s invasion of Ukraine, the US had at least four of these carriers in Asia. Even today the US has at least four carriers in the Pacific compared to at least two in Europe – one of which, notably, is in the Baltics to deter Russia from attacking Finland and Sweden (Map 3). The US is warning China not to take advantage of the Ukraine war by staging a surprise attack on Taiwan. Map 3Amid Ukraine War, US Deters China From Attacking Taiwan
Energy Cutoff Continues (GeoRisk Update)
Energy Cutoff Continues (GeoRisk Update)
Of course, strategic tensions are perennial, whereas what investors are most concerned about is whether China can secure its economic recovery. The latest data are still disappointing. Credit growth continues to falter as the private sector struggles with a deteriorating demographic and macroeconomic outlook (Chart 5). The credit impulse has entered positive territory, when local government bonds are included, reflecting government stimulus efforts. But it is still negative when excluding local governments. And even the positive measure is unimpressive, having ticked back down in April (Chart 6). Chart 5Credit Growth Falters Amid Economic Transition
Credit Growth Falters Amid Economic Transition
Credit Growth Falters Amid Economic Transition
Chart 6Silver Lining: Credit Impulse Less Negative
Silver Lining: Credit Impulse Less Negative
Silver Lining: Credit Impulse Less Negative
Bottom Line: Further monetary and fiscal easing will come in China, a source of good news for global investors next year if coupled with a broader policy shift in favor of business, but the effects will be mixed this year due to Covid policy and domestic politics. Taken together with a European energy crunch and Middle Eastern oil supply disruptions, China’s stimulus is not a catalyst for a sustainable global equity market rally this year. South Asia: Inflation Hammers Sri Lanka And Pakistan Since 2020 we have argued that the global pandemic would result in a new wave of supply pressures and global social unrest. High inflation is blazing a trail of destruction in emerging markets, notably in South Asia, where per capita incomes are low and political institutions often fragile. Chart 7South Asia: Surging Inflation
Energy Cutoff Continues (GeoRisk Update)
Energy Cutoff Continues (GeoRisk Update)
Sri Lanka has been worst affected (Chart 7). Inflation surged to an eye-watering 34% in April and is expected to rise further. Surging inflation has affected Sri Lanka disproportionately because its macroeconomic and political fundamentals were weak to begin with. The tourism-dependent Sri Lankan economy suffered a body blow from terrorist attacks in 2019 and the pandemic in 2020-21. Then 2022 saw a power struggle between Sri Lanka’s President Gotabaya Rajapaksa and members of the national assembly including Prime Minister (PM) Mahinda Rajapaksa. The crisis hit a crescendo when the country defaulted on external debt obligations last month. These events weigh on Sri Lanka’s ability to transition from a long civil war (1983-2009) to a path of sustained economic development. While the political crisis has seemingly stabilized following the appointment of new Prime Minister Ranil Wickremesinghe, we remain bearish on a strategic time horizon. This is mainly because the new PM is unlikely to bring about structural solutions for Sri Lanka’s broken economy. Moreover, Sri Lanka holds more than $50 billion of foreign debt, or 62% of GDP. Another country that has been dealing with political instability alongside high inflation in South Asia is Pakistan, where inflation hit a three-year high in April (see Chart 7 above). The latest twist in Pakistan’s never-ending cycle of political uncertainty comes from the ousted Prime Minister Imran Khan. The former PM, who commands an unusual popular support group due to his fame as a cricketer prior to entering politics, is demanding fresh elections and otherwise threatening to hold mass protests. Pakistan’s new coalition government and Prime Minister Shehbaz Sharif, who came to power amid parliamentary intrigues, are refusing elections and ultimatums. From a structural perspective Pakistan is characterized by a weak economy and an unusually influential military. Now it faces high inflation and rising food prices – indeed it is one of the countries that is most dangerously exposed to the Russia-Ukraine war as it depends on these two for over 70% of its grain imports. Bottom Line: MSCI Sri Lanka has underperformed the MSCI EM index by 58.3% this year to date. Pakistan has underperformed the same index by 41.6% over the same period. Against this backdrop, we remain strategic sellers of both bourses. Instability in these countries is also one of the factors behind our strategic assessment of India as a country with a growing domestic policy consensus. South Asia: India’s Fiscal Populism And Geopolitics Inflation is less rampant in India, although still troublesome. Consumer prices nearly jumped to an 8-year high in April (see Chart 7). With a loaded state election calendar due over the next 12-18 months, the jump in inflation naturally triggered a series of mitigating policy responses. Ban On Wheat Exports: India produces 14% of the world’s wheat and 11% of grains, and exports 5% and 7%, respectively. India’s exports could make a large profit in the context of global shortages. But Prime Minister Narendra Modi is entering into the political end of the business cycle, with key state elections due that will have an impact on the ruling party’s political standing two years before the next federal election. He fears political vulnerability if exports continue amid price pressures at home. The emphasis on food security is typical but also bespeaks a lack of commitment to economic reform. Chart 8India's Real Interest Rates Fall
India's Real Interest Rates Fall
India's Real Interest Rates Fall
Surprise Rate Hikes: The Reserve Bank of India (RBI) increased the policy repo rate by 40 basis points at an unscheduled meeting on May 4, thereby implementing its first rate hike since August 2018. With real rates in India lower than those in China or Brazil (Chart 8), the RBI will be forced to expedite its planned rate hikes through 2022. Tax Cuts On Fuel: India’s central government also announced steep cuts in excise duty on fuel. This is another populist measure that reduces political pressures but fails to encourage the private sector to adjust. These measures will help rein in inflation but the rate hikes will weigh on economic growth while the tax cuts will add to India’s fiscal deficit. Indeed, India is resorting to fiscal populism with key state elections looming. Geopolitical risk is less of a concern for India – indeed the Ukraine war has strengthened its bargaining position. In the short run, India benefits from the ability to buy arms and especially cheap oil from Russia while the EU imposes an embargo. But over the long run its economy and security can be strengthened by greater interest from the US and its allies, recently highlighted by the fourth meeting of the Quadrilateral Security Dialogue (Quad) and the launch of the US’s Indo-Pacific Economic Framework (IPEF). These initiatives are modest but they highlight the US’s need to replace China with India and ASEAN over time, a trend that no US administration can reverse now because of the emerging Russo-Chinese strategic alliance. At the same time, the Quad underscores India’s maritime interests and hence the security benefits India can gain from aligning its economy and navy with the other democracies. Bottom Line: Fiscal populism in the context of high commodity prices is negative for Indian equities. However, our views on Russia, the Middle East, and China all point to a sharper short-term spike in commodity prices that ultimately drives the world economy deeper into stagflation or recession. Therefore we are booking a 22.5% profit on our tactical decision to go long Brazilian financials relative to Indian equities. Matt Gertken Chief Geopolitical Strategist mattg@bcaresearch.com Ritika Mankar, CFA Editor/Strategist ritika.mankar@bcaresearch.com Chart 9Russia: GeoRisk Indicator
Russia: GeoRisk Indicator
Russia: GeoRisk Indicator
Chart 10Other Measures Of Russian Geopolitical Risk
Other Measures Of Russian Geopolitical Risk
Other Measures Of Russian Geopolitical Risk
Chart 11China: GeoRisk Indicator
China: GeoRisk Indicator
China: GeoRisk Indicator
Chart 12United Kingdom: GeoRisk Indicator
United Kingdom: GeoRisk Indicator
United Kingdom: GeoRisk Indicator
Chart 13Germany: GeoRisk Indicator
Germany: GeoRisk Indicator
Germany: GeoRisk Indicator
Chart 14France: GeoRisk Indicator
France: GeoRisk Indicator
France: GeoRisk Indicator
Chart 15Italy: GeoRisk Indicator
Italy: GeoRisk Indicator
Italy: GeoRisk Indicator
Chart 16Canada: GeoRisk Indicator
Canada: GeoRisk Indicator
Canada: GeoRisk Indicator
Chart 17Spain: GeoRisk Indicator
Spain: GeoRisk Indicator
Spain: GeoRisk Indicator
Chart 18Australia: GeoRisk Indicator
Australia: GeoRisk Indicator
Australia: GeoRisk Indicator
Chart 19Taiwan: GeoRisk Indicator
Taiwan: GeoRisk Indicator
Taiwan: GeoRisk Indicator
Chart 20Korea: GeoRisk Indicator
Korea: GeoRisk Indicator
Korea: GeoRisk Indicator
Chart 21Turkey: GeoRisk Indicator
Turkey: GeoRisk Indicator
Turkey: GeoRisk Indicator
Chart 22South Africa: GeoRisk Indicator
South Africa: GeoRisk Indicator
South Africa: GeoRisk Indicator
Chart 23Brazil: GeoRisk Indicator
Brazil: GeoRisk Indicator
Brazil: GeoRisk Indicator
Footnotes 1 Recent diplomatic flaps between core European leaders and Ukrainian President Volodymyr Zelensky reflect Ukraine’s fear that Europe will negotiate a “separate peace” with Russia, i.e. accept Russian territorial conquests in exchange for economic relief. 2 Dmitri Medvedev explicitly states ‘there can be no more talk of any nuclear-free status for the Baltic - the balance must be restored’ in warning Finland and Sweden joining NATO. Medvedev is suggesting that nuclear weapons will be placed in this area where Russia has its Kaliningrad exclave sandwiched between Poland and Lithuania. Guy Faulconbridge, ‘Russia warns of nuclear, hypersonic deployment if Sweden and Finland join NATO’, April 14, 2022, Reuters. 3 See Antony J Blinken, Secretary of State, ‘The Administration’s Approach to the People’s Republic of China’, The George Washington University, Washington D.C., May 26, 2022, state.gov. Additionally, see President Joe Biden’s remarks on China and getting involved military to defend Taiwan in a joint press conference with Japan’s Prime Minister Kishida Fumio. ‘Remarks by President Biden and Prime Minister Kishida Fumio of Japan in Joint Press Conference’, Akasaka Palace, Tokyo, Japan, May 23, 2022, whitehouse.gov. Strategic Themes Open Tactical Positions (0-6 Months) Open Cyclical Recommendations (6-18 Months) Regional Geopolitical Risk Matrix Section III: Geopolitical Calendar
The EU agreement to embargo oil imports from Russia (see Market Focus) marks an escalation of economic warfare between Russia and the West. It raises the odds that Moscow will retaliate by incrementally cutting off its natural gas supplies to the EU. In…
On Monday, EU leaders agreed to a sixth round of sanctions on Russia which includes a partial embargo on oil imports that will take full effect by the end of the year. The ban applies to crude oil and petroleum products delivered by sea – which account for…
According to BCA Research’s Global Fixed Income Strategy & US Bond Strategy services energy bonds offer the most compelling combination of valuation and fundamental support within US investment grade. Despite the strong outperformance of high-yield…
Executive Summary European Spreads Have Cheapened Up More Than US Spreads
European Spreads Have Cheapened Up More Than US Spreads
European Spreads Have Cheapened Up More Than US Spreads
Corporate bond spreads in the US and Europe have widened since early April, with European credit taking a bigger hit because of worsening growth and inflation momentum. European corporate bond valuations look fairly cheap, both for investment grade and high-yield. This is true in absolute terms but also relative to the US, where spread valuations are more mixed. An easing of stagflation fears in Europe is a necessary condition for a valuation convergence with the US. The US investment grade credit curve is steep relative to the overall level of credit spreads, making longer-maturity corporates more attractive. Energy bonds offer the most compelling combination of valuation and fundamental support (from high oil prices) within US investment grade. Within US high-yield, Energy valuations look much less compelling after the recent outperformance. The best medium-term industry values in European credit are in investment grade Financials and high-yield Consumer Cyclicals & Non-Cyclicals. Bottom Line: Continue to favor both US high-yield and European investment grade corporates versus US investment grade. Stay neutral high-yield exposure on both sides of the Atlantic. Within Europe, stay up in quality within both investment grade and high-yield until near-term macro risks on growth & inflation subside. Feature Corporate bonds in the US and Europe have gone through a rough patch in recent weeks, underperforming government bonds in response to the “triple threat” of high inflation, tightening monetary policy and slowing growth momentum. European credit has taken the more severe hit compared to the US, with markets pricing in greater risk premia because of additional regional threats to growth (and inflation) from the Ukraine war. In this Special Report, jointly presented by BCA Research US Bond Strategy and Global Fixed Income Strategy, we assess credit spread valuations in US and European corporates after the latest selloff, across credit tiers, maturities and industry groups. Stay Cautious On US Corporate Bonds Chart 1US Credit Spreads
US Credit Spreads
US Credit Spreads
In a recent Special Report, we argued in favor of a relatively defensive allocation to US corporate bonds. Specifically, we advised investors to adopt an underweight (2 out of 5) allocation to US investment grade corporates and a neutral (3 out of 5) allocation to US high-yield. Our rationale was that a flat US Treasury curve signaled that we were in the middle-to-late stages of the economic recovery. Additionally, at the time, corporate bond spreads weren’t all that attractive compared to the average levels seen during the last Fed tightening cycle (Chart 1). Spreads have widened somewhat since we downgraded our allocation and, as such, we see some scope for spread tightening during the next few months as inflation rolls over and the Fed lifts rates by no more than what is already priced in the curve. That said, with the Fed in the midst of a tightening cycle, we think it’s unlikely that spreads can stay below average 2017-19 levels for any meaningful length of time. As a result, we maintain our current cautious allocation to US corporate bonds. US High-Yield Versus US Investment Grade The recent period of US corporate bond underperformance can be split into two stages based on the relative performance of investment grade and high-yield. US investment grade underperformed junk in the early stages of the selloff (between September and mid-March), as spread widening was driven by the Fed’s shift toward a more restrictive policy stance and not a meaningful uptick in the perceived risk of a recession and/or default wave (Chart 2A). Chart 2ACorporate Bond Excess Returns* Versus Duration-Times-Spread: September 27, 2021 To March 14, 2022
Looking For Opportunities In US & European Corporates After The Recent Selloff
Looking For Opportunities In US & European Corporates After The Recent Selloff
But recession and default fears started to ramp up in mid-March, and this caused high-yield to join the selloff (Chart 2B). In fact, US investment grade corporates managed to recoup some of their earlier losses while lower-rated junk bonds struggled to keep pace. Chart 2BCorporate Bond Excess Returns* Versus Duration-Times-Spread: March 14, 2022 To Present
Looking For Opportunities In US & European Corporates After The Recent Selloff
Looking For Opportunities In US & European Corporates After The Recent Selloff
We contend that the risk of a meaningful uptick in corporate defaults during the next 12 months is low. In fact, we estimate that the US high-yield default rate will fall to between 2.7% and 3.7% during the next year, well below the 5.2% currently priced into junk spreads. Going forward, we expect the US corporate bond landscape to be defined by increasingly restrictive monetary policy and a benign default outlook. As we noted in the aforementioned Special Report, this environment is reminiscent of the 2004-06 Fed tightening cycle when high-yield bonds performed much better than investment grade. Investors should maintain a preference for high-yield over investment grade within an otherwise defensive allocation to US corporate bonds. US Industry Groups Chart 3A shows the performance of US corporate bonds in the early stages of the recent selloff, but this time split by industry group. High-yield Energy sticks out as a strong outperformer, though we also notice that every high-yield sector performed better than its investment grade counterpart. Chart 3ACorporate Bond Excess Returns* Versus Duration-Times-Spread: September 27, 2021 To March 14, 2022
Looking For Opportunities In US & European Corporates After The Recent Selloff
Looking For Opportunities In US & European Corporates After The Recent Selloff
Chart 3B once again shows how the relative performance between investment grade and high-yield has flipped since mid-March, though we see that high-yield Energy, Transportation and Utilities have performed better than the rest of the index. Chart 3BCorporate Bond Excess Returns* Versus Duration-Times-Spread: March 14, 2022 To Present
Looking For Opportunities In US & European Corporates After The Recent Selloff
Looking For Opportunities In US & European Corporates After The Recent Selloff
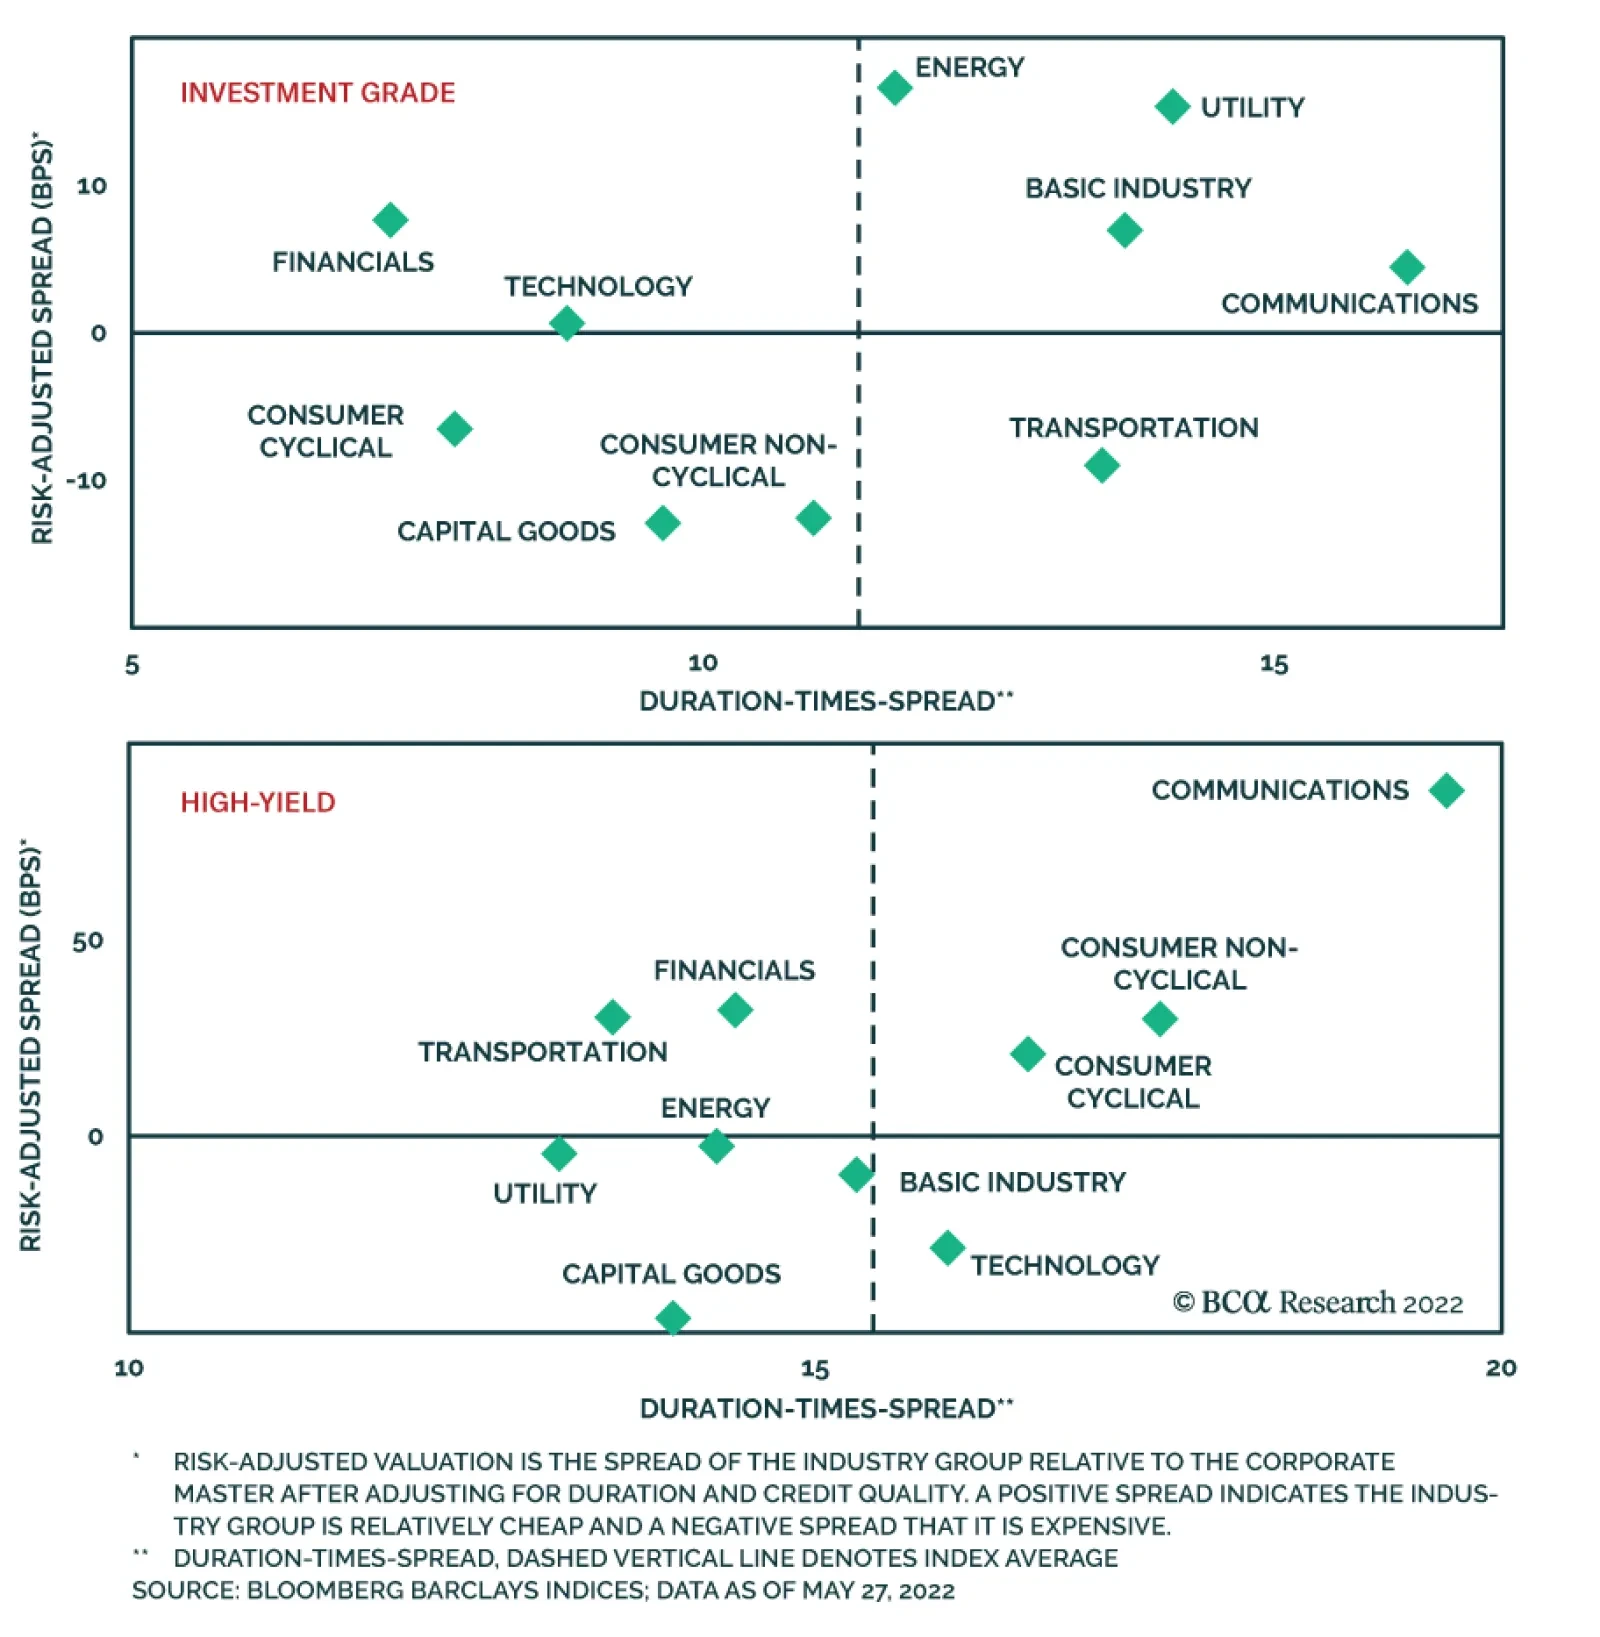
Interestingly, despite the strong outperformance of high-yield Energy bonds, investment grade Energy credits performed mostly in line with other investment grade sectors. We believe this presents an excellent opportunity. The vertical axis of Chart 4A shows our measure of the risk-adjusted spread available in each investment grade industry group. Our risk-adjusted spread is the residual after adjusting for each sector’s credit rating and duration. The horizontal axis shows each sector’s Duration-Times-Spread as a simple measure of risk. Our model shows that Financials, Technology, Energy, Utilities, Communications and Basic Industry all stand out as attractive within the investment grade corporate bond universe. We identify the investment grade Energy sector as a particularly compelling buy. Chart 4AUS Investment Grade Corporate Sector Valuation
Looking For Opportunities In US & European Corporates After The Recent Selloff
Looking For Opportunities In US & European Corporates After The Recent Selloff
In a prior report, we demonstrated, unsurprisingly, that the oil price is an important determinant of whether Energy bonds perform better or worse than the rest of the corporate index. With our commodity strategists calling for the Brent crude oil price to average $122/bbl next year, this will provide strong support to Energy bond returns. Cheap starting valuations for investment grade Energy bonds make them look even more compelling. Chart 4B repeats our valuation exercise but for high-yield industry groups. Within high-yield, we find that Financials, Transportation, Communications and Consumer sectors stand out as attractive. Interestingly, high-yield Energy bonds now look slightly expensive compared to the rest of the junk bond universe, a result of the sector’s recent incredibly strong performance. Chart 4BUS High-Yield Corporate Sector Valuation
Looking For Opportunities In US & European Corporates After The Recent Selloff
Looking For Opportunities In US & European Corporates After The Recent Selloff
US Credit Curve We define the credit curve as the difference in option-adjusted spread between the “Long Maturity” and “Intermediate Maturity” sub-indexes for each investment grade credit tier, as defined by Bloomberg. We exclude high-yield from this analysis because very few high-yield bonds are classified as “Long Maturity”. To analyze the credit curve, we observe that credit curves tend to be steeper when credit spreads are tight, and vice-versa. This is because tight spreads indicate that the perceived near-term risk of default is low. As a result, short-maturity spreads tend to be lower than spreads at the long-end of the curve. Conversely, a wide spread environment indicates that the perceived near-term risk of default is high, and this risk will be more reflected in shorter maturity credits. Charts 5A, 5B and 5C show the slopes of the credit curves for Aa, A and Baa-rated securities. Immediately we notice that credit curves are positively sloped in each case, and also that each credit curve is somewhat steeper than would be predicted based on the average spread for the overall credit tier. Chart 5AAa-Rated Credit Curve
Looking For Opportunities In US & European Corporates After The Recent Selloff
Looking For Opportunities In US & European Corporates After The Recent Selloff
Chart 5BA-Rated Credit Curve
Looking For Opportunities In US & European Corporates After The Recent Selloff
Looking For Opportunities In US & European Corporates After The Recent Selloff
Chart 5CBaa-Rated Credit Curve
Looking For Opportunities In US & European Corporates After The Recent Selloff
Looking For Opportunities In US & European Corporates After The Recent Selloff
This strongly suggests that investors should favor long-maturity over short-maturity US investment grade corporate bonds. European Corporates Look Cheap Vs. US Equivalents – For Patient Investors Chart 6European Credit Spreads At Past 'Non-Crisis' Peaks
European Credit Spreads At Past 'Non-Crisis' Peaks
European Credit Spreads At Past 'Non-Crisis' Peaks
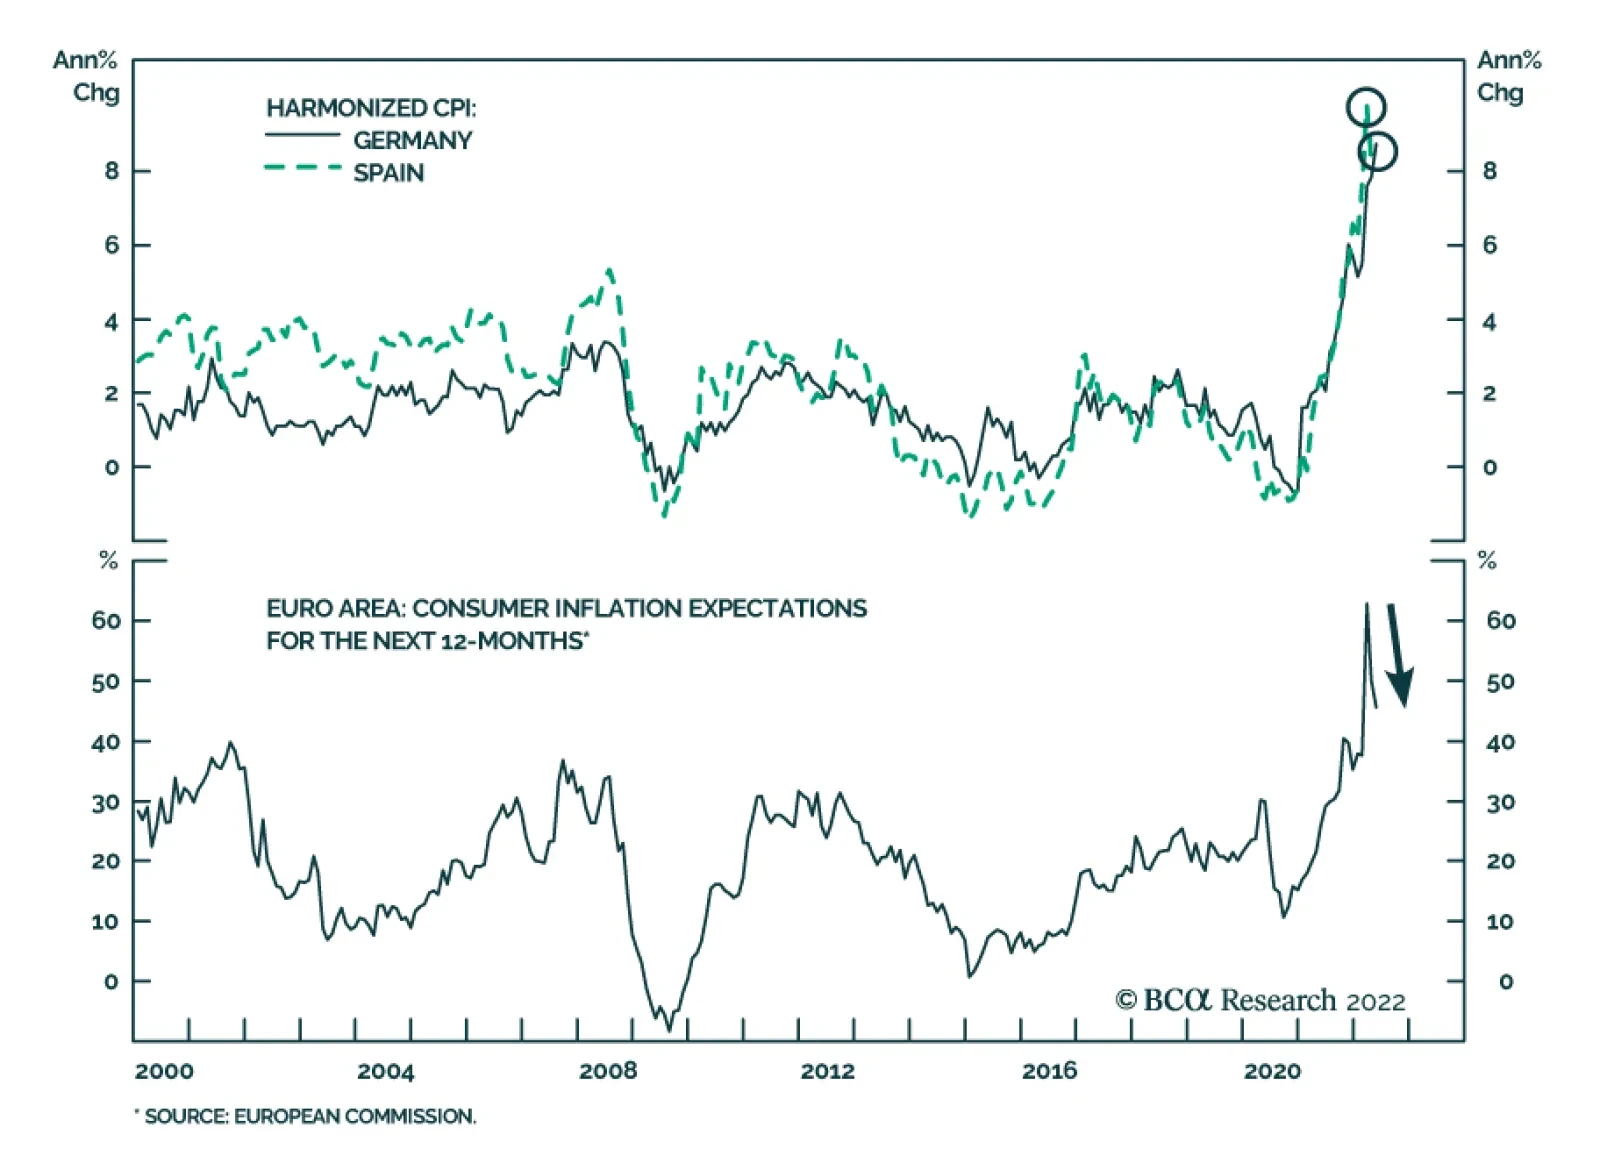
Turning to the euro area, the Bloomberg investment grade OAS and high-yield OAS currently sit at 167bps and 490bps, respectively (Chart 6). These levels are well below the peaks seen during the 2020 COVID recession and the 2011/12 European debt crisis, but are in line with the spread widening episodes in 2014/15 and 2018. Our preferred measure of credit spread valuation, 12-month breakeven spreads, show that European investment grade and high-yield spreads are in the 75th and 67th percentile of outcomes, respectively, dating back to the inception of the euro in 1998 (Chart 7).1 These are both higher compared to the breakeven percentile rankings for US investment grade (48%) and US high-yield (52%). The gap between the breakeven percentile rankings for investment grade bonds in the euro area versus the US is the widest seen over the past two decades. That gap reflects the fact that European economic growth has softened versus the US according to the S&P Global manufacturing PMIs, while European inflation has accelerated towards very elevated US levels (Chart 8). Chart 7European Spreads Have Cheapened Up More Than US Spreads
European Spreads Have Cheapened Up More Than US Spreads
European Spreads Have Cheapened Up More Than US Spreads
Chart 8European Corporate Underperformance Reflects Relative Growth & Inflation
European Corporate Underperformance Reflects Relative Growth & Inflation
European Corporate Underperformance Reflects Relative Growth & Inflation
Both of those trends are a product of the Ukraine war, which has led to a massive spike in European energy costs given the region's huge reliance on Russian energy supplies, particularly for natural gas. While the US has also suffered a massive increase in its own energy bills, the inflation spike has been higher in Europe, leading to a bigger drag on economic confidence and growth. Thus, the widening spread differential between corporate bonds in Europe relative to the US likely reflects a growth-related risk premium. Chart 9A Turning Point For European Corporate Bond Performance?
A Turning Point For European Corporate Bond Performance?
A Turning Point For European Corporate Bond Performance?
As euro area inflation has ratcheted higher, so have expectations of ECB monetary tightening. The euro area overnight index swap (OIS) curve now discounts 172bps over the next 12 months, a huge swing from the start of 2022 when markets were expecting the European Central Bank (ECB) to stand pat on the interest rate front. In comparison, markets are pricing in another 224bps of Fed tightening over the next 12 months, even after the Fed has already delivered 75bps of tightening since March. Importantly, the gap between our 12-month discounters, which measure one-year-ahead interest rate changes discounted into OIS curves, for the US and Europe has proven to be a reliable leading indicator – by around nine months - of the relative year-over-year excess returns (on a USD-hedged basis) of European and US corporate bonds, especially for investment grade (Chart 9). The fact that this is a leading relationship suggests that the upward repricing of ECB rate expectations seen so far in 2022 is not yet a reason to turn more cyclically negative on European corporate bonds versus the US. The earlier upward repricing of expected Fed tightening is the more relevant factor, and is signaling that both US investment grade and high-yield corporates should underperform European equivalents over at least the rest of 2022. BCA Research Global Fixed Income Strategy already has a recommended allocation along those lines, with an overweight to euro area investment grade and an underweight to US investment grade. While the trade has underperformed of late, the combined messages from the relative 12-month breakeven spread rankings (cheaper European valuations) and 12-month discounters (the Fed is further ahead in the tightening cycle) leads us to stick with that relative cross-Atlantic tilt. The main risk to that stance is any deterioration of the flow of energy supplies from Russia to Europe that results in a stagflationary outcome of a bigger growth slowdown with even faster inflation. That is a scenario that would make it difficult for the ECB to back down from its recent hawkish forward guidance, resulting in European corporate spreads incorporating an even wider risk premium. Given that near-term uncertainty, we are advocating that investors maintain no relative tilt on more growth-sensitive, and riskier, European high-yield relative to the US – stay neutral on both. Stay Up In Quality On European Corporates Looking at euro area corporate debt across credit ratings and maturity buckets, there are few compelling immediate valuation stories in absolute terms, although there are potential opportunities unfolding on a relative basis. Within investment grade, credit quality curves have steepened during the recent selloff, with lower-rated credit seeing larger spread widening (Chart 10). The gap between Baa-rated and A-rated European corporate spreads now sits at 52bps, right in the middle of the 25-75bps range since 2014. In high-yield, the gap between Ba-rated and B-rated credit spreads is 222bps, and the gap between B-rated and Caa-rated spreads is 370bps (Chart 11) – both are still below the previous peaks in those relationships seen in 2012, 2015 and 2020. Chart 10European IG Credit Quality Curve Can Steepen ##br##More
European IG Credit Quality Curve Can Steepen More
European IG Credit Quality Curve Can Steepen More
Chart 11European HY Credit Quality Curve Still Below Previous Peaks
European HY Credit Quality Curve Still Below Previous Peaks
European HY Credit Quality Curve Still Below Previous Peaks
For both investment grade and high-yield, there is still room for credit curves to steepen if European growth expectations continue to deteriorate. However, when looking at spread valuations across the credit quality spectrum, and across maturity buckets, euro area corporate spreads look much cheaper than US equivalents. In Chart 12, we show a snapshot of the current 12-month breakeven percentile rankings for individual credit quality tiers and maturity groups, for investment grade and high-yield in the euro area and US. The relative attractiveness of European credit relative to the US is evident, with European spreads now at higher percentile rankings across all quality tiers and maturity buckets. The largest gaps between 12-month breakeven percentile rankings are in the +10 year maturity bucket, the AAA-rated and AA-rated investment grade credit tiers, and the Ba-rated high-yield credit tier. This suggests any trades favoring European corporates versus the US should stay up in credit quality. Chart 12Corporate Spread Valuations By Maturity & Credit Rating Favor Europe
Looking For Opportunities In US & European Corporates After The Recent Selloff
Looking For Opportunities In US & European Corporates After The Recent Selloff
Comparing European & US Industry Spread Valuations When looking at the industry composition of the euro area and US corporate bond indices, there are a few major notable differences. Within investment grade, there is a greater concentration of Energy and Technology names in the US, while Financials are more represented in the European index (Chart 13). Those same three industries also have the largest relative weightings in the high-yield indices (Chart 14), although there is also a slightly larger weighting of high-yield Transportation companies in Europe compared to the US. This means that a bet on European credit versus the US is essentially a bet on European Financials versus US Energy and Technology. Chart 13Investment Grade Corporate Bond Market Cap Weights
Looking For Opportunities In US & European Corporates After The Recent Selloff
Looking For Opportunities In US & European Corporates After The Recent Selloff
Chart 14High-Yield Corporate Bond Market Cap Weights
Looking For Opportunities In US & European Corporates After The Recent Selloff
Looking For Opportunities In US & European Corporates After The Recent Selloff
When looking at the same sector metrics that were shown earlier in this report for the US – comparing risk-adjusted spreads to Duration-Times-Spread – we find some interesting cross-Atlantic valuation differentials. For investment grade in Europe (Chart 15), only Energy and Financials have positive risk-adjusted spread valuations (after controlling for duration and credit quality), while having the highest level of risk expressed via Duration-Times-Spread. This contrasts to the US where more sectors have positive risk-adjusted spreads - Energy, Financials, Utilities, Basic Industry and Communications. Investors should favor the latter three industries in the US relative to Europe. Chart 15Euro Area Investment Grade Corporate Sector Valuation
Looking For Opportunities In US & European Corporates After The Recent Selloff
Looking For Opportunities In US & European Corporates After The Recent Selloff
Within high-yield in Europe, Energy and Financials also offer positive risk-adjusted valuations, but so do Consumer Cyclicals and Consumer Non-Cyclicals (Chart 16). This lines up similarly to US high-yield valuations. The notable valuation gaps exist in Transportation and Communications, which look cheap in the US and expensive in Europe, creating potential cross-Atlantic relative value trade opportunities between those sectors (and within an overall neutral allocation to junk in both regions). Chart 16Euro Area High-Yield Corporate Sector Valuation
Looking For Opportunities In US & European Corporates After The Recent Selloff
Looking For Opportunities In US & European Corporates After The Recent Selloff
Ryan Swift US Bond Strategist rswift@bcaresearch.com Robert Robis, CFA Chief Fixed Income Strategist rrobis@bcaresearch.com Footnotes 1 12-month breakeven spreads measure the amount of spread widening that would be necessary to make the return on corporate bonds equal to that of duration-matched government bonds over a one-year horizon. The spread is calculated as a ratio of the index OAS and index duration for the relevant credit market. We look at the historical percentile ranking of that ratio to make a more “apples for apples” comparison of spreads that factors in index duration changes over time. Recommended Portfolio Specification Other Recommendations Treasury Index Returns Spread Product Returns
German HICP rose from 7.8% y/y to 8.7% y/y in May, exceeding expectations of 8.1% y/y. Accelerating goods prices led the increase, while services inflation eased in May. Notably, energy and food prices surged 38.3% y/y and 11.1% y/y, respectively. Food and…
Investors’ attention appears to have shifted from concerns that inflation is too elevated to worries about the global growth outlook. The US inflation surprise index is rolling over and both market-based as well as survey-based measures of inflation…
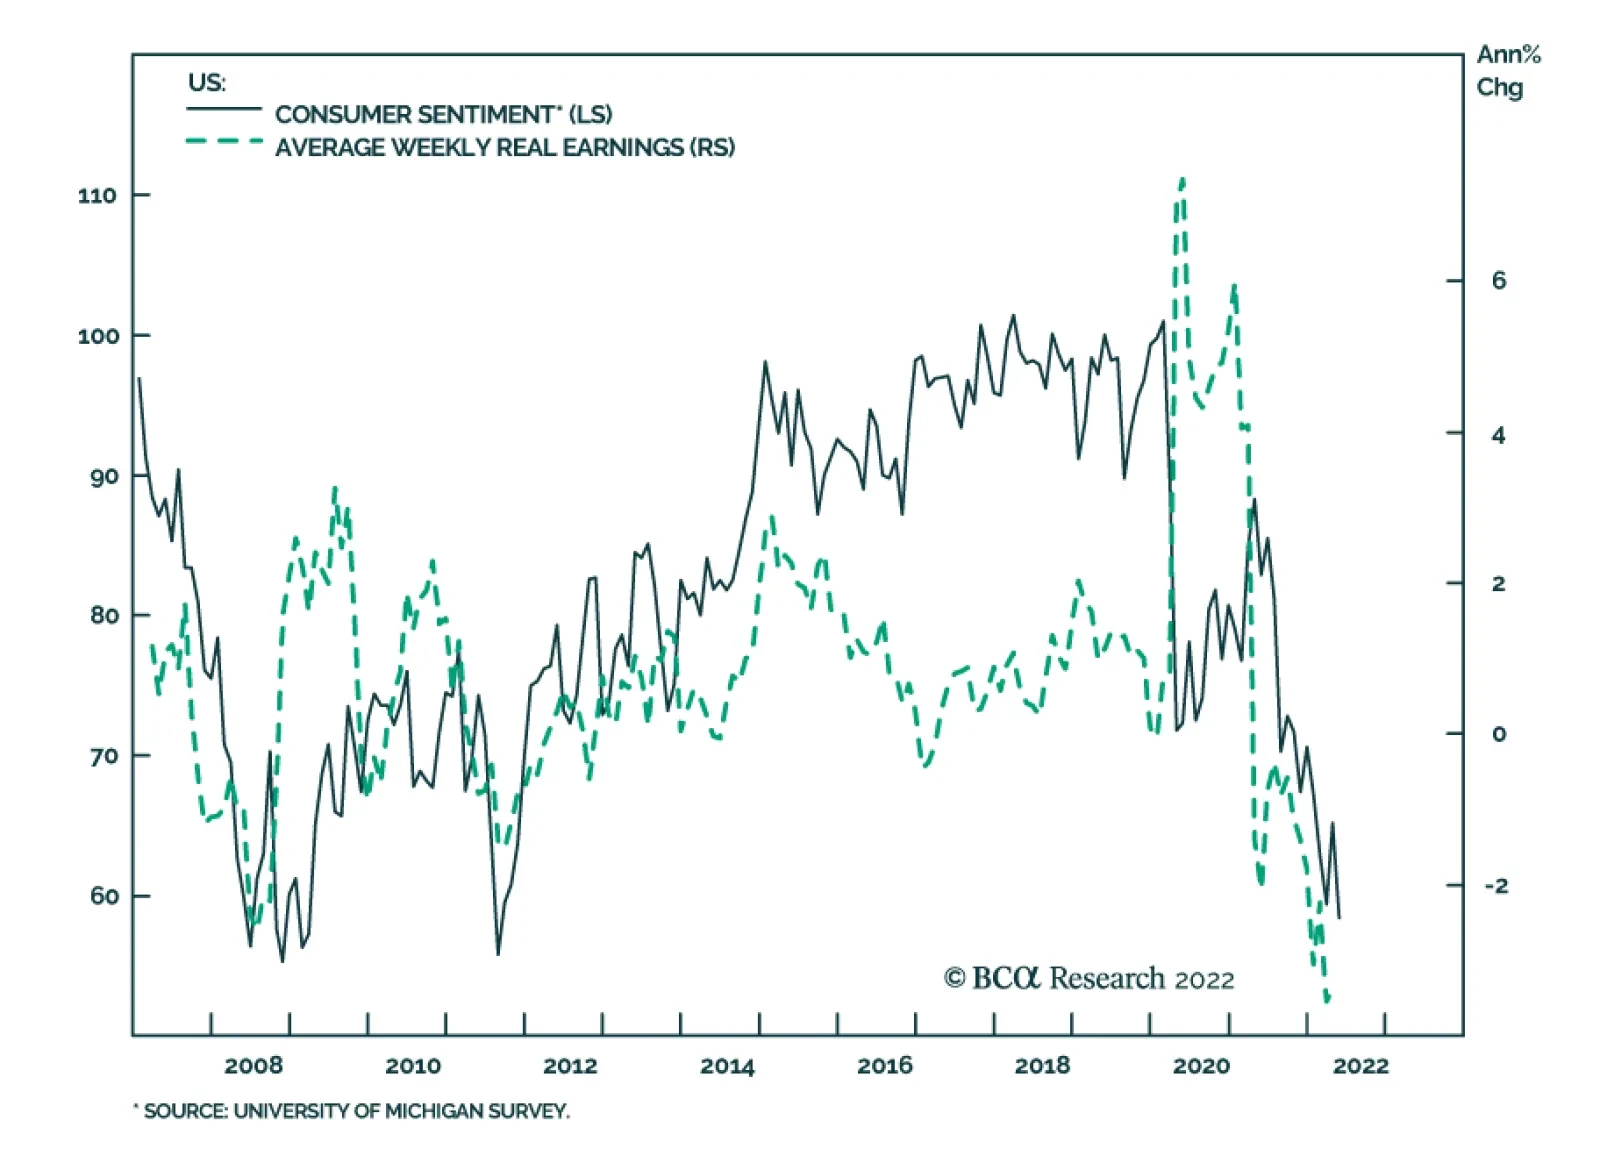
BCA Research’s US Equity Strategy service does not expect US consumers to lend a “spending hand” to support economic growth. Inflation continues to put pressure on US consumers. Negative real wage growth is sapping their confidence and is cutting into…