Developed Countries

Executive Summary Hiring is slowing and layoffs have begun to rise, but today's robust net increases in non-farm payrolls are inconsistent with an approaching recession. The demise of the American consumer has been greatly exaggerated. Households have lots of savings to spend and the capacity to borrow against them if they choose. The extensive forward guidance that the Fed has been at pains to provide to markets may have fueled a sharp preemptive tightening in financial conditions that might prove premature if it reduces the Fed's need to cool the economy itself. None of the three components of our simple recession indicator (the slope of the yield curve, the year-over-year change in the Leading Economic Index and our assessment of monetary policy settings) is sounding the alarm, or even flashing yellow. No Recession Warning In This Series
No Recession Warning In This Series
No Recession Warning In This Series
Bottom Line: Although gloom is increasingly pervasive among investors, we remain constructive on risk assets and the economy over the next twelve months, and reiterate our recommendation to overweight equities in a balanced portfolio. Feature Per the mosaic theory of security analysis, analysts, portfolio managers and independent investors piece together fragments of publicly available information to form a thesis about a company’s prospects. After appraising the company’s securities based on that thesis, the analyst/PM/investor determines whether they’re overvalued, undervalued or fairly valued and takes the appropriate action in his/her portfolio. All market participants are in a race to be among the first to see the outline of the complete picture as the opportunities to exploit mispricings are inversely related to the available share of relevant data. Security fair values become more apparent as more bits of colored glass begin to circulate and alpha-seeking investors have to move on to the next mostly incomplete puzzle to find an edge. Related Report US Investment StrategyAll The Way To Ticker Symbols The same framework applies to macroeconomic analysis. It’s especially apt now, given the lack of a close precedent for the monetary and fiscal support policy makers lavished on the economy to protect it from COVID-19’s potential ravages and the way that data flows have refused to conform to a well-defined trend supported by a stable narrative theme. Macro data and news from individual companies are stuck in a one-step-forward, one-step-back pattern as embodied by stagnant stock indexes. The S&P 500 paced the same 100-point path between 4,075 and 4,175 for two full weeks before tumbling through the bottom of the range last Thursday and losing contact with it on Friday after the May CPI report showed that inflation remains stubbornly high (Chart 1). Chart 1Stocks See The Glass As Half-Empty
Assembling The Mosaic
Assembling The Mosaic
The details of the May CPI report weren’t as bad as the headlines, though we were surprised and disappointed by its failure to confirm our view that inflation is peaking. From the full range of puzzle pieces we already have, however, we continue to think the picture for risk assets and the economy one year from now will be encouraging. We spent last week speaking and mingling at a conference and meeting with clients one-on-one last week, confirming that our sanguine view is decidedly in the minority as investors have become increasingly resigned to the idea that inflation cannot be brought down to a tolerable level without squeezing the economy. We think there is a middle way, at least over the next twelve months, as we highlight below by reviewing some of the largest and most important factors. Employment If a recession were imminent, we would expect to see hiring begin to sputter. Year-over-year payrolls growth has slowed, but it remains more than a standard deviation above the mean (Chart 2, top panel), at its highest level in 38 years. Annualized month-over-month growth is strong as well, if not as much of an outlier as year-over-year growth (Chart 2, bottom panel). Going forward, payrolls growth is poised to remain strong (Chart 3, top panel), as small businesses’ hiring intentions are very high (Chart 3, second panel), temporary employment is still elevated (Chart 3, third panel) and initial unemployment claims, while rising, are extremely low (Chart 3, bottom panel). Chart 2Payrolls Are Growing At A Nice Clip ...
Payrolls Are Growing At A Nice Clip ...
Payrolls Are Growing At A Nice Clip ...
Chart 3... And Will Continue To Do So
... And Will Continue To Do So
... And Will Continue To Do So
Consumption Chart 4Solid Footing
Solid Footing
Solid Footing
We have stressed that households’ massive pandemic savings have provided them with ample ability to consume. They have worked down the debt they took on ahead of the financial crisis, restoring the household debt-to-GDP ratio to its 2002 level (Chart 4, second panel), which is much more lightly borne today than it was then, thanks to interest rates that remain extremely low despite their recent backup (Chart 4, bottom panel). It is an open question, subject to occasionally fierce debate within BCA, if households have the willingness to consume the mountain of savings they have amassed since COVID-19 reached the US. Our answer has been an unequivocal yes, and we have been working under the purposely conservative assumption that households will spend just half of their $2 trillion-plus stash. So far, the data are on our side: consumers have not lost their appetite for dining out, returning to restaurants at their pre-pandemic pace once the Omicron coast was clear (Chart 5, top panel). Travelers are returning to the skies, as well, undeterred by soaring airfares (Chart 5, bottom panel). Although passenger levels have not made it all the way back to their 2019 levels, nearly 60% more passengers have passed through TSA checkpoints so far this year than they did at this point in 2021, and credit card usage indicates that reduced business travel is responsible for the shortfall, as individuals have eagerly sought to cure their cabin fever (Chart 6). Chart 5Back To Restaurants, Bars ...
Back To Restaurants, Bars ...
Back To Restaurants, Bars ...
Chart 6... And The Friendly Skies
... And The Friendly Skies
... And The Friendly Skies
Private Investment/Credit Spreads Although consumption accounts for two-thirds of overall US output, or three-and-a-half times more than investment, the latter is slightly more likely to bring about a contraction in GDP because it is considerably more volatile.1 Nonresidential investment accounts for the lion’s share of private investment and BCA’s capex model projects that it will remain robust over the next two quarters (Chart 7). Residential investment will have to grapple with the housing slowdown imposed by the sudden and significant increase in mortgage rates, but we agree with our Bank Credit Analyst colleagues’ assessment that housing is unlikely to tank the economy.2 Homes remain undersupplied after several years of insufficient construction and the spread between the baseline 30-year fixed mortgage rate and the 10-year Treasury yield has become so stretched that it appears that the mortgage rate may have already reached its 2022 peak (Chart 8). Chart 7Capex Prospects Are Good ...
Capex Prospects Are Good ...
Capex Prospects Are Good ...
Wider corporate bond spreads and intimations that banks are becoming less eager to lend could signal a further tightening of financial conditions. There have been three major spread-widening episodes in the high yield era (Chart 9, top panel) and none began until three preconditions had been met. Chart 8... And Mortgage Borrowers Are Due For A Break
... And Mortgage Borrowers Are Due For A Break
... And Mortgage Borrowers Are Due For A Break
The Fed had to have completed its rate hiking cycle (Chart 9, second panel), our proprietary Corporate Health Monitor (CHM) had to have crossed into deterioration (Chart 9, third panel) and the Fed’s quarterly Senior Loan Officer survey had to indicate that a majority of banks was imposing tighter credit standards on business borrowers (Chart 9, bottom panel). None of those conditions is in place yet, though banks' lending appetites may be shrinking and the first quarter was not great for corporate health. Chart 9Perhaps Forward Guidance Was TMI
Perhaps Forward Guidance Was TMI
Perhaps Forward Guidance Was TMI
Broad Recession Probability Pulling back to 30,000 feet, none of the key recession prerequisites we constantly monitor is yet signaling any distress. The 3-month bill/10-year note segment of the Treasury yield curve remains solidly upward sloping (Chart 10). The Leading Economic Index (LEI) is nowhere close to contracting on a year-over-year basis (Chart 11), and the target fed funds rate is far below our estimate of the equilibrium fed funds rate (Chart 12). Each series has issued its own false signal – an above-equilibrium fed funds rate has been a necessary, but hardly sufficient, recession condition – but they have a perfect track record when considered together. Chart 10When The Yield Curve Inverts, ...
When The Yield Curve Inverts, ...
When The Yield Curve Inverts, ...
Chart 11... Year-Over-Year LEI Contracts ...
... Year-Over-Year LEI Contracts ...
... Year-Over-Year LEI Contracts ...
Chart 12... And Monetary Policy Settings Are Restrictive, A Recession Soon Follows
... And Monetary Policy Settings Are Restrictive, A Recession Soon Follows
... And Monetary Policy Settings Are Restrictive, A Recession Soon Follows
Investment Implications The May CPI report only strengthened the conviction of those holding bearish views and will at least temporarily fuel a barrage of gloomy headlines that might sway the uncommitted. It has reduced the marginal probability that the Fed will be able to thread the needle and meet its price stability mandate without taking direct aim at its full employment goals. We still expect that the Fed will be able to maintain its balancing act for another twelve months because we think inflation will begin to come down on its own once the fevers in new and used auto prices and airfares finally break. The more remote that prospect seems to investors, the more stock prices will fall and bond yields will rise if the bullish view, or something slightly less bearish than discounted, comes to pass. The University of Michigan’s consumer sentiment survey made an all-time low in the preliminary June data released Friday morning. We are less concerned about the headline number – Open Table reservations and busy TSA security lines suggest investors are better served by focusing on what consumers do than how they feel, and the Michigan gloom is contradicted by the Conference Board survey's modest optimism – than we are about the upward turn in consumers’ long-run inflation expectations. Respondents to the Michigan survey increased their median estimate for inflation in five to ten years to 3.3% from 3% over the previous four months (the estimate had been between 2.9 and 3.1% for ten months beginning last August). If workers’, businesses’, investors’ and consumers’ long-run inflation expectations become unmoored, an inflation mindset in which high prices beget still higher prices could threaten to take hold, forcing the Fed to channel its inner Paul Volcker, shattering our temporary thread-the-needle thesis. For now, the term structure of inflation expectations remains sharply inverted. That’s to say that TIPS breakevens, CPI swaps and survey respondents continue to expect that intermediate- and long-term inflation will slow considerably from its currently elevated levels. If they begin to lose faith that very high inflation readings are a temporary phenomenon, we will have to revisit our glass-half-full perspective. We are not irresolute, but like Lord Keynes, when the data change, we change our minds. Doug Peta, CFA Chief US Investment Strategist dougp@bcaresearch.com Footnotes 1 The probability that investment could decline enough in any given quarter to zero out 2% growth in consumption and government spending is 23%, based on its historical distribution. The probability that consumption could wipe out 2% growth in investment and government spending is 17.6%. Government spending, which is one-fourth the size of consumption and considerably more stable than comparably sized investment, has just a 2.3% probability of negating trend growth in the other components. (All calculations disregard net exports.) 2 "Is The US Housing Market Signaling An Imminent Recession?" Bank Credit Analyst Special Report, June 2022.
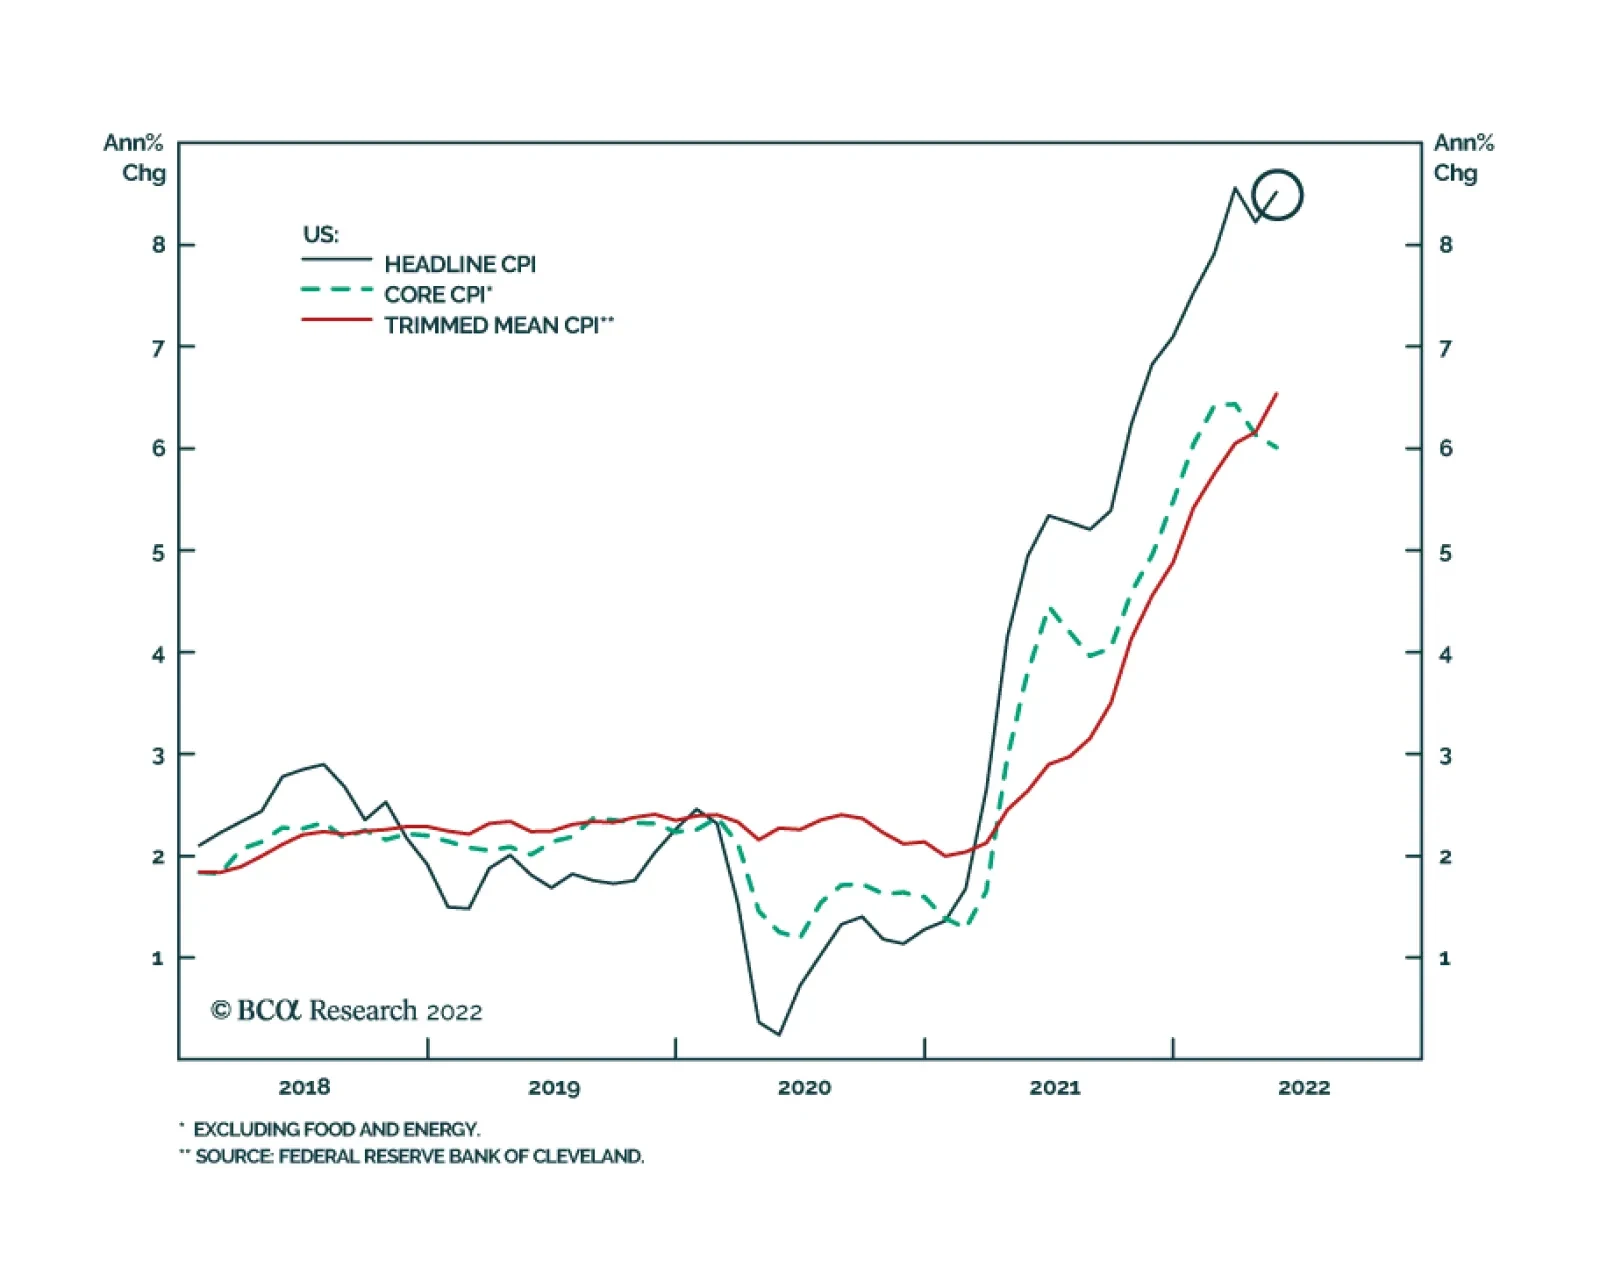
After easing in April, US headline CPI inflation surged at a faster-than-expected pace of 8.6% y/y (1.0% m/m) in May. Accelerating energy (34.6% y/y), food (10.1% y/y) and used vehicles (16.1% y/y) prices led this increase. Although core CPI was unchanged at…
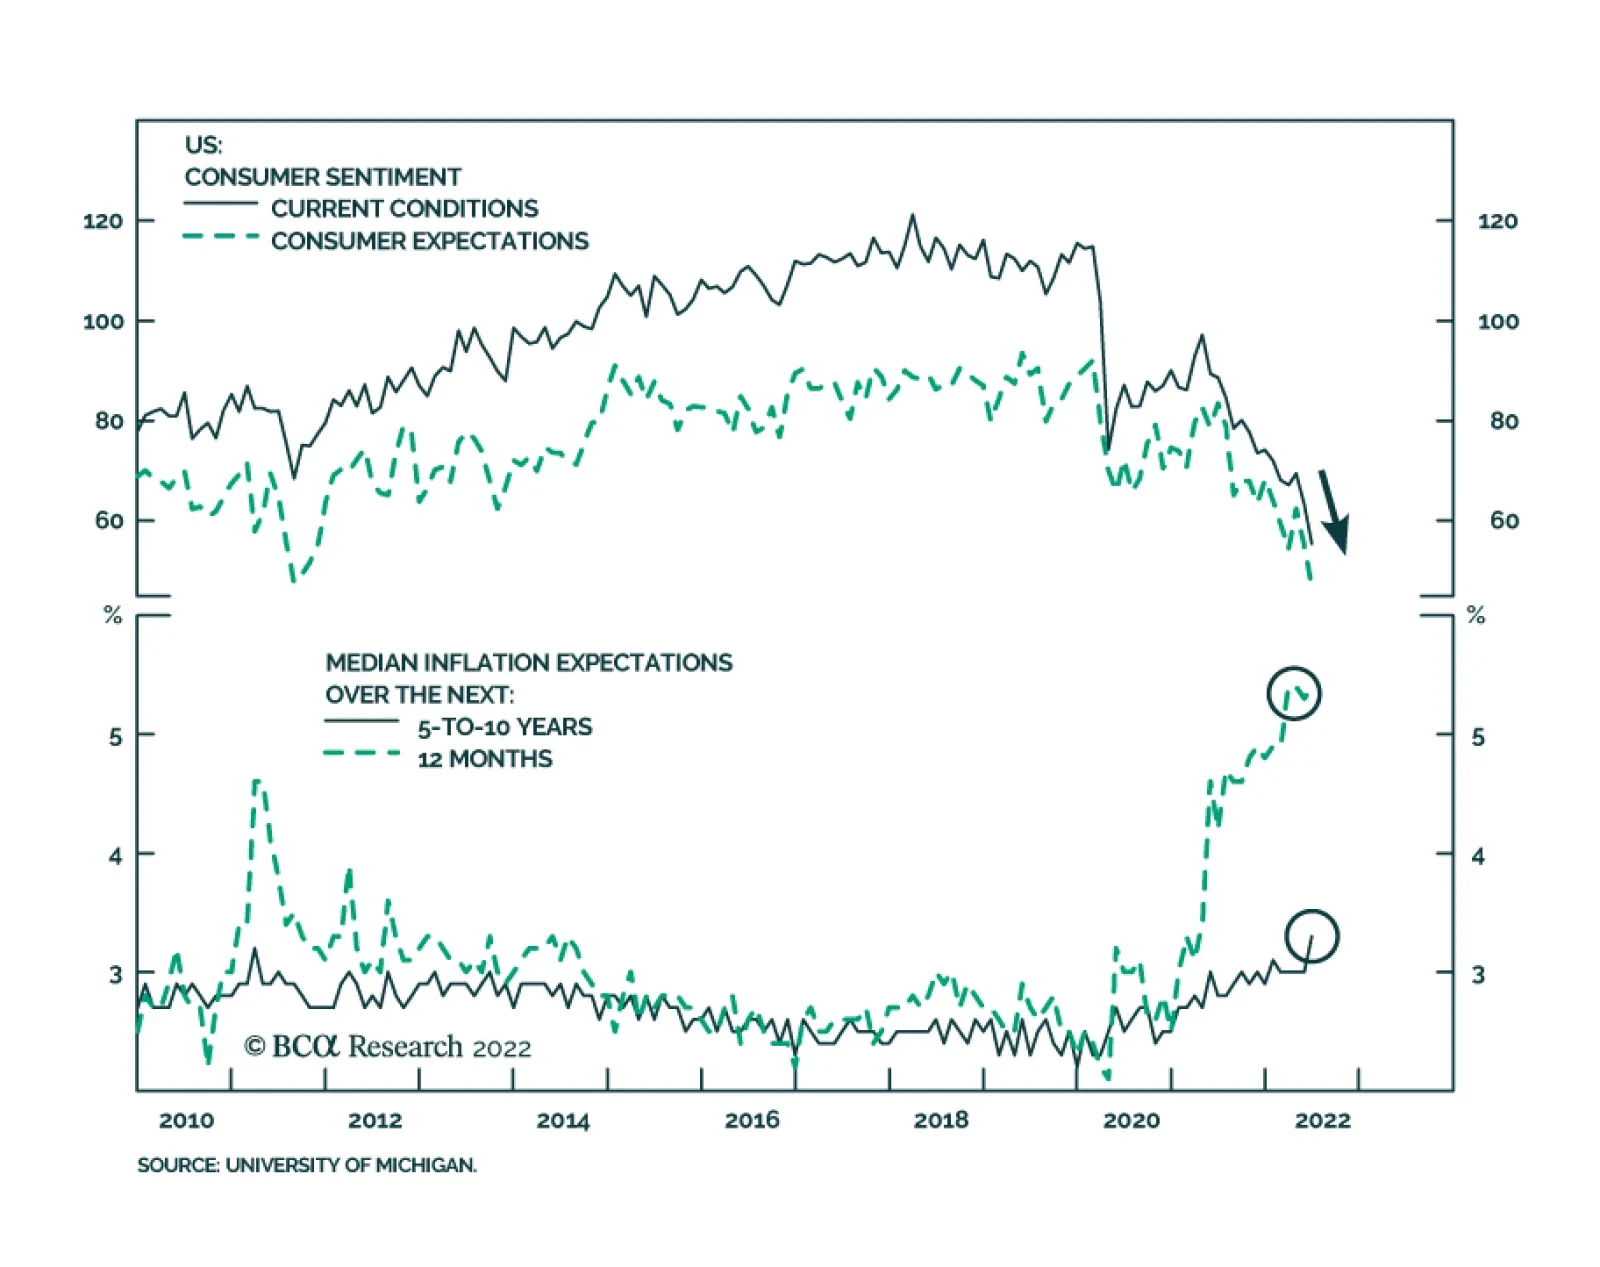
The preliminary release of the University of Michigan’s June Consumer survey sent a negative signal about US household sentiment. The headline index dropped 8.2 points to a record low of 50.2. Notably, both the Current Conditions and Expectations sub-indices…
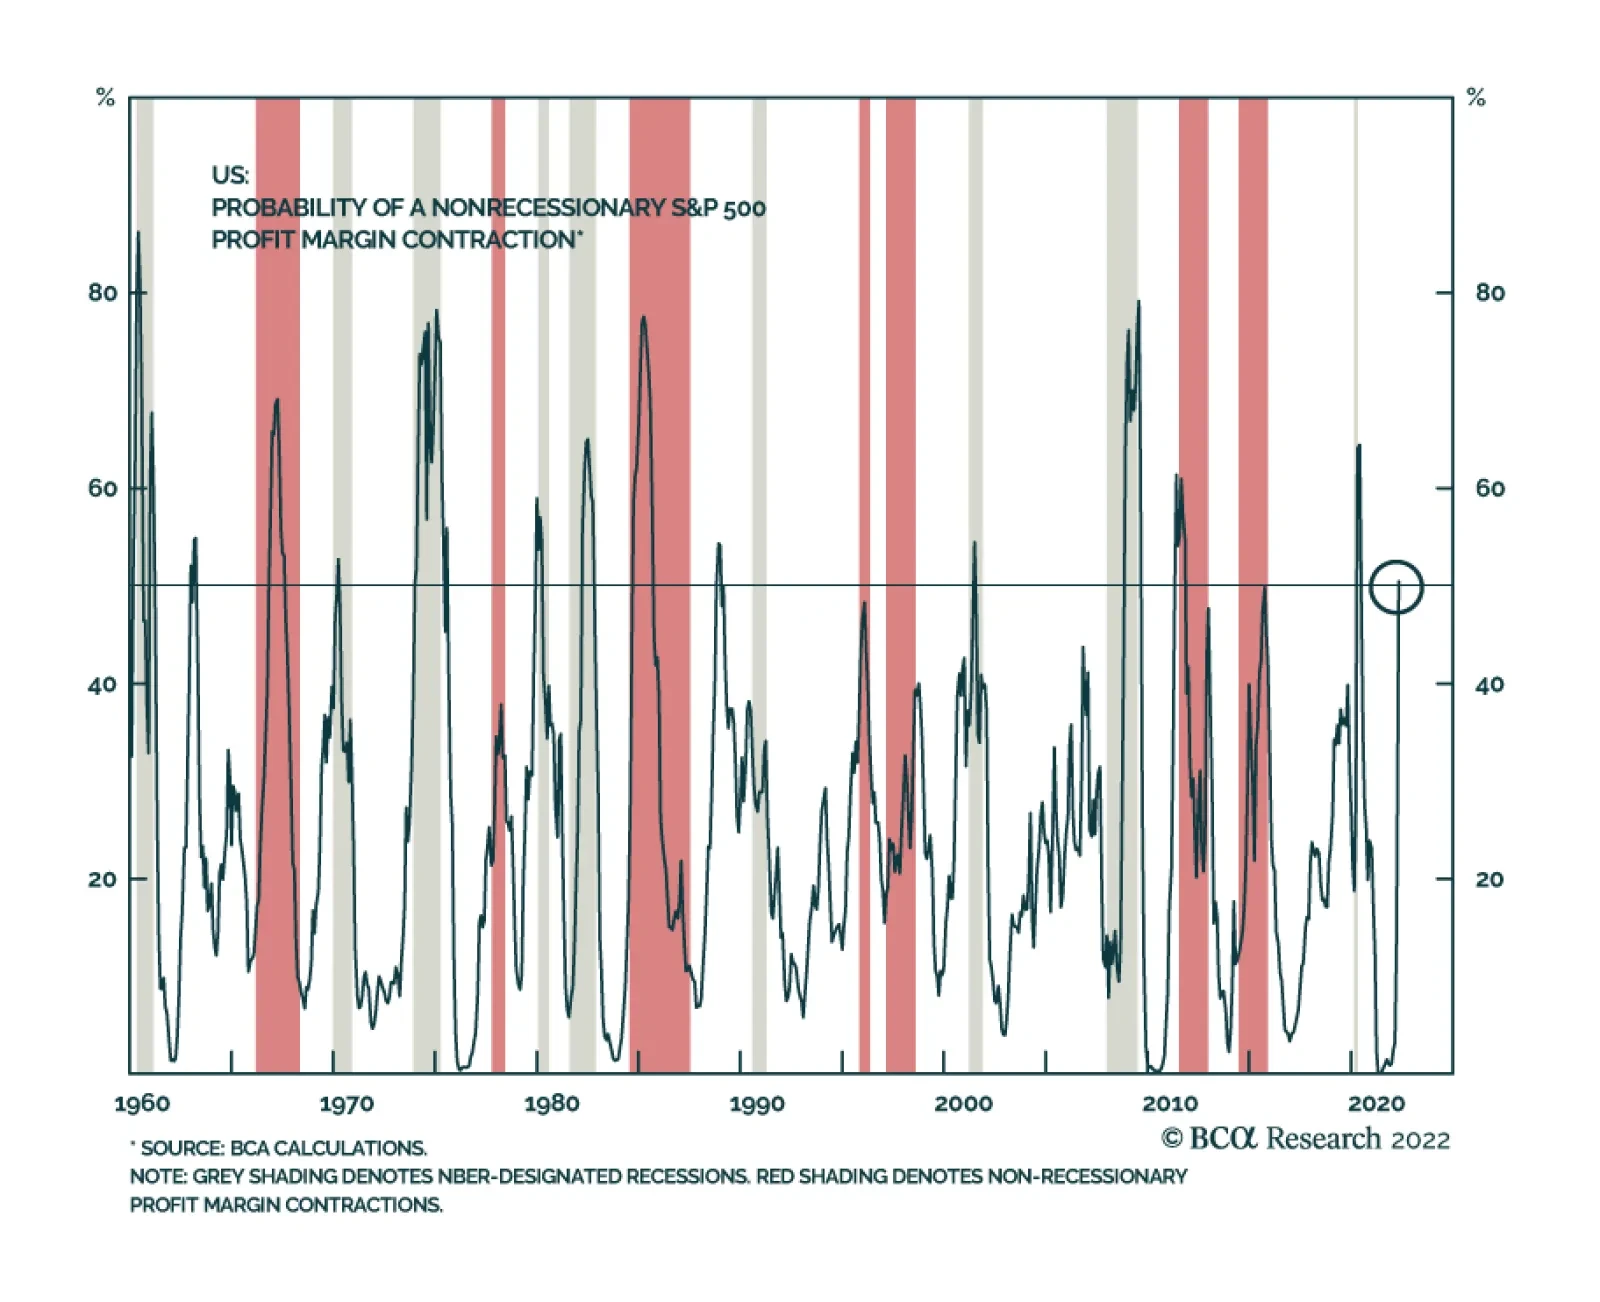
Earnings contractions and recessions typically go hand in hand. Nevertheless, there have been five instances since the 1960s in which there have been non-recessionary year-on-year negative EPS growth. In four of these occurrences, revenue growth remained…
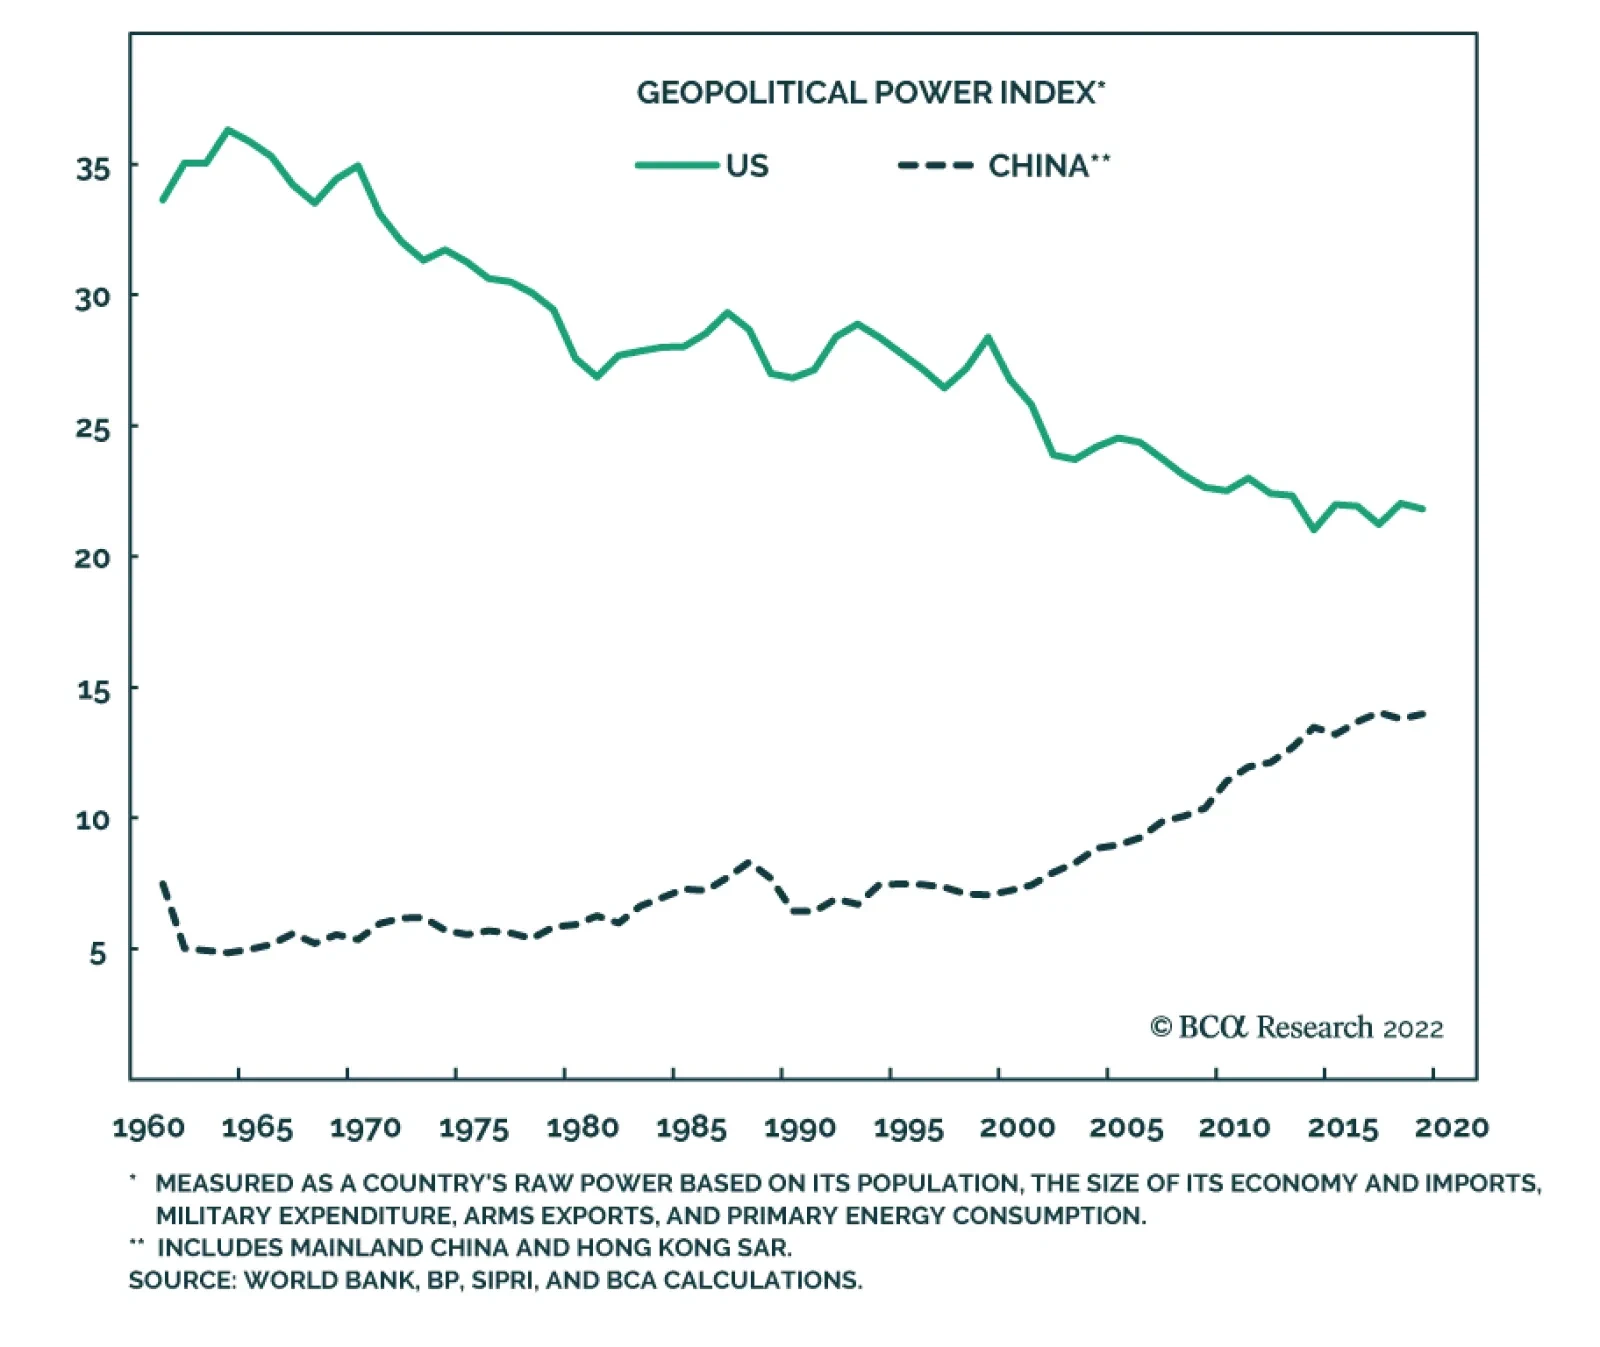
According to BCA Research’s Geopolitical Strategy service, there is little basis for a substantial US-China re-engagement that improves the global macroeconomic environment over the coming years. The Biden administration is focused on fighting inflation…
Executive Summary Is Relative Inflation Peaking In The US?
Is Relative Inflation Peaking In The US
Is Relative Inflation Peaking In The US
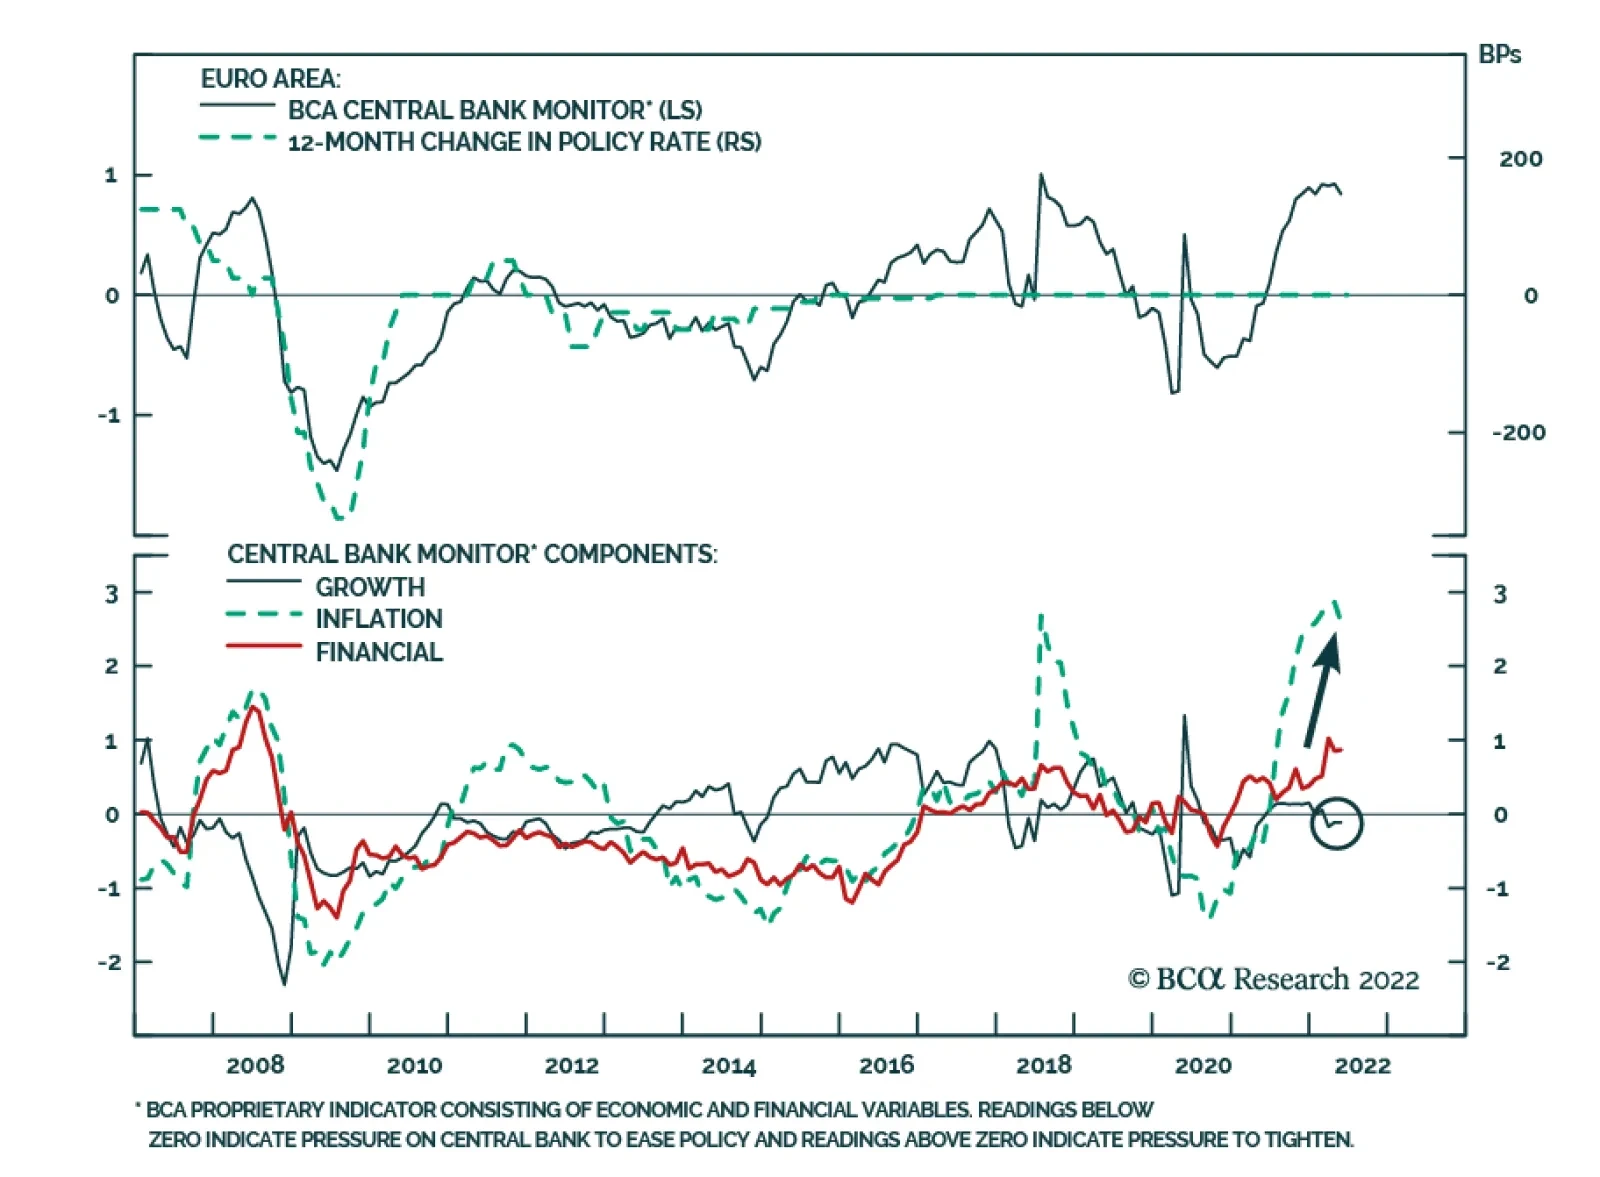
The dollar has likely peaked in the near term. An unwinding of speculative bets, based on structurally higher inflation in the US, is the key driver (Feature Chart). Our theme of central bank convergence continues to play out. Rates in the euro area are headed higher. The next bet for higher rates is in Japan. The key for picking currency winners will be global growth barometers. The US dollar embeds a huge safety premium that will be eroded as we get more clarity on global growth and inflation. RECOMMENDATIONS INCEPTION LEVEL inception date RETURN Short DXY 104.80 2022-05-13 2.22 Bottom Line: We are short the DXY index as of 104.8. We recommend sticking with this position. Feature The dollar very much remains well bid (Chart 1). But the macroeconomic environment that has helped the dollar is likely to reverse. As inflation in the US cools, especially relative to other DM economies, the policy divergence between the US and other economies will move in the opposite direction (Chart 2 and Chart 3). Chart 1Long Dollar Positions Still Profitable
Month In Review: Recession Risk
Month In Review: Recession Risk
Chart 2Is Relative Inflation Peaking In The US
Is Relative Inflation Peaking In The US
Is Relative Inflation Peaking In The US
Chart 3The Dollar And Interest Rates
The Dollar And Interest Rates
The Dollar And Interest Rates
Last month, we posited that interest rate differentials played a key role in pushing the dollar higher but have not been the sole factor. The safe-haven premium in the DXY is around 8-10%. That premium will remain if growth concerns are at the forefront of investors’ minds but will evaporate otherwise. Over the last few weeks, we have had a few surprises from central banks, notably the ECB and the RBA. In this Month-In-Review, we go over our current currency thinking, and implications for portfolio strategy. US Dollar: Peak Hawkishness? Chart 4Is Inflation Peaking In The US
Is Inflation Peaking In The US
Is Inflation Peaking In The US
The dollar DXY index is up 7.4% year to date. However, over the last month, there has been a big reversal in the dollar, down 1.5% month-to-date. As a momentum currency, technical forces are moving against the greenback. Incoming data for the US remains robust, but a peak in inflation expectations, that will temper the pace of Fed interest rate hikes, has been driving dollar momentum. Headline CPI is expected to come in at 8.3% in May, while the core measure should decelerate to 5.9%. It is possible that these numbers surprise to the downside. For example, used car prices, an important contribution to US CPI, are rolling over sharply (panel 2). Overall, supply-side price pressures appear to be easing (panel 3). The US added 390K jobs in May, so the employment report remains robust. Encouragingly, the participation rate is also picking up. This suggests the US can absorb more willing workers before we see additional upward pressure in wage growth. We are closely watching the Atlanta Fed wage growth tracker (panel 4). The ISM manufacturing index had a solid print of 56.1 in May, but the prices paid index dipped from 84.6 to 82.2. As we highlighted above, these developments have sapped market expectations for aggressive interest rate increases in the US relative to other G10 countries. Speculative froth in the dollar is also unwinding (panel 5). We went short the DXY index at 104.8, with a stop loss at 107. We recommend sticking with this position. The Euro: A European Soft Landing? Chart 5The Euro Has Priced A Recession
The Euro Has Priced A Recession
The Euro Has Priced A Recession
The euro is down 6.6% year-to-date. Over the last month, the euro is up 0.7%. The ECB cemented the fact that interest rates are headed higher this week. With a mandate of taming inflation, the central bank faces a tough job of reigning in price pressures, while engineering a soft landing in the economy. From the perspective of the euro, it is our view that most of the downside risks to this scenario have been priced in, while upside surprises have not (panel 1). Incoming data from the euro area has been improving. The Sentix Investor Confidence index ticked up in June. Energy prices remain high, but momentum has been softening. The ZEW expectations survey also delivered an upside surprise in May. The key point from an FX perspective is that the euro has already priced a recession in the European economy, but no prospect of a soft landing. That is positive from a contrarian perspective. With HICP inflation at 8.1% (panel 2), emergency monetary settings are no longer required, and the ECB should lift rates. As we suggested last month, a “least regrets” approach will gently nudge rates higher to address inflationary pressures but pay attention to cyclical sectors of the economy (panel 3). It is important to remember that interest rates in the eurozone are still at -0.5%. Related Report Foreign Exchange StrategyMonth In-Review: A Hefty Safe-Haven Premium In The Dollar We remain long EUR/GBP on the prospect that the ECB could better engineer a soft landing, compared to the BoE. We also remain sellers of the EUR/JPY cross. In a risk-off environment, EUR/JPY will collapse. In a Goldilocks scenario, the cross has already priced in a much stronger global economy (panel 4). This is also a perfect hedge for a pro-cyclical currency positioning. The Japanese Yen: Back To Carry Trades Chart 6The Yen Will Soon Bottom
The Yen Will Soon Bottom
The Yen Will Soon Bottom
The Japanese yen is down 14.3% year-to-date, the worst performing G10 currency this year. Over the last month, the yen is down 2.9%. The yen is a classic case of the risks of fighting the trend in currency markets (panel 1). That said we remain buyers, rather than sellers, on weakness. The drivers of the yen have been very clear and absolute. First, rising interest rates abroad, as we saw this week, have put selling pressure on the JPY (panel 2), given the BoJ will maintain yield curve control. Second, the pickup in energy prices continues to deflate the Japanese trade balance. These are negative shocks that are likely to continue inflicting pain on yen long positions in the near term. From a contrarian perspective, there is solace for yen bulls. First, it is the cheapest G10 currency according to our PPP models. It also happens to be one of the most heavily shorted currencies, according to CFTC data (panel 4). In terms of data, there have also been positive surprises over the last month. The Eco Watcher’s Survey surprised to the upside. PMIs have rebounded above 50. Inflation is above the 2% target and should keep rising. Machinery orders are picking up. The Bank of Japan is likely to stay dovish next week but that is largely priced in. Meanwhile, the BoJ will have no choice but to pivot if inflationary pressures prove stronger than they anticipate, and/or the output gap in Japan closes much faster as demand recovers. We have no active position on the yen right now but will be buyers on weakness. British Pound: Sterling And A Policy Mistake Chart 7Cable Is At Risk Near Term
Cable Is At Risk Near Term
Cable Is At Risk Near Term
The pound is down 7.6% year to date. Over the last month, the pound is up by 1.3%. We wrote a report on sterling last week. In our view, sterling faces headwinds in the near term but is likely to be a profitable long position for investors with a more structural view. First, the deterioration in the UK’s trade balance is cyclical and not structural. Fuels constitute 11% of UK imports so higher energy prices are affecting the balance of trade. This will soon reverse. Second, goods imports have picked up, but it is encouraging that a huge share has been machinery and transport equipment. Inflation remains a problem in England, with CPI at 9%. In our view, while sterling is pricing in a policy mistake by the BoE – tightening too fast into a slowing economy, our bias is that the BoE can engineer a soft landing for the economy. Only one-third of the rise in UK inflation has been driven by demand-side pull, with the balance related to supply-side factors. The latter have been the usual suspects – rising energy costs, supply shortages, and even legacies of the Brexit shock (Chart 10). These could ease going forward. We are currently long EUR/GBP. This cross still heavily underprices the risks to the UK economy in the near term. However, if recession fears ease, our suspicion is that cable is poised for a coiled spring rebound. Canadian Dollar: The BoC Will Stay Hawkish Chart 8CAD Should Benefit From Terms Of Trade
CAD Should Benefit From Terms Of Trade
CAD Should Benefit From Terms Of Trade
The CAD is down 0.6% year to date. Over the last month, it is up 2.4%. The CAD has been the best performing G10 currency this year after the DXY, and the key drivers of loonie strength will persist. First, the CAD will benefit from a terms-of-trade boost, given it is trading at a discount to prevailing oil prices. Second, the BoC will stay hawkish, having hiked interest rates by 50 bps last month, and telegraphing more tightening going forward. Economic data out of Canada suggests tighter monetary policy is warranted. Both headline and core inflation remain strong, with headline inflation at 6.8% in April. The common, trim, and median inflation prints were at 3.2%, 5.1%, and 4.4%, respectively, well above the BoC’s target. This continues to suggest inflationary pressures in Canada are broad based (panel 2). House prices are rolling over so the wealth effect could temper hawkishness from the BoC. However, recent speeches from policy officials have highlighted a need to tame housing price pressures in Canada (panel 4). We remain buyers of the CAD on a lower dollar but are monitoring risks from a tightening in financial conditions. New Zealand Dollar: Will Weaken At The Crosses Chart 9The RBNZ Is Trying To Engineer A Soft Landing
The RBNZ Is Trying To Engineer A Soft Landing
The RBNZ Is Trying To Engineer A Soft Landing
The NZD is down 6.6% this year. Over the last month, the kiwi is down 1.0%. The RBNZ hiked interest rates by 50 bps in May, taking the overnight rate to 2%. This seems to be having the intended effect, with house price inflation rolling over as mortgage rates adjust higher. This “least regrets” approach is likely to continue in the short term. The labor market is extremely tight, with a shortage of high skilled labor given immigration has slowed. This is leading to substantial wage increases. As such, the RBNZ has been increasing guidance for annual CPI inflation, and therefore, interest rates, raising its overnight projection for June 2023 to 3.9% from 2.8%. There is reason to believe the RBNZ will tone down its hawkish rhetoric. For one, terms of trade are softening. Dairy prices, circa 20% of exports, are down 1% this month after reaching a 10-year high in May. A domestic slowdown is also likely to nudge the RBNZ toward more accommodation. In a nutshell, the kiwi has upside versus the dollar, but will underperform at the crosses. Australian Dollar: Our Top Pick Against The Dollar Chart 10The RBA Will Continue To Hike
The RBA Will Continue To Hike
The RBA Will Continue To Hike
The Australian dollar is down 2.3% year to date. Over the last month, the AUD is up 2%. The Reserve Bank of Australia raised interest rates by 50 bps this week, a surprise to markets, but in line with the hawkish tone telegraphed in prior meetings. Inflation in Australia is surprising to the upside. Meanwhile, unemployment remains well below NAIRU. As a result, an exit from emergency monetary settings makes sense. The key will be whether the RBA can engineer a soft landing in the Aussie economy. Job gains remain robust, and both the unemployment rate and the participation rate are at healthy levels. Terms of trade are holding up, and wage gains are improving. Home prices are rolling over, but it is a welcome development as the RBA is trying to calibrate financial conditions. We are long the AUD as of 72 cents. The big concern for this trade is China, and the potential for renewed lockdowns that will hurt the external balance. As such, we expect this trade to be volatile near-term, but pay off over a longer horizon. Swiss Franc: A Safe Haven Chart 11The SNB Will Stay Constructive On The Franc
The SNB Will Stay Constructive On The Franc
The SNB Will Stay Constructive On The Franc
The Swiss franc is down 7% year-to-date, but up versus the dollar over the last month. Swiss economic conditions have been rather resilient. GDP expanded by 0.5% in Q1, slightly above expectations, while industrial production also rose 2.4% in the same period. In April, Switzerland’s trade surplus widened to CHF 3.8bn, boosted by demand for machinery and chemicals. In May, the KOF leading indicator clocked 96.8 and the manufacturing PMI stood at 60, a slowdown month-on-month but still a very healthy reading. Inflation is surprising to the upside in Switzerland. Headline and core CPI growth came in at 2.9% and 1.7% year-on-year in May, respectively. Recently, several SNB board members have voiced the primacy of price stability and preparedness to hike rates if inflation becomes broad based. This has helped support the franc. The market now expects SNB to follow the ECB in removing the NIRP starting in September. But it is always good to remember that the Swiss franc is a defensive currency, so a path to policy normalization still presents upside for EUR/CHF. In our trading book, we are short CHF/SEK, but will take profits if Thomas Jordan proves to be more of an inflationary hawk. Norwegian Krone: Bullish On A 12-to-18 Month Horizon Chart 12The Norges Bank Will Stay Hawkish
Month In Review: Recession Risk
Month In Review: Recession Risk
NOK is down 8.1% year to date and up 1.5% over the last month. In the three months through March, Norway’s GDP contracted by 1% quarter on quarter, led by drops in private consumption (1.5%), government spending (1.4%), and exports (3.5%). The decline largely reflects restriction measures imposed at the start of the year. That said, economic growth is rebounding and GDP growth will be around 3% in the next 12 months. Meanwhile, the trade surplus remains very healthy at 92.6bn NOK. As a result, the current account surplus hit at an all-time high of 341bn NOK in Q1. From a broader perspective, incoming numbers in Norway reflect a slowdown in global growth. Consumer confidence dropped to the lowest levels since 2016. The manufacturing PMI fell sharply to 54.9 in May, the lowest reading in over a year. Industrial production also decreased by 0.5% month-on-month in April. That said, the labor market continues to tighten. The unemployment rate fell to 1.7% in May, significantly below Norge Bank’s 2% projection. Renewed immigration might help alleviate some of the labor market tightness, but the strength in employment trends is very evident. As a result, our bias is that the committee will stick to its quarterly 25bps hikes, but upside surprises to this baseline are non-trivial. Terms of trade are a tailwind for Norway. In particular, NOK/SEK can be an attractive bet on a 12-month horizon, should oil prices remain firm. Swedish Krona: Into A Capitulation Phase Chart 13More Hawkish Surprises From The Riksbank
More Hawkish Surprises From The Riksbank
More Hawkish Surprises From The Riksbank
The SEK is down 8.7% year to date and up 1.6% over the last month. Sweden sits right at the crosshairs of the Russia-Ukraine conflict. As a result, inflation remains a problem with CPIF at 6.4%, year-over-year in April, above updated projections from Riksbank. The issue is that there are rising risks that inflation will not be transitory, raising the prospect of a policy surprise from the Riksbank. The OIS curve is now pricing in a 1.75% policy rate by year-end. In our view, this will be a baseline scenario. The critical point is whether the Riksbank is on the verge of making a policy mistake. Economic growth is slowing. Swedish GDP contracted by 0.8% in Q1 from the previous quarter. However, if policymakers are overly fixated on inflation, the prospect of grinding the Swedish economy to a halt becomes a rising risk. Major rounds of collective wage negotiations early next year, affecting as much of as 40% of total labor force, is a risk to monitor. There is already some evidence of a slowdown in economic activity. Consumers reported the lowest level of confidence since the Global Financial Crisis. PMIs remain resilient, well above 50 but the risk is to the downside. Should the Chinese credit impulse bottom and supply constraints ease, economic activity will pick up in the second half of the year, but the risk of downside surprises are worth monitoring. The bottom line is that SEK has already priced in much of the negative news and remains undervalued in our models. We are short CHF/SEK on these grounds, a position 1.5% in the money. Chester Ntonifor Foreign Exchange Strategist chestern@bcaresearch.com Trades & Forecasts Strategic View Cyclical Holdings (6-18 months) Tactical Holdings (0-6 months) Limit Orders Forecast Summary
The ECB’s June Monetary Policy Statement started with “high inflation is a major challenge for all of us. The Governing Council will make sure that inflation returns to our two percent target over the medium term.” This hawkish message set the tone for the…
Executive Summary Natural Gas Markets Eerily Quiet
Natgas Markets: The Eye Of The Storm
Natgas Markets: The Eye Of The Storm
An eerie calm in European natural gas markets belies the state of war in Ukraine that already is producing a cutoff of Russian natgas supplies in retaliation for the EU’s oil embargo. Such cutoffs will accelerate, and send natgas prices in Europe and Asia sharply higher if they occur sooner – as we expect – rather than later. The US will continue to send most of its LNG exports to Europe. These exports are expected to average 12 Bcf/d this year, up 22% from last year’s level. Planners in Europe and Asia will want to secure as much natgas supply as possible by the end of October to refill storage for the November-March withdrawal season, which is beginning to look like another La Niña winter. The US Climate Prediction Center makes the odds of such an event, which is associated with colder-than-normal winters in the Northern Hemisphere, just over 60%. Bottom Line: European governments are preparing their citizens for natgas rationing, in the event of a cutoff of Russian gas. This will occur sooner rather than later. In its wake, EU GDP will fall, and inflation will rise as knock-on effects constrict base metals, fertilizer and food supplies. At tonight’s close, we will be getting long 1Q23 TTF futures on the ICE, expecting prices to again exceed €225/MWh. Feature Related Report Commodity & Energy StrategyHigher Gasoline, Diesel Prices Ahead Russia is at war with Ukraine. NATO military support for Ukraine – with the EU at the forefront – is being maintained at a high level, and Ukrainian forces are vigorously defending their homeland.1 The EU embargoed Russian oil imports to sharply reduce funding for Russia’s war machine. Russia will be compelled to follow through on its threat to cut off pipeline gas shipments to Europe, following the embargo.2 It is highly doubtful Russia will countenance the timetable envisioned in the EU embargo, which calls for a phase-out of oil imports by yearend that removes close to 3mm b/d, or 90% of Russia’s sales into its largest market (Chart 1). Equally doubtful is the notion the EU will countenance funding Russia’s war on Ukraine over the course of such a phase-out. Our colleague Matt Gertken, who runs BCA’s Geopolitical Strategy, demonstrated that while such a phase-out schedule may be optimal for both sides – i.e., it prolongs revenue flows to Russia and gas flows to the EU – it almost surely is not an equilibrium.3 An equilibrium in this prisoners’ dilemma obtains when both sides act immediately to end their vulnerability to the other unilaterally upsetting the optimal state – i.e., endure short-term pain for long-term gain (Diagram 1). For this reason, we believe Russia’s cutoff of natgas shipments to the EU will occur sooner rather than later, to inflict maximum pain on the EU going into the coming winter season. The EU knows this, and is preparing its citizens for rationing of natgas. Chart 1EU’s Russian Oil Embargo Cuts Sales By 90% By Year-end
Natgas Markets: The Eye Of The Storm
Natgas Markets: The Eye Of The Storm
Diagram 1The EU, Russia Prisoners’ Dilemma
Natgas Markets: The Eye Of The Storm
Natgas Markets: The Eye Of The Storm
Russian Natgas Cutoff To The EU Underway Russia already has begun reducing natural gas supplies to the EU (Chart 2). Russian gas flows to Finland, Poland, Bulgaria, Netherlands, and Denmark were embargoed after these states refused to pay for gas in rubles (Chart 3). Russia reduced gas shipments to Germany – albeit marginally – after Shell refused to pay for natgas supplied to Germany in rubles. While this only disrupted 1.3% of total natgas consumption in Germany, it showed Russia will quickly act against what it views as “unfriendly” customers.4 Ukraine was forced to shut a gas transit point through which 8% of total Russian gas flows reach Europe, after Russian occupying forces were found to be siphoning gas, according to Gas Transmission System Operator of Ukraine (GTSOU). As a result, gas flows from Russia have taken a further hit and have not recovered (Chart 4). EU member states whose supply of Russian gas has been disrupted will need to search for alternatives. Orsted, an energy company supplying natgas to Denmark, stated it will source gas from the EU market. Given supply constraints in Europe, an increase in the number of bids on the single EU market will raise the Dutch Title Transfer Facility (TTF), all else equal. Chart 2Russia Starts Cutting Gas Flows
Russia Starts Cutting Gas Flows
Russia Starts Cutting Gas Flows
Chart 3Russian Gas Flows To EU Falling Overall...
Russian Gas Flows To EU Falling Overall...
Russian Gas Flows To EU Falling Overall...
Chart 4...Particularly Via Ukraine
...Particularly Via Ukraine
...Particularly Via Ukraine
Higher TTF prices will direct gas flows from the US to Europe, reducing gas available for domestic consumption. LNG gas exports to Europe have maintained their upward trend since 2016 and were up by 87% (674 BCF) in 1Q22 vs the same period in 2019 (Chart 5). Chart 5US LNG Exports To Europe Surge
Natgas Markets: The Eye Of The Storm
Natgas Markets: The Eye Of The Storm
Simultaneously, the US witnessed its largest inventory withdrawal this winter in the last four years (Chart 6). Warmer-than-normal temperatures and drought conditions in the US also are increasing domestic demand, as electricity companies are forced to substitute hydroelectric power with natgas-fired generation. Increased exports and weather phenomena have combined to push the Henry Hub contract above $9.50/MMBtu this week, the highest level since 2008. Chart 6US Natgas Inventories Slowly Filling
Natgas Markets: The Eye Of The Storm
Natgas Markets: The Eye Of The Storm
US LNG Exports To Europe Surge Higher European prices for US natgas have disincentivized shipments to Asia, where prices – measured by the Japan Korea Marker (JKM) – have been trading below the TTF so far this year on average (Chart 7). This has allowed European gas inventories to refill at a rapid pace. As of 4 June, the EU’s working gas inventories were ~49% full and are above last year’s level for this time of the year (Chart 8). Chart 7Natural Gas Markets Eerily Quiet
Natgas Markets: The Eye Of The Storm
Natgas Markets: The Eye Of The Storm
Chart 8European Gas Storage Refill Off To A Good Start
Natgas Markets: The Eye Of The Storm
Natgas Markets: The Eye Of The Storm
Shanghai’s reopening will propel Chinese economic activity and demand for natgas, making an already tight global natural gas market tighter. However, the risk of rolling lockdowns in China will keep Asia’s LNG demand in check.5 LNG vessel charter rates have increased sharply since the Russia-Ukraine war began, largely on the back of European demand (Chart 9). We expect this to be a regular feature of the international gas market going forward, as more LNG export capacity is added in the US – it will rise to 12.6 Bcf/d next year, e.g. – and global demand remains strong. Chart 9Surge in LNG Charter Rates
Surge in LNG Charter Rates
Surge in LNG Charter Rates
Europe Is Critically Short LNG Infrastructure Most of the EU’s existing 158 Bcm of annual regasification capacity is located around the Iberian Peninsula (Chart 10), which is not well-connected to the rest of Europe. As a result, to substitute Russian piped gas for LNG imports, investments for import terminals and regasification capacity will be required. In its REPowerEU program the European Commission expects to move closer to complete independence from Russian fossil fuels by importing an additional 50 Bcm of LNG per year, reducing demand, and ramping up renewable energy. Germany is aiming for independence from Russian gas flows by planning a shoreside LNG terminal and ordering four Floating Storage and Regasification Units (FSRUs). The FSRUs, which are expected to come online between year-end and the start of next year will have a combined capacity under 24 Bcm per year. Chart 10Europe Needs More Re-Gasification Capacity
Natgas Markets: The Eye Of The Storm
Natgas Markets: The Eye Of The Storm
These plans, however, are not aligned with the nation’s pathway to go carbon neutral by 2045. An environmental activist group has filed a lawsuit to halt the construction of the LNG terminal. The group also is opposed to Germany’s draft LNG acceleration bill, which will allow imports until two years before 2045.6 This reflects two problems all EU nations will face as they transition to LNG from pipeline Russian gas imports. Firstly, member states will need to invest billions of euros in new LNG capacity, and given current politics, likely will have to decide to scrap or repurpose this infrastructure in during the transition to green energy. Opposing this possibility is the high likelihood that EU states will need to enter long-term LNG contracts to ensure supply security and shield themselves from volatile natgas prices. For the immediate future, the EU likely will kick this can down the road for as long as possible. Investment Implications Back in March, Germany and Austria began preparing their citizens for natgas rationing.7 Now the IEA is warning all of Europe the likelihood of such action is increasing rapidly.8 State and local planners throughout Europe will spend the next five months or so lining up as much LNG and pipeline gas as possible going into the coming winter season. While the inventory-injection in Europe is off to a good start, planners most likely hope to exceed their minimum target for filling 80% of storage in time for the November-March withdrawal season. In addition to the risk of a Russian cutoff of supplies, planners have to account for a higher likelihood of a colder-than-normal winter, given the odds of another La Niña winter, which is associated with colder-than-normal winters in the Northern Hemisphere. The US Climate Prediction Center makes the odds of such an event – the third such event in as many years – just over 60%. If European states are forced to implement rationing of natgas, knock-on effects resulting from prioritizing human needs over industrial concerns will, once again, restrict base metals, fertilizer and food supplies. We remain long energy, metals and grains exposure via the S&P GSCI and COMT ETF as the natural-gas drama in Europe plays out. In addition, we remain long the XOP, XME, PICK, and CRAK ETFs to maintain our equity exposure to industrial commodities. At tonight’s close, we will be getting tactically long 1Q22 futures on the ICE, expecting prices to again exceed €225/MWh. This will complement our existing tactical commodity exposures in 4Q22 TTF futures. Robert P. Ryan Chief Commodity & Energy Strategist rryan@bcaresearch.com Ashwin Shyam Research Analyst Commodity & Energy Strategy ashwin.shyam@bcaresearch.com Paula Struk Research Associate Commodity & Energy Strategy paula.struk@bcaresearch.com Commodities Round-Up Energy: Bullish US refined product demand rose just under 4% for the week ended 3 June 2022, led by a surge in jet-fuel demand of 26.5% yoy – finishing at 1.6mm b/d vs. 1.26mm b/d the year earlier, according to the US EIA. This provides further evidence consumer pent-up demand for travel is being released, after the long shut-downs in travel caused by COVID-19 beginning in 1Q20. The surge in jet-fuel demand was enough to offset yoy declines in gasoline and distillates such as diesel fuel and heating oil of 0.9% and 2.8%, respectively. Gasoline inventories were down 800k barrels yoy, which put them 10% below their five-year average level at the end of the reporting week. Distillate inventories rose 2.6mm barrels, but this still left them 23% below their five-year average. Crude oil inventories in the US including those in the Strategic Petroleum Reserve (SPR), which is being drawn down to provide charging stock to refiners, drew 7.3mm barrels, and stood at 519mm barrels. Versus year-ago levels, crude inventories including the SPR are down 17%. Base Metals: Bullish Copper production in Chile fell 9.8% yoy in April as state-owned copper giant Codelco’s monthly supply fell 6.1% yoy to 116,000 tons. In Peru, protests against mines by displaced communities have seen suspensions in copper mine production, including that of MMG-owned Las Bambas. Although the International Copper Study Group (ICSG) expects a physical surplus for refined copper markets next year, falling production in Chile and civil unrest in Peru continue to plague the rebuilding of stocks (Chart 11). Globally, a risk matrix we reproduced in a report last year showed that approximately 570 million Metric Tons of copper faced a significant ESG risk.9 This increases the risk of new copper projects being stymied by activist groups, and further curtailing future copper production. Precious Metals: Bullish According to data from World Gold Council, gold ETFs faced net outflows in May as the USD and interest rates strengthened, following the Fed rate hikes (Chart 12). In his speech, Fed Governor Christopher Waller explained that by increasing interest rates, the Fed aims to match labor demand to supply and reduce wage growth, which in turn will lower inflation.10 This, however, does not deal with high inflation via the mechanism of elevated food and fuel prices, which will remain high as long as supply disruptions continue in these markets. Chart 11
LME Copper Stocks Going Down
LME Copper Stocks Going Down
Chart 12
Natgas Markets: The Eye Of The Storm
Natgas Markets: The Eye Of The Storm
Footnotes 1 Please see The Institute For The Study Of War for daily updates of the Russia-Ukraine war. 2 Please see Higher Gasoline, Diesel Prices Ahead, which we published last week, for further discussion of the EU’s embargo of Russian oil imports. The EU embargo initially will be on Russian seaborne oil imports, which will tighten global crude oil and refined-product markets further. Pipeline imports are due to phase out by year-end. Cumulatively, this will translate to a 90% decrease in Russian crude and product exports to the EU, representing ~ 3mm b/d of lost sales. Our report is available at ces.bcaresearch.com. 3 Please see Energy Cutoff Continues (GeoRisk Update), published by BCA Research’s Geopolitical Strategy on June 1, 2022. It is available at gps.bcaresearch.com. 4 According to a recent report from Gemeinshcafts Diagnose institution prepared on behalf of Germany’s Federal Ministry of Economics and Climate Protection, if Russia embargos oil and gas to Germany immediately the German economy will fall into a sharp recession. The cumulative loss to macroeconomic output in 2022 and 2023 will amount to 220 billion euros, or more than 6.5% of annual economic output. 5 For more on the risk of rolling lockdowns in China, please see Not The Time To Be A Contrarian, published by BCA’s Emerging Markets Strategy on May 19, 2022. 6 Please see Germany’s Cabinet Moves to Head Off Lawsuits Against LNG Terminals, published by The Maritime Executive on May 11, 2022 7 Please see Germany Closer To Rationing Natgas, which we published on March 31, 2022. 8 Please see Europe at risk of winter energy rationing, energy watchdog warns, published by ft.com on June 8, 2022. 9 Please see Renewables ESG Risk Grows With Demand, which we published on April 29, 2022 10 For the speech, please see Responding to High Inflation with Some Thoughts on a Soft Landing. Investment Views and Themes Recommendations Strategic Recommendations Tactical Trades Trades Closed in 2022
Executive Summary The Efficient Market Hypothesis (EMH) is flawed. This Holy Grail of financial economics assumes that investors are a homogenous bunch with identical investment horizons, when the reality is that investors have a wide spectrum of time horizons. The alternative but less well-known Fractal Market Hypothesis (FMH) recognizes that investors with different time horizons interpret the same facts and information differently. The key conclusion of the FMH is that when the different investment horizons are all active in the market, the price reflects all available information, meaning that the market is efficient, liquid, and stable. But when the different investment horizons start to converge and coalesce, the market becomes inefficient, illiquid, and vulnerable to a trend reversal. Using the FMH over the past six months, 5 structured recommendations were closed in profit: Short ILS/GBP, Short Coffee versus Cocoa, Short World Basic Resources versus Market, Long EUR/CHF, and Short Semiconductors versus Tech. Against this, 3 structured recommendations were closed in loss: Short Nickel versus Silver, Long Polish Bonds versus US Bonds, and Short World Semiconductors versus Biotech. Within the 10 open trades, 3 are in healthy profit, 4 are flat, and 3 are in loss. The Efficient Market Hypothesis Does Not Describe The Truth; The Fractal Market Hypothesis Does
Fractal Trading Update - June 2022
Fractal Trading Update - June 2022
Bottom Line: As few investors are aware of the Fractal Market Hypothesis, it gives a competitive advantage to those that use it to identify potential trend reversals. Feature For nations and societies, disagreement and conflict are unhealthy. But for financial markets, the opposite is true – it is the lack of disagreement and conflict that is unhealthy. This is because the market needs disagreement to generate liquidity, the ability to trade quickly and in large volume without destabilizing the market price. If I want to buy a share, then somebody must sell me that share. It follows that I and the seller must disagree about the attractiveness of the share at the current price. Likewise, if I and like-minded individuals want to buy ten million shares, it follows that lots of market participants must disagree with us. If lots of market participants do not disagree with us, there will be insufficient liquidity to complete the transaction without a price change. And if too many people are engaged in groupthink, the price change could be extreme. Markets Become Inefficient When There Is Not Enough Disagreement How can there be major disagreement about the attractiveness of an investment when we all have access to the same facts and information? According to the Efficient Market Hypothesis (EMH) there cannot be, because asset prices always reflect all available information.1 Unfortunately, the Efficient Market Hypothesis is flawed. This Holy Grail of financial economics assumes that investors are a homogenous bunch with identical investment horizons, when the reality is that investors have a wide spectrum of time horizons – ranging from the milliseconds of momentum-driven high-frequency trading (HFT) to the decades of a value-driven pension fund. The market is efficient only when a wide spectrum of investment horizons is setting the price, signified by the market having a rich fractal structure. The alternative but less well-known Fractal Market Hypothesis (FMH) recognizes the reality of different time horizons. Crucially, the FMH acknowledges that investors with different time horizons interpret the same facts and information differently. In other words, they disagree (Box I-1). Box 1-1The Efficient Market Hypothesis Does Not Describe The Truth; The Fractal Market Hypothesis Does
Fractal Trading Update - June 2022
Fractal Trading Update - June 2022
For example, the momentum-based high frequency trader might interpret a sharp one-day sell-off as a sell signal, but the value-based pension fund might interpret the same information as a buying opportunity. This disagreement will create liquidity without requiring a big price adjustment. Thereby it also fosters market stability. The key conclusion of the Fractal Market Hypothesis is that when the different investment horizons are all active in the market, the price does reflect all available information, meaning that the market is efficient, liquid, and stable. But when the different investment horizons start to converge and coalesce, the market becomes inefficient, illiquid, and vulnerable to a trend reversal. Buy and sell orders will no longer match without a price change, possibly extreme. Can we measure the loss of efficiency in a specific investment, and thereby anticipate a potential trend reversal? The answer is yes, by monitoring its fractal dimension, using the expression in the Appendix. Although many readers may find the concept of a fractal dimension intimidating, the idea is simple and intuitive. It just measures the complexity – or information content – in an object or structure. Thereby, when an investment’s fractal dimension reaches its lower limit, it warns that the information content of longer-term investors is missing from the price. When the longer-term investors do ultimately re-enter the price setting process, the question is: will they endorse the recent trend because of some major change in the fundamentals – such as the start of the Russia/Ukraine war? Or will they reject it, as an unjustified deviation from a fundamental anchor. In most cases, it is the latter: a rejection and a trend reversal. As few investors are aware of the Fractal Market Hypothesis, it gives a competitive advantage to those that use it to identify potential trend reversals. Fractal Trading Update Using the Fractal Market Hypothesis over the past six months, 5 structured recommendations were closed in profit: Short ILS/GBP, Short Coffee versus Cocoa, Short World Basic Resources versus Market, Long EUR/CHF, and Short Semiconductors versus Tech. A fragile fractal structure warns of a crowded trade. One structured recommendation was closed flat: Short Personal Goods versus Consumer Services. Against this, 3 structured recommendations were closed in loss: Short Nickel versus Silver, Long Polish Bonds versus US Bonds, and Short World Semiconductors versus Biotech. Within the 10 open trades, 3 are in healthy profit, 4 are flat, and 3 are in loss. As for the unstructured recommendations, for which we do not define profit targets or expiry dates, we are pleased to report that out of 31 recommendations, only 2 failed to experience a countertrend reversal. Wins 1) November 18th: Short ILS/GBP Achieved its profit target of 4.2 percent. 2) November 25th: Short Coffee versus Cocoa (Chart I-1) Achieved almost half of its 30 percent profit target at expiry. Chart I-1Fractal Analysis Correctly Predicted A Reversal In Coffee Versus Cocoa
Fractal Analysis Correctly Predicted A Reversal In Coffee Versus Cocoa
Fractal Analysis Correctly Predicted A Reversal In Coffee Versus Cocoa
3) January 20th: Short World Semiconductors versus Tech (Chart I-2) Achieved its profit target of 6 percent. Chart I-2Fractal Analysis Correctly Predicted A Reversal In World Semiconductors Versus Technology
Fractal Analysis Correctly Predicted A Reversal In World Semiconductors Versus Technology
Fractal Analysis Correctly Predicted A Reversal In World Semiconductors Versus Technology
4) March 10th: Long EUR/CHF Achieved its profit target of 3.6 percent. 5) April 14th: Short World Basic Resources versus Market (Chart I-3) Achieved its profit target of 11.5 percent. Chart I-3Fractal Analysis Correctly Predicted A Reversal In World Basic Resources Versus Market
Fractal Analysis Correctly Predicted A Reversal In World Basic Resources Versus Market
Fractal Analysis Correctly Predicted A Reversal In World Basic Resources Versus Market
In addition, Short World Personal Goods versus Consumer Services which was opened on December 9th reached a high-water mark of 10.5 percent but expired flat. Losses 1) December 2nd: Short World Semiconductors versus Biotech Hit its stop loss of 9.5 percent. 2) January 13th: Long Poland versus US: 10-Year Government Bonds Reached a high-water mark of 3.7 percent, but then reversed to hit its stop loss of 8 percent. In the current geopolitical crisis, Poland has been a casualty due to its lengthy border with Ukraine. 3) February 3rd: Short Nickel versus Silver (Chart I-4) Hit its stop loss at 20 percent following an explosive short-squeeze rally in the Nickel price. Chart I-4Nickel's Short-Squeeze Rally Forced A Price Trend Prolongation
Nickel's Short-Squeeze Rally Forced A Price Trend Prolongation
Nickel's Short-Squeeze Rally Forced A Price Trend Prolongation
Open Trades 1) January 27th: Long MSCI Korea versus All-Country World (Chart I-5) Open, in profit, having reached a high-water mark of 6 percent (versus an 8 percent target). Chart I-5Fractal Analysis Correctly Predicted A Rebound In Korea Versus All-Country World
Fractal Analysis Correctly Predicted A Rebound In Korea Versus All-Country World
Fractal Analysis Correctly Predicted A Rebound In Korea Versus All-Country World
2) February 24th: Long US Biotech versus US Tech Open, in profit, having reached a high-water mark of 10.5 (versus a 17.5 percent target). 3) March 3rd: Short World Banks versus Consumer Services Reached a high-water mark of 7.3 percent (versus a 12 percent target), but then reversed and is in loss. 4) March 24th: Long 5-Year T-bond Open, in modest loss. 5) April 7th: Short World Non-Life Insurance versus Homebuilders (Chart I-6) Open, in profit having reached a high-water mark of 12.4 percent (versus a 14 percent target). Chart I-6Fractal Analysis Correctly Predicted A Reversal In World Non-Life Insurance Versus Homebuilders
Fractal Analysis Correctly Predicted A Reversal In World Non-Life Insurance Versus Homebuilders
Fractal Analysis Correctly Predicted A Reversal In World Non-Life Insurance Versus Homebuilders
6) April 7th: Long JPY/CHF Reached a high-water mark of 3.4 percent versus a 4 percent target, but then reversed into modest loss. This suggests that the trade needed a narrower profit target. 7) April 28th: Short High Dividend ETF versus US 10-Year T-bond Open, in modest loss, having reached a high-water mark of 2.9 percent (versus a 6 percent target). 8) May 19th: Short FTSE 100 versus STOXX Europe 600 Open, and flat. 9) June 2nd: Long JPY/USD (Chart I-7) Open, and flat. Chart I-7The Sell-Off In JPY/USD Has Reached A Potential Turning Point
The Sell-Off In JPY/USD Has Reached A Potential Turning Point
The Sell-Off In JPY/USD Has Reached A Potential Turning Point
10) June 2nd: Short Australia Basic Resources versus World Market (Chart I-8) Open, and flat. Chart I-8The Australian Basic Resources Sector Is Vulnerable To Reversal
The Australian Basic Resources Sector Is Vulnerable To Reversal
The Australian Basic Resources Sector Is Vulnerable To Reversal
Our full watchlist of 29 investments that are at, or approaching turning points, is available on our website: cpt.bcaresearch.com Appendix: Calculating The Fractal Dimension Of A Financial Market
Fractal Trading Update - June 2022
Fractal Trading Update - June 2022
Chart 1AUD/KRW Is Vulnerable To Reversal
AUD/KRW Is Vulnerable To Reversal
AUD/KRW Is Vulnerable To Reversal
Chart 2Canada Versus Japan Is Reversing
Canada Versus Japan Is Reversing
Canada Versus Japan Is Reversing
Chart 3Canada's TSX-60's Outperformance Might Be Over
Canada's TSX-60's Outperformance Might Be Over
Canada's TSX-60's Outperformance Might Be Over
Chart 4US Healthcare Providers Vs. Software At Risk of Reversal
US Healthcare Providers Vs. Software At Risk of Reversal
US Healthcare Providers Vs. Software At Risk of Reversal
Chart 5BRL/NZD At A Resistance Point
BRL/NZD At A Resistance Point
BRL/NZD At A Resistance Point
Chart 6Homebuilders Versus Healthcare Services Has Turned
Homebuilders Versus Healthcare Services Has Turned
Homebuilders Versus Healthcare Services Has Turned
Chart 7CNY/USD Has Reversed
CNY/USD Has Reversed
CNY/USD Has Reversed
Chart 8CAD/SEK Is Vulnerable To Reversal
CAD/SEK Reversal Has Started
CAD/SEK Reversal Has Started
Chart 9Financials Versus Industrials To Reverse
Financials Versus Industrials To Reverse
Financials Versus Industrials To Reverse
Chart 10The Outperformance Of Resources Versus Biotech Has Started To Reverse
The Outperformance Of Resources Versus Biotech Has Started To Reverse
The Outperformance Of Resources Versus Biotech Has Started To Reverse
Chart 11The Outperformance Of Resources Versus Healthcare Is Vulnerable To Reversal
The Outperformance Of Resources Versus Healthcare Is Vulnerable To Reversal
The Outperformance Of Resources Versus Healthcare Is Vulnerable To Reversal
Chart 12FTSE100 Outperformance Vs. Euro Stoxx 50 Is Reversing
FTSE100 Outperformance Vs. Euro Stoxx 50 Is Reversing
FTSE100 Outperformance Vs. Euro Stoxx 50 Is Reversing
Chart 13Netherlands Underperformance Vs. Switzerland Is Ending
Netherlands Underperformance Vs. Switzerland Has Been Exhausted
Netherlands Underperformance Vs. Switzerland Has Been Exhausted
Chart 14The Sell-Off In The 30-Year T-Bond Is Approaching Fractal Fragility
The Sell-Off In The 30-Year T-Bond Is Approaching Fractal Fragility
The Sell-Off In The 30-Year T-Bond Is Approaching Fractal Fragility
Chart 15The Sell-Off In The NASDAQ Is Approaching Fractal Fragility
The Sell-Off In The NASDAQ Is Approaching Fractal Fragility
The Sell-Off In The NASDAQ Is Approaching Fractal Fragility
Chart 16Food And Beverage Outperformance Exhausted
Food And Beverage Outperformance Has Been Exhausted
Food And Beverage Outperformance Has Been Exhausted
Chart 17The Strong Trend In The 18-Month-Out US Interest Rate Future Is Fragile
The Strong Trend In The 18-Month-Out US Interest Rate Future Is Fragile
The Strong Trend In The 18-Month-Out US Interest Rate Future Is Fragile
Chart 18The Strong Trend In The 3 Year T-Bond Is Fragile
The Strong Trend In The 3 Year T-Bond Is Fragile
The Strong Trend In The 3 Year T-Bond Is Fragile
Chart 19A Potential Switching Point From Tobacco Into Cannabis
A Potential Switching Point From Tobacco Into Cannabis
A Potential Switching Point From Tobacco Into Cannabis
Chart 20Biotech Is A Major Buy
Biotech Is A Major Buy
Biotech Is A Major Buy
Chart 21Norway's Outperformance Could End
Norway's Outperformance Could End
Norway's Outperformance Could End
Chart 22Cotton Versus Platinum Is Reversing
Cotton Versus Platinum Is Reversing
Cotton Versus Platinum Is Reversing
Chart 23Switzerland's Outperformance Vs. Germany Has Ended
Switzerland's Outperformance Vs. Germany Has Started To End
Switzerland's Outperformance Vs. Germany Has Started To End
Chart 24The Rally In USD/EUR Has Ended
The Rally In USD/EUR Has Ended
The Rally In USD/EUR Has Ended
Chart 25The Outperformance Of MSCI Hong Kong Versus China Is Vulnerable To Reversal
The Outperformance Of MSCI Hong Kong Versus China Is Vulnerable To Reversal
The Outperformance Of MSCI Hong Kong Versus China Is Vulnerable To Reversal
Chart 26A Potential New Entry Point Into Petcare
A Potential New Entry Point Into Petcare
A Potential New Entry Point Into Petcare
Chart 27Czech Outperformance Near Exhaustion
Czech Outperformance Near Exhaustion
Czech Outperformance Near Exhaustion
Chart 28US REITS Are Oversold Versus Utilities
US REITS Are Oversold Versus Utilities
US REITS Are Oversold Versus Utilities
Chart 29GBP/USD At A Turning Point
GBP/USD At A Turning Point
GBP/USD At A Turning Point
Dhaval Joshi Chief Strategist dhaval@bcaresearch.com Hadi Elzein Research Associate hadi.elzein@bcaresearch.com Footnotes 1 Strictly speaking, the EMH assumes there is some disagreement, but that this disagreement is random and follows a standard Gaussian (bell-curve) distribution. Therefore, the EMH assumes that a share price just follows a random walk until new (unpredictable) fundamental information arrives. Fractal Trades
Fractal Trading Update - June 2022
Fractal Trading Update - June 2022
6-Month Recommendations Structural Recommendations Closed Fractal Trades Indicators To Watch - Bond Yields Chart II-1Indicators To Watch - Bond Yields - Euro Area
Indicators To Watch - Bond Yields - Euro Area
Indicators To Watch - Bond Yields - Euro Area
Chart II-2Indicators To Watch - Bond Yields - Europe Ex Euro Area
Indicators To Watch - Bond Yields - Europe Ex Euro Area
Indicators To Watch - Bond Yields - Europe Ex Euro Area
Chart II-3Indicators To Watch - Bond Yields - Asia
Indicators To Watch - Bond Yields - Asia
Indicators To Watch - Bond Yields - Asia
Chart II-4Indicators To Watch - Bond Yields - Other Developed
Indicators To Watch - Bond Yields - Other Developed
Indicators To Watch - Bond Yields - Other Developed
Indicators To Watch - Interest Rate Expectations Chart II-5Indicators To Watch - Interest Rate Expectations
Indicators To Watch - Interest Rate Expectations
Indicators To Watch - Interest Rate Expectations
Chart II-6Indicators To Watch - Interest Rate Expectations
Indicators To Watch - Interest Rate Expectations
Indicators To Watch - Interest Rate Expectations
Chart II-7Indicators To Watch - Interest Rate Expectations
Indicators To Watch - Interest Rate Expectations
Indicators To Watch - Interest Rate Expectations
Chart II-8Indicators To Watch - Interest Rate Expectations
Indicators To Watch - Interest Rate Expectations
Indicators To Watch - Interest Rate Expectations
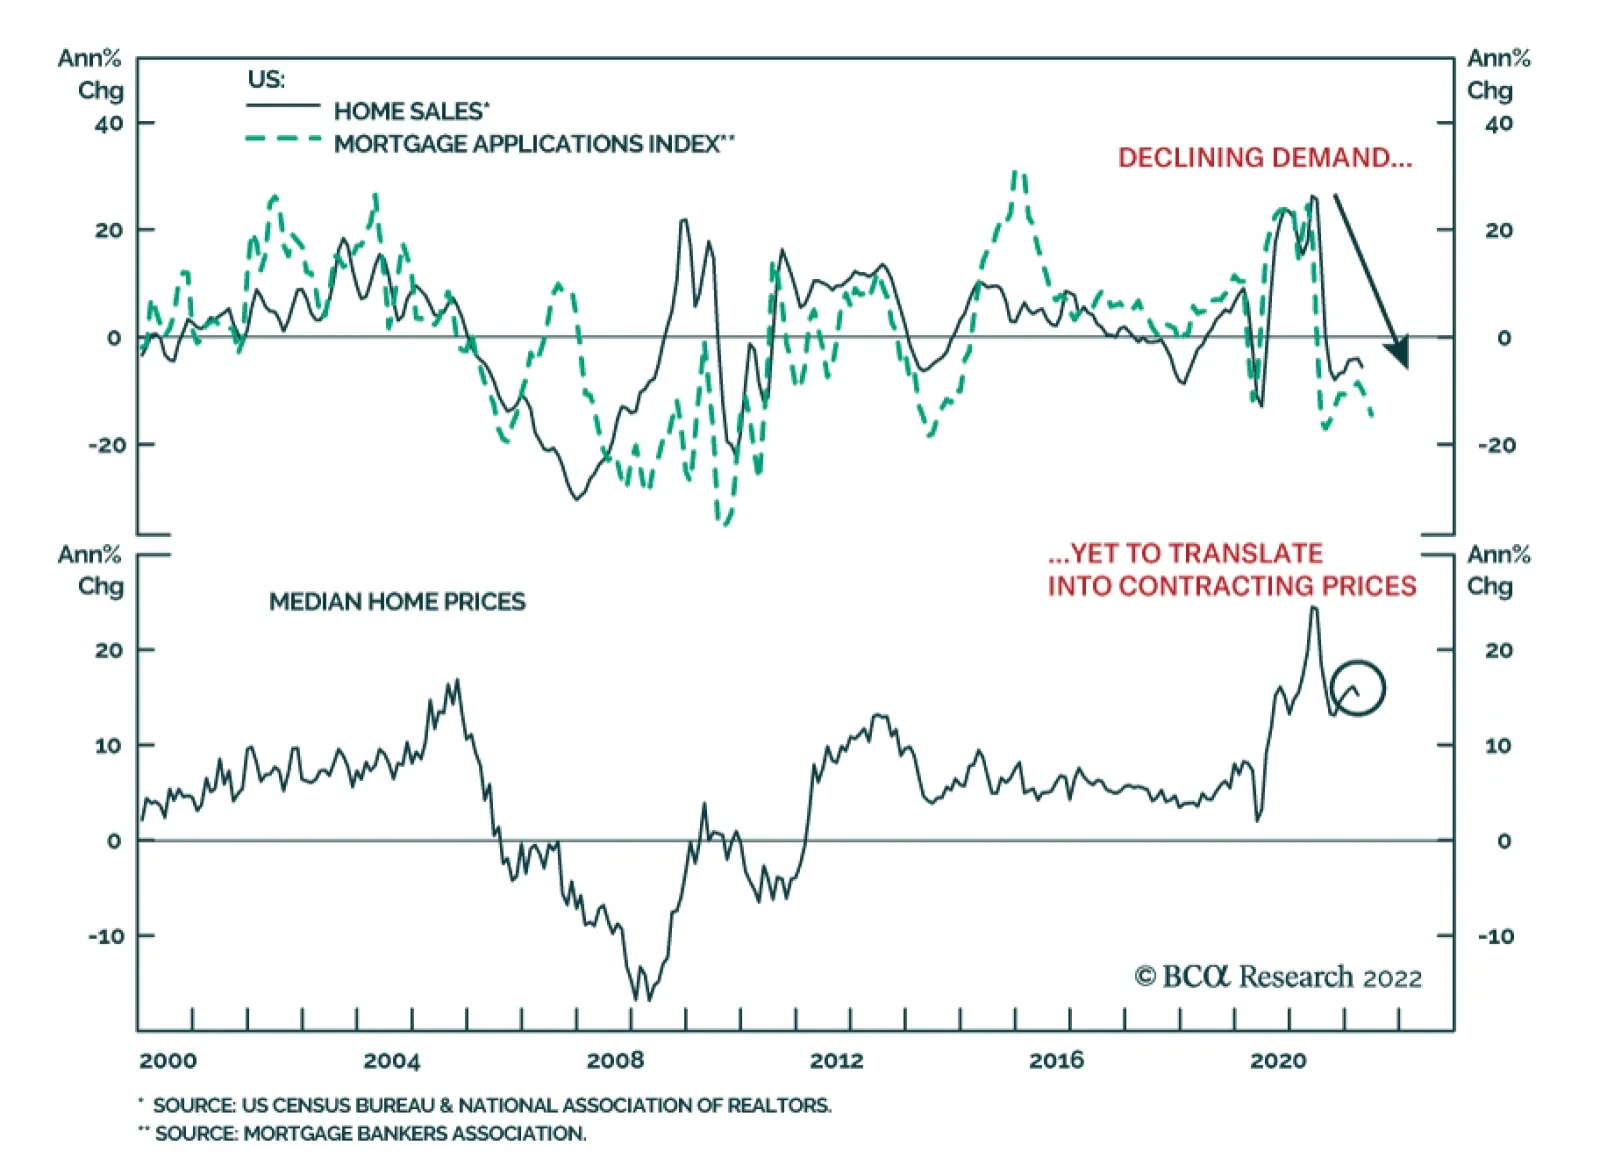
Mortgage applications contracted 6.5% in the past week, reflecting weakness in both home purchase applications and refinancing. The former declined 18% year-on-year and underscore slower demand for housing amid surging mortgage rates. These dynamics are…