Developed Countries
European peripheral bond spreads have continued to widen since the conclusion of last week’s ECB meeting. The Governing Council’s focus on taming inflationary pressures raises risks to the Eurozone economic growth outlook. Moreover, the central bank has not…
The reaction of market participants to Friday’s hotter-than-expected CPI report has been dominating the recent behavior of financial markets. Investors are now expecting a much more rapid increase in the fed funds rate. The Treasury market is selling off with…
According to BCA Research’s US Bond Strategy service, inflation is still more likely to fall than rise during the next 6-12 months, and this will prevent the Fed from tightening more quickly than what is already priced in the yield curve. The big question…

Executive Summary Bonds sold off dramatically in response to Friday’s surprisingly high CPI number. Markets are now pricing in a much more rapid increase in the fed funds rate, with some probability of a 75 bps move this week. We think a 75 bps rate hike at any one FOMC meeting is possible, but unlikely. Rather, we see the Fed continuing to hike by 50 bps per meeting until inflation shows signs of rolling over. The guts of the CPI report were less concerning than the headline figure, and it is still more likely than not that core CPI will trend down during the next 6-12 months. Contribution To Month-Over-Month Core CPI
No Relief From High Inflation
No Relief From High Inflation
Bottom Line: Investors should maintain benchmark portfolio duration as it is unlikely that the Fed will deliver a more aggressive pace of tightening than what is already in the price. Investors should also underweight TIPS versus nominal Treasuries as a play on a hawkish Fed and moderating consumer prices. The May CPI Print Ensures An Ultra-Hawkish Fed The “peak inflation” narrative took a blow last week when core CPI came in well above expectations for May. While the annual rate ticked down due to base effects, monthly core CPI saw its largest increase since last June (Chart 1). The bond market reacted to the news with an abrupt bear-flattening of the Treasury curve. The 2-year Treasury yield rose above 3% for this first time this cycle and the 10-year yield hit 3.27% on Monday morning (Chart 2). The 2-year/10-year Treasury slope flattened sharply, and it now sits at just 5 bps (Chart 2, bottom panel). Chart 1Strong Inflation In May
Strong Inflation In May
Strong Inflation In May
Chart 2A Big Bear-Flattening
A Big Bear-Flattening
A Big Bear-Flattening
With core inflation not showing any signs of slowing, the Fed will maintain its ultra-hawkish tone when it meets this week. While there’s an outside chance that the Fed will try to shock markets with a 75 basis point rate hike, we think it’s more likely that it will deliver the 50 basis point rate increase that Jay Powell teased at the last meeting while signaling that further 50 basis point rate increases are likely at both the July and September FOMC meetings. While inflation is not falling as quickly as either we or the Fed had previously anticipated, a look through the guts of the CPI report still leads to the conclusion that core inflation is more likely to fall than rise in the second half of this year. The main reason for this conclusion is that we aren’t seeing much evidence that inflation is transitioning from the goods sectors that were most heavily impacted by the pandemic to non-impacted service sectors. Rather, the main issue is that core goods inflation remains stubbornly high. Chart 3 shows the breakdown of core CPI into its three main components: (i) goods, (ii) shelter, and (iii) services excluding shelter. We can see that after only one month of decline in March, core goods prices accelerated to +0.69% in May, the largest monthly increase since January. The bulk of the May increase in goods inflation came from new and used cars (Chart 4), a sector where we should see price declines in the second half of this year now that motor vehicle production is ramping back up. Chart 3Contribution To Month-Over-Month Core CPI
No Relief From High Inflation
No Relief From High Inflation
Chart 4Contribution To Month-Over-Month Core Goods CPI
No Relief From High Inflation
No Relief From High Inflation
Turning to services, we observe a deceleration in May relative to April (Chart 3), and also notice that airfares continue to account for an outsized chunk of services inflation (Chart 5). Excluding airfares, core services inflation was just 0.36% in May. Chart 5Contribution To Month-Over-Month Core Services CPI (Excluding Shelter)
No Relief From High Inflation
No Relief From High Inflation
Finally, we see that shelter CPI increased by 0.61% in May, up from 0.51% in April. Shelter is the most cyclical component of CPI and as such it tends to closely track the unemployment rate. The unemployment rate has been flat at 3.6% for three consecutive months and it is more likely to rise than fall going forward. Therefore, we don’t anticipate further acceleration in shelter inflation during the next 6-12 months. Monetary Policy & Investment Implications At the last FOMC meeting, Chair Powell went out of his way to guide market expectations toward 50 basis point rate hikes at both the June and July FOMC meetings. After which, Powell hinted that the Fed would re-assess the economic outlook and would likely continue to lift rates at each meeting in increments of either 50 bps or 25 bps, depending on the outlook for inflation. Powell clearly wanted to set a firm marker down for the pace of rate hikes so that Fed policy doesn’t “add uncertainty to what is already an extraordinarily uncertain time.”1 For this reason, we don’t expect the Fed to lift rates by more than 50 basis points at any single meeting. However, May’s elevated CPI number will likely cause Powell to tease an additional 50 basis point rate hike for September. After September, if inflation finally does soften, the Fed will likely downshift to a pace of 25 bps per meeting. Taking a look at market expectations, we see that fed funds futures are fully priced for a 50 bps rate hike this week and are even discounting a small chance of a 75 bps hike (Chart 6A). Meanwhile, the market is almost fully priced for 125 bps of tightening by the end of the July FOMC meeting, i.e., one 50 bps hike and one 75 bps hike (Chart 6B). Looking out to the September FOMC meeting, we see the market priced for 180 bps of cumulative tightening (Chart 6C). This is consistent with a little more than two 50 basis point rate increases and one 75 basis point rate increase at the next three FOMC meetings. Chart 6AJune FOMC Expectations
June FOMC Expectations
June FOMC Expectations
Chart 6BJuly FOMC Expectations
July FOMC Expectations
July FOMC Expectations
Chart 6CSeptember FOMC Expectations
September FOMC Expectations
September FOMC Expectations
Looking even further out, we find the market priced for the fed funds rate to hit 3.28% by the end of the year and to peak at 3.88% in June 2023 (Chart 7).2 Chart 7Rate Expectations
Rate Expectations
Rate Expectations
Our own expectation is that the Fed will deliver three or four more 50 basis point rate increases this year, followed by a string of 25 basis point hikes. This will bring the fed funds rate up to a range of 2.75% to 3.25% by the end of 2022, slightly below what is currently priced in the yield curve. As for portfolio duration, we recommend keeping it close to benchmark for the time being. Many indicators – such as economic data surprises, the CRB Raw Industrials/Gold ratio and the relative performance of cyclical versus defensive equities – suggest that bond yields are too high.3 That said, with inflation surprising to the upside and the Fed in a hawkish frame of mind, it is not wise to bet too aggressively on bonds. We also reiterate our view that investors should underweight TIPS versus nominal Treasuries. It’s notable that long-maturity TIPS yields moved higher and that the 10-year TIPS breakeven inflation rate was close to unchanged on Friday, despite the surprisingly high CPI number. This tells us that the market is not pricing-in a scenario where the Fed is losing control of long-dated inflation expectations. Rather, the market is discounting a scenario where the Fed does what is necessary to bring inflation back down. Softish Or Volckerish? Chart 8The Everything Selloff
The Everything Selloff
The Everything Selloff
Of course, the big question for financial markets is whether the Fed will be forced to cause a recession to bring inflation down, or whether it will achieve what Jay Powell called a “softish” landing.4 The Fed’s hoped for “softish landing” scenario is one where inflation recedes naturally as we gain further distance from the pandemic. This outcome would limit the speed at which the Fed is forced to lift rates and push back the expected start date of the next recession. Unfortunately, trends in financial markets suggest that investors are putting less faith in the softish landing scenario. Our BCA Counterpoint Strategy recently observed that stocks, bonds, industrial metals and gold have recently all sold off in concert (Chart 8).5 It is rare for all four of these assets to sell off at the same time, but they did in 1981 when Paul Volcker was in the midst of dramatically lifting rates to conquer inflation. If we truly are on the cusp of the Fed tightening the economy into recession, then it makes sense for all four of those assets to perform poorly. Bond yields rise because the Fed is hiking much more quickly than was previously anticipated. Stocks and industrial metals sell off because of an increase in recession fears. Finally, gold sells off because of rising expectations that the Fed will do what it takes to bring inflation back down. And it’s not just financial markets that are warning that the Fed will be forced to repeat Chairman Volcker’s aggressive tightening. Two influential macroeconomists, Larry Summers and Olivier Blanchard, recently put out papers suggesting that the Fed needs another Volcker moment.6 Summers’ paper (with two co-authors) notes that changes in how the Bureau of Labor Statistics calculates shelter inflation make historical comparisons using CPI problematic. The authors estimate what core CPI would look like prior to 1983 if the current methodology had been employed and find that year-over-year core CPI peaked at 9.9% in 1980 well below the originally published figure of 13.6% and much closer to today’s 6% (Chart 9). The implication is that inflation is already almost as out of control now as it was in the early-1980s, and it will take a similar amount of monetary policy tightening to conquer it. In his paper, Olivier Blanchard makes a similar point by noting that the gap between the real fed funds rate and 12-month core CPI is as wide today as it was in 1975. The implication is that the Fed must play a similar amount of catch-up to bring inflation back down. Chart 9Properly Measured, Core CPI Was Much Lower In 1980
Properly Measured, Core CPI Was Much Lower In 1980
Properly Measured, Core CPI Was Much Lower In 1980
We think comparisons to the early-1980s are mistaken for three reasons. First, the Fed targets PCE inflation not CPI and PCE inflation does not suffer from the methodological inconsistencies that Summers et al identified. If we look at core PCE inflation, of which data only go to April, we see that 12-month core PCE inflation is currently 4.9% compared to a peak of 9.8% in 1980 (Chart 10). In other words, there is still a fair amount of distance between today’s PCE inflation and what was seen in the early 1980s. Chart 10The Fed Targets PCE Inflation
The Fed Targets PCE Inflation
The Fed Targets PCE Inflation
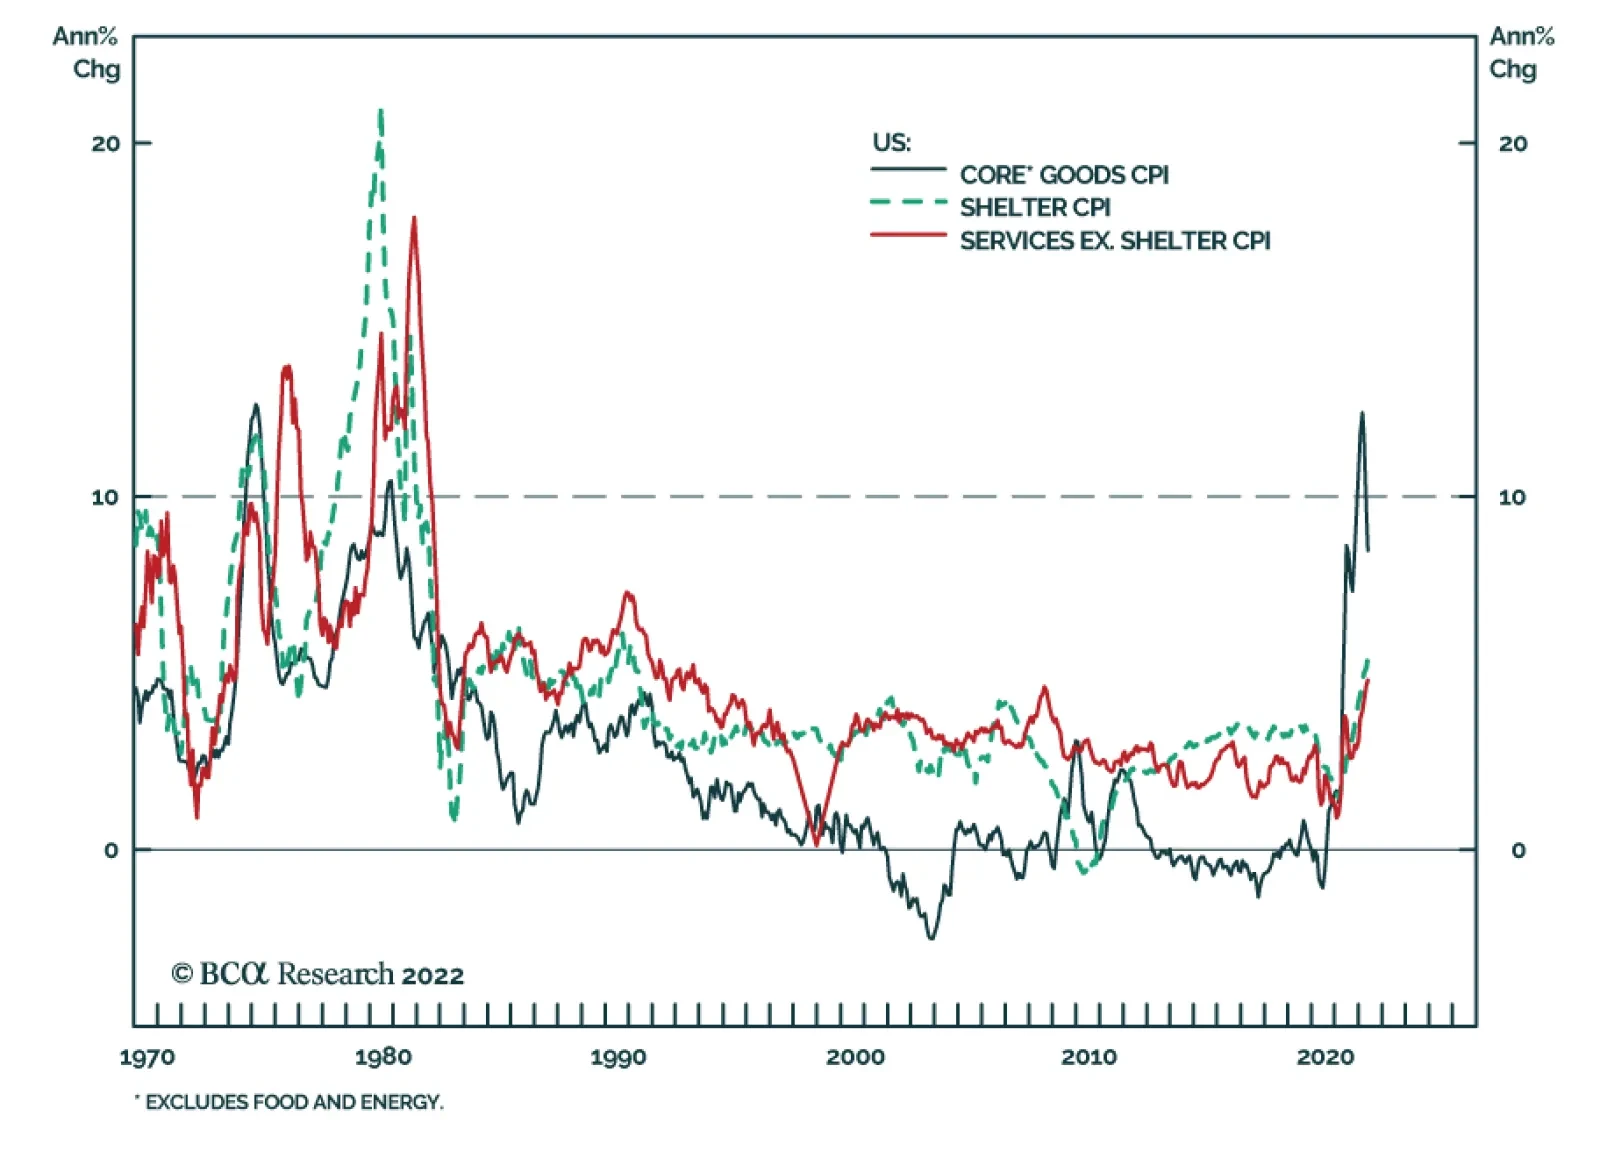
Second, inflation was more broadly distributed in the 1970s/80s than it is today. At different points in the 1970s and early-1980s all three of the major components of core inflation – goods, shelter and services excluding shelter – were above 10% in year-over-year terms (Chart 11). Today, only core goods inflation has moved above 10% and year-over-year shelter and services ex. shelter inflation sit at 5.4% and 4.8%, respectively. Chart 11Inflation Is Less Broad-Based Than In The 1970s/80s
Inflation Is Less Broad-Based Than In The 1970s/80s
Inflation Is Less Broad-Based Than In The 1970s/80s
Finally, wages had been accelerating rapidly for a full decade before inflation peaked in 1980 and this led to the emergence of a wage/price spiral (Chart 12). Firms increased prices to compensate for rising labor costs and then employees demanded further wage gains to compensate for rising consumer prices. Today, the evidence of a wage/price spiral is far less convincing. Wage growth has just recently moved above 5%, and we have seen recent indications that it is already starting to moderate.7 Typically, it takes a prolonged period of rapid wage growth for long-dated inflation expectations to rise and for a wage/price spiral to take hold. At present, we have seen only a modest move up in long-dated inflation expectations (Chart 13) and, as noted above, market-based measures of long-dated inflation expectations barely budged in response to last Friday’s inflation report. Chart 12No Wage/Price Spiral Yet
No Wage/Price Spiral Yet
No Wage/Price Spiral Yet
Chart 13Inflation Expectations
Inflation Expectations
Inflation Expectations
The bottom line is that inflation is still more likely to fall than rise during the next 6-12 months, and this will prevent the Fed from tightening more quickly than what is already priced in the yield curve. That said, while inflation is likely to dip, it will remain above the Fed’s 2% target and a recession will eventually be required to restore price stability. That recession, however, may not occur until late-2023 and it will likely be preceded by far less aggressive monetary tightening than what Paul Volcker delivered in the early-1980s. Ryan Swift US Bond Strategist rswift@bcaresearch.com Footnotes 1 For more details on the Fed’s forward guidance please see US Bond Strategy Weekly Report, “On A Dovish Hike And A 3% Bond Yield”, dated May 10, 2022. 2 These numbers are as of last Friday’s close. 3 For details on these indicators please see US Bond Strategy Webcast, “Will The Fed Get Its Soft Landing?”, dated May 17, 2022. 4 https://www.federalreserve.gov/mediacenter/files/FOMCpresconf20220504.pdf 5 Please see BCA Counterpoint Weekly Report, “Markets Echo 1981, When Stagflation Morphed Into Recession”, dated May 19, 2022. 6 Please see Bolhius, Cramer, Summers, “Comparing Past and Present Inflation”, June 2022. https://www.nber.org/papers/w30116. And also Blanchard, “Why I worry about inflation, interest rates, and unemployment”, March 2022. https://www.piie.com/blogs/realtime-economic-issues-watch/why-i-worry-about-inflation-interest-rates-and-unemployment. 7 Please see US Bond Strategy Portfolio Allocation Summary, “The Case For A Soft Landing”, dated June 7, 2022. Recommended Portfolio Specification Other Recommendations Treasury Index Returns Spread Product Returns
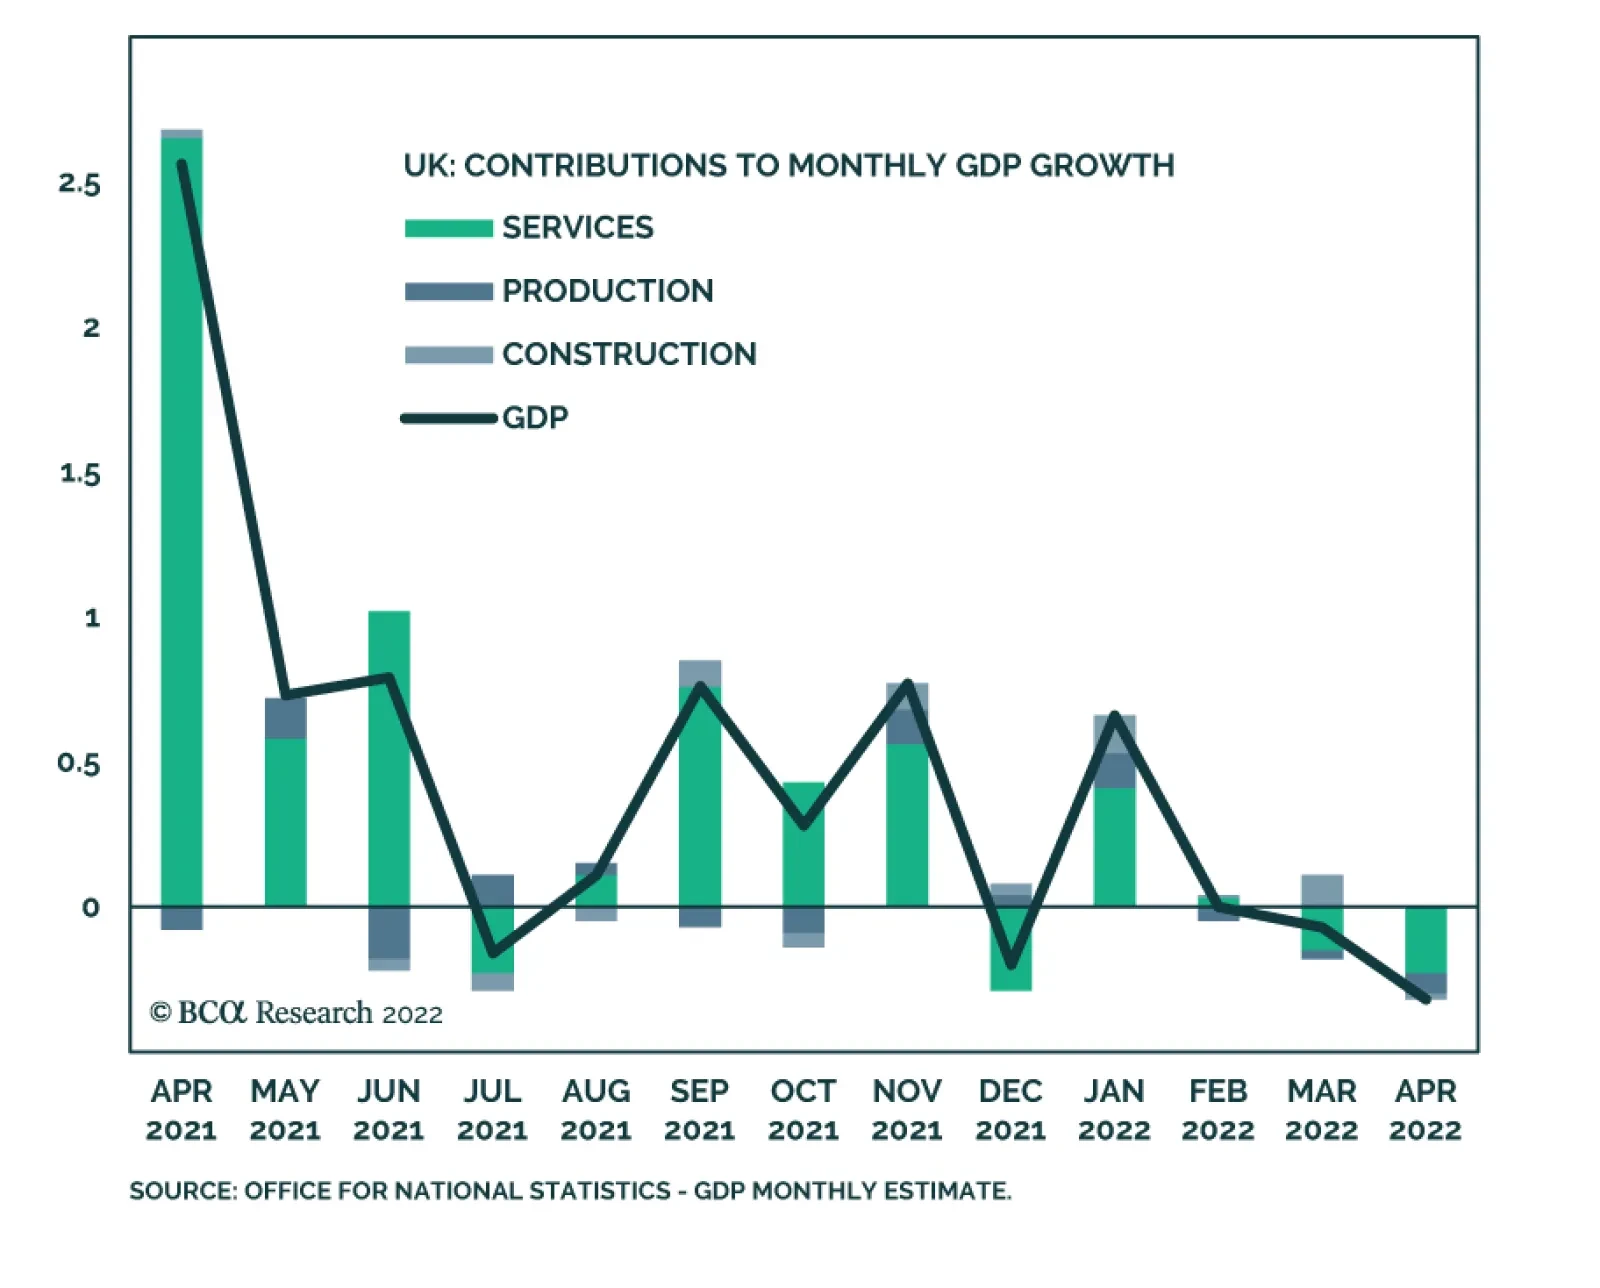
The UK economy unexpectedly contracted in April for the second consecutive month. GDP fell 0.3% m/m following a 1% m/m decline in March, disappointing expectations of a 0.1% m/m increase. Service sector activity was the largest detractor from overall GDP,…
Yesterday we highlighted that US consumers’ short-term and long-term inflation expectations are rising according to preliminary results from the June University of Michigan Survey. The risk now is that price increases prompt employees to demand higher…
The index for shelter – alongside airline fares, used cars & trucks, and new vehicles – was among the largest contributors to the 0.6% m/m increase in US core CPI inflation in May. The 12.6% m/m, 1.8% m/m, and 1.0% m/m increase in airline fares, used cars…
BCA Research’s US Equity Strategy service’s model indicates that US earnings growth is trending towards zero over the next three months. The model has five factors, each of which has fundamental relevance to earnings growth: ISM PMI is a gauge…
Executive Summary The recent pullback was all about a multiples contraction while strong earnings growth helped absorb the blow. With the multiple contraction phase complete, the S&P 500 performance is now all about earnings. Consensus still expects earnings to grow at 10% over the next 12 months, despite negative corporate guidance and a whole constellation of factors that present challenges to corporate profitability. We need to see downgrades or earnings will disappoint. Our brand-new model predicts that earnings growth will trend towards zero over the next three months. Earnings growth is a tug of war between rising input costs and corporate pricing power. There is a high likelihood of an earnings recession, even if an economic recession is unlikely over the next 12 months. Because growth is slowing not only in the US but also abroad. If an earnings recession does materialize, equities may have another leg down, perhaps another 5-8%. Earnings Growth Is A Tug Of War Between Rising Costs And Pricing Power
Is Earnings Recession In The Cards?
Is Earnings Recession In The Cards?
Bottom Line: We forecast that earnings growth will undershoot consensus expectations and an earnings recession is likely. Since the multiples contraction phase of the bear market is likely over, equities performance will be dictated by earnings growth. In the short run, we expect equities to be range-bound, with rallies and pullbacks alternating. In case of an earnings recession, equities may fall another 5-8%. Feature Related Report US Equity StrategyMarginally Worse Ever since the Fed started hiking interest rates back in March, investors started worrying about the recession. The BCA house view is that a recession is unlikely over the next 12 months. However, to us, of even greater concern is the likelihood of an earnings disappointment or even an outright earnings recession. We believe that earnings growth will slow dramatically. We wrote back in October 2021 report, “Marginally Worse”, that margins will contract at the beginning of the year – indeed, this prediction materialized during the Q1-2022 earnings season (Chart 1). Shrinking profit margins are likely to translate into flat to negative real earnings growth over the next 12 months. However, economic and earnings growth expectations remain elevated. As our readers may recall from the “Have We Hit Rock Bottom?” and “Fat and Flat” reports, we believe that for the markets to begin to heal, growth expectations need to come down and a negative outlook needs to get priced in. Chart 1Margins Are Contracting
Margins Are Contracting
Margins Are Contracting
In this week’s report, we take a close look at the S&P 500 earnings growth expectations and provide our own estimate based on a simple regression model. We will also discuss implications for the US equity market. Sneak Preview: We estimate that earnings growth will trend towards zero over the next three to six months, consistent with current trends in US economic growth, inflation, corporate pricing power, monetary conditions, and the strength of the USD. Sell-off Driven By Multiples Contraction, Not Earnings Growth This year’s sell-off has been triggered by fears of an aggressive Fed, tighter monetary policy, and rising rates. However, decomposition of the total return demonstrates that the pullback was all about multiples contraction, while strong earnings growth helped absorb the blow (Chart 2). A pertinent question is what happens to the market when earnings growth softens? One may wonder whether the bad news has already been priced in, as multiples tend to front-run growth. A case in point is strong market performance in 2020 on the back of multiples expansion in anticipation of a post-pandemic rebound in earnings growth (Chart 3). Chart 2Sell-off Was Driven By A Multiples Contraction
Is Earnings Recession In The Cards?
Is Earnings Recession In The Cards?
Chart 3Multiples Lead Earnings
Multiples Lead Earnings
Multiples Lead Earnings
With multiples down from 23x to 17x over the past two years, and the S&P 500 down by 19% from its January 2022 peak, arguably much of the upcoming earnings growth slowdown/contraction is priced in. Much but not all. The next chapter of the bear market will be driven by earnings growth. Earnings Growth Headwinds As we have pointed out on multiple occasions, it is confounding that, despite negative corporate guidance and a whole constellation of factors that present challenges to corporate profitability, earnings estimates for 2022 have been revised up (Chart 4) and stand at about 10% (Chart 5). However, at long last, upgrades are starting to moderate (Chart 6). We need to see downgrades. Chart 42022 Earnings Estimates Are Still Trending Up
2022 Earnings Estimates Are Still Trending Up
2022 Earnings Estimates Are Still Trending Up
Chart 5Earnings Are Expected To Grow At 10%
Earnings Are Expected To Grow At 10%
Earnings Are Expected To Grow At 10%
Chart 6Analysts Are No Longer Upgrading
Analysts Are No Longer Upgrading
Analysts Are No Longer Upgrading
Chart 7Slowing Global Growth Has An Adverse Effect On The US Earnings Growth
Slowing Global Growth Has An Adverse Effect On The US Earnings Growth
Slowing Global Growth Has An Adverse Effect On The US Earnings Growth
Since the beginning of 2022, there have been quite a few developments that will weigh on earnings growth: Slowing growth in the US and globally means sales growth is decelerating. This week, the World Bank downgraded global GDP growth from 4.1% to 2.9%. Global manufacturing PMI is also trending towards 50 (Chart 7). Consumer demand is weakening: Negative real wage growth saps consumers’ confidence and cuts into their purchasing power. Moreover, demand for goods is returning to the pre-pandemic trend, and retail sales, especially in real terms, are flagging (Chart 8). Demand for services remains strong, but the S&P 500 index is dominated by goods producers. Corporate pricing power is still strong but is showing signs of waning as many US consumers, distraught by the negative wage growth, are strapped for cash (Chart 9). Chart 8Retail Sales Are Contracting In Real Terms
Retail Sales Are Contracting In Real Terms
Retail Sales Are Contracting In Real Terms
Chart 9Corporate Pricing Power Is Waning
Corporate Pricing Power Is Waning
Corporate Pricing Power Is Waning
Prices of raw materials have soared and supply disruptions are exacerbated by lockdowns in China and the war in Ukraine. Companies’ COGS (Cost of Goods Sold) bills are skyrocketing. Nominal wage growth is 6% and is on the rise, affecting companies’ bottom lines. The dollar is strong: it has gained 15% since January 2021. This makes US goods more expensive and reduces companies’ earnings via the currency translation effect. These are the reasons why it is increasingly hard for companies to preserve margins and grow earnings – a commentary that we have heard repeatedly during earnings calls. According to Refinitiv, for Q2-2022, there have been 73 negative EPS preannouncements issued by S&P 500 corporations, compared to 42 positive EPS preannouncements (N/P=73/42=1.7). A year ago, in Q2-2021, the N/P ratio was 0.8, with more companies offering positive guidance. All of this points to weakening profitability. Refinitiv also estimates the earnings growth rate for the S&P 500 for Q2-2022 at 5.3%. If the energy sector is excluded, the growth rate declines to -1.9%. We believe growth will come to a halt or contract into the end of the year. We expect slower top-line growth and shrinking profit margins to translate into flat to negative real earnings growth over the next 12 months. Earnings Recessions Often Happen When The Economy Is Still Growing One may wonder if an earnings recession is even possible without an economic recession. In fact, that happened quite a lot in the past. Out of 27 earnings recessions since 1927, 11 did not coincide with economic recessions (Chart 10). Chart 10Earnings Recessions And Economic Recession Often Don't Coincide
Earnings Recessions And Economic Recession Often Don't Coincide
Earnings Recessions And Economic Recession Often Don't Coincide
The S&P 500 does not mirror the US economy, with the former dominated by larger companies, many of which are multinationals and more exposed to global demand and the USD than the broad economy. Also, services and consumer spending constitute roughly 70% of the US economy, while the index overrepresents manufacturing, technology, and goods-producing companies. With the S&P 500 being global in nature, quite a few earnings recessions were triggered by events abroad: The 2016 earnings recession was caused by the devaluation of the Chinese yuan; in 2012, one was triggered by a post-GFC double-dip recession in Europe; and the 1998 one was triggered by an Asian financial crisis. It is also often the case that a profit recession is a harbinger of economic recession. Both the 2000 dot-com crash and GFC economic recessions were preceded by earnings recessions, one starting in December 2000, and the other in August 2007. The 2019 earnings recession was brief and came hand in hand with widespread fears of the end of the business cycle. Hence, we believe that a confluence of factors both at home and abroad, as discussed above, makes an earning recession a high probability event. There is a high likelihood of an earnings recession, even if an economic recession is unlikely over the next 12 months, because of slowing growth not only in the US but also abroad. Modeling Earnings Growth Since we are distrustful of the consensus of 10% expected eps growth, we have built our own simple earnings growth forecast model to gauge what earnings growth rate we may expect over the next quarter. The model has five factors, each of which has fundamental relevance to earnings growth (Table 1): Table 1EPS Growth Forecast Model
Is Earnings Recession In The Cards?
Is Earnings Recession In The Cards?
ISM PMI is a gauge of US economic growth and a proxy for top-line growth. PPI stands for the change in input costs. Pricing Power is a BCA proprietary indicator and captures companies’ ability to pass costs onto their customers. HY Spreads indicate costs of borrowing and also the state of the economy (spreads tend to shoot up in a slowing economy). USD represents the ability of US multinationals to sell goods abroad. Roughly 35% of S&P 500 sales are outside the US. Each factor is calculated on a year-on-year percentage change basis, with a three-month lag to allow the effects of macroeconomic developments to get priced in. Adjusted R2 is 65%, which is a strong fit. All factors are statistically significant at the 1% level. The model forecasts that earnings growth will come down from 6% MoM as of April 2021 to 1.3% as of August 2022 (Chart 11). While this does not map directly to the “next 12 months” of eps growth, it does indicate that earnings growth is trending towards zero in nominal terms and will be outright negative in real terms. Further, while we are unable to predict earnings growth more than three months ahead, we do expect that it will reach zero and then shift into contraction territory into the balance of the year. Chart 11Model Predicts That Earnings Growth Will Be Flat
Is Earnings Recession In The Cards?
Is Earnings Recession In The Cards?
Looking closer at the key drivers of growth (Chart 12), we observe that there is a tug of war between pricing power and rising costs (PPI), with earnings growth falling as pricing power starts to give away ground. The other factors that have an adverse effect on earnings growth are slowing growth (ISM PMI), an appreciating dollar, and rising borrowing costs (HY spreads). Chart 12Earnings Growth Is A Tug Of War Between Rising Costs And Pricing Power
Is Earnings Recession In The Cards?
Is Earnings Recession In The Cards?
The model indicates that earnings growth is trending towards zero over the next three months. Price Target What does all of this mean for US equities? If the multiple contraction phase is complete, the S&P 500 performance is now all about earnings. If we expect earnings to grow only 0-3% in nominal terms, with the forward earnings multiple unchanged at roughly 18x, then the S&P 500 is likely to come down another couple of percentage points. If earnings contract 5%, the index may be down as much as 8%. If multiples contract another point to 17x and earnings contract by 5%, the market may be down as much as 15% (Table 2). Table 2The S&P 500 Target Scenario Analysis
Is Earnings Recession In The Cards?
Is Earnings Recession In The Cards?
For now, we are sticking with our “fat and flat” thesis expecting the S&P 500 performance to continue to trend down as rallies and pullbacks alternate. Earnings growth slowdown/shallow contraction is likely to result in another leg down of roughly 5-8%. Investment Implications Street forward earnings growth expectations are too high at 10% and need to be downgraded. There are multiple reasons why earnings growth will be underwhelming, ranging from slowing growth abroad to weaker demand for goods and rising wages at home. We anticipate that earnings growth will be flat to negative into the balance of the year. The multiple contraction phase of the bear market is over, and now equities performance will be dictated by earnings growth. If an earnings recession does materialize, equities may have another leg down, perhaps another 5-8%. Bottom Line We forecast that earnings growth will undershoot consensus expectations and that an earnings recession is likely. Since the multiple contraction phase of the bear market is likely over, equity performance will be dictated by earnings growth. In the short run, we expect equities to trend down, with rallies and pullbacks alternating. In the case of an earnings recession, equities may fall another 5-8%. Irene Tunkel Chief Strategist, US Equity Strategy irene.tunkel@bcaresearch.com Recommended Allocation Recommended Allocation: Addendum
Is Earnings Recession In The Cards?
Is Earnings Recession In The Cards?
Executive Summary ECB & Inflation: Whatever It Takes?
Pricey Industrials
Pricey Industrials
Inflation is the European Central Bank’s single focus. This single-mindedness heightens the risks to Euro Area growth, especially because wider peripheral spreads do not seem to worry the ECB yet. Italian spreads will widen further, which will contribute to weaker financials, especially in the periphery. The money market curve already prices in the path of the ECB; the upside in Bund yields is therefore capped. Cyclical assets, including stocks, are vulnerable to the confluence of weaker growth and tighter monetary policy. Industrials are fragile. Downgrade to neutral for now. German industrials will outperform Italian industrials. Bottom Line: The ECB will do whatever it takes to slow inflation, which will further hurt an already brittle European economy. This backdrop threatens European stocks and peripheral bonds. Downgrade industrials to neutral and go long German / short Italian industrials. Feature Last week, the European Central Bank’s Governing Council sided with the hawks. The doves have capitulated. This development creates mounting risks this summer for European assets, especially when global growth is slowing. Worryingly, the ECB has given speculators the green light to widen peripheral and credit spreads in the near term. Cyclical assets remain at risk. We are downgrading industrials and financials. Hawkish Chart 1Higher Inflation Forecast = Hawkish ECB
Don’t Fight The ECB
Don’t Fight The ECB
The ECB’s forward guidance proved more hawkish than anticipated by the market, as highlighted by the 16bps increase in the implied rate of the December 22 Euribor contract following the press conference. The ECB also refused to sooth investors’ nerves regarding fragmentation risk in the periphery. A large part of the ECB move was already anticipated. The ECB will lift its three interest rate benchmarks by 25bps at its July meeting. It also increased its headline inflation forecasts to 6.8% from 5.1% in 2022, to 3.5% from 2.1% in 2023, and most importantly, it raised its long-term HICP forecast to 2.1% from 1.9% (Chart 1). The ECB now expects medium-term inflation to be above its 2% target. The true hawkish shock came in response to the higher-than-target medium-term inflation forecast. By September, if the 2024 inflation forecast does not fall back below 2%, then a 50bps hike that month will be inevitable. The whole interest rate curve moved up in response to that guidance. The most concerning part of the statement was the lack of clarity about the fragmentation fighting tool. The ECB specified that it will re-invest the principal of its holdings under the APP and PEPP until 2024, at least. However, the program to prevent stress in peripheral bond markets was not revealed and was presented as an eventuality to be deployed only if market conditions deteriorate further. Investors may therefore assume that the ECB is still comfortable with Italian bond yields above 3.5% and high-yield spreads of 464bps (Chart 2). Ultimately, the ECB’s single-minded focus is inflation, even though it is mostly an imported shock. The ECB cares little for the effect of its actions on growth. It will therefore remain very hawkish until it sees enough evidence that the medium-term inflation outlook will fall back below 2%. Before the ECB can tabulate a decline in the inflation outlook, the following developments must take place: The economy must slow in order to extinguish domestic inflationary pressures. The labor market, to which President Christine Lagarde referred often in the press conference, must cool. Specifically, the very elevated number of vacancies must decline relative to the low number of unemployed persons (Chart 3). A weaker economy will cause this shift. Energy inflation must recede to choke secondary effects on prices. Chart 2Tight But Not Tight Enough For The Hawks
Tight But Not Tight Enough For The Hawks
Tight But Not Tight Enough For The Hawks
Chart 3The Labor Market Must Cool
The Labor Market Must Cool
The Labor Market Must Cool
The good news is that the decline in commodity inflation is already underway. Last week, we argued that if energy prices remain at their current levels, (or if Brent experiences the additional upside anticipated by BCA’s Commodity and Energy strategists), then energy inflation will decelerate significantly. Already, the inflationary impact of commodities is dissipating (Chart 4). European growth has not slowed enough to hurt the labor market, but it will decline further. Real disposable income is falling, and the manufacturing sector is decelerating globally. Moreover, European terms of trade are tumbling, which hurts the Euro Area’s growth outlook, especially compared to the US where the terms of trade are improving (Chart 5). Chart 4Dwindling Commodity Impulse
Dwindling Commodity Impulse
Dwindling Commodity Impulse
Chart 5Europe's Terms-of-Trade Problem
Europe's Terms-of-Trade Problem
Europe's Terms-of-Trade Problem
The European periphery, especially Italy, faces particularly acute problems. We argued two months ago that Italian yields of 4.5% would not cause a sovereign debt crisis if economic activity were strong. As we go to press, Italian yields stand at 3.7%, or higher than those in Canada and Australia. Yet, Italy suffers from poor demographic and productivity trends; its neutral rate of interest is lower than that of both Canada and Australia. Moreover, Canada and Australia today enjoy robust terms-of-trades. Meanwhile, Italy is among the European economies most hurt by surging energy prices. Consequently, a vicious circle of higher yields and lower growth is likely to develop. Chart 6The BTP-EUR/USD Valse
The BTP-EUR/USD Valse
The BTP-EUR/USD Valse
Italy’s economic problems imply that investors will continue to push Italian spreads higher until the ECB provides a clear signal of support for BTPs, which could happen after spreads reach 300bps over German 10-year yields. Italy’s weakness is a major handicap for the monetary union as well. The higher Italian spreads widen, the weaker the euro will be (Chart 6). However, a depreciating euro is inflationary, which invites higher rates for the Euro Area and tighter financial conditions. The great paradox is that, if the ECB were more pro-active about the fragmentation risk, it could fight inflation with less danger to the economy and thus, the Eurozone could achieve higher rates down the road. Weaknesses in global and European growth, risks of higher Italian and peripheral spreads, and an ECB solely focused on inflation will harm European risk assets further. Specifically, credit spreads will widen more and cyclical stocks will remain vulnerable. Within cyclical stocks, Italian and Spanish financials are the most exposed to the fragmentation threat in Euro Area bond markets. We have held an overweight recommendation on industrial equities. We maintain a positive long-term bias toward this sector, but a neutral stance is warranted in the near term. Finally, Bund yields have limited upside from here. The curve already anticipates 146bps of tightening by the end of this year and 241bps by June 2023. The ECB is unlikely to increase rates more than is anticipated, which caps German yields. Instead, the ECB is likely to undershoot the €STR curve pricing if it increases interest rates once a quarter after the September 50bps hike. Bottom Line: Don’t fight the ECB. The Governing Council is single-mindedly focused on fighting inflation. Growth must slow significantly to cool the labor market and allow the ECB to cut back its medium-term inflation forecast to 2%. Therefore, European assets will remain under stress in the coming months as global growth deteriorates. Italian and peripheral spreads are particularly vulnerable, which will also weigh on financials because of Spanish and Italian banks. Chart 7Pricey Industrials
Pricey Industrials
Pricey Industrials
Neutral On Industrials Industrials stocks have outperformed other cyclicals and have moved in line with the Euro Area broad market. However, relative forward EPS have not tracked prices; industrials are now expensive and vulnerable to shocks (Chart 7). The increase in the relative valuations of industrials reflects their robust pricing power. Normally, the economic weakness pinpointed by the Global Growth Expectations component from the ZEW Survey results in falling valuations for industrials, since it is a growth-sensitive sector (Chart 8). However, this year, the earnings multiples of industrials relative to the broad market have followed inflation higher (Chart 8, bottom panel). This paradox reflects the strong pricing power of the industrial sector, which allows these firms to pass on a greater share of their increasing input-costs and protect their profits (Chart 9). Chart 8Ignore Growth, Loving Inflation
Ignore Growth, Loving Inflation
Ignore Growth, Loving Inflation
Chart 9Pricing Power Is The Savior
Pricing Power Is The Savior
Pricing Power Is The Savior
The ability of industrials to weather a growth slowdown is diminishing: European inflation will peak in response to the decline in commodity inflation (see Chart 4, on page 4). Already, the waning inflation of metal prices is consistent with lower relative multiples for industrials (Chart 10) Last week, we argued that global PMIs have greater downside because of the tightening in global financial conditions. Weaker global manufacturing activity hurts the relative performance of industrials. Capex in advanced economies is likely to drop in the coming quarters. US capex intentions are rapidly slowing, which has hurt European industrials. European capex intentions have so far withstood this headwind; however, the outlook is worsening. European final domestic demand is weakening, and European inventories are growing rapidly (Chart 11). Capex is a form of derived demand; the challenges to European growth translate into downside for investment. Chart 10The Commodity Paradox
The Commodity Paradox
The Commodity Paradox
Chart 11The Inventory Buildup Threat
The Inventory Buildup Threat
The Inventory Buildup Threat
The Euro Area Composite Leading Economic Indicator is already contracting and will fall further. The ECB’s focus on inflation and its neglect of financial conditions will drag the LEI lower. Moreover, central banks across the world are also tightening policy, which will filter through to weaken global and Europe LEIs. A declining LEI hurts industrials (Chart 12). The relative performance of European industrials is positively correlated to that of US industrials (Chart 13). BCA’s Global Asset Allocation has recently downgraded industrials to neutral from overweight. Chart 12Weaker LEIs Spell Trouble
Weaker LEIs Spell Trouble
Weaker LEIs Spell Trouble
Chart 13Where the US Goes, So Does Europe
Where the US Goes, So Does Europe
Where the US Goes, So Does Europe
Despite these risks, we are reluctant to go underweight industrials because financials are more exposed to the ECB’s neglect of financial conditions. Moreover, the headwinds against the industrial complex are temporary, especially when it comes to China. Chinese authorities have greatly stimulated their economy, and Beijing is softening its stance on the tech sector. A loosening of the regulatory crackdown would revive animal spirits and credit demand. Moreover, the aerospace and defense industry, which is a large component of the industrial sector, still offers attractive prospects. Instead, we express our concerns for industrials via the following pair trade: Long German industrials / short Italian Industrials. This is a relative value trade. German industrials have underperformed their relative earnings, while Italian ones have moved significantly ahead of their earning power. Thus, German industrials are very cheap and oversold relative to their southern neighbors (Chart 14). Interestingly, this derating took place despite the widening in Italian government bond spreads, which normally explains this price ratio well (Chart 15). This disconnect presents a trading opportunity. Chart 14A Relative Value Trade
A Relative Value Trade
A Relative Value Trade
Chart 15An Unusual Disconnect
An Unusual Disconnect
An Unusual Disconnect
Chart 16German Industrials And Growth Expectations
German Industrials And Growth Expectations
German Industrials And Growth Expectations
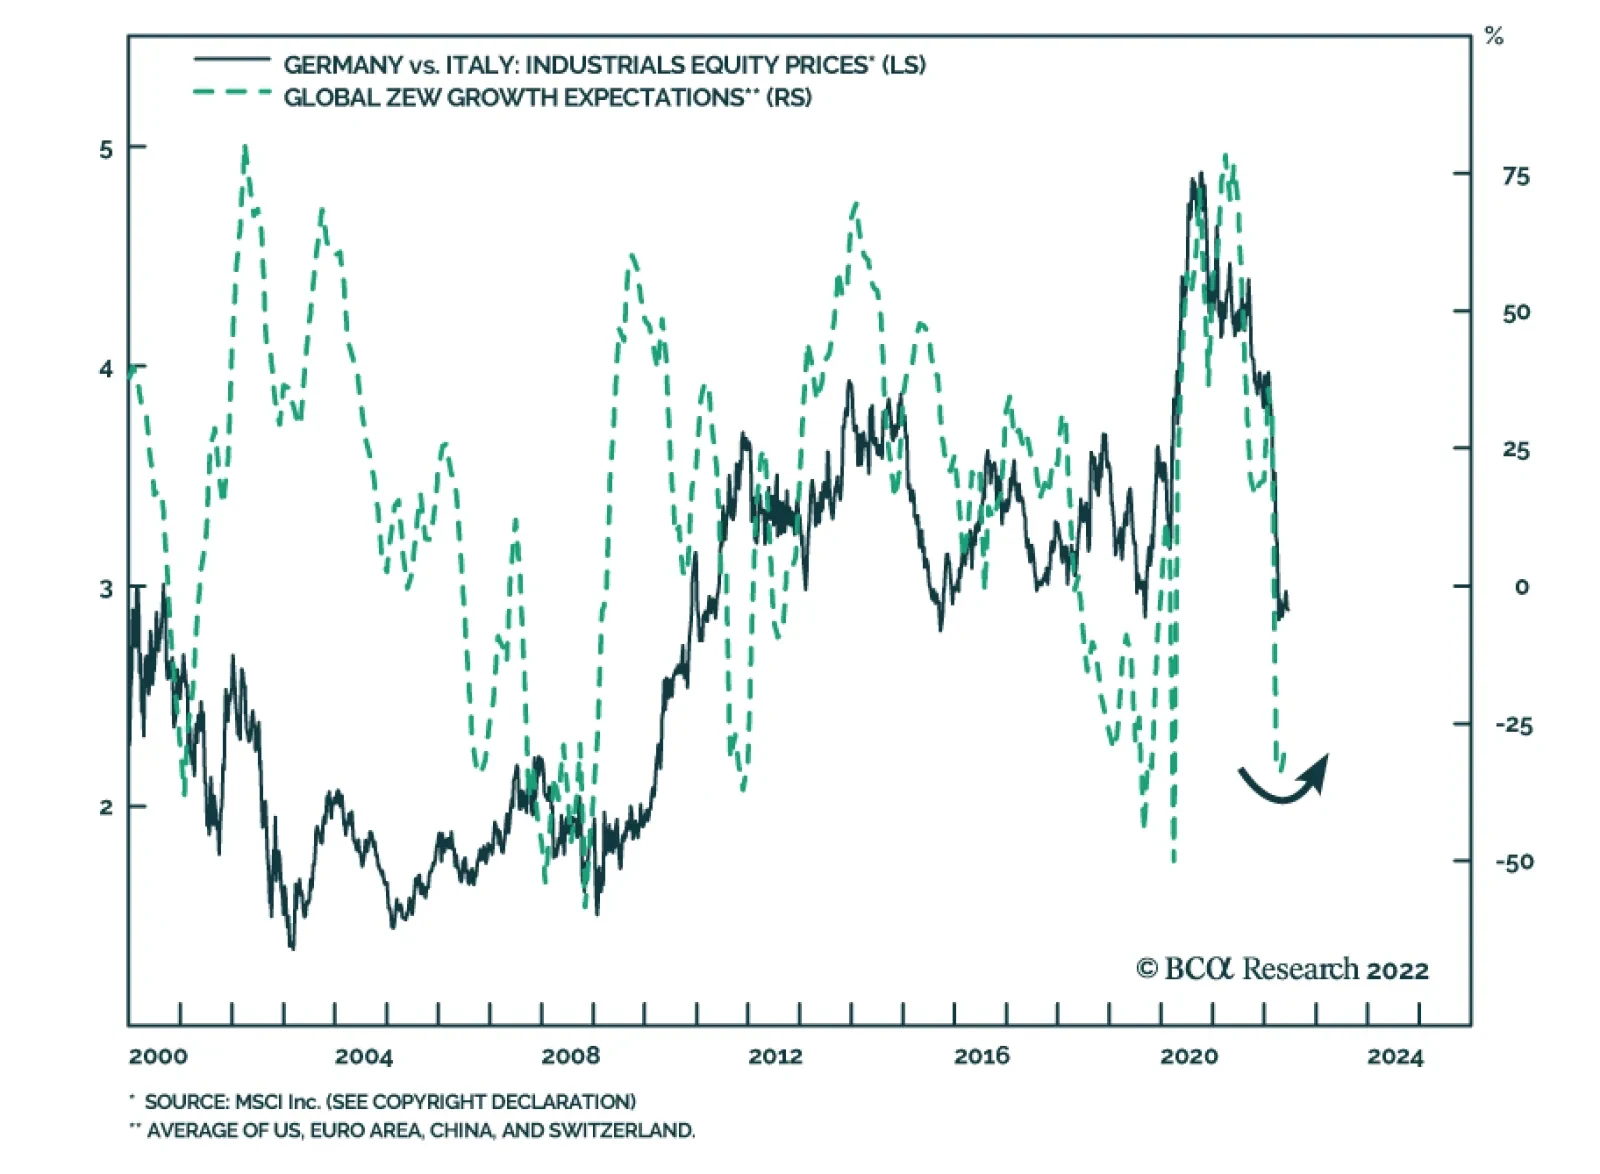
While global growth has yet to bottom, the performance of German relative to Italian industrials fluctuates along growth expectations (Chart 16). Germany seats earlier in the global supply chain than Italy. The Global Growth Expectations component from the ZEW Survey is extremely depressed and approaching levels where a rebound would be imminent. German industrials suffer more from the energy crunch than Italian ones. They will therefore benefit more from the decline in energy inflation. Historically, German industrials outperform Italian ones when commodity prices rise, but this relationship normally reflects the strong global demand that often lifts natural resource prices (Chart 17). Today, commodities are skyrocketing because of supply constraints, not strong demand. Therefore, they are hurting rather than mimicking growth. This inversion in the relationship between the performance of German compared to Italian industrials and natural resources prices is particularly evident when looking at European energy prices (Chart 18). Consequently, once the constraint from commodities and global supply chains ebb, German industrials will outshine their Italian counterparts. Chart 17Commodities: From Friends To Foes
Commodities: From Friends To Foes
Commodities: From Friends To Foes
Chart 18Energy: From Friend To Foe
Energy: From Friend To Foe
Energy: From Friend To Foe
German industrials suffer when stagflation fears expand (Chart 19). The ECB’s focus on inflation will assuage the apprehension of entrenched inflation in Europe. The recent improvement in our European Stagflation Sentiment Proxy will continue to the advantage of German industrials. Additionally, a firm ECB stance will push European inflation expectations lower, which will help German industrials compared to their Italian competitors (Chart 20). Chart 19Stagflation Hurts Germany More
Stagflation Hurts Germany More
Stagflation Hurts Germany More
Chart 20The ECB"s Inflation Focus Helps German Industrials
The ECB"s Inflation Focus Helps German Industrials
The ECB"s Inflation Focus Helps German Industrials
German PMIs are improving relative to Italian ones. The trend in Germany’s industrial activity compared to that of Italy dictates the evolution of industrials relative performance between the two countries (Chart 21). The tightening in financial conditions in Italy due to both wider BTP spreads and their negative impact on the Italian banking sector will accentuate the outperformance of Germany’s manufacturing sector. German industrials are more sensitive than Italian ones to the gyrations of the Chinese economy. BCA’s Geopolitical Strategy service anticipates an improvement in China’s economy for the next 18 months or so in response to previous stimuli and the easing regulatory burden. The close link between the performance of German industrials relative to Italian ones and the yuan’s exchange rate indicates that a stabilizing Chinese economy will undo most of the valuation premium of Italian industrials (Chart 22). An improvement in China’s economy will also lift its marginal propensity to consume (which the spread between the growth rate of M1 and M2 approximates). A rebound in Chinese marginal propensity to consume will boost comparative rates of returns in favor of Germany (Chart 22, bottom panel). Chart 21Relative Growth Matters
Relative Growth Matters
Relative Growth Matters
Chart 22The China Factor
The China Factor
The China Factor
Bottom Line: Industrials have become expensive relative to the rest of the market, but they are still too exposed to the global economy’s downside risk. This tug-of-war warrants a downgrade to neutral for now. Going long German industrials / short Italian industrials is an attractive pair trade within the sector. German industrials are cheap and they will benefit from both the ECB’s policy tightening and the upcoming decline in European inflation. Mathieu Savary, Chief European Strategist Mathieu@bcaresearch.com Tactical Recommendations Cyclical Recommendations Structural Recommendations Closed Trades