Developed Countries

Executive Summary Calculating Trend Inflation
Calculating Trend Inflation
Calculating Trend Inflation
Investors should anticipate 50 basis point rate hikes at each FOMC meeting, eventually transitioning to 25 bps per meeting once inflation shows clear and convincing evidence of trending down. This transition should occur later this year. Core inflation has peaked for the year and it can fall to a range of 4-5% even in the absence of an economic recession or meaningful labor market weakness. A recession will eventually be required to push inflation from 4% down to the Fed’s 2% target. Economic growth will slow going forward, but we won’t see enough weakness for the Fed to abandon its tightening cycle within the next 6-12 months. Bottom Line: US bond investors should keep portfolio duration close to benchmark, underweight TIPS versus nominal Treasuries and maintain a defensive posture on corporate bond spreads (underweight IG and neutral HY). The Fed Goes Big Chart 1Inflation Expectations
Inflation Expectations
Inflation Expectations
The US Federal Reserve continued to prove its inflation-fighting mettle last week with a 75 basis point rate hike, the largest single-meeting increase since 1994. Chair Powell had initially telegraphed 50 basis point rate increases for both the June and July FOMC meetings, but he made it clear during last week’s press conference that the committee was spooked by May’s surprisingly high CPI number and by the recent jump in 5-10 year household inflation expectations (Chart 1). Alongside the 75 basis point rate hike, committee members revised up their fed funds rate forecasts. The median FOMC member now expects the funds rate to reach a range of 3.25% to 3.5% by the end of 2022. That is consistent with three more 50 basis point rate hikes and one more 25 basis point hike at this year’s four remaining FOMC meetings. Looking further out, the median committee member anticipates 25-50 bps additional upside in the fed funds rate in 2023 but is then forecasting a modest reduction in 2024. Critically, the fed funds rate is still expected to be above estimates of long-run neutral by the end of 2024. Chart 2 shows how current market expectations compare to the Fed’s forecasts. We see that, even after the Fed’s upward forecast revisions, the market still anticipates a somewhat faster pace of tightening this year. The market is also priced for rate cuts in 2023, likely due to the increasingly widespread expectation that a recession is coming within the next 12 months. Chart 2Rate Expectations: Market Versus Fed
Rate Expectations: Market Versus Fed
Rate Expectations: Market Versus Fed
The Fed’s Near-Term Plan As for what we can expect going forward, we found two comments from Chair Powell’s press conference particularly enlightening. First, he called last week’s 75 basis point rate increase “unusually large” and said that he “doesn’t expect moves of that size to be common.” Second, Powell said that the Committee will need to see “convincing” and “compelling” evidence of falling inflation before it starts to moderate its tightening pace.1 From these statements we deduce the following near-term plan: 1. The Fed’s baseline expectation is to lift rates by 50 bps at each meeting. 2. A significant upside surprise in either the monthly core CPI data or long-dated inflation expectations would cause the Fed to lift by 75 bps instead of 50 bps. 3. The Fed will not reduce the pace of tightening to 25 bps per meeting until there is clear and convincing evidence that inflation is trending down. Bottom Line: Investors should anticipate 50 basis point rate hikes at each FOMC meeting, eventually transitioning to 25 bps per meeting once inflation shows clear and convincing evidence of trending down. This transition from 50 bps per meeting to 25 bps per meeting should occur later this year, meaning that the Fed will tighten no more quickly than what is already priced into the yield curve for the remainder of 2022. Inflation: All Clear To 4%, 2% Will Be More Challenging It’s evident from the above discussion that inflation remains the critical input for both monetary policy and US bond yields. In particular, the key questions are: 1. Will inflation trend down, and if so, how quickly? 2. Is an economic recession required to curtail inflation? Our answer to these questions is that core US inflation should fall naturally to a trend rate of roughly 4-5%, even in the absence of recession. However, an economic recession and its associated labor market weakness are likely required to move inflation from 4% back to the Fed’s 2% target. Chart 3Calculating Trend Inflation
Calculating Trend Inflation
Calculating Trend Inflation
To arrive at these conclusions, we seek out different ways of estimating inflation’s underlying trend (Chart 3). The first method we consider is the Atlanta Fed’s decomposition of core inflation into “flexible” and “sticky” components. As defined by the Atlanta Fed, “flexible” items tend to change price more frequently compared to “sticky” items. Items like hotels and new & used vehicles fall into the flexible index, while rent and medical care fall into the sticky index.2 As of May, 12-month core flexible inflation is running at a rate of 12.3%. Meanwhile, core sticky inflation is running at 5.0% (Chart 3, top panel). Second, we consider the New York Fed’s Underlying Inflation Gauge (UIG). The UIG uses a dynamic factor model to derive a measure of trend inflation from a broad set of data.3 In total, the measure uses 346 data series encompassing price measures and other nominal, real and financial variables. The New York Fed has demonstrated that the UIG provides better forecasts of CPI inflation than other measures of core and trimmed mean inflation. At present, the UIG is running at 4.9% (Chart 3, panel 2). A second “prices only” UIG measure that includes only price data and no other economic or financial variables is running hotter at 6.0%. Finally, we can assess inflation’s underlying trend by looking at wage growth. Specifically, we can look at unit labor costs, a measure of wages relative to productivity. Unit labor costs are volatile, but they tend to track core inflation over long periods of time. Unit labor costs grew at an extremely high rate of 8.2% in the four quarters ending in Q1, but this is partly due to huge post-pandemic swings in productivity growth. If we create a more stable measure of underlying wage pressure by subtracting annualized 5-year productivity growth from the 12-month growth rate in average hourly earnings, we see that this trend inflation measure is running at only 3.8% (Chart 3, bottom panel). Chart 4Auto Inflation Will Slow
Auto Inflation Will Slow
Auto Inflation Will Slow
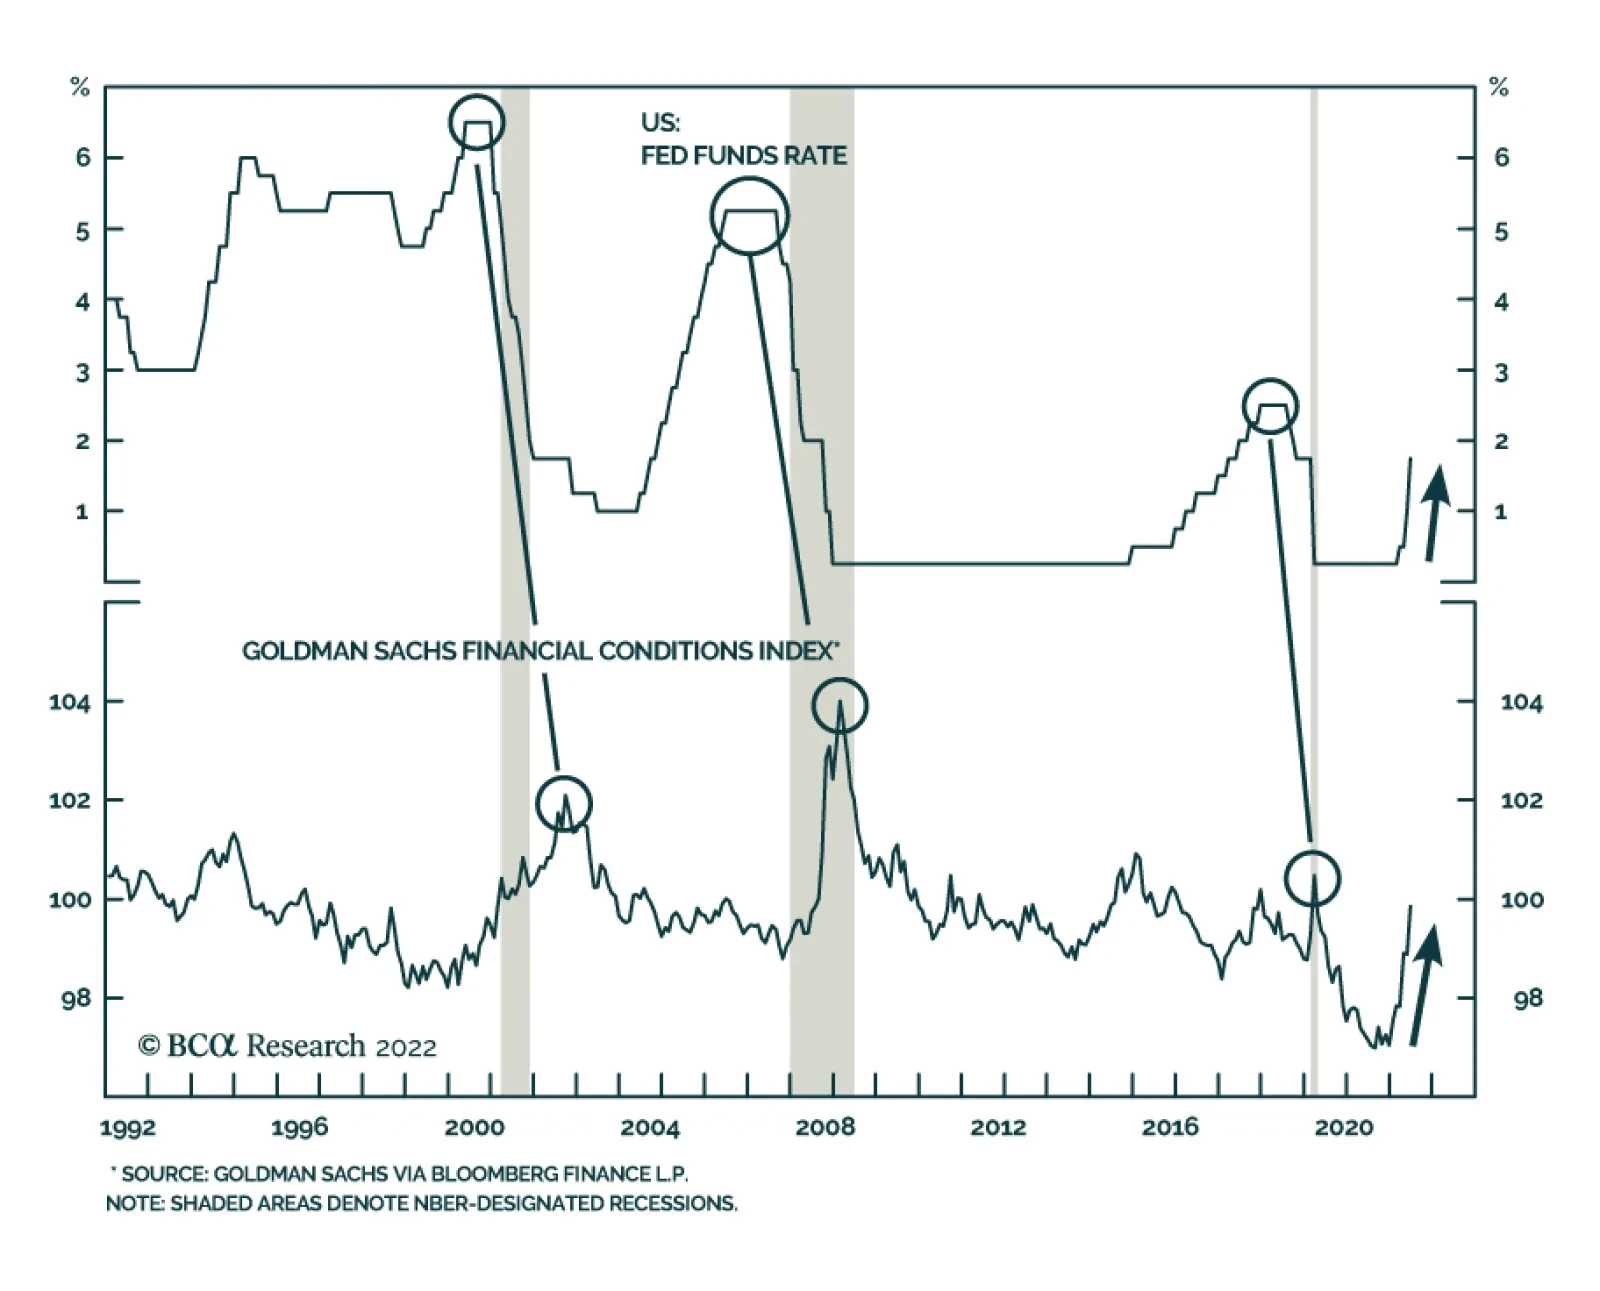
We conclude from our analysis that 12-month core CPI inflation will fall from its current 6.0% back down to its trend level of roughly 4-5% without the Fed needing to slam the brakes on economic growth. This will occur because we will finally see the normalization of some prices that were pushed dramatically higher during the pandemic. Auto price inflation, for example, shot up above 20% last year because the pandemic and the fiscal response to the pandemic conspired to cause a surge in auto sales at the same time as a slump in production (Chart 4). Now, for reasons that have nothing to do with monetary policy but everything to do with the waning impact of the pandemic, we see auto sales rolling over as production ramps up. This will push prices lower in the second half of this year. All that said, once core inflation reaches its 4-5% trend level, more economic pain will be required to push it lower. Shelter, for example, carries a huge weight in the Atlanta Fed’s core sticky CPI and it is highly correlated with the economic cycle. A rising unemployment rate, and an economic recession, will eventually be required to push shelter inflation down. Bottom Line: Core inflation has peaked for the year and it can fall to a range of 4-5% even in the absence of an economic recession or meaningful labor market weakness. A recession and a rising unemployment rate will eventually be required to push inflation from 4% down to the Fed’s 2% target. The Risk Of Recession Just because US inflation can fall to 4% in the absence of recession doesn’t mean that the Fed won’t get impatient and cause one anyways. In fact, the Fed made it clear last week that it isn’t interested in nuanced inflation forecasts. The Fed will tighten aggressively until it is apparent that inflation is rolling over, even if it causes economic pain. In this section, we run through several economic and financial market indicators that often send signals near the peak of Fed tightening cycles and in advance of recessions. We conclude that economic growth is slowing, but we do not yet see any evidence of an imminent recession or of any growth slowdown that would be large enough for the Fed to pause or reverse its tightening cycle. First, we look at financial conditions (Chart 5). The Goldman Sachs Financial Conditions Index has tightened rapidly during the past few months and that tightening is broad-based across all five of the index’s components. That said, the index has still not quite moved into “restrictive” territory. Typically, Fed tightening cycles only end once financial conditions are already restrictive, and in this cycle, high inflation means that the Fed will likely tolerate even more tightening of financial conditions than usual. Second, we observe that the end of a Fed tightening cycle is often marked by a dip in the ISM Manufacturing PMI to below 50. Presently, the PMI is a solid 56.1 but it is falling, and regional Fed surveys suggest that it may soon dip into contractionary territory (Chart 6). Chart 5Financial Conditions
Financial Conditions
Financial Conditions
Chart 6PMIs Are Slowing
PMIs Are Slowing
PMIs Are Slowing
Third, residential construction activity is a strong predictor of both recession and the end of Fed tightening cycles. Specifically, we have observed that Fed tightening cycles tend to terminate once the 12-month moving average of housing starts falls below the 24-month moving average.4 At present, there is strong evidence that higher mortgage rates are starting to bite the housing market. Housing starts dipped sharply in May and homebuilder confidence is trending down (Chart 7). That said, our housing starts indicator still has a long way to go before it signals the end of the Fed’s tightening cycle (Chart 7, bottom panel). Finally, we turn to the labor market where we do not yet see any evidence of an economic slowdown. Nonfarm payroll growth usually turns negative prior to recession, but right now it is running at a rate of 4.5% during the past 12 months and 3.3% during the past three months (Chart 8). The unemployment rate, for its part, is extremely low, but this only reinforces the idea that the Fed won’t be inclined to abandon its tightening cycle anytime soon. Chart 7US Housing
US Housing
US Housing
Chart 8The US Labor Market
The US Labor Market
The US Labor Market
Consider that the Congressional Budget Office estimates that the natural unemployment rate is 4.4% and the median FOMC member estimates that it is 4.0%. In other words, the Fed would still consider the labor market tight even if the unemployment rate rose from its current 3.6% level to around 4%. Even though such an increase in the unemployment rate might technically be consistent with a recession, the Fed would not be inclined to ease monetary policy into such a labor market if inflation is still above its 2% target. Additionally, we must also consider that the labor force participation rate is trending up and it still has breathing room before it reaches its pre-pandemic level. Further increases in labor force participation – which seem likely – could support employment growth going forward even if the unemployment rate stops falling. Bottom Line: The Fed’s rate hikes, and tighter financial conditions more generally, will slow economic growth going forward. However, we don’t see any evidence that growth will be weak enough for the Fed to abandon its tightening cycle within the next 6-12 months. This is especially true because above-target inflation increases the amount of financial conditions tightening and labor market pain that the Fed will tolerate. Investment Implications Portfolio Duration & US Treasury Curve May’s surprisingly elevated CPI number caused US Treasury yields to move above their 2018 peaks across the entire yield curve (Chart 9). But we wouldn’t be surprised to see that uptrend take a breather during the next few months as inflation descends toward its 4-5% underlying trend. As noted above, falling inflation will likely cause the Fed to tighten by no more than what is already discounted between now and the end of the year, this should keep US Treasury yields rangebound. As a result, we advise investors to keep duration close to benchmark in US bond portfolios, with an eye toward re-evaluating this positioning once core inflation moves closer to its underlying trend. Chart 9US Treasury Yields
US Treasury Yields
US Treasury Yields
On the Treasury curve, the 5-year note continues to trade cheap relative to the 2-year/10-year slope (Chart 9, bottom panel). We recommend buying the 5-year note versus a duration-matched barbell consisting of the 2-year and 10-year notes. TIPS Chart 10Underweight TIPS Versus Nominals
Underweight TIPS Versus Nominals
Underweight TIPS Versus Nominals
Investors should position for inflation falling back to trend by underweighting TIPS versus duration-matched nominal US Treasuries. Not only will falling inflation weigh on TIPS breakeven inflation rates during the next few months but a resolutely hawkish Fed will also apply downward pressure (Chart 10). We are particularly bearish on short-maturity TIPS, and we advise investors to initiate outright short positions in 2-year TIPS (Chart 10, bottom panel). In last week’s press conference, Chair Powell pointed to negative short-maturity real yields as evidence that financial conditions have room to tighten further. To us, this suggests that the Fed will not quit until real yields move into positive territory across the entire yield curve. In an environment of falling inflation, this is likely to occur because of falling TIPS breakeven inflation rates. However, the Fed has now demonstrated that even if inflation doesn’t fall it will push real yields higher with its policy rate actions and forward guidance. Corporate Credit The combination of slowing economic growth and increasingly restrictive Fed policy compels us toward a defensive positioning on corporate bond spreads. Specifically, we advise investors to carry an underweight (2 out of 5) allocation to investment grade US corporate bonds and a neutral (3 out of 5) allocation to high-yield US corporate bonds. Our slight preference for high-yield comes from the view that spread widening is likely to take a breather this year as inflation turns down and the Fed tightens by no more than what is already discounted in the yield curve. Though the long-run prospects for corporate bond returns remain bleak, if inflation moderates this year as we expect, then spreads could easily re-tighten to the average levels seen during the last tightening cycle (2017-19). That would equate to 31 bps of spread tightening for investment grade US corporate bonds (Chart 11), or roughly 300 bps of excess return versus duration-matched US Treasuries.5 For high-yield, a return to average 2017-19 spread levels would equate to 133 bps of spread tightening (Chart 12), or roughly 875 bps of excess return versus duration-matched US Treasuries.6 Chart 11IG Spreads
IG Spreads
IG Spreads
Chart 12HY Spreads
HY Spreads
HY Spreads
In our view, this warrants a slightly higher allocation to high-yield for the time being, though we will likely turn increasingly bearish should spreads tighten to average 2017-19 levels or once inflation converges with its 4-5% trend. Ryan Swift US Bond Strategist rswift@bcaresearch.com Footnotes 1 https://www.federalreserve.gov/mediacenter/files/FOMCpresconf20220615.pdf 2 For more info on the Atlanta Fed’s sticky and flexible CPIs please see: https://www.atlantafed.org/research/inflationproject/stickyprice 3 For more info on the Underlying Inflation Gauge please see https://www.newyorkfed.org/research/policy/underlying-inflation-gauge 4 For more details on this indicator please see US Bond Strategy Weekly Report, “The Bond Market Implications Of A 5% Mortgage Rate”, dated April 26, 2022. 5 This excess return estimate is roughly 31 bps of spread tightening multiplied by average index duration of 7.5. We then add half of the index OAS as an estimate of the carry earned during the next six months. 6 This excess return estimate is roughly 133 bps of spread tightening multiplied by average index duration of 4.3. We then add half of the index OAS, less estimated default losses of 200 bps, as an estimate of the carry earned during the next six months. Recommended Portfolio Specification Other Recommendations Treasury Index Returns Spread Product Returns
Business confidence in the US has collapsed this year. The Conference Board’s measure of CEO Confidence deteriorated for the fourth consecutive quarter in Q2 and is now near where it was at the onset of the pandemic in early 2020. The war in Ukraine and…
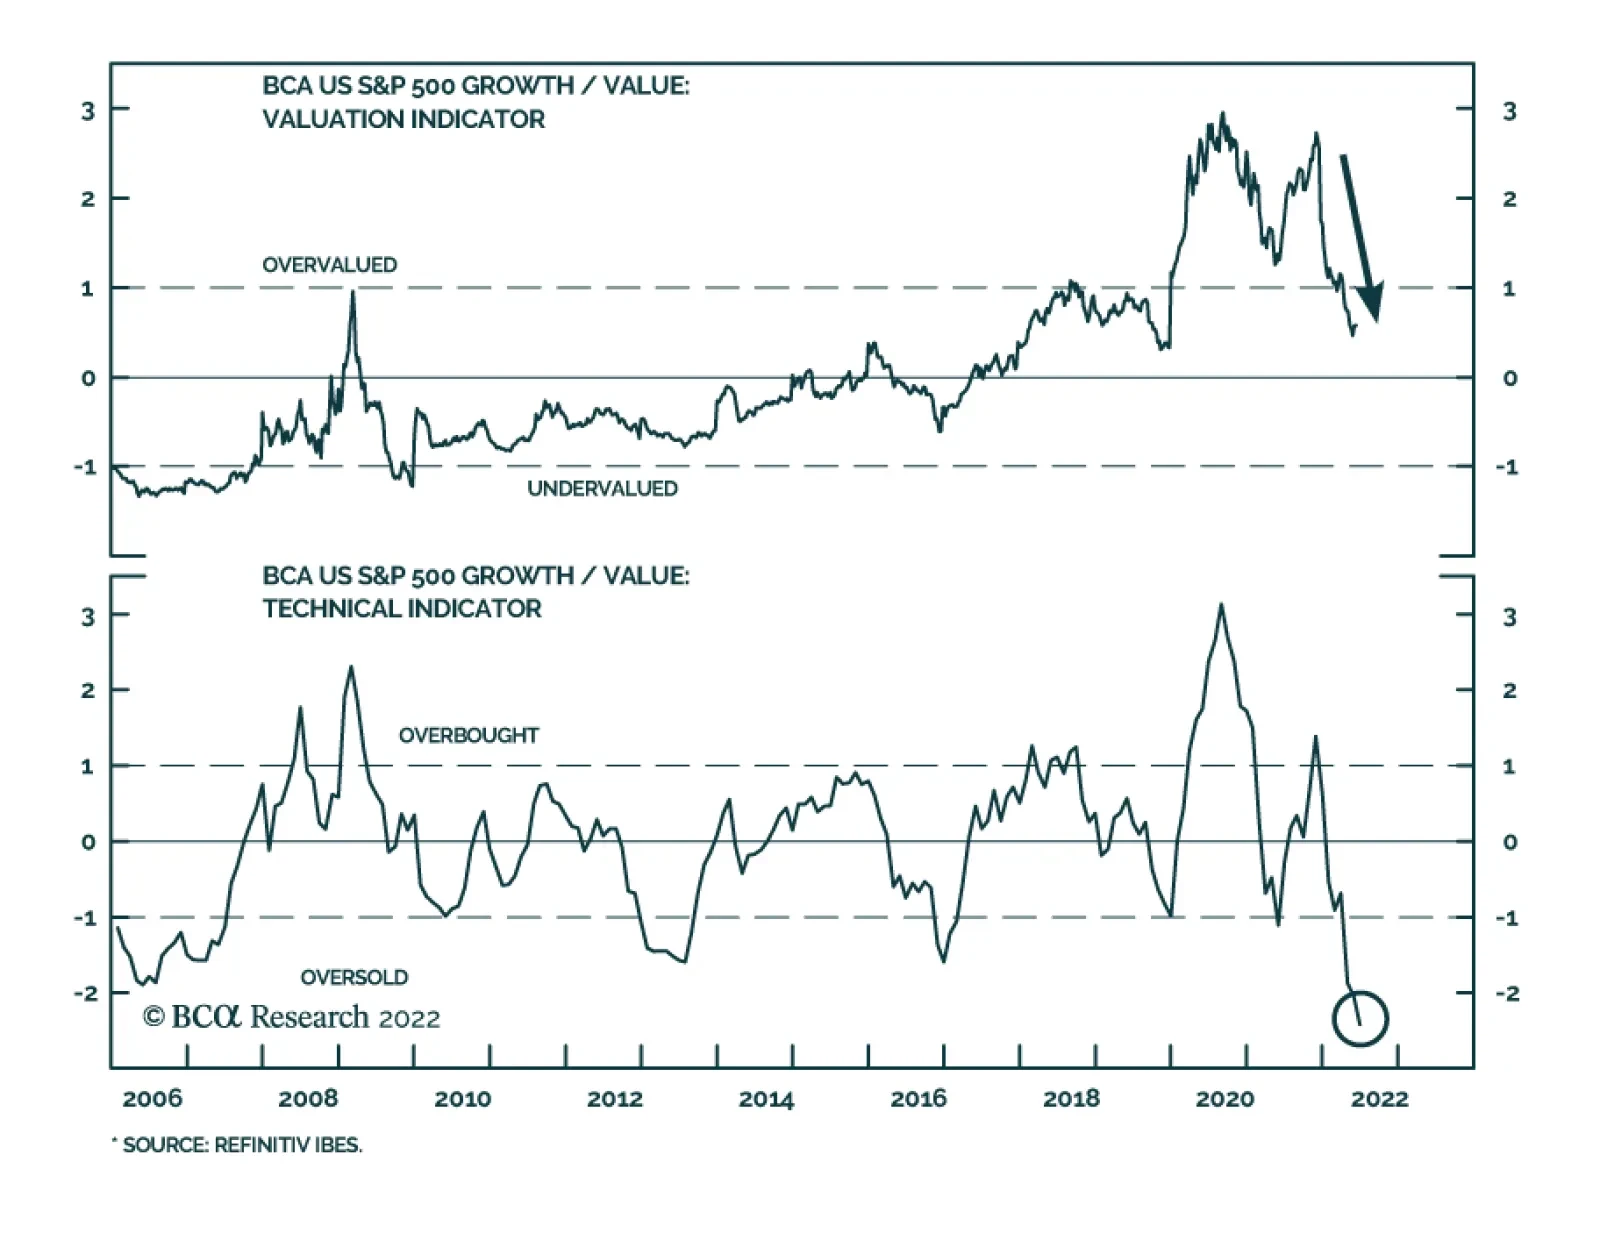
The year-to-date equity selloff has been particularly painful for Growth stocks. The S&P 500 Growth index’s 30% drawdown dwarfs the Value index’s 15% decline. The sharp increase in bond yields has weighed more heavily on the performance of Growth stocks,…
According to BCA Research’s US Investment Strategy service, if the recession is further away than moves in the bond, equity and foreign exchange markets imply, risk assets are poised to rebound. The current rate hike campaign’s real-time impact on…
Executive Summary Surge In Yields Tanked Equities
Surge In Yields Tanked Equities
Surge In Yields Tanked Equities
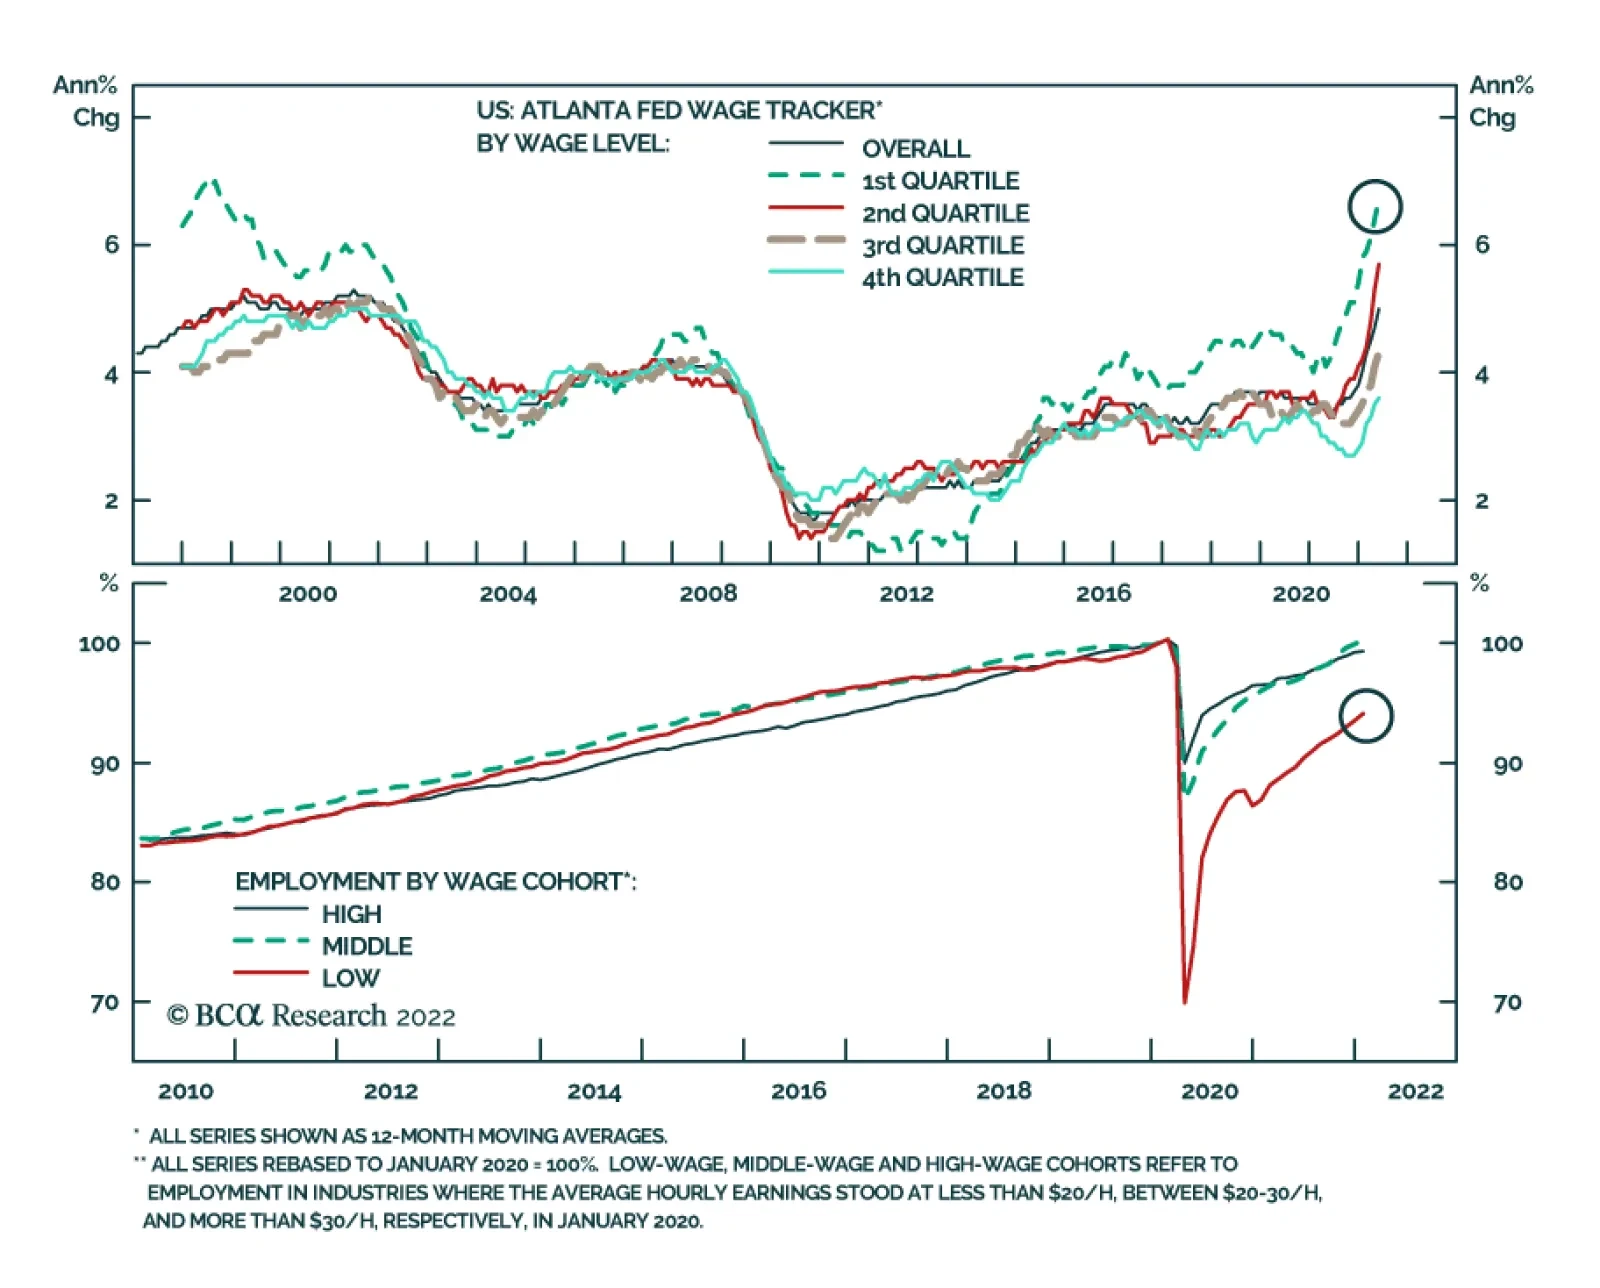
In this week’s report, we conduct a post-mortem analysis of the past week’s market panic and probe the effect of the new developments on US equities. Inflation is embedded. US equities won’t find a bottom until inflation turns decisively. The Fed will continue to tighten monetary policy, and rates will rise until inflation rolls over. The Fed “put” is also no longer at play as the Fed has signaled that it cares far more about combating inflation than about the performance of the stock market. Economic growth is decelerating and is already surprising on the downside. Watch rates. With rates stable, the S&P 500 performance will be a function of earnings growth. With rates rising, the multiple will contract and will exacerbate the damage done by the earnings recession. Bottom Line: The S&P 500 is unlikely to find a bottom until inflation turns and monetary conditions stabilize. In addition, economic growth is slowing and an earnings recession is likely. We believe US equities will follow a “fat and down” trajectory in light of the recent developments. We recommend that investors “not be heroes” and keep sector allocation close to the benchmark. Overweight defensives vs. cyclicals. Feature The May CPI reading showed that despite the Fed’s “heroic actions,” inflation has not yet peaked—a data point that has shocked both the market and Fed officials. In an unprecedented move, the Fed, which prides itself on its transparent communication style and its ability to move the market by guiding its expectations, leaked its intention to raise rates by 75 bps to the WSJ despite the communications blackout period. Since last Friday, equity markets around the globe have been in turmoil, with the S&P 500 falling 8%. The NASDAQ is down 7%. Is this just a leg down of the “Fat and Flat” market we have called for with a rebound waiting in the wings, or is there a structural change in the inflationary backdrop and a relentless bear market set to continue? To answer these questions, we will revisit our macroeconomic calls to better understand what expectations need to be adapted to the new reality and what we should expect for US equities over the next three to six months. Sneak Preview: US equities are likely to fall further as monetary conditions continue to tighten and earnings growth is set to contract. We believe that equities will trade in a wide “channel” with multiple rallies and pullbacks, but the general direction is down until inflation turns decisively, and fears of recession dissipate. Why Did Equities Tank? The last few days in the markets were simply brutal. What were investors (and the Fed) panicking about? Here is our hunch: Inflation is not abating, while growth is slowing. Are we in the early innings of stagflation? We believe that stagflation is certainly a high risk. The Fed’s aggressive tightening of monetary conditions is bound to further slow economic growth and taper demand. However, the Fed has no means of controlling the supply side of the equation such as prices of food or energy, which surge because of constrained supply. Will monetary tightening be even more aggressive than expected? Will 75-bps rate rises become the Fed’s new normal? During the press conference, Chairman Powell reassured the market that a 75-bps rate hike is an extraordinary measure. However, both 50-bps and 75-bps rate hikes will be on the table in July. Are the markets on the cusp of a new monetary regime, and is the easy money of the past 12 years a thing of the past? The Fed’s balance sheet has increased from $2 trillion in 2009 to an unprecedented $9 trillion in 2022. This ultra-easy monetary policy has lifted asset values both in private and public markets. The new monetary regime of liquidity being drained from the financial markets to combat inflation is bound to be a major headwind for most asset classes. We believe that it will take a while to bring inflation back to the 2% target, and easy money in the near future is no longer in the cards. It is also unlikely that such a major Fed balance sheet expansion will ever be repeated. The Fed’s tightening via both rising rates and QT will result in a dearth of liquidity in the fixed income space— a credit/counterparty “black swan” may materialize, with MBS most exposed to this risk yet again. Withdrawal of liquidity is a hit to many asset classes, from private markets to unprofitable small-cap growth companies to fixed income markets. This is a serious concern that should be monitored. Incorporating New Data Into Macro And Market Calls We have been writing about these calls for a few months—let’s revisit them here to consider what may have changed recently. Peak Inflation Is Elusive We have never quite bought the argument of transitory inflation. To us, inflation is a product of excessive demand fueled by ultra-easy fiscal and monetary policy and supply chains hobbled by the pandemic. Recently, the situation has been exacerbated by shortages of food and energy. Inflation has spread from pandemic-related goods to “stickier” service items and is broad-based (Chart 1). The wage/price spiral is relentless (Chart 2), as consumer inflation expectations are on the rise, and the job market is on fire. Chart 1Inflation Is Entrenched And Broad-based
Inflation Is Entrenched And Broad-based
Inflation Is Entrenched And Broad-based
While we always believed that it would take inflation a long time to reach the coveted 2% level, we assumed that peak inflation was behind us. Our view that inflation was going to roll over was more down to a base effect rather than the Fed’s actions. In addition, we observed that demand for goods pulled forward by the pandemic had started fading, suppressed by rising prices and negative real wage growth. The Citigroup Inflation Surprise Index had also turned (Chart 3). Chart 2Wage-Price Spiral Is Relentless
Wage-Price Spiral Is Relentless
Wage-Price Spiral Is Relentless
Chart 3Inflation Was Surprising On The Downside
Inflation Was Surprising On The Downside
Inflation Was Surprising On The Downside
It is little consolation that we were in good company when rattled by the May headline inflation reading, which came in at 8.5% year on year, and 1% higher than in April. Headline inflation was certainly affected by the price of food and energy, while core inflation was down to a higher price of shelter and goods (Chart 4). While energy is excluded from core inflation, it permeates all aspects of the economy, increasing costs of raw materials, manufacturing, and transportation, which eventually get passed through to the prices of goods and services. The same is the case with the rising wage bill. Chart 4Inflation Picked Up Because Of Prices Of Shelter And Core Goods
Adaptive Expectations: Revisiting Our Views
Adaptive Expectations: Revisiting Our Views
Importantly, what is next? It would help if US shale producers ramped up production, and the Saudis opened their oil spigots, bringing the price of energy down. Short of that, the price of oil should become a function of a slowing economy and fading demand for goods as interest rates rise (Chart 5). While the Fed has little control over food and energy prices, wage-price dynamics fall squarely in its court. The key channel through which the Fed controls inflation is by cooling the economy and reducing the demand for labor. Rising unemployment is the only way to extinguish inflation in a decisive way. Chart 5Rates Surged
Rates Surged
Rates Surged
Eventually, inflation will turn but it may be in fits and starts, and each data point will have a heavy effect on the pace of monetary tightening and the direction of equity markets, with lower inflation readings igniting rallies and higher readings triggering sell-offs. Inflation is embedded. Of course, sooner or later, it will abate but until then we expect a much more aggressive monetary policy. Monetary Conditions Have Tightened Dramatically As we summarized in our “Market Capitulation Scorecard,” one of the key conditions of an equity market bottom, and potentially, even a sustainable rebound, is stabilization in monetary conditions. We hypothesized that this could happen as the Fed tightens monetary conditions and growth slows and inflation turns, pulling down long rates. We also believed that the market focus is going to start shifting away from concerns about inflation to concerns about economic growth. Friday’s inflation reading has changed that – now investors worry about inflation and growth. Rates have initially skyrocketed, with the 10-year Treasury yield moving by 30bps points over the course of three days from 3.18 to 3.48. Real rates increased from 0.38% to 0.63%. US financial conditions have tightened sharply (Chart 6), moving to the neutral level. What’s next is the most difficult question of this report. It is likely this fast and furious move in rates has accomplished in five days what usually takes weeks. Tighter monetary policy, as it stands now, until more data comes in, is priced in. These moves capture changes in dot-plot expectations revised by the Fed, with the peak rate moving from around 3% to 4%. And, of course, that move got priced into the equity space with the S&P 500 pulling back sharply (Chart 7). Chart 6Financial Conditions Are Moving Into Restrictive Territory
Financial Conditions Are Moving Into Restrictive Territory
Financial Conditions Are Moving Into Restrictive Territory
Chart 7Surge In Yields Tanked Equities
Surge In Yields Tanked Equities
Surge In Yields Tanked Equities
The Fed will continue to tighten monetary policy and rates will rise until inflation rolls over. However, once inflation abates, long rates are likely to stabilize, signaling slower growth ahead. The Fed Won’t Come To The Rescue The Fed “put” is no longer at play as the Fed has signaled that it cares far more about combating inflation than the performance of the stock market. In fact, falling equities will play into Powell’s hand as a negative wealth effect is likely to put a lid on inflationary pressures, with wealthier Americans paying the toll. Kansas City Fed President Esther George, the only member of the FOMC that voted against a 75bps rate hike in the June meeting (she was in favor of 50 bps) said in May: “The Federal Reserve is not targeting equity markets in its battle against inflation, but that is "one of the avenues" where the impact of tighter monetary policy will be felt".1 Further, the Fed is very concerned about a recent pick-up in the long-term consumer inflation expectations (Chart 8) and will likely err on the side of caution to manage these expectations and avoid a self-fulfilling prophecy. Chart 8The Fed Is Worried About Inflation Expectations
The Fed Is Worried About Inflation Expectations
The Fed Is Worried About Inflation Expectations
Economic Growth Is Slowing Fast, Both At Home And Abroad A tighter monetary policy is designed to slow economic growth. The World Bank has downgraded global GDP growth expectations from 4.1% to 2.9%, and import volumes are declining. The Atlanta GDPNow forecast is hovering around zero (Chart 9). The Philly Fed survey has just crossed into negative territory (Chart 10). Retail sales are contracting both in nominal and real terms. According to the Citi Economic Surprise Index, economic growth is surprising on the downside (Chart 11). While the probability of a recession has picked up over the past few weeks, it is earnings growth disappointment that will have an adverse effect on equities in the near term. Chart 9Consensus Expectation Are Still Too High
Consensus Expectation Are Still Too High
Consensus Expectation Are Still Too High
Chart 10Many Signs That Economy Is Slowing Sharply
Many Signs That Economy Is Slowing Sharply
Many Signs That Economy Is Slowing Sharply
Chart 11Economic Growth Disappoints
Economic Growth Disappoints
Economic Growth Disappoints
We maintain our view that economic growth is decelerating and is already surprising on the downside. Earnings Growth Will Contract And Take The Market With It We stated in last week’s “Is An Earnings Recession In The Cards?” report that this year’s sell-off has been triggered by fears of an aggressive Fed, tighter monetary policy, and rising rates. However, the decom- position of the total return demonstrates that the pullback was all about multiple contraction, while strong earnings growth helped absorb the blow. We hypothesized that the multiple contraction phase is complete and that the next leg of the bear market will be all about growth, and earnings growth in particular (Chart 12). Hence if rates stabilize, then multiples will stay at the current level, and returns will be a function of earnings growth. However, the 10-year Treasury rate increasing from 3.18 has resulted in the S&P 500 multiple contracting from 16.7 to 15.6 over the course of just three days, while earnings growth expectations have remained mostly intact. Currently, according to our very simple model (Chart 13), a 3.5% 10-year Treasury yield corresponds to the S&P 500 forward multiple of 16.8x, which is close to where the S&P 500 stands today. If rates rise further, the forward multiple will fall. Chart 12Multiple Contraction Will Be Followed By Earnings Growth Deceleration
Multiple Contraction Will Be Followed By Earnings Growth Deceleration
Multiple Contraction Will Be Followed By Earnings Growth Deceleration
Chart 13Higher Rates Translate Into Lower Equity Multiples
Adaptive Expectations: Revisiting Our Views
Adaptive Expectations: Revisiting Our Views
Our earnings growth model predicts that earnings growth will trend towards zero over the next three months (Chart 14). Chart 14Earnings Growth Will Trend To Zero And Then Contract
Adaptive Expectations: Revisiting Our Views
Adaptive Expectations: Revisiting Our Views
Our scenario analysis matrix shows that if multiples stay stable around 17x forward earnings, while earnings contract by zero to five percent next quarter, the index will be flat to slightly down (Table 1). Broadly speaking, with a stable multiple, the market will move in line with earnings growth. If rates continue to rise and the multiple falls to 16x, going another 11% down is likely. Table 1The S&P 500 Target Scenario Analysis
Adaptive Expectations: Revisiting Our Views
Adaptive Expectations: Revisiting Our Views
Watch rates. With rates stable, the S&P 500 performance will be a function of earnings growth, and the market is likely to be range-bound. With rates rising, a multiple will contract further, and equities will fall. Investment Implications: “Fat And Down” The SPX has discounted plenty of negative news now that it is officially in bear market territory. However, we believe that the S&P 500 is not yet close to the bottom. The market is again pricing in tighter monetary policy and rising rates, which is accompanied by multiple contraction. It is hard to see equities bottoming without inflation peaking. In addition, we are predicting that the next leg of the bear market will be driven by earnings growth, which is likely to contract due to an economic slowdown both at home and abroad. As such, “fat and down” may be a more likely outcome than just “fat and flat.” Bottom Line Equities will move in a wide range over the next three to six months. However, if rates are to rise further and earnings growth is to contract, they may be trading in a downward sloping “channel,” or “fat and down.” We recommend that investors “not be heroes” and keep sector allocation close to the benchmark. Overweight defensives vs. cyclicals. Irene Tunkel Chief Strategist, US Equity Strategy irene.tunkel@bcaresearch.com Footnotes 1 https://www.reuters.com/business/feds-george-policy-not-aimed-equity-markets-though-it-will-be-felt-there-cnbc-2022-05-19/#:~:text=WASHINGTON%2C%20May%2019%20(Reuters),Esther%20George%20said%20on%20Thursday. Recommended Allocation Recommended Allocation: Addendum
Is Earnings Recession In The Cards?
Is Earnings Recession In The Cards?
Executive Summary The Fed has sought to convince one and all of its commitment to overcome high inflation and asset markets have taken heed, tightening financial conditions at a breakneck pace. As we write, the S&P 500 is down 23% year to date, the Bloomberg Barclays Treasury index is down 10%, its sister Corporate and High Yield indexes are down 15% and 12%, respectively, and the dollar had risen by 10% at its peak last week. According to Goldman Sachs’ Financial Conditions Index, the combination has amounted to a 3-percentage-point drag on GDP. Financial markets’ reaction function vis-a-vis monetary policy actions in this tightening cycle has been markedly different than in the previous three tightening cycles. Where tighter financial conditions had previously followed tighter monetary policy with a lengthy lag, they moved ahead of the Fed this time. If the recession is further away than moves in the bond, equity and foreign exchange markets imply, or if inflation eases across the rest of the year in line with our expectations, risk assets are poised to rebound. All Together Now
All Together Now
All Together Now
Bottom Line: The FOMC appears to be on course to induce a recession in its quest to bring inflation to heel. The outlook for financial markets depends on when the recession arrives and how bad it will be, however, and we see scope for positive surprises on both counts. Feature 2022 has not been a good year for financial markets and the action over the last week and a half has made it decidedly worse. In six sessions through Thursday, the S&P 500 nosedived 11%, swooning into bear market territory and unwinding nineteen months of advances. The benchmark 10-year Treasury note’s yield needed just three sessions to back up 45 basis points, from 3.05% to 3.5%. The upheaval has not been unique to the US – inflation and decelerating growth are global phenomena and central banks around the world are scrambling to tighten monetary conditions to rein in rising consumer prices while markets agonize about the effect on growth – but the Fed has been at the center of the storm and last week’s FOMC meeting inspired more swings. This week’s report highlights the most important takeaways from the latest FOMC meeting and how financial markets and Fed policy may interact going forward. There are several factors that are at least slightly different this time. Those differences may keep volatility elevated but they do not condemn stocks and bonds to continued declines. Financial markets have made huge pre-emptive moves that may be subject to reversals as inflation data improve and/or growth holds up better than expected. Prioritizing Price Stability Times have changed. Until inflation began to stir last year, the Fed had been able to prioritize the full employment element of its dual mandate for the entire post-crisis period. Chair Powell made it abundantly clear that price stability is the FOMC’s top priority now, opening his post-meeting remarks with the “overarching message” that it has the means and the will to bring inflation back down to its target level. Living up to this commitment will not be as much fun as trying to prod the economy back to full employment, and it looks as if it will ultimately result in a recession. Following 150 basis points (bps) of hikes so far this year, the target range for the fed funds rate now stands at 1.5-1.75%, and the revised Summary of Economic Projections (SEP) indicated that the median FOMC participant expects another 175 bps of hikes across the year’s remaining four meetings, bringing the funds rate to 3.25-3.5% by year end, at the low end of the money markets’ expectations range (Chart 1). Chart 1Markets And The Fed Are On The Same Page
Markets And The Fed Are On The Same Page
Markets And The Fed Are On The Same Page
During the press conference, Powell repeatedly cited the committee’s concern over rising inflation expectations, calling out the increase in 5-year inflation expectations in the University of Michigan’s preliminary June survey as “quite eye-catching.” The series rose from 30 basis points, to 3.3%, after spending the last four months at 3% and the previous ten in a tight 2.9-3.1% range. The reading was the highest since 2008, when the average national gasoline price first rose above $4 per gallon (Chart 2). Chart 2An "Eye-Catching" Move ...
An "Eye-Catching" Move ...
An "Eye-Catching" Move ...
Threading The Needle FOMC participants’ median projections for real growth, unemployment and inflation at the end of 2022, 2023 and 2024 were benign to pollyannaish, signaling their confidence that the committee will be able to thread the needle, wrestling inflation back to target while maintaining trend growth and capping the unemployment rate at 4.1%. That would meet anyone’s definition of a soft landing, but soft landings have been notoriously elusive. It is fiendishly difficult to fine-tune a complex multi-faceted economy with central bankers’ blunt tools. Empirically, every unemployment rate increase of at least one-third of a percentage point has led to a recession (Chart 3), so even the modest one-half point rise envisioned in the SEP could bring some challenges. A closer examination of past unemployment rate increases suggests a potential way around the dour history, but it depends on reversing the decline in labor force participation that is not yet fully understood. The labor force participation rate – the share of the 16-and-over population that is either working or actively looking for a job – remains more than a percentage point below its pre-pandemic level (Chart 4). If it recovered its early 2020 share, the labor force would expand by 2.8 million people. Chart 3... That Could Put Upward Pressure On The Unemployment Rate
... That Could Put Upward Pressure On The Unemployment Rate
... That Could Put Upward Pressure On The Unemployment Rate
Chart 4The Mystery Of The Missing Workers
The Mystery Of The Missing Workers
The Mystery Of The Missing Workers
If the participation rate were restored to its pre-pandemic level, the fortified labor force would allow for payroll expansion despite the unemployment rate increases envisioned in the latest SEP, as per the population growth and household-to-establishment-survey conversion rate estimates embedded in Table 1. It is reasonable to think that the expansion could continue, or the ensuing recession would be mild, despite a rising unemployment rate if payrolls manage to keep growing. An increasing unemployment rate/increasing payrolls scenario is plausible, but we cannot deem it probable when we do not know what has impeded the participation rate’s recovery. The committee is unlikely to be of one mind on the participation rate question, but it may hold the key to reconciling the sunny projections with the observed difficulty of achieving a soft landing. Table 1A Path To A Soft Landing
One Overarching Message, Multiple Potential Outcomes
One Overarching Message, Multiple Potential Outcomes
We’ll Take The Over We agree with Chair Powell and the FOMC’s assessment that solid consumer balance sheets and robust job gains have the economy on a sound footing, despite slowing growth. We do not see familiar underlying vulnerabilities that herald a reversal like an overreliance on debt, broad supply overhangs or an investment boom that has gone on too long. Inflation is the signal problem in the US and the rest of the world, and we continue to expect that it will recede in the second half as supply constraints in pandemic-squeezed segments ease and the pre-emptive backup in yields holds back some marginal demand for big-ticket items that require financing. No one knows the equilibrium fed funds rate in real time, but Powell indicated the committee thinks it’s around 3.5%, placing the year end 2022 median funds rate dot just shy of equilibrium and the median 2023 dot in modestly restrictive territory. A recession is the likely outcome of the rate hike campaign, but if the target rate doesn’t exceed the equilibrium rate until early next year, it may not begin until the middle of 2023 or early in 2024. Given that the consensus view now appears to be that a recession will begin this year if it hasn’t done so already, and financial markets have gone a long way toward pricing in its effects, we don’t see much upside to joining the bearish chorus now. We’ll take the over on the recession-by-year-end proposition. The Big Difference This Time When asked how high the funds rate has to go to arrest inflation, Powell offered the following description of how rate hikes work. “I … look at it this way: We move the policy rate that affects financial conditions, and that affects the economy. We have [more] rigorous ways to think about it, but ultimately it comes down to, ‘do we think financial conditions are in a place where they’re having the desired effect on the economy?’ And that desired effect is we’d like to see demand moderating.” Related Report US Investment StrategyInflation And Investing Two questions later, he approvingly noted how much bang the committee had already gotten for its buck to this point in the tightening campaign. “[T]his year has been a demonstration of how well [guidance] can work. With us having … done very little in the way of raising interest rates, financial conditions have tightened quite significantly through the expectations channel, as we’ve made clear what our plans are. I think that’s been … very healthy[.]” We stay away from making value judgments about policy, though we can see that a central banker would be in favor of anything that shortens the lag between policy actions and their economic effect. It is immediately obvious, however, that the current rate hike campaign’s real-time impact on financial conditions contrasts sharply with the last three decades’ campaigns (Chart 5). Every one-point change in the Goldman Sachs Financial Conditions Index (FCI) is calibrated to correspond to a one-percentage-point change in real GDP. The FOMC hiked by 175 bps ahead of the 2001 recession and the FCI eventually rose four points, peaking in October 2002, 29 months after the FOMC pushed fed funds to its terminal rate and 21 after it began cutting rates. After the 2004-6 “conundrum” campaign, when financial conditions eased despite 17 consecutive quarter-point rate hikes, the FCI tightened by five points, reaching its peak almost three years after the last hike and 18 months after the first cut. Chart 5Seize The Day
Seize The Day
Seize The Day
Chart 6Decoupling
Decoupling
Decoupling
Some of the response is a simple reflection of the about-face in the inflation backdrop. As our Chief Emerging Markets Strategist Arthur Budaghyan predicted in February 2021, Treasury yields and stock prices have flipped from several decades of positive correlation (rising stock prices offset falling bond valuations and vice versa) in a disinflationary environment to negative correlation in an inflationary environment. Now that Treasury bond, corporate bond and stock prices have been falling together, and the safe-haven dollar has risen amidst the general flight from risk, all of the FCI’s subcomponents have been reinforcing one another, making the index jumpier. More volatile financial conditions raise the probability of overshoots. To wit, has the FCI moved too far, too soon? The volcanic upward move in the 10-year Treasury yield has severed its reliable empirical link with the gold-to-commodity ratio (Chart 6, top panel) and the relative performance of cyclical and defensive equity sectors (Chart 6, bottom panel). They suggest a retracement could be in store. Projected policy rate differentials between the Fed and other currency majors’ central banks are narrowing as monetary policy makers rush to combat inflation. Gloom about growth is widespread. Any positive global growth surprise, from China regarding COVID or stimulus, from the Ukrainian theater, or from supply chain relief, could reel in the extended dollar. Investors should not lose sight of the potential that the coming recession could be mild. A 25% selloff in the S&P 500 may be nearly enough to address that outcome. As of Thursday’s close, the index’s forward four-quarter multiple was down to 15.5 from just under 22 at the start of the year – stocks were expensive, but the nearly 30% de-rating haircut has been severe. The 15.5 multiple assumes the next four quarters’ earnings grow almost 10% year-over-year, which looks ambitious. 5% growth would yield a 16.2 multiple, while no growth would price stocks at 17 times. Those multiples are not cheap, but a lot of froth has come out of the equity market. Against the gloom that has taken over financial markets, we think the next twelve months can be rewarding for investors in risk assets. We are alert to the principal ways our constructive view could be proven wrong and will change our view if it is invalidated by the evidence, but we remain overweight equities in a multi-asset portfolio over the cyclical three-to-twelve-month timeframe. Doug Peta, CFA Chief US Investment Strategist dougp@bcaresearch.com
Executive Summary Structural Tailwinds For The Franc
Structural Tailwinds For The Franc
Structural Tailwinds For The Franc
Volatility in FX markets is likely to remain elevated, as witnessed by the reaction of a full circle of central bank meetings this week.Policy convergence remains a good bet for interest rate curves and currency pairs. The SNB surprised markets by raising interest rates by 50 bps, to -0.25%, the first hike since 2007.Higher volatility will continue to buoy the Swiss franc in the short run.Structural appreciation in the franc is also likely over the coming decades (Feature Chart). Swiss stocks often perform well during economic downturns, but they are not particularly cheap, and are vulnerable to higher interest rates. Investors should only overweight Swiss stocks if they expect more significant downside to global stocks.Valuation favors the franc versus the dollar. However, EUR/CHF and GBP/CHF are closer to fair value. CHF/JPY is expensive; hence, the yen is a better hedge for downside economic surprises. Go short CHF/JPY as a trade.BCA’s Foreign Exchange Strategy was short CHF/SEK at 10.2 with stop loss at 10.5. That stop was hit overnight, triggering a loss of -3.3%. Stand aside for now.Bottom Line: Favor the franc over the short term against other pro-cyclical currencies, with a view to downgrade CHF when it becomes evident that economic growth is bottoming. Any further bout of Swiss equity outperformance, prompted by global risk aversion, offers an attractive selling opportunity versus Eurozone stocks.Feature Chart 1The SNB Has Capitulated To Rising Inflation
The SNB Has Capitulated To Rising Inflation
The SNB Has Capitulated To Rising Inflation
Volatility in FX markets is likely to remain elevated. This week, the Fed delivered its first 75 bps interest rate hike since 1994. It also increased its expected year-end level for the Fed Funds rate to 3.4% from 1.9%, and to 3.8% from 3.4% at the end of 2023. The FX market had been warming up to a hawkish surprise, but the dollar surged on the news, hitting a fresh two-decade high of 105.5, before later reversing gains.Meanwhile, the European Central Bank (ECB) held an emergency meeting on Wednesday, to try to mitigate the rise in Italian yields, which hit as high as 4.2% on Tuesday, or 243 bps over German 10-year yields. The subsequent statement released by the Governing Council offered no concrete details. Yes, the reinvestments of the proceeds from maturing debt in the Pandemic Emergency Purchase Program (PEPP) will flow mostly to peripheral markets, but investors want clarity on the nature of the long-awaited policy plan to tackle fragmentation risk in the Euro Area. As a result, peripheral bond markets will remain fragile until a bold program comes to fruition.To cement currency volatility this week, SNB Governor Thomas Jordan surprised markets by raising interest rates by 50 bps in Switzerland, to -0.25%, the first hike since the Global Financial Crisis (Chart 1). The negative interest rate threshold for sight deposits was also lowered, a move encouraging banks to pack reserves at the SNB. The Bank of England also raised interest rates in line with market expectations. The move initially disappointed GBP bulls, but sterling is holding above our 1.20 floor.An environment of monetary policy uncertainty, rising recession risks in response to high inflation, and the potential for central bank policy mistakes bodes well for safe-haven assets. In Europe, the market with the strongest defensive profile is Switzerland. In this report, we address whether investors should bet on continued appreciation of the franc and an outperformance of Swiss stocks, especially now that the SNB has turned hawkish.Switzerland Versus The WorldGlobal economic growth is slowing and a small/open economy like Switzerland’s has not been spared. The KOF economic barometer, a key leading indicator for Swiss GDP growth, has collapsed over the past twelve months from 144 to 97 as global industrial activity decelerated (Chart 2). Despite softening growth, global inflation refuses to decline, forcing central banks worldwide to lean into the slowdown. This threatens to cut the post-pandemic business cycle expansion short. Chart 2The SNB Is Tightening Into A Slowing Economy
The SNB Is Tightening Into A Slowing Economy
The SNB Is Tightening Into A Slowing Economy
Surprisingly, the Swiss economy is generally performing better than the rest of Europe. Historically, Swiss economic performance is procyclical due to the large share of exports within its GDP. Hence, a slowdown in global manufacturing often creates a large threat to Swiss growth. Going forward, can the Swiss economy diverge from that of the rest of the world (Chart 3)? Such a divergence is not probable, but a few factors will protect the Swiss economy:Switzerland still has one of the lowest policy rates in the G10, even after today’s 50bps interest rate increase. This has tremendously helped ease monetary conditions. Our monetary gauge is at its most accommodative level in over two decades (Chart 4). Chart 3The Swiss Economy Is Procyclical
The Swiss Economy Is Procyclical
The Swiss Economy Is Procyclical
Chart 4Swiss Monetary Conditions Are Still Accommodative
Swiss Monetary Conditions Are Still Accommodative
Swiss Monetary Conditions Are Still Accommodative
Swiss inflation remains the lowest in the G10 outside Japan. In Switzerland, the main driver of price increases has been goods, while services inflation remains subdued. Consequently, the SNB has been tolerating an appreciating franc to temper imported inflation (Chart 5), while keeping domestic borrowing costs at very accommodative levels. In its updated forecasts, the SNB now expects a -0.25% interest rate to allow Swiss inflation to moderate to 1.9% in 2023 and 1.6% in 2024. Chart 5Swiss Inflation Is Surprising To The Upside
Swiss Inflation Is Surprising To The Upside
Swiss Inflation Is Surprising To The Upside
Part of the reason Switzerland has low inflation has been the tremendous productivity gains, especially relative to its trading partners (Chart 6). Swiss income-per-capita is elevated, but wage growth has lagged output gains, which limits the risk of a wage-inflation spiral. It is notable that part-time employment continues to dominate job gains, implying that the need for precautionary savings will remain high in Switzerland. Chart 6A Productivity Profile For Switzerland
A Productivity Profile For Switzerland
A Productivity Profile For Switzerland
Higher productivity growth and the elevated national savings leave their footprint on the trade data. The Swiss trade balance is hitting fresh highs, unlike Europe or Japan (Chart 7). This could potentially create a problem for the Swiss economy as it puts upward pressure on the CHF at a time when global manufacturing output is slowing. However, Switzerland specializes in high value-added exports with an elevated degree of complexity, that stand early in global supply chains. These type of goods are likely to remain in high demand in a global environment marked by supply-chain bottlenecks and high-capacity utilization. Chart 7Structural Tailwinds For The Franc
Structural Tailwinds For The Franc
Structural Tailwinds For The Franc
Finally, Switzerland does not import energy to fulfill its electricity production. Hydropower accounts for roughly 61.4% of electricity generation, followed by nuclear power at 28.5%. This has partially insulated Switzerland from the energy shock hurting economic activity and trade balances in the EU. For example, German electricity generation is 28.8% coal and 14.7% natural gas.Bottom Line: The Swiss economy is reopening and is relatively insulated from the Russia-Ukraine conflict. This limits to some degree how closely Switzerland will track the global and European economic slowdown. It creates a departure from the traditional pro-cyclicality of the Swiss economy.The SNB, The SARON Curve, And The Swiss FrancIf the Swiss economy surprises to the upside, the case for the SNB to tolerate a rising franc becomes even stronger. The pace of foreign exchange reserve accumulation is already decelerating (Chart 8). Governor Thomas Jordan has been very clear: as global prices rise, the fair value of the franc is also rising, which implies a willingness to tolerate currency strength. In a purchasing power parity framework, higher external inflation makes Swiss goods relatively cheaper. This allows foreigners to bid up the currency.Even with today’s updated pricing, the SNB is still expected to remain among the most dovish central banks in the G10 (Chart 9). If inflationary pressures prove sticky, the SNB will step up its hawkish rhetoric. If inflationary fears subside, then global rates will fall as well, which has usually been a boon for the franc. More specifically, this would be negative for the EUR/CHF cross (Chart 10). Chart 8Less Intervention By The SNB
Less Intervention By The SNB
Less Intervention By The SNB
Chart 9The SARON Curve Has Adjusted Higher
The SARON Curve Has Adjusted Higher
The SARON Curve Has Adjusted Higher
Chart 10EUR/CHF And Bund Yields Can Continue To Diverge
EUR/CHF And Bund Yields Can Continue To Diverge
EUR/CHF And Bund Yields Can Continue To Diverge
The Swiss economy can tolerate an appreciating CHF, but can it withstand higher interest rates? We believe so. Switzerland is a net creditor nation, but its domestic non-financial debt is also extremely elevated. Thus, the Swiss economy is vulnerable to higher rates, especially the housing market (Chart 11). Nonetheless, internal adjustments will soften the blow and increase affordability. Of note, property speculation in Switzerland has decreased in response to macroprudential measures. Growth in rental housing prices, which usually constitute the bulk of investment homes, has collapsed, but the price of owner-occupied homes has proven more robust (Chart 12). A cap on the percentage of secondary homes in any Canton as well as tighter lending standards have also helped. In a renewed update to its Financial Stability Report, Fritz Zurbrügg, Vice Chairman of the Governing Board, suggests that Swiss banks are well capitalized, especially given the recent reactivation of the countercyclical capital buffer. Chart 11Higher Rates Are A Risk For Swiss Real Estate
Higher Rates Are A Risk For Swiss Real Estate
Higher Rates Are A Risk For Swiss Real Estate
Chart 12Some Adjustment Already In Investment Home Prices
Some Adjustment Already In Investment Home Prices
Some Adjustment Already In Investment Home Prices
In the very near term, demographics might also be a tailwind. The pandemic limited immigration to Switzerland, but the working-age population is rebounding anew (Chart 13), which will create a cushion under housing and support domestic demand. Chart 13A Small Demographic Tailwind For Home Prices
A Small Demographic Tailwind For Home Prices
A Small Demographic Tailwind For Home Prices
Stronger aggregate demand in an inflationary world will justify the need for less monetary accommodation. In a nutshell, the SNB is likely to continue walking the path of “least regrets” like most central banks, by tightening monetary policy to meet its 2% inflation mandate, but pausing if economic conditions warrant.The currency has historically been used as a key tool for calibrating financial conditions. From a fundamental perspective, our PPP models suggest the franc is quite cheap versus the dollar but at fair value versus the euro and sterling. This is echoed by Governor Jordan, who no longer views the franc as expensive. Our models adjusts the consumption basket in Switzerland for an apples-to-apples comparison across both the UK and the eurozone (Chart 14). Chart 14AA CHF Is At Fair Value Versus The EUR And GBP
A CHF Is At Fair Value Versus The EUR And GBP
A CHF Is At Fair Value Versus The EUR And GBP
Chart 14BA CHF Is At Fair Value Versus The EUR And GBP
A CHF Is At Fair Value Versus The EUR And GBP
A CHF Is At Fair Value Versus The EUR And GBP
Finally, hedging costs for shorting the franc against the dollar have risen substantially (Chart 15). As such, any short bets on the franc are likely being placed naked. If the Fed ends up tempering its pace of rate hikes next year in response to weaker US activity, short-covering activity is likely to accentuate any pre-existing strength in the CHF. Chart 15Hedging Costs For USD/CHF Carry Trades Have Risen Hedging Costs Are Prohibitive
Hedging Costs For USD/CHF Carry Trades Have Risen Hedging Costs Are Prohibitive
Hedging Costs For USD/CHF Carry Trades Have Risen Hedging Costs Are Prohibitive
Bottom Line: The franc is undervalued against the dollar, and a good hedge against a rise in volatility versus other procyclical currencies. This places the franc in a good “heads I win, tails I don’t loose too much” bet. Swiss interest rates are also likely to climb higher. However, because the franc will do the bulk of the monetary tightening, the SNB is likely to lag the expectations now embedded in the SARON curve.What About Swiss Equities?Despite the cyclical nature of the Swiss economy, Swiss equities are extremely defensive. Swiss stocks have little to do with the domestic economy and are mostly a collection of large multinationals, dominated by the healthcare and consumer staples sectors, which together account for roughly 60% of the Swiss MSCI benchmark.This defensive attribute has created its own problem for Swiss equities. Relative to the Eurozone, the Swiss market has moved massively ahead of profitability, and it is now more expensive than at the apex of the European debt crisis in 2012 (Chart 16). Moreover, the jump in German yields is becoming increasingly problematic for Swiss stocks that historically perform poorly when global interest rates are rising (Chart 17). Chart 16Swiss Stocks Are Expensive
Swiss Stocks Are Expensive
Swiss Stocks Are Expensive
Chart 17A Lost Tailwind
A Lost Tailwind
A Lost Tailwind
In the near term, Swiss equities will only be able to defy the gravitational pull created by demanding valuations and higher yields if global risk aversion remains elevated. However, once global stocks find a floor and Italian spreads begin to narrow, Swiss stocks are likely to underperform massively (Chart 18). It could take a few more weeks before the BTP/Bund spreads narrow as the recent ECB announcement was rather tepid. However, the ECB holding an emergency meeting and issuing a formal statement addressing the problem facing peripheral bond markets suggests that a formal program designed to manage fragmentation risk will emerge before the end of the summer.Beyond their defensive attributes, Swiss stocks also correlate to the Quality Factor. The robust performance of this factor since the turn of the millennium, in Europe and globally, has allowed the Swiss market to greatly outperform Eurozone equities (Chart 19). However, the Quality Factor has begun to underperform, which indicates that the Swiss market is losing another of its underpinnings. Chart 18Near-term, Follow Risk Aversion
Near-term, Follow Risk Aversion
Near-term, Follow Risk Aversion
Chart 19Swiss Stocks Are About Quality
Swiss Stocks Are About Quality
Swiss Stocks Are About Quality
These observations imply that over the next 12 to 18 months, Swiss equities will underperform their Euro Area counterparts. Materials and consumer staples stand out as the two sectors with the most extended valuations relative to their Euro Area competitors, especially since their relative performances have become dissociated from relative profits (Chart 20). They should carry maximum underweights relative to their European counterparts. The healthcare sector is Switzerland’s largest market weight. It is not as expensive relative to the Eurozone as the materials and consumer staples sectors, but it carries enough of a premium that investors should still underweight this sector relative to its eurozone competitor (Chart 21). Chart 20Dangerous Setup For Swiss Materials and Staples
Dangerous Setup For Swiss Materials and Staples
Dangerous Setup For Swiss Materials and Staples
Chart 21The Swiss Heavyweight Is Becoming Pricey
The Swiss Heavyweight Is Becoming Pricey
The Swiss Heavyweight Is Becoming Pricey
Bottom Line: The defensive nature of the Swiss market has allowed for a large outperformance over European equities. However, the Swiss market is now very expensive on a relative basis, and it is vulnerable to higher interest rates. While global risk aversion can still buoy the Swiss market in the near term, conditions are falling into place for Swiss stocks to underperform their Eurozone counterpart over a 12-to-18 month window. Materials and consumer staples are the sectors mostly likely to experience a large underperformance relative to their Euro Area competitors, followed by the healthcare sector. Investment ConclusionsVolatility in FX markets is likely to remain elevated, as witnessed by the reaction of a full circle of central bank meetings this week.Policy convergence remains a good bet for interest rate curves and currency pairs. The SNB surprised markets by raising interest rates by 50 bps, to -0.25%, the first hike since 2007 (Chart 1).Higher volatility will continue to buoy the Swiss franc in the short run.Structural appreciation in the franc is also likely over the coming decades.Swiss stocks often perform well during economic downturns, but they are not particularly cheap, and vulnerable to higher interest rates. Investors should only overweight Swiss stocks if they expect more significant downside to global stocks.Valuation favors the franc versus the dollar. However, EUR/CHF and GBP/CHF are closer to fair value. CHF/JPY is expensive; hence the yen is a better hedge for downside economic surprises. Go short CHF/JPY as a trade.BCA’s Foreign Exchange Strategy was short CHF/SEK at 10.2 with stop loss at 10.5. That stop was hit overnight, triggering a loss of -3.3%. Stand aside for now. Chester NtoniforForeign Exchange Strategistchestern@bcaresearch.comMathieu Savary Chief European StrategistMathieu@bcaresearch.com
Listen to a short summary of this report. Executive Summary Higher Real Yields Have Weighed On Equity Valuations
Higher Real Yields Have Weighed On Equity Valuations
Higher Real Yields Have Weighed On Equity Valuations
I had the pleasure of visiting clients in Saudi Arabia, Bahrain, and Abu Dhabi last week. In contrast to the rest of the world, the mood in the Middle East was very positive. While high oil prices are helping, there is also a lot of optimism about ongoing structural reforms. Petrodollar flows are increasingly being steered towards private and public equities. EM assets stand to benefit the most. Producers in the region are trying to offset lost Russian output, but realistically, they will not be able to completely fill the gap in the near term. Today’s high energy prices have largely baked in this reality, as reflected in strongly backwardated futures curves. There was no consensus about how high oil prices would need to rise to trigger a global recession, although the number $150 per barrel got bandied about a lot. Given that most Middle Eastern currencies are pegged to the dollar, there was a heavy focus on Fed policy. Market estimates of the neutral rate in the US have increased rapidly towards our highly out-of-consensus view. Nevertheless, we continue to see modest upside for bond yields over a multi-year horizon. Over a shorter-term 6-to-12-month horizon, the direction of bond yields will be guided by the evolution of inflation. While US CPI inflation rose much more than expected in May, the details of the report were somewhat less worrying, as they continue to show significant supply-side distortions. Bottom Line: Inflation should come down during the remainder of the year, allowing the Fed to breathe a sigh of relief and stocks to recover some of their losses. A further spike in oil prices is a major risk to this view. Dear Client, Instead of our regular report next week, we will be sending you a Special Report written by Chester Ntonifor, BCA Research’s Chief Foreign Exchange Strategist, discussing the outlook for gold. We will be back the following week with the GIS Quarterly Strategy Outlook, where we will explore the major trends that are set to drive financial markets in the rest of 2022 and beyond. As always, I will hold a webcast discussing the outlook the following week, on Thursday, July 7th. Best regards, Peter Berezin Chief Global Strategist Peter in Arabia I had the pleasure of visiting clients in Saudi Arabia, Bahrain, and Abu Dhabi last week. This note summarizes my impressions and provides some commentary about recent market turmoil. The Mood in the Region is Very Positive In contrast to the rest of the world, the mood in the Middle East was upbeat. Obviously, high oil prices are a major contributor (Chart 1). Across the region, stock markets are still up for the year (Chart 2). Chart 1Oil Prices Have Shot Up
Oil Prices Have Shot Up
Oil Prices Have Shot Up
Chart 2Middle Eastern Stock Markets Are Doing Relatively Well This Year
Middle Eastern Stock Markets Are Doing Relatively Well This Year
Middle Eastern Stock Markets Are Doing Relatively Well This Year
That said, I also felt that investors were encouraged by ongoing structural reforms, especially in Saudi Arabia where the Vision 2030 program is being rolled out. The program seeks to diversify the Saudi economy away from its historic reliance on petroleum exports. A number of people I spoke with cited the Saudi sovereign wealth fund’s acquisition of a majority stake in Lucid, a California-based EV startup, as the sort of bold move that would have been unthinkable a few years ago. I first visited Riyadh in May 2011 where I controversially delivered a speech entitled “The Coming Commodity Bust” (oil was $120/bbl then and copper prices were near an all-time high). The city has changed immensely since then. The number of restaurants and entertainment venues has increased exponentially. The ban on women drivers was lifted only four years ago. In that short time, it has become a common-day occurrence. Capital Flows Into and Out of the Region are Reflecting a New Geopolitical Reality In addition to high oil prices and structural reforms, geopolitical considerations are propelling significant capital inflows into the region. The freezing of Russia’s foreign exchange reserves sent a shockwave across much of the world, with a number of other EM countries wondering if “they are next.” Ironically, the Middle East has emerged as a neutral player of sorts in this multipolar world, and hence a safer destination for capital flows. On the flipside, the region’s oil exporters appear to be acting more strategically in how they allocate their petrodollar earnings. Rather than simply parking the proceeds of oil sales in overseas US dollar bank accounts, they are investing them in ways that further their economic and political goals. One clear trend is that equity allocations to both overseas public and private markets are rising. Other emerging markets stand to benefit the most from this development, especially EMs who have assets that Middle Eastern countries deem important – assets tied to food security being a prime example. Assuming that the current level of oil prices is maintained, we estimate that non-US oil exports will rise to $2.5 trillion in 2022, up from $1.5 trillion in 2021 (Chart 3). About 40% of this windfall will flow to the Middle East. That is a big slug of cash, enough to influence the direction of equity markets. Chart 3Oil Exporters Reaping The Benefits Of High Oil Prices
An Oasis Of Optimism: Notes From The Middle East
An Oasis Of Optimism: Notes From The Middle East
Middle Eastern Energy Producers Will Boost Output, But Don’t Expect Any Miracles in the Short Term Russian oil production will likely fall by about 2 million bpd relative to pre-war levels over the next 12 months. To help offset the impact, OPEC has already raised production by 200,000 barrels and will almost certainly bump it up again following President Biden’s visit to the region in July (Chart 4). The decision to raise production to stave off a super spike in oil prices is not entirely altruistic. The region’s oil exporters know that excessively high oil prices could tip the global economy into recession, an outcome that would surely lead to much lower oil prices down the road. There was not much clarity on what that tipping point is, but the number $150 per barrel got bandied around a lot. Politics is also a factor. A further rise in oil prices could compel the US to make a deal with Iran, something the Saudis do not want to see happen. Still, there is a practical limit to how much more oil the Saudis and other Middle Eastern producers can bring to market in the near term. Today’s high energy prices have largely baked in this reality, as reflected in strongly backwardated futures curves (Chart 5). Chart 4Output Trends In The Major Oil Producers
Output Trends In The Major Oil Producers
Output Trends In The Major Oil Producers
Chart 5Energy Prices On Both Sides Of The Atlantic
An Oasis Of Optimism: Notes From The Middle East
An Oasis Of Optimism: Notes From The Middle East
Data on Saudi’s excess capacity is notoriously opaque, but I got the feeling that an extra 1-to-1.5 million bpd was the most that the Kingdom could deliver. The same constraints apply to natural gas. Qatar is investing nearly $30 billion to expand its giant North Field, which should allow gas production to rise by as much as 60%. However, it will take four years to complete the project. The share of Qatari liquefied natural gas (LNG) going to Europe has actually declined this year. About 80% of Qatar’s LNG is sold to Asian buyers under long-term contracts that cannot be easily adjusted. And even if those contracts could be rewritten, this would only bring limited benefits to Europe. For example, Germany has no terminals to accept LNG imports, although it is planning to build two. While there was plenty of sympathy to Europe’s plight in the region, there was also a sense that European governments had been cruising for a bruising by doubling down on strident anti-fossil fuel rhetoric over the past decade without doing much to end their dependence on Russian oil and gas. In that context, few in the region seemed willing to bend over backwards to help Europe. In the meantime, the US remains Europe’s best hope. US LNG shipments to Europe have tripled since last year. The US is now sending nearly three quarters of its liquefied gas to Europe. This has pushed up US natural gas prices, although they still remain a fraction of what they are in Europe. Huge Focus on the Fed Chart 6Most Of The Increase In Bond Yields Has Been In The Real Component
Most Of The Increase In Bond Yields Has Been In The Real Component
Most Of The Increase In Bond Yields Has Been In The Real Component
Most Middle Eastern currencies are pegged to the dollar, and hence the region effectively imports its monetary policy from the US. Not surprisingly, clients were very focused on the Federal Reserve. Many expressed concern about the abrupt pace of rate hikes. One of our high-conviction views is that the neutral rate of interest in the US has risen as the household deleveraging cycle has ended, fiscal policy has become structurally looser, and a growing number of baby boomers have transitioned from working (and saving) to retirement (and dissaving). The markets have rapidly priced in this view over the course of 2022. The 5-year/5-year forward Treasury yield – a proxy for the neutral rate – has increased from 1.90% at the start of the year to 3.21% at present. Most of this increase in the market’s estimate of the neutral rate has occurred in the real component. The 5-year/5-year forward TIPS yield has climbed from -0.49% to 0.84%; in contrast, the implied TIPS breakeven inflation rate has risen from only 2.24% to 2.37% (Chart 6). Implications of Higher Bond Yields on Equity Prices and the Economy Chart 7Higher Real Yields Have Weighed On Equity Valuations
Higher Real Yields Have Weighed On Equity Valuations
Higher Real Yields Have Weighed On Equity Valuations
As both theory and practice suggest, there is a strong negative correlation between real bond yields and equity valuations. Chart 7 shows that the S&P 500 forward P/E ratio has been moving broadly in line with the 5-year/5-year forward TIPS yield. The bad news is that there is still scope for bond yields to rise over the long haul. Our fair value estimate of 3.5%-to-4% for the neutral rate is about 25-to-75 basis points above current pricing. The good news is that a high neutral rate helps insulate the economy from a near-term recession. Recessions typically occur only when monetary policy turns restrictive. A few clients cited the negative Q1 GDP reading and the near-zero Q2 growth estimate in the Atlanta Fed GDPNow model as evidence that a US recession is either close at hand or has already begun (Chart 8). Chart 8Underlying US Growth Is Expected To Be Solid In Q2
An Oasis Of Optimism: Notes From The Middle East
An Oasis Of Optimism: Notes From The Middle East
We would push back against such an interpretation. In contrast to the -1.5% real GDP print, real Gross Domestic Income (GDI) rose by 2.1% in Q1. Conceptually, GDP and GDI should be equal, but since the two numbers are compiled in different ways, there can often be major statistical discrepancies. A simple average of the two suggests the US economy still grew in the first quarter. More importantly, real final sales to private domestic purchasers rose by 3.9% in Q1. This measure of economic activity – which strips out the often-noisy contributions from inventories, government expenditures, and net exports – is the best predictor of future GDP growth of any item in the national accounts (Table 1). Table 1A Good Sign: Real Final Sales To Private Domestic Purchasers Rose By 3.9% In Q1
An Oasis Of Optimism: Notes From The Middle East
An Oasis Of Optimism: Notes From The Middle East
As far as Q2 is concerned, real final sales to private domestic purchasers are tracking at 2.0% according to the Atlanta Fed model – a clear deceleration from earlier this year, but still consistent with a generally healthy economy. Growth will probably slow in the third quarter, reflecting the impact of higher gasoline prices, rising interest rates, and lower asset prices. Nevertheless, the fundamental underpinnings for the economy – low household debt, $2.2 trillion in excess savings, a dire need to boost corporate capex and homebuilding, and a strong labor market – remain in place. The odds of a recession in the next 12 months are quite low. Gauging Near-Term Inflation Dynamics A higher-than-expected neutral rate of interest implies that bond yields will probably rise from current levels over the long run. Over a shorter-term 6-to-12-month horizon, however, the direction of yields will be guided by the evolution of inflation. While the core CPI surprised on the upside in May, the details of the report were somewhat less worrying, as they continue to show significant supply-side distortions. Excluding vehicles, core goods prices rose 0.3% in May, down from a Q1 average of 0.7% (Chart 9). Recent commentary from companies such as Target suggest that goods inflation will ease further. Chart 9Goods Inflation Is Moderating, While Service Price Growth Is Elevated
An Oasis Of Optimism: Notes From The Middle East
An Oasis Of Optimism: Notes From The Middle East
Stripping out energy-related services, services inflation slowed slightly to 0.6% in May from 0.7% in April. A deceleration in wage growth should help keep a lid on services inflation over the coming months (Chart 10). Chart 10A Deceleration In Wage Growth Should Help Keep Services Inflation Contained
An Oasis Of Optimism: Notes From The Middle East
An Oasis Of Optimism: Notes From The Middle East
During his press conference, Fed Chair Powell described the rise in inflation expectations in the University of Michigan survey as “quite eye-catching.” Although long-term inflation expectations remain a fraction of what they were in the early 1980s, they did rise to the highest level in 14 years in June (Chart 11). Powell also noted that the Fed’s Index of Common Inflation Expectations has been edging higher. The Fed’s focus on ensuring that inflation expectations remain well anchored is understandable. That said, there is a strong correlation between the level of gasoline prices and inflation expectations (Chart 12). If gasoline prices come down from record high levels over the coming months, inflation expectations should drop. Chart 11Consumer Long-Term Inflation Expectations Keep Rising, But Are Still Not At Historically High Levels
Consumer Long-Term Inflation Expectations Keep Rising, But Are Still Not At Historically High Levels
Consumer Long-Term Inflation Expectations Keep Rising, But Are Still Not At Historically High Levels
Chart 12Lower Gasoline Prices Would Help Soothe Consumer Fears Over Inflation
Lower Gasoline Prices Would Help Soothe Consumer Fears Over Inflation
Lower Gasoline Prices Would Help Soothe Consumer Fears Over Inflation
The Fed expects core PCE inflation to fall to 4.3% on a year-over-year basis by the end of 2022. This would require month-over-month readings of about 0.35 percentage points, which is slightly above the average of the past three months (Chart 13). Our guess is that the Fed may be highballing its near-term inflation projections in order to give itself room to “underpromise and overdeliver” on the inflation front. If so, we could see inflation estimates trimmed later this year, which would provide a more soothing backdrop for risk assets. Chart 13AUS Inflation Will Fall By More Than The Fed Expects If The Monthly Change In Core PCE Is Less Than 0.35% (I)
US Inflation Will Fall By More Than The Fed Expects If The Monthly Change In Core PCE Is Less Than 0.35% (I)
US Inflation Will Fall By More Than The Fed Expects If The Monthly Change In Core PCE Is Less Than 0.35% (I)
Chart 13BUS Inflation Will Fall By More Than The Fed Expects If The Monthly Change In Core PCE Is Less Than 0.35% (II)
US Inflation Will Fall By More Than The Fed Expects If The Monthly Change In Core PCE Is Less Than 0.35% (II)
US Inflation Will Fall By More Than The Fed Expects If The Monthly Change In Core PCE Is Less Than 0.35% (II)
Concluding Thoughts on Investment Strategy According to Bank of America, fund managers cut their equity exposure to the lowest since May 2020. Optimism on global growth fell to a record low. Meanwhile, bears outnumbered bulls by 39 percentage points in this week’s AAII poll (Chart 14). If the stock market is about to crash, it will be the most anticipated crash in history. In my experience, markets rarely do what most people expect them to do. Chart 14Sentiment Towards Equities Is Pessimistic
Sentiment Towards Equities Is Pessimistic
Sentiment Towards Equities Is Pessimistic
Chart 15Global Equities Are More Attractively Valued After The Recent Sell-Off
Global Equities Are More Attractively Valued After The Recent Sell-Off
Global Equities Are More Attractively Valued After The Recent Sell-Off
Chart 16US And European EPS Estimates Have Been Trending Higher This Year
US And European EPS Estimates Have Been Trending Higher This Year
US And European EPS Estimates Have Been Trending Higher This Year
US equities are trading at 16.3-times forward earnings, with non-US stocks sporting a forward P/E ratio of 12.1 (Chart 15). Despite the decline in share prices, earnings estimates in both the US and Europe have increased since the start of the year (Chart 16). The consensus is that those estimates will fall. However, if our expectation that a recession will be averted over the next 12 months pans out, that may not happen. A sensible strategy right now is to maintain a modest overweight to stocks while being prepared to significantly raise equity exposure once clear evidence emerges that inflation has peaked. Peter Berezin Chief Global Strategist peterb@bcaresearch.com Follow me on LinkedIn Twitter View Matrix
An Oasis Of Optimism: Notes From The Middle East
An Oasis Of Optimism: Notes From The Middle East
Special Trade Recommendations Current MacroQuant Model Scores
An Oasis Of Optimism: Notes From The Middle East
An Oasis Of Optimism: Notes From The Middle East
Executive Summary Structural Tailwinds For The Franc
Structural Tailwinds For The Franc
Structural Tailwinds For The Franc
Volatility in FX markets is likely to remain elevated, as witnessed by the reaction of a full circle of central bank meetings this week. Policy convergence remains a good bet for interest rate curves and currency pairs. The SNB surprised markets by raising interest rates by 50 bps, to -0.25%, the first hike since 2007. Higher volatility will continue to buoy the Swiss franc in the short run. Structural appreciation in the franc is also likely over the coming decades (Feature Chart). Swiss stocks often perform well during economic downturns, but they are not particularly cheap, and are vulnerable to higher interest rates. Investors should only overweight Swiss stocks if they expect more significant downside to global stocks. Valuation favors the franc versus the dollar. However, EUR/CHF and GBP/CHF are closer to fair value. CHF/JPY is expensive; hence, the yen is a better hedge for downside economic surprises. Go short CHF/JPY as a trade. BCA’s Foreign Exchange Strategy was short CHF/SEK at 10.2 with stop loss at 10.5. That stop was hit overnight, triggering a loss of -3.3%. Stand aside for now. Bottom Line: Favor the franc over the short term against other pro-cyclical currencies, with a view to downgrade CHF when it becomes evident that economic growth is bottoming. Any further bout of Swiss equity outperformance, prompted by global risk aversion, offers an attractive selling opportunity versus Eurozone stocks. Feature Chart 1The SNB Has Capitulated To Rising Inflation
The SNB Has Capitulated To Rising Inflation
The SNB Has Capitulated To Rising Inflation
Volatility in FX markets is likely to remain elevated. This week, the Fed delivered its first 75 bps interest rate hike since 1994. It also increased its expected year-end level for the Fed Funds rate to 3.4% from 1.9%, and to 3.8% from 3.4% at the end of 2023. The FX market had been warming up to a hawkish surprise, but the dollar surged on the news, hitting a fresh two-decade high of 105.5, before later reversing gains. Meanwhile, the European Central Bank (ECB) held an emergency meeting on Wednesday, to try to mitigate the rise in Italian yields, which hit as high as 4.2% on Tuesday, or 243 bps over German 10-year yields. The subsequent statement released by the Governing Council offered no concrete details. Yes, the reinvestments of the proceeds from maturing debt in the Pandemic Emergency Purchase Program (PEPP) will flow mostly to peripheral markets, but investors want clarity on the nature of the long-awaited policy plan to tackle fragmentation risk in the Euro Area. As a result, peripheral bond markets will remain fragile until a bold program comes to fruition. To cement currency volatility this week, SNB Governor Thomas Jordan surprised markets by raising interest rates by 50 bps in Switzerland, to -0.25%, the first hike since the Global Financial Crisis (Chart 1). The negative interest rate threshold for sight deposits was also lowered, a move encouraging banks to pack reserves at the SNB. The Bank of England also raised interest rates in line with market expectations. The move initially disappointed GBP bulls, but sterling is holding above our 1.20 floor. An environment of monetary policy uncertainty, rising recession risks in response to high inflation, and the potential for central bank policy mistakes bodes well for safe-haven assets. In Europe, the market with the strongest defensive profile is Switzerland. In this report, we address whether investors should bet on continued appreciation of the franc and an outperformance of Swiss stocks, especially now that the SNB has turned hawkish. Switzerland Versus The World Global economic growth is slowing and a small/open economy like Switzerland’s has not been spared. The KOF economic barometer, a key leading indicator for Swiss GDP growth, has collapsed over the past twelve months from 144 to 97 as global industrial activity decelerated (Chart 2). Despite softening growth, global inflation refuses to decline, forcing central banks worldwide to lean into the slowdown. This threatens to cut the post-pandemic business cycle expansion short. Chart 2The SNB Is Tightening Into A Slowing Economy
The SNB Is Tightening Into A Slowing Economy
The SNB Is Tightening Into A Slowing Economy
Surprisingly, the Swiss economy is generally performing better than the rest of Europe. Historically, Swiss economic performance is procyclical due to the large share of exports within its GDP. Hence, a slowdown in global manufacturing often creates a large threat to Swiss growth. Going forward, can the Swiss economy diverge from that of the rest of the world (Chart 3)? Such a divergence is not probable, but a few factors will protect the Swiss economy: Switzerland still has one of the lowest policy rates in the G10, even after today’s 50bps interest rate increase. This has tremendously helped ease monetary conditions. Our monetary gauge is at its most accommodative level in over two decades (Chart 4). Chart 3The Swiss Economy Is Procyclical
The Swiss Economy Is Procyclical
The Swiss Economy Is Procyclical
Chart 4Swiss Monetary Conditions Are Still Accommodative
Swiss Monetary Conditions Are Still Accommodative
Swiss Monetary Conditions Are Still Accommodative
Swiss inflation remains the lowest in the G10 outside Japan. In Switzerland, the main driver of price increases has been goods, while services inflation remains subdued. Consequently, the SNB has been tolerating an appreciating franc to temper imported inflation (Chart 5), while keeping domestic borrowing costs at very accommodative levels. In its updated forecasts, the SNB now expects a -0.25% interest rate to allow Swiss inflation to moderate to 1.9% in 2023 and 1.6% in 2024. Chart 5Swiss Inflation Is Surprising To The Upside
Swiss Inflation Is Surprising To The Upside
Swiss Inflation Is Surprising To The Upside
Part of the reason Switzerland has low inflation has been the tremendous productivity gains, especially relative to its trading partners (Chart 6). Swiss income-per-capita is elevated, but wage growth has lagged output gains, which limits the risk of a wage-inflation spiral. It is notable that part-time employment continues to dominate job gains, implying that the need for precautionary savings will remain high in Switzerland. Chart 6A Productivity Profile For Switzerland
A Productivity Profile For Switzerland
A Productivity Profile For Switzerland
Higher productivity growth and the elevated national savings leave their footprint on the trade data. The Swiss trade balance is hitting fresh highs, unlike Europe or Japan (Chart 7). This could potentially create a problem for the Swiss economy as it puts upward pressure on the CHF at a time when global manufacturing output is slowing. However, Switzerland specializes in high value-added exports with an elevated degree of complexity, that stand early in global supply chains. These type of goods are likely to remain in high demand in a global environment marked by supply-chain bottlenecks and high-capacity utilization. Chart 7Structural Tailwinds For The Franc
Structural Tailwinds For The Franc
Structural Tailwinds For The Franc
Finally, Switzerland does not import energy to fulfill its electricity production. Hydropower accounts for roughly 61.4% of electricity generation, followed by nuclear power at 28.5%. This has partially insulated Switzerland from the energy shock hurting economic activity and trade balances in the EU. For example, German electricity generation is 28.8% coal and 14.7% natural gas. Bottom Line: The Swiss economy is reopening and is relatively insulated from the Russia-Ukraine conflict. This limits to some degree how closely Switzerland will track the global and European economic slowdown. It creates a departure from the traditional pro-cyclicality of the Swiss economy. The SNB, The SARON Curve, And The Swiss Franc If the Swiss economy surprises to the upside, the case for the SNB to tolerate a rising franc becomes even stronger. The pace of foreign exchange reserve accumulation is already decelerating (Chart 8). Governor Thomas Jordan has been very clear: as global prices rise, the fair value of the franc is also rising, which implies a willingness to tolerate currency strength. In a purchasing power parity framework, higher external inflation makes Swiss goods relatively cheaper. This allows foreigners to bid up the currency. Even with today’s updated pricing, the SNB is still expected to remain among the most dovish central banks in the G10 (Chart 9). If inflationary pressures prove sticky, the SNB will step up its hawkish rhetoric. If inflationary fears subside, then global rates will fall as well, which has usually been a boon for the franc. More specifically, this would be negative for the EUR/CHF cross (Chart 10). Chart 8Less Intervention By The SNB
Less Intervention By The SNB
Less Intervention By The SNB
Chart 9The SARON Curve Has Adjusted Higher
The SARON Curve Has Adjusted Higher
The SARON Curve Has Adjusted Higher
Chart 10EUR/CHF And Bund Yields Can Continue To Diverge
EUR/CHF And Bund Yields Can Continue To Diverge
EUR/CHF And Bund Yields Can Continue To Diverge
The Swiss economy can tolerate an appreciating CHF, but can it withstand higher interest rates? We believe so. Switzerland is a net creditor nation, but its domestic non-financial debt is also extremely elevated. Thus, the Swiss economy is vulnerable to higher rates, especially the housing market (Chart 11). Nonetheless, internal adjustments will soften the blow and increase affordability. Of note, property speculation in Switzerland has decreased in response to macroprudential measures. Growth in rental housing prices, which usually constitute the bulk of investment homes, has collapsed, but the price of owner-occupied homes has proven more robust (Chart 12). A cap on the percentage of secondary homes in any Canton as well as tighter lending standards have also helped. In a renewed update to its Financial Stability Report, Fritz Zurbrügg, Vice Chairman of the Governing Board, suggests that Swiss banks are well capitalized, especially given the recent reactivation of the countercyclical capital buffer. Chart 11Higher Rates Are A Risk For Swiss Real Estate
Higher Rates Are A Risk For Swiss Real Estate
Higher Rates Are A Risk For Swiss Real Estate
Chart 12Some Adjustment Already In Investment Home Prices
Some Adjustment Already In Investment Home Prices
Some Adjustment Already In Investment Home Prices
In the very near term, demographics might also be a tailwind. The pandemic limited immigration to Switzerland, but the working-age population is rebounding anew (Chart 13), which will create a cushion under housing and support domestic demand. Chart 13A Small Demographic Tailwind For Home Prices
A Small Demographic Tailwind For Home Prices
A Small Demographic Tailwind For Home Prices
Stronger aggregate demand in an inflationary world will justify the need for less monetary accommodation. In a nutshell, the SNB is likely to continue walking the path of “least regrets” like most central banks, by tightening monetary policy to meet its 2% inflation mandate, but pausing if economic conditions warrant. The currency has historically been used as a key tool for calibrating financial conditions. From a fundamental perspective, our PPP models suggest the franc is quite cheap versus the dollar but at fair value versus the euro and sterling. This is echoed by Governor Jordan, who no longer views the franc as expensive. Our models adjusts the consumption basket in Switzerland for an apples-to-apples comparison across both the UK and the eurozone (Chart 14). Chart 14AA CHF Is At Fair Value Versus The EUR And GBP
A CHF Is At Fair Value Versus The EUR And GBP
A CHF Is At Fair Value Versus The EUR And GBP
Chart 14BA CHF Is At Fair Value Versus The EUR And GBP
A CHF Is At Fair Value Versus The EUR And GBP
A CHF Is At Fair Value Versus The EUR And GBP
Finally, hedging costs for shorting the franc against the dollar have risen substantially (Chart 15). As such, any short bets on the franc are likely being placed naked. If the Fed ends up tempering its pace of rate hikes next year in response to weaker US activity, short-covering activity is likely to accentuate any pre-existing strength in the CHF. Chart 15Hedging Costs For USD/CHF Carry Trades Have Risen Hedging Costs Are Prohibitive
Hedging Costs For USD/CHF Carry Trades Have Risen Hedging Costs Are Prohibitive
Hedging Costs For USD/CHF Carry Trades Have Risen Hedging Costs Are Prohibitive
Bottom Line: The franc is undervalued against the dollar, and a good hedge against a rise in volatility versus other procyclical currencies. This places the franc in a good “heads I win, tails I don’t loose too much” bet. Swiss interest rates are also likely to climb higher. However, because the franc will do the bulk of the monetary tightening, the SNB is likely to lag the expectations now embedded in the SARON curve. What About Swiss Equities? Despite the cyclical nature of the Swiss economy, Swiss equities are extremely defensive. Swiss stocks have little to do with the domestic economy and are mostly a collection of large multinationals, dominated by the healthcare and consumer staples sectors, which together account for roughly 60% of the Swiss MSCI benchmark. This defensive attribute has created its own problem for Swiss equities. Relative to the Eurozone, the Swiss market has moved massively ahead of profitability, and it is now more expensive than at the apex of the European debt crisis in 2012 (Chart 16). Moreover, the jump in German yields is becoming increasingly problematic for Swiss stocks that historically perform poorly when global interest rates are rising (Chart 17). Chart 16Swiss Stocks Are Expensive
Swiss Stocks Are Expensive
Swiss Stocks Are Expensive
Chart 17A Lost Tailwind
A Lost Tailwind
A Lost Tailwind
In the near term, Swiss equities will only be able to defy the gravitational pull created by demanding valuations and higher yields if global risk aversion remains elevated. However, once global stocks find a floor and Italian spreads begin to narrow, Swiss stocks are likely to underperform massively (Chart 18). It could take a few more weeks before the BTP/Bund spreads narrow as the recent ECB announcement was rather tepid. However, the ECB holding an emergency meeting and issuing a formal statement addressing the problem facing peripheral bond markets suggests that a formal program designed to manage fragmentation risk will emerge before the end of the summer. Beyond their defensive attributes, Swiss stocks also correlate to the Quality Factor. The robust performance of this factor since the turn of the millennium, in Europe and globally, has allowed the Swiss market to greatly outperform Eurozone equities (Chart 19). However, the Quality Factor has begun to underperform, which indicates that the Swiss market is losing another of its underpinnings. Chart 18Near-term, Follow Risk Aversion
Near-term, Follow Risk Aversion
Near-term, Follow Risk Aversion
Chart 19Swiss Stocks Are About Quality
Swiss Stocks Are About Quality
Swiss Stocks Are About Quality
These observations imply that over the next 12 to 18 months, Swiss equities will underperform their Euro Area counterparts. Materials and consumer staples stand out as the two sectors with the most extended valuations relative to their Euro Area competitors, especially since their relative performances have become dissociated from relative profits (Chart 20). They should carry maximum underweights relative to their European counterparts. The healthcare sector is Switzerland’s largest market weight. It is not as expensive relative to the Eurozone as the materials and consumer staples sectors, but it carries enough of a premium that investors should still underweight this sector relative to its eurozone competitor (Chart 21). Chart 20Dangerous Setup For Swiss Materials and Staples
Dangerous Setup For Swiss Materials and Staples
Dangerous Setup For Swiss Materials and Staples
Chart 21The Swiss Heavyweight Is Becoming Pricey
The Swiss Heavyweight Is Becoming Pricey
The Swiss Heavyweight Is Becoming Pricey
Bottom Line: The defensive nature of the Swiss market has allowed for a large outperformance over European equities. However, the Swiss market is now very expensive on a relative basis, and it is vulnerable to higher interest rates. While global risk aversion can still buoy the Swiss market in the near term, conditions are falling into place for Swiss stocks to underperform their Eurozone counterpart over a 12-to-18 month window. Materials and consumer staples are the sectors mostly likely to experience a large underperformance relative to their Euro Area competitors, followed by the healthcare sector. Investment Conclusions Volatility in FX markets is likely to remain elevated, as witnessed by the reaction of a full circle of central bank meetings this week. Policy convergence remains a good bet for interest rate curves and currency pairs. The SNB surprised markets by raising interest rates by 50 bps, to -0.25%, the first hike since 2007 (Chart 1). Higher volatility will continue to buoy the Swiss franc in the short run. Structural appreciation in the franc is also likely over the coming decades. Swiss stocks often perform well during economic downturns, but they are not particularly cheap, and vulnerable to higher interest rates. Investors should only overweight Swiss stocks if they expect more significant downside to global stocks. Valuation favors the franc versus the dollar. However, EUR/CHF and GBP/CHF are closer to fair value. CHF/JPY is expensive; hence the yen is a better hedge for downside economic surprises. Go short CHF/JPY as a trade. BCA’s Foreign Exchange Strategy was short CHF/SEK at 10.2 with stop loss at 10.5. That stop was hit overnight, triggering a loss of -3.3%. Stand aside for now. Chester Ntonifor Foreign Exchange Strategist chestern@bcaresearch.com Mathieu Savary Chief European Strategist Mathieu@bcaresearch.com Trades & Forecasts Strategic View Cyclical Holdings (6-18 months) Tactical Holdings (0-6 months) Forecast Summary
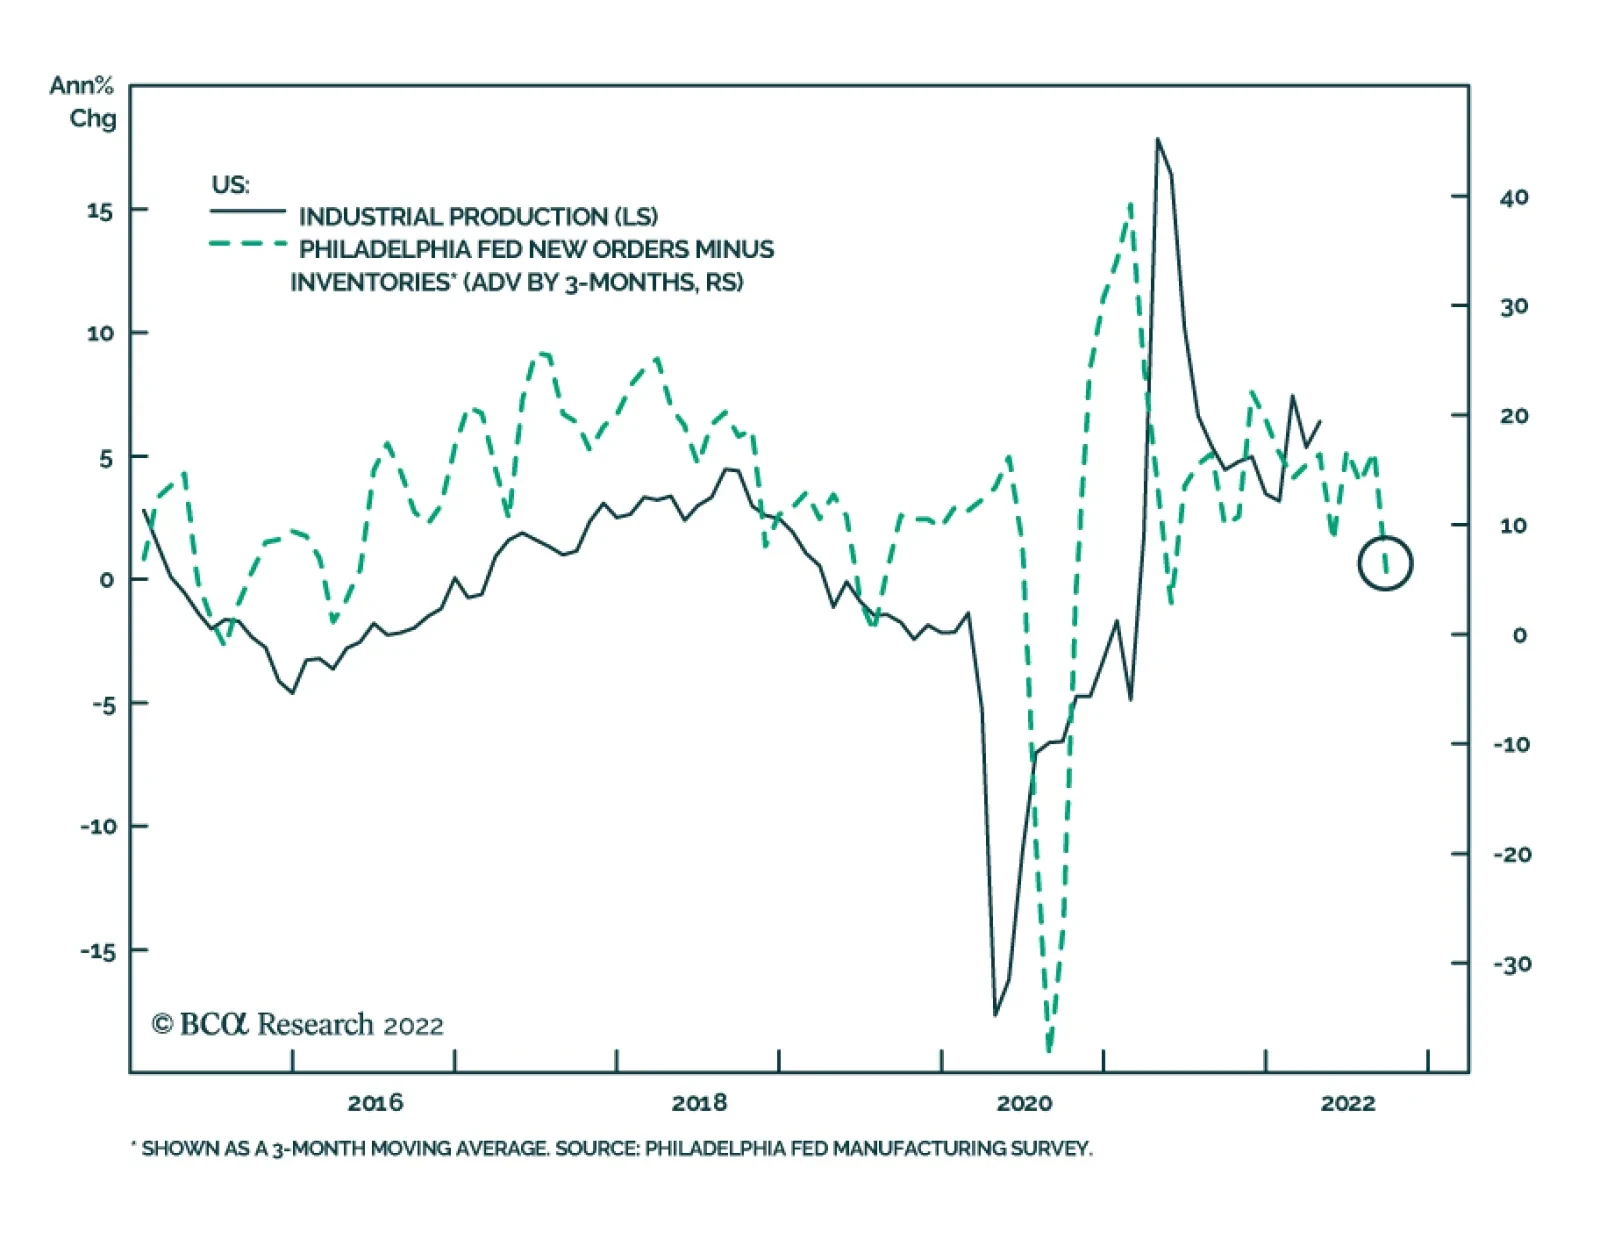
The Philadelphia Fed index for current activity fell 5.9 points to -3.3 in June, missing expectations of a slight improvement and marking the first negative reading since May 2020. The Future Expectations index fell more sharply to a nearly 14-year low of…