Developed Countries
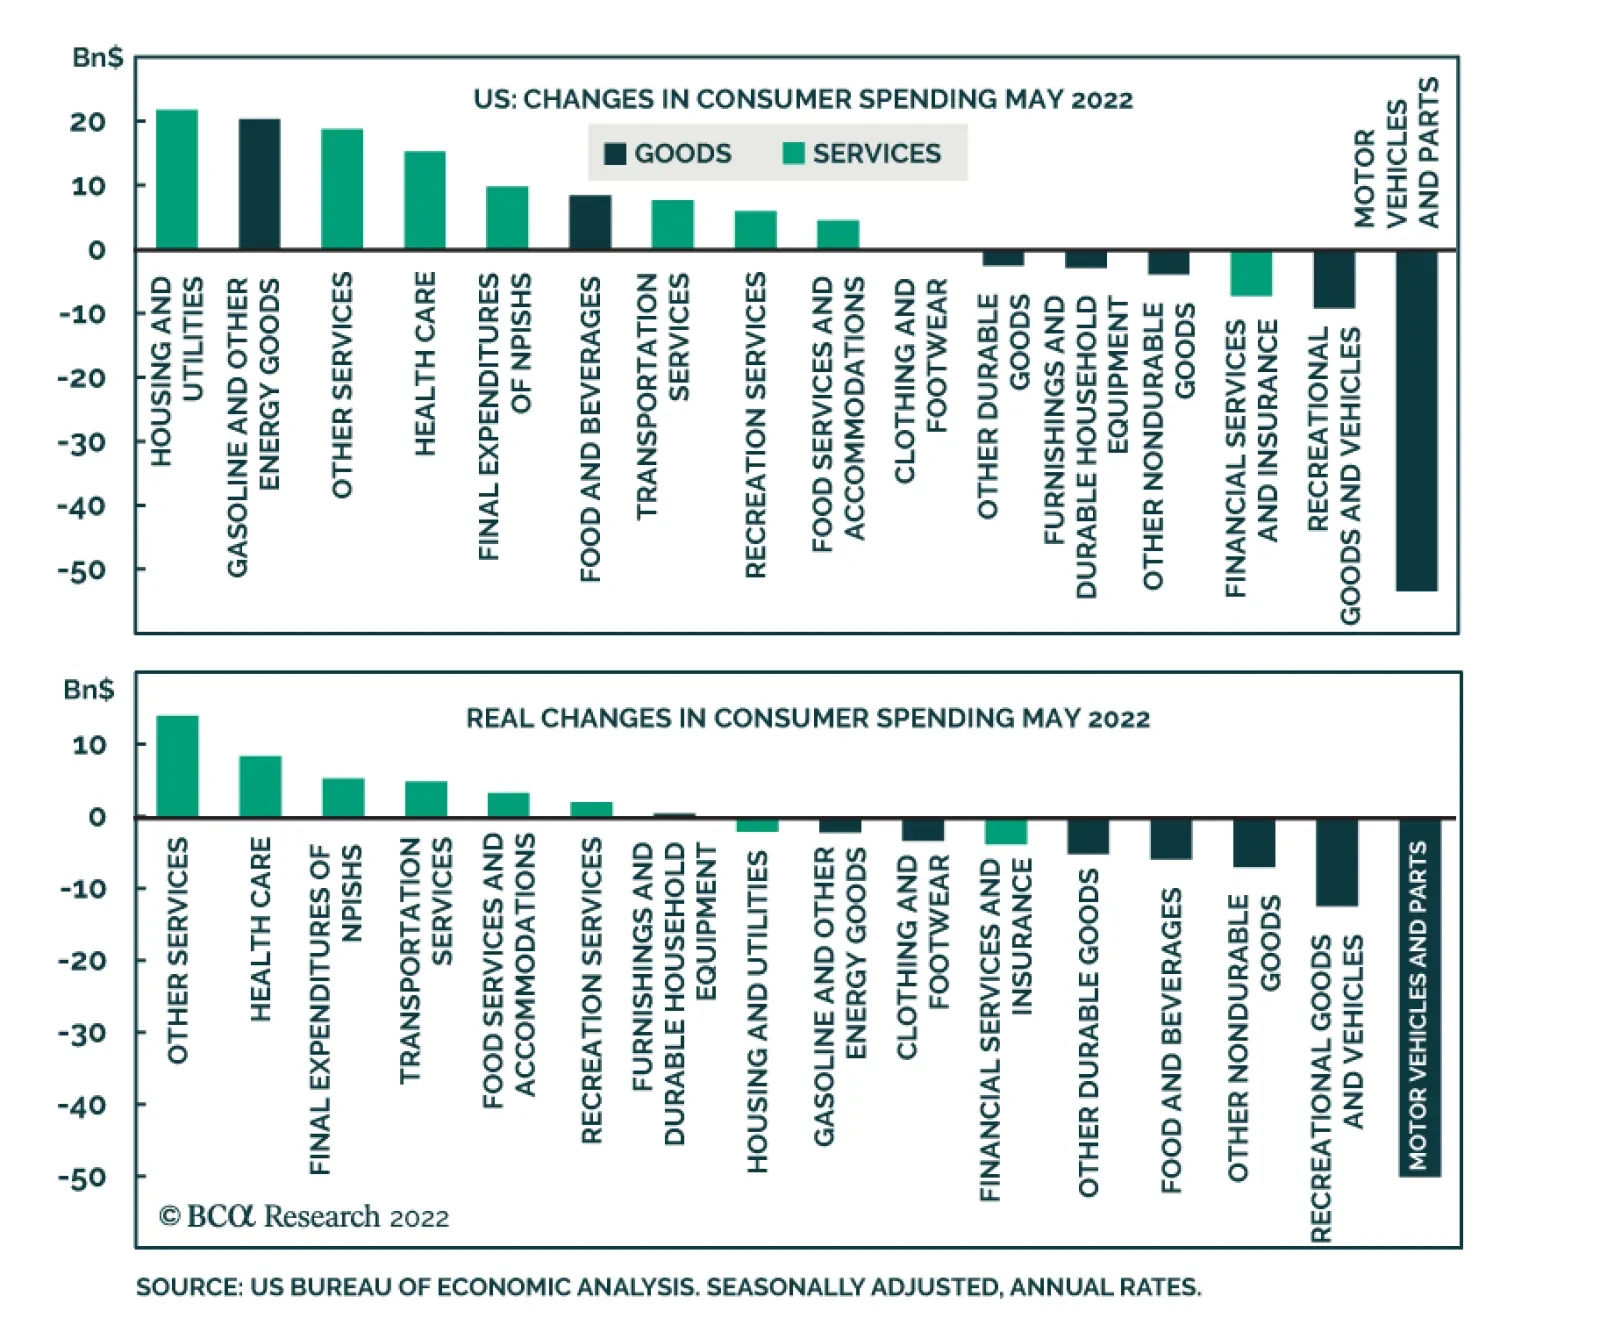
Although US personal spending disappointed in May (see The Numbers), the details of the report offer a silver lining. The breakdown of spending reveals that although spending for goods fell by $43.5 billion, spending for services increased by $76.2 billion to…
US Treasury yields have recently been rolling over from multi-year highs. The 10-year yield closed below 3% on Thursday for the first time since early June. Indeed, we have been highlighting that several cyclical indicators that have historically been…

Executive Summary Long-Term Contracts Needed To Increase LNG Supply
EU Will Reverse Course On Fossil Fuels
EU Will Reverse Course On Fossil Fuels
The EU will have to reverse course and execute long-term contracts with natural gas producers, LNG shippers and pipeline operators to incentivize production of supplies needed to contain energy prices. Long-term contracting will offer the EU an opportunity to address political and economic fragmentation risks via joint taxation policies. This would transform state-level risks via-a-vis energy and military security into joint-and-several obligations. The G7’s plan to cap Russian oil prices will be DOA. The most oil import-dependent EM economies – China and India – will find deeply discounted crude irresistible. Hydrocarbon producers and refiners will increase investments in carbon-capture and storage technology, to maintain their new-found advantage as secure energy sources. Additional subsidies and funding for this technology will be forthcoming. Bottom Line: The hard realities of military conflict and a lack of investment in production and refining will force governments to incentivize substantial investments in hydrocarbons – particularly natural gas and LNG infrastructure – to address global energy scarcity during a time of war. We remain long oil and gas exposures via the COMT ETF, and long equity refining and services exposures via the CRAK and IEZ ETFs. We will re-establish our producer-oriented XOP ETF position if prompt Brent futures trade down to $105/bbl in the front month. We also remain tactically long Brent and eurozone natgas futures and options. Feature The G7 last opined on liquified natural gas (LNG) supply in May, and as was the case this week, it left even casual observers uncertain as to what it is seeking to achieve: It advocated for a halt to further investments in fossil-fuel projects and, at the same time, called for higher LNG supplies to be provided for the EU states.1 The EU faces daunting energy security and supply constraints.2 A deepening energy scarcity will, we expect, push the EU into recession later this year, as natural-gas rationing is invoked to ensure there are sufficient supplies to meet human needs this winter. Natgas scarcity will force the EU to reverse course on its renewable-energy transition in the medium term and prioritize fossil-fuel investments, in our view. Long-term contracting with LNG suppliers will be required to incentivize needed investment in production and transportation to replace Russian gas imports. Such contracting is a necessity for hydrocarbon producers, given governments’ continued calls for no additional fossil-fuel investment. Quicksilver shifts in policy are a continuing source of uncertainty for investors and energy-supply firms. Over time, the EU will have to replace close to 7 Tcf/yr of Russian gas imports (Chart 1, middle panel). This will propel the EU into the ranks of the world’s largest LNG importers (Chart 2). Chart 1EU Needs To Replace ~ 7 Tcf/yr Of LNG
EU Will Reverse Course On Fossil Fuels
EU Will Reverse Course On Fossil Fuels
Chart 2EU Will Become A World-Class LNG Importer
EU Will Become A World-Class LNG Importer
EU Will Become A World-Class LNG Importer
Chart 3Long-Term Contracts Needed To Increase LNG Supply
EU Will Reverse Course On Fossil Fuels
EU Will Reverse Course On Fossil Fuels
Given the length of contracts typically executed with LNG exporters – in excess of 20-plus years – EU governments will be compelled to allow firms and member states to sign long-term contracts for these supplies. EU governments also will be required to begin planning for and developing LNG importing infrastructure, as these supplies become available over the next 3-5 years. In the meantime, LNG prices will remain under pressure as competition heats up globally ahead of the coming winter (Chart 3). G7 Price-Cap Scheme Will Be DOA The G7’s scheme to impose a price cap on Russian oil exports will be DOA as soon as details are presented. This is because the world’s largest oil import-dependent economies – China and India – not only have long trading histories with Russia, but they also operate their own oil-transport fleets that can circumvent insurance-related obstacles imposed by the US and the UK. China and India already find discounted Russian oil irresistible, and are unlikely to acquiesce to US demands for a price cap. China imports 75% of its 15.5mm b/d of oil consumption, while India imports ~ 85% of the 5mm b/d of oil it consumes. Even if oil importers taking Russia's exports going to the EU were to sign on to a price-cap scheme, Russia could always unilaterally cut its oil and condensate production by 20-30% and force Brent prices sharply higher for remaining contract holders. This would almost surely lead to higher prices – above $140/bbl, based on our earlier estimates – and raise Russia’s net export proceeds in the process, since the G7 does not want all of Russia's oil taken off the market.3 Government Interventions Exacerbate Scarcity Governments of states with contestable elections increasingly are intervening – or attempting to do so – in global energy markets and imposing often-contradictory policies that nominally favor consumers at the expense of energy producers. This almost always is counter-productive: Price caps intended to soften the blow of higher-cost electricity and hydrocarbons discourages the necessary conservation of scarce resources. So-called windfall profits taxes discourage the investment required to address supply scarcity. Higher demand and lower supply does not lead to lower prices. Even grander schemes – e.g., the monopsony cartels floated by G7 member states like the US and EU, along with China – almost surely would reduce the profitability of developing and marketing new energy supplies, which also would exacerbate scarcity of supply by discouraging investment. These quick ad hoc fixes work at cross purposes in solving the problem of global energy scarcity. While they are in keeping with a penchant of governments to demonstrate they are addressing voters’ concerns, such policies mistake a quick response for long-term solutions. Investment Implications The EU will, in our opinion, be forced to reverse course and sign long-term LNG supply contracts to replace Russian natural gas imports. This will not derail its renewable-energy transition strategy, but it will significantly delay it. We remain long oil and gas exposures via the S&P GSCI and COMT ETF, and long equity refining and services exposures via the CRAK and IEZ ETFs. We will re-establish our producer-focused XOP ETF position if Brent trades down to $105/bbl in the front month. We also remain tactically long Brent and eurozone natgas futures and options (see p. 7 below). Housekeeping Notes We were stopped out of our long S&P GSCI position with a gain of 64%. We are getting long again at the close. We also were stopped out of our long 4Q22 $120/bbl Brent calls with a 16% return. Separately, there will be no Commodity Round-Up in this week’s publication. We are broadcasting our Commodity Round-Up today at 9 a.m. EDT. Robert P. Ryan Chief Commodity & Energy Strategist rryan@bcaresearch.com Footnotes 1 Please see The G7 wants to dump natural gas … but not yet published by politico.com 27 May 2022. The report notes, “The G7 called for an end to international investments in fossil fuels by the end of this year and slammed private finance for continuing to back dirty energy — but left a big out for EU countries desperate to replace Russian gas. ‘We acknowledge that investment in [the liquefied natural gas] sector is necessary in response to the current crisis, in a manner consistent with our climate objectives and without creating lock-in effects,’ the ministers said.” 2 Please see One Hot Mess: EU Energy Policy, published 26 May 2022. This report delves into the EU’s post-Cold War foreign policy. For three decades, EU foreign policy largely was set by Germany, the organization's most powerful economy. Successive generations of German politicians championed the idea that the West could bring the former Soviet Union – and later Russia – into the modern world of global trade through Ostpolitik, which had, at its core, a belief in the power of trade to effect political and economic change. This policy is kaput. 3 Please see Higher Gasoline, Diesel Prices Ahead, which we published 2 June 2022. It is available at ces.bcaresearch.com. Investment Views and Themes Strategic Recommendations Tactical Trades Trades Closed in 2022
Dear Client, This month’s Special Report has been written by Martin Barnes, BCA’s former Chief Economist. Martin, who retired from BCA Research last year after a long and illustrious career, discusses the long-run outlook for inflation. The views expressed in this report are his, and may not be consistent with those of the Bank Credit Analyst or other BCA Research services. But Martin’s warning of future stagflation is sobering, and I trust you will find his report both interesting and insightful. Jonathan LaBerge, CFA The Bank Credit Analyst Highlights Overly stimulative policies meant that inflation was set to rise even before the disruptions caused by the pandemic and Ukraine conflict. Inflation should decline sharply over the coming year in response to weaker economic growth and an easing in supply problems. But it will be a temporary respite. Central banks will not have the stomach to keep policy tight enough for long enough to squeeze inflation out of the system. Price pressures will return as economies bottom and the environment will become one of stagflation. Financial assets will rally strongly when inflation fears subside but subsequent stagflation will not be bullish for markets. Feature Former Federal Reserve Chairman Alan Greenspan once defined price stability as existing when “households and businesses need not factor expectations of changes in the average level of prices into their decisions”. Until recently, that state of affairs was the case for much of the past 30 years and for many, inflation was quiescent during their entire working lives. But inflation is now back as a huge issue and there is massive debate and uncertainty about whether it will be a temporary or lasting problem. I lean toward the latter view. Major changes in the economic and/or financial environment more often are identified in hindsight than in real time. It is easier to attribute large trend deviations to temporary factors than to make bold predictions about structural shifts. Obviously, the pandemic and conflict in Ukraine have had a significant impact on the near-term inflation picture via massive supply-side disruptions and represent temporary events. Thus, inflation will retreat from current elevated levels as those disruptions diminish. But the conditions for higher inflation were already in place before those two unfortunate events occurred. Specifically, central banks have been erring on the side of stimulus for several years and they will find it extremely difficult, if not impossible, to put the inflation genie back into the bottle. Inflation has moved from a non-issue to the most important factor driving markets. Over the next year, the next big surprise might be how fast inflation retreats and investors and policymakers will then breathe a big sigh of relief. However, this will prove to be a temporary respite because it will not take long for inflation to move back up and remain stubbornly above central bank targets. In other words, a whipsaw is in prospect over the next few years as inflation goes from up, to down, and to up again. The Current Inflation Problem The biggest increases in consumer prices have occurred in areas most affected by supply problems, with energy attracting the most attention. Nevertheless, in most countries, inflation has risen across the majority of goods and services. The core inflation rate (i.e. consumer prices excluding food and energy) in the G7 economies climbed from 2% to 4.8% between April 2021 and April 2022 (Chart II-1). Meanwhile, the Cleveland Fed’s trimmed mean measure of US consumer price inflation has spiked dramatically higher, consistent with a broad-based acceleration in inflation.1 The rise in underlying inflation is a bigger problem in the US, UK and Canada than in Japan or the Euro Area. Chart II-2 shows current core inflation rates relative to the target rate of 2% pursued by most central banks. That geographical divergence will be touched on later and in the meantime, the focus will be on the US situation. Chart II-1A Broad-Based Pickup In Inflation
A Broad-Based Pickup in Inflation
A Broad-Based Pickup in Inflation
Chart II-2The US, UK And Canada Have A Bigger Inflation Problem
July 2022
July 2022
The latest US inflation data for a range of goods and services is shown in Table II-1. The table shows the three- and six-month annualized changes in prices because 12-month rates can be affected by a base effect given the impact of pandemic-related shutdowns and disruptions a year ago. Also, a comparison of the three- and six-month rates shows if momentum is building or fading. The trends are not encouraging in that momentum has accelerated, not diminished in many key areas. Table II-1Selected Inflation Rates In The US CPI
July 2022
July 2022
Even if the data show a moderation in core inflation in the months ahead, it is important to note that rent inflation – the CPI component with the biggest weight – is seriously underestimated. This is one of the few items where prices are collected with a lag and real estate industry reports highlight that rent inflation is running at double-digit rates in the major cities. According to one report, average rents nationally increased by more than 25% in the year to May.2 The CPI data will eventually catch up with reality, providing at least a partial offset to any inflation improvements in other areas. Another problem for inflation is the acceleration in wage growth against the backdrop of an unusually tight labor market. Currently, the number of unfilled vacancies is almost twice the number of unemployed and it is thus no surprise that wage growth has picked up sharply (Chart II-3). The Atlanta Fed’s measure of annual wage inflation has risen above 6%, its highest reading since the data began in 1997. Wage growth is unlikely to suddenly decline absent a marked rise in the unemployment rate. There is much debate about whether the US economy is on the verge of recession, but let’s not get bogged down in semantics. Regardless of whether the technical definition of recession is met (at least two consecutive quarters of negative GDP growth), the pace of activity is set to slow sharply. Plunging consumer and business confidence, contracting real incomes and a peaking in housing activity all point to a significant weakening in growth, even if the labor market stays healthy (Chart II-4). Chart II-3A Very Tight US Labor Market
A Very Tight US Labor Market
A Very Tight US Labor Market
Chart II-4The US Economy Is In Trouble
The US Economy is in Trouble
The US Economy is in Trouble
Softer economic growth eventually will take the edge off inflationary pressures in many goods and services. Combined with an easing in supply-side disruptions, the inflation rate is certain to decline in the coming year, even if oil prices move higher in the short run. Currently, the Fed is talking tough about dealing with inflation and there is little doubt that further rate hikes are on the way. However, policymakers will have little stomach for inflicting enough economic pain to completely squeeze inflation out of the system. Once there are clear signs of a significant economic slowdown, the Fed will back off quickly. What Causes Inflation Anyway? Economics 101 teaches that prices are determined by the interaction of supply and demand. If the demand for a good or service exceeds supply, then prices will rise to bring things back into balance. Seems simple enough but, unfortunately, this leaves many unanswered questions. How much must prices rise and for how long in order to restore balance? What if there are structural impediments to supply? What if there are monopolies in key commodities or services? What if policy interferes with the operation of market-clearing solutions? And, finally, what measure of inflation should we be looking at? Chart II-5Inflation Is A 'Modern' Issue
Inflation is a 'Modern' Issue
Inflation is a 'Modern' Issue
For much of economic history, deflation was just as prevalent as inflation, with the latter only being a problem during periods of war (Chart II-5). As the pre-WWII world pre-dated fiat money, automatic stabilizers (e.g. the welfare state), and counter-cyclical fiscal policy, economies were prone to regular depressions that served to wash out financial and economic excesses and any inflationary pressures. But those days are long gone and free market forces should not be expected to keep inflation under wraps. I rather like the simple explanation of inflation’s roots as being “too much money chasing too few goods”. In that sense, the control of inflation lies firmly at the door of central banks. In the “old days” (i.e. before the 1990s), it was possible to use the growth in the money supply to gauge the stance of policy because there was a fairly stable and predictable relationship between monetary and economic trends. That all ended when financial deregulation and the explosion in non-bank financial activities meant that monetary trends ceased to be a reliable indicator of economic growth and inflation. As a result, the Fed stopped setting monetary growth targets more than 20 years ago and since then, money supply data has rarely been mentioned in FOMC discussions. Chart II-6A Simple Measure Of The Monetary Stance
A Simple Measure of the Monetary Stance
A Simple Measure of the Monetary Stance
Fortunately, all is not lost. The gap between the federal funds rate and nominal GDP growth is a reasonably good proxy for the stance of monetary policy. Conditions are easy when rates are persistently below GDP growth and vice versa when they are above. As can be seen in Chart II-6, rates were below GDP growth during most of the 1960s and 1970s, a period when inflation rose sharply. And inflation fell steadily in the 1980s into the first half of the 1990s when the Fed kept interest rates above GDP growth. And look at what has happened in the past decade: rates have been significantly below GDP growth, suggesting an aggressively easy monetary stance. It was only a matter of time before inflation picked up, even without the recent supply-side disruptions. The FOMC’s latest projections show long-run growth of 3.8% in nominal GDP while the fed funds rate is expected to average only 2.5%. That implies a continued accommodative stance, yet inflation is forecast to be in line with the 2% target. That all seems very unlikely. Fed policymakers spend a lot of time trying to figure out the level of the equilibrium real interest rate – the level consistent with steady non-inflationary economic growth. It would be very helpful to have this number but coming up with an accurate measure is a largely futile exercise. It cannot be measured empirically and its estimation requires a lot of assumptions, explaining why there is no broad agreement on what the right number is. I think there is a case for the simpler approach of using the nominal growth in GDP as a proxy for where rates should be in normal circumstances. As noted above, that suggests monetary policy was excessively accommodative for an extended period. If US Policy Was Too Easy, Why Was Inflation Low For So Long? The Fed’s preferred measure of underlying inflation is the change in the personal consumption deflator, excluding food and energy. In the 25 years to 2019, inflation by this measure averaged only 1.7%, compared to the Fed’s desired level of 2%. Thus, even though the level of interest rates implied very accommodative policy over that period, inflation remained tame. This leads to an important caveat. The stance of monetary policy plays the key role in driving inflation, but it is not everything. Offsetting forces on inflation (in both directions) can mute or even swamp the impact of policy. There were several disinflationary forces in operation during the past 25 years. Specifically: In the second half of the 1990s, the explosive growth of the internet and accompanying boom in technology spending led to a marked pickup in productivity growth. The entry of China into the World Trade Organization at the end of 2001 unleashed a wave of offshoring and downward pressure on traded goods prices. A series of deflationary shocks hit the US and global economy including the 1998 financial crisis in South-East Asia and Russia, the bursting of the tech bubble after 2000, and of course the global financial meltdown in 2007-09. Unstable economic conditions undermined labor’s bargaining power, keeping a tight lid on wage growth. This was highlighted by the dramatic decline in labor’s share of income after 2000. Importantly, the above forces are no longer in place and in some cases are reversing. The key technological advances of the past decade have not been particularly good for productivity. Indeed, one could argue that the activities of most so-called FANG stocks – especially those involved in social media - have had a negative impact on productivity. Time spent on FaceBook, Twitter and Netflix do not have obvious benefits for increased economic efficiency. Chart II-7Globalization In Retreat
Globalization in Retreat
Globalization in Retreat
Even before the pandemic’s impact on supply chains, there were signs that globalization had peaked (Chart II-7). Indeed, BCA first suggested in 2014 that globalization was running out of steam. More recently, the interruption to supply chains has highlighted the downside of relying excessively on overseas production for key goods such as semi-conductors and pharmaceuticals. Onshoring rather than offshoring will become more common with higher prices being the cost for greater control over supply. Globalization is not dead, but, at the margin, it no longer is a powerful source of disinflation. US import prices from China are back to their highest level in a decade after falling steadily during the eight years to 2020. The inflationary impact of the pandemic and the war in Ukraine via supply-side disruptions are more than offsetting any disinflationary effects of softer economic growth. In other words, they have represented stagflationary rather than deflationary shocks. Finally, with regard to income shares, the pendulum has swung more in favor of labor. Demographic trends (e.g. slow growth in the working-age population) suggest that the labor market will remain relatively tight in the years ahead, notwithstanding short-term weakness as the economy slows. Profit margins are likely to weaken and labor’s share of income will rise. The bottom line is that easy money policies will no longer be offset by a number of powerful external forces that served to keep consumer price inflation under wraps in the pre-pandemic period. And this raises another important point. If monetary policy is too easy, then it will show up somewhere, even if consumer price inflation is under control. There Is More Than One Kind Of Inflation Inflation most commonly refers to the change in the prices of consumer goods and services. That is understandable because consumer spending accounts for more than half of GDP in the major developed economies (and almost 70% in the US). And because consumers are the ones who vote, it is the inflation rate that politicians care most about. However, there are other kinds of inflation. If there are structural impediments to increased consumer prices, then excessively easy monetary policy most likely will show up in higher asset prices. This is a very different kind of inflation because it is welcomed by the owners of assets and by politicians. Nobody is happy to face higher prices for the goods and services they buy, but asset owners love the wealth-boosting effect of higher prices for homes and shares. Consumer inflation may have been subdued in the pre-pandemic decade, but the same is not true for asset prices. During the period that the Fed ran accommodative policies, there were several periods of rampant asset inflation such as the tech stock bubble of the late 1990s, the housing bubble of the 2000s, and the bond bubble of 2016-2020. And both equity and home prices surged in response to monetary stimulus triggered by the pandemic. Central banks may fret about the potential financial stability implications of surging asset prices, but in practice they do not act to curb them. Policymakers argue that it is hard to determine when an asset bubble exists and even when one is obvious, monetary policy is a crude tool to deal with it. If rising asset prices occur alongside an economy that is characterized by stable growth and moderate inflation, then acting to burst a bubble could inflict unnecessary economic damage. That is an understandable position, but it means ignoring the longer-term problems that occur when bubbles inevitably burst. This was highlighted by the economic and financial chaos after the US housing bubble burst in 2007. The reality is that central banks have been forced to rely more heavily on asset inflation as a source of monetary stimulus. An easing in monetary policy affects economic conditions in three primary ways: boosting credit demand and supply, raising asset prices, and lowering the exchange rate.3 Historically, the credit channel was by far the most important. BCA has written extensively about the Debt Supercycle and the role of monetary policy in fueling ever-rising levels of private sector indebtedness (see the Appendix for a brief description of the Debt Supercycle). Chart II-8No Releveraging Cycle In Household Debt
No Releveraging Cycle in Household Debt
No Releveraging Cycle in Household Debt
The environment changed dramatically after the 2007-09 financial meltdown. The collapse of the credit-fueled housing bubble drove a stake through the heart of the household sector’s love affair with debt. The ratio of household debt to income peaked in early 2009 and ten years later it was back to the levels of 2001 (Chart II-8). Even an extended period of record low interest rates has failed to trigger a new leveraging cycle. If the Fed can’t persuade consumers and businesses to fall back in love with debt, then it must rely on the other two transmission channels for monetary policy – asset prices and the exchange rate. And the Fed really has limited control over the latter channel given that it also depends on the actions of other central banks. The deleveraging of the household sector in the post-2009 period could have been very bearish for the economy, but the Fed’s easy money policies underpinned the stock market, allowing household net worth to revive. There was an explosive rise in household net worth in 2020-21 as surging house prices added to stock market gains. Between end-2019 and end-2021, the household sector’s direct holdings of equities plus owner’s equity in real estate increased in value by around $20 trillion, equal to more than one year’s personal disposable income. The recent decline in equity prices has reversed some of the gains, but net worth remains elevated by historical standards. The bottom line is that it was wrong to suggest that the Fed’s accommodative stance did not create inflation. Consumer price inflation was tame in the pre-pandemic period, but there was lots of asset inflation and that gathered pace in 2020 and 2021. There was always going to be some leakage of this into more generalized inflation but this was accelerated by the double whammy of the supply disruptions caused by the pandemic and the Ukraine war. The Strange Case Of Japan If higher inflation in the US has seemed inevitable, how can one explain the situation in Japan? In contrast to other developed countries, Japan’s annual core inflation rate was only 0.2% in May. While this was an increase from the average -1.3% rate in the prior six months, it is impressive given the country’s continued highly stimulative monetary policy and the same exposure to supply disruptions as elsewhere. Most importantly, Japan has suffered structural deflation for so long that inflation expectations are totally dormant for both consumers and businesses. In other words, raising prices is seen as a desperate measure and something to be avoided. Japan’s poor demographics may also have played a role. A sharply declining labor force and rapidly aging population are disinflationary rather than inflationary influences and help reinforce the corporate sector’s reluctance to raise prices. While Japan seems an outlier, it is worth noting that core inflation also has remained relatively subdued in many European countries. For the overall Euro area, the latest core inflation rate is 3.8%, well below that of the US and UK. Two common features of the higher inflation countries are that they tended to have more aggressively-easy fiscal policies in recent years and greater asset inflation – especially in real estate. Unfortunately, inflation expectations and business pricing behavior in the US and other Anglo-Saxon economies have not followed Japan’s example. Employees have become more aggressive in demanding higher wages, and most companies have no problem in passing on higher costs to their customers. The UK is facing a wave of public sector strikes over pay the likes of which have not been seen for decades. The Outlook Chart II-9A Peaking In Supply Problems?
A Peaking in Supply Problems?
A Peaking in Supply Problems?
Inflation may prove sticky over the next few months, but as noted earlier, it should move significantly lower over the coming year. Crude oil prices have risen by around 75% in the past year and that pace of rise cannot be sustained. Meanwhile, while shipping rates remain historically high, they are down sharply from earlier peaks (Chart II-9). Together with a revival in Chinese exports, this suggests some easing in supply chain problems. And as mentioned above, the pace of economic activity is set to slow sharply. But a return to pre-pandemic inflation levels is not in the cards. The Fed currently is talking tough and further rate hikes are on the way. But the tightening will end as soon as it becomes clear that the economy is heading south. A deep recession is not likely because there are not the worrying imbalances such as excessive consumer debt or inventories that typically precede serious downturns. However, policymakers will not take any risks and policy will return quickly to an accommodative stance, even though inflation is unlikely to return to the desired 2% level. On a positive note, inflation may be the highest in 40 years in many countries, but we are not facing a return to the destructive high-inflation environment of the 1970s. Inflation back then was institutionalized and a self-feeding cycle of higher wages and rising prices was deeply embedded. I was working as an economist for BP in London in the 1970s and remember receiving large quarterly pay rises just to compensate for inflation. In the absence of inflation-accounting practices, companies seriously underestimated the destruction that inflation was creating to balance sheets and profitability, making them complacent about the problem. Moreover, there were not the same global competitive pressures that exist today. Inflation in the US likely will form a new base of 3% to 4% over the medium term, with occasional fluctuations to 5% or above. An environment of stagflation is in prospect: growth will not be weak enough to suppress inflation and not strong enough to allow the Fed to maintain a restrictive stance. This puts the Fed in a difficult spot as it will be reluctant to admit defeat by raising the inflation target from its current 2%, even though that level will be out of reach in practical terms. A counter view is that I am too pessimistic by underestimating the disinflationary effects of technological advances. A sustained improvement in productivity would certainly help lower inflation but how likely is this? Technological advances are occurring all the time, but in recent years they largely have been incremental in nature and it is hard to think of any new breakthrough productivity-enhancing technologies. There is a difference between new technologies that simply represent better ways to do existing tasks (3D printing would fall into that category) and general purpose technologies that completely change the way economies operate (e.g. electricity and the internet). While businesses are still exploiting the benefits of the digital world, we await innovations that will trigger a new sustained upsurge in productivity. A game changer would be the development of unlimited cheap energy (cold fusion?) but that does not seem likely any time soon. Nevertheless, I will keep an open mind about the potential for productivity to surprise on the upside, despite my current skepticism. Chart II-10Inflation Expectations Spike Higher
Inflation Expectations Spike Higher
Inflation Expectations Spike Higher
What does all this mean for the markets? Not surprisingly, shifts in market expectations for future inflation are highly correlated with the current rate and have thus spiked higher in recent months, hurting both bonds and stocks (Chart II-10). Obvious inflation hedges would be inflation-protected bonds and resources, but neither group currently is attractively priced. The good news is that the current panic about inflation is setting the scene for a buying opportunity in both stocks and bonds. The exact timing is tricky to predict but both stocks and bonds will rally strongly later this year when inflation expectations retreat as it becomes clear that the economy is weakening and the Fed softens its hawkish tones. The bad news is that this bullish phase will not last much more than a year because a re-emergence of inflationary pressures will bring things back to earth. The long-run outlook is one of stagflation and that will be a tough environment for financial assets. Martin H. Barnes Former Chief Economist, BCA Research mhbarnes15@gmail.com Appendix: A Primer On The Debt Supercycle The Debt Supercycle is a description of the long-term decline in U.S. balance-sheet liquidity and rise in indebtedness during the post-WWII period. Economic expansions have always been associated with a buildup of leverage. However, prior to the introduction of automatic stabilizers such as the welfare state and deposit insurance, balance-sheet excesses tended to be fully unwound during economic downturns, albeit at the cost of severe declines in activity. The pain of the Great Depression led governments to intervene to smooth out the business cycle, and their actions were given legitimacy by the economic theories of John Maynard Keynes. Fiscal and monetary reflation, together with the introduction of automatic stabilizers such as unemployment insurance, were successful in preventing the frequent depressions that plagued the pre-WWII economy, but the downside was that balance-sheet imbalances and financial excesses built up during each expansion phase were never fully unwound. Periodic "cyclical" corrections to the buildup of debt and illiquidity occurred during recessions, but these were never enough to reverse the long-run trend. Although liquidity was rebuilt during a recession, it did not return to its previous cyclical high. Meanwhile, the liquidity rundown during the next expansion phase established new lows. These trends led to growing illiquidity, and vulnerability in the financial markets. The greater the degree of illiquidity in the economy, the greater is the threat of deflation. Thus, the bigger that balance-sheet excesses become, the more painful the corrective process would be. So, the stakes became higher in each cycle, putting ever-increasing pressure on the authorities to reflate demand, by whatever means were available. The Supercycle process was driven over time by the building tension between rising underlying deflationary risks in the economy, and the ability of policymakers to create inflation. The Supercycle reached an important inflection point in the recent economic and financial meltdown, with the authorities reaching the limit of their ability to get consumers to take on more leverage. This forced the government to leverage itself up instead, representing the Debt Supercycle's final inning. Footnotes 1This trimmed mean measure excludes the top 8% of CPI components with the largest monthly price gains and the bottom 8% with the smallest monthly gains. 2 Rent.com, https://www.rent.com/research/average-rent-price-report/, June 2022. 3 A fourth channel can be via a psychological boost to business and consumer confidence, but this can cut both ways if an easing in policy is interpreted as a sign of worsening economic conditions rather than as a reason for optimism.
Highlights We now recommend that investors maintain a neutral stance towards stocks versus bonds in a global multi-asset portfolio. We also recommend that investors increase their allocation to government bonds within a global fixed income portfolio (to overweight), at the expense of corporate bonds. We still believe that the US will likely avoid a recession over the coming year, but we are less convinced that this is true than we were a few months ago. The fact that mortgage rates have risen to neutral territory means it is possible that the usual ingredients for a recession – tight monetary policy plus a shock to aggregate demand in the form of a sharp decline in real wages – are currently present or soon will be. In addition, the Fed is now very concerned that long-term household inflation expectations may become unanchored to the upside. Headline inflation has seemingly been a more impactful driver of long-term inflation expectations than core measures, implying that the Fed may have to crowd out demand for goods and services that are comparatively less affected by supply-side constraints in order to contain rising inflation expectations. That would be clearly negative for economic growth and is potentially recessionary in nature. We see no compelling signs of an acceleration in European or Chinese growth that could act as a ballast to support the global economy. The European energy situation is worsening, China’s post-lockdown rebound has so far been tepid, and market-based indicators of Chinese economic growth are deteriorating. The US equity market is not priced for a typical “income-statement” recession induced by monetary policy. We expect the S&P 500 to fall to 3100 in a recession scenario, driven mostly by declining earnings. In a recession scenario, we do not expect long-maturity government bond yields to fall enough to offset a likely increase in the equity risk premium. Financial markets rarely trend sideways over 6-to-12 month periods. We regard a neutral global asset allocation stance as a temporary stepping stone to either a further downgrade of risky assets to underweight, or an increase in risky asset exposure back to a high-conviction overweight. The latter is still possible, especially if we soon see a substantial slowdown in the US headline inflation rate. Thus, additional changes to our recommended cyclical allocation may occur over the coming few months, in response to the incoming data and our assessment of the likely implications for monetary policy. Downgrading Risky Assets To Neutral Every month, BCA strategists hold a house view meeting to discuss the most important issues driving the macroeconomy and financial markets. As highlighted in a recent Special Alert from our Global Investment Strategy service,1 BCA strategists voted at our June meeting to change our House View to a neutral asset allocation stance towards equities, with a slight plurality favoring an outright underweight. Table I-1We Now Recommend More Conservative Positioning Than We Did In May
July 2022
July 2022
The view of the Bank Credit Analyst service is in line with the consensus of BCA strategists on this issue, and we consequently recommend a neutral stance towards stocks versus bonds in a global multi-asset portfolio. We also recommend that investors increase their allocation to government bonds within a global fixed income portfolio (to overweight), at the expense of corporate bonds (Table I-1). We noted in our April report2 – when the S&P 500 index stood at 4530 – that the outlook for equities had deteriorated meaningfully since the beginning of the year and that investors should maintain at most a very modest overweight toward equities in a global multi-asset portfolio. A formal downgrade to neutral is thus not a large change in our recommended positioning, but it reflects what we view as a legitimate increase in the odds of a US recession over the coming year. It is not yet our view that a US recession is a probable outcome, but it is important to distinguish between one’s forecast of the economic outlook and the appropriate investment strategy. The unique inflationary pressure created by the COVID-19 pandemic has created a large confidence interval around our forecast, underscoring that an aggressive stance towards risky assets is not warranted. Financial markets rarely trend sideways over 6-to-12 month periods. We regard a neutral stance as a temporary stepping stone to either a further downgrade of risky assets to underweight or an increase in risky asset exposure back to a high-conviction overweight. The latter is still possible, especially if we see a substantial slowdown in the US headline inflation rate. But as we will discuss below, that slowdown will have to materialize soon in order for us to recommend an overweight risky asset stance. Reviewing Our Previously Constructive View On US Economic Growth Chart I-1Recessionary Concerns Have Escalated Significantly Since The 2-10 Yield Curve Inverted
Recessionary Concerns Have Escalated Significantly Since The 2-10 Yield Curve Inverted
Recessionary Concerns Have Escalated Significantly Since The 2-10 Yield Curve Inverted
Concerns about a potential US recession have been growing since the Fed’s hawkish pivot in November, especially following Russia’s invasion of Ukraine. Previously, these concerns centered around two core issues: the aggressive pace at which the Fed communicated it would raise the policy rate, and the fact that the 2-10 yield curve flattened sharply in the first quarter and finally inverted (based on closing prices) on April 1st (Chart I-1). We had pushed back against those concerns, for several reasons. Our deeply-held view is that recessions typically occur when a significant shock to aggregate demand emerges against the backdrop of tight monetary policy. Sometimes the debt-service and credit demand impact of high interest rates itself is the shock. In other cases, recessions have been triggered in an environment of restrictive monetary policy by a sudden change in key input costs (such as oil prices), the bursting of a financial asset bubble, or a major shift in fiscal spending (typically following a period of war). But the core point is that recessions rarely occur when monetary policy is easy, even when shocks to aggregate demand occur. We abstract here from special cases such as the recession that occurred during the early phase of the COVID-19 pandemic. That event saw the introduction of government policies that purposely arrested economic activity, which in our view would have caused a recession under any conceivable fiscal and/or monetary policy alignment. As a business cycle indicator, the yield curve is significant for investors because it essentially represents the bond market’s assessment of the monetary policy stance. The 2-10 yield curve inversion in early April occurred, in part, because of the speed at which the Fed signaled it would raise interest rates, but also because the 10-year Treasury yield stood just under 2.4% at the point of inversion. This level of long-maturity bond yields reflected the view of both the Fed and most investors that the neutral rate of interest permanently fell following the 2008/2009 global financial crisis (GFC), a view that we have argued against in several previous reports.3 As such, the first reason we pushed back against earlier recessionary concerns is that we believe that the natural/neutral rate of interest is higher than the Fed and investors believe (even though we warned that a recessionary scare was quite likely). Chart I-2A Large Portion Of Currently Elevated Inflation Is Due To Supply-Side And Pandemic-Related Factors
July 2022
July 2022
The second reason that we had pushed back against recessionary concerns was our view that a meaningful portion of currently elevated US inflation is a function of supply-side and pandemic-related factors that will eventually abate. Chart I-2 highlights credible estimates showing that roughly half of the year-over-year change in the headline PCE deflator is the result of supply-side factors, versus 40-50% for core inflation. It has been and remains our view that a substantial portion of these supply-side and pandemic-related factors will dissipate as the pandemic continues to recede in importance, with several price categories likely to deflate outright. Chart I-3Excess Savings Should Still Support Higher Services Spending
Excess Savings Should Still Support Higher Services Spending
Excess Savings Should Still Support Higher Services Spending
Finally, we have argued in several reports that US goods spending has been well above-trend and is likely to slow, but also that services spending is far too low and is likely to rise. Chart I-3 highlights that close to $3 trillion in excess savings have accrued during the pandemic, which formed because of a combination of rising disposable income and falling services spending. We noted that the continued transition of the US and global economies towards a post-pandemic state would boost services spending, providing (an admittedly atypical) source of support for overall aggregate demand. Why The Odds Of A US Recession Have Increased We still believe that the US will more likely than not avoid a recession over the coming year, but it is true that the strength of all three of the arguments presented above has weakened. Regarding the stance of monetary policy, Charts I-4 and I-5 highlight that it is still true that the Fed funds rate and 5-year/5-year forward Treasury yields remain below our estimate of the neutral rate (nominal potential GDP growth). However, Chart I-6 highlights that the sharp rise in consumer price inflation has caused a substantial reduction in real wage growth, which certainly constitutes a non-monetary aggregate demand shock. Chart I-4The Policy Rate Is Not Yet At Neutral, But Mortgage Rates Are
The Policy Rate Is Not Yet At Neutral, But Mortgage Rates Are
The Policy Rate Is Not Yet At Neutral, But Mortgage Rates Are
Chart I-5Long-Maturity Government Bond Yields Would Have Room To Move A Lot Higher Absent Any Shocks To Demand...
Long-Maturity Government Bond Yields Would Have Room To Move A Lot Higher Absent Any Shocks To Demand...
Long-Maturity Government Bond Yields Would Have Room To Move A Lot Higher Absent Any Shocks To Demand...
Chart I-6...Unfortunately, US Consumers Are Clearly Experiencing A Shock In The Form Of Sharply Lower Real Wages
...Unfortunately, US Consumers Are Clearly Experiencing A Shock In The Form Of Sharply Lower Real Wages
...Unfortunately, US Consumers Are Clearly Experiencing A Shock In The Form Of Sharply Lower Real Wages
Panel 2 of Chart I-4 also shows that the 30-year mortgage rate in the US is now at neutral levels, in contrast to government bond yields and the US policy rate. Chart I-7 highlights that our models for US home sales and starts, featured in last month’s report,4 are still not pointing to a severe slowdown in the housing market. However, the fact that mortgage rates have risen to neutral territory means that it is possible that the usual ingredients for a recession – tight monetary policy plus a shock to aggregate demand – are currently present or soon will be. On the question of services spending acting as a support for US economic growth as goods spending slows, we continue to believe that services spending will recover back towards its pre-pandemic trend – funded by excess savings that accrued during the pandemic. However, Chart I-8, presented by my colleague Arthur Budaghyan in a recent Emerging Markets Strategy report,5 underscores the extent of the wealth destruction that has occurred because of the joint effect of falling stock and bond prices. At least some of the services-boosting effect of excess savings will likely be blunted by a negative wealth effect stemming from these financial market losses, especially since the remaining excess savings in the US are likely held by middle-to-upper income households – who are the disproportionate holders of publicly-traded financial assets. Chart I-7No Sign Yet Of A Sharp Slowdown In The Housing Market, But The Ingredients Of A Typical Recession May Be Present
No Sign Yet Of A Sharp Slowdown In The Housing Market, But The Ingredients Of A Typical Recession May Be Present
No Sign Yet Of A Sharp Slowdown In The Housing Market, But The Ingredients Of A Typical Recession May Be Present
Chart I-8A Significant Wealth Shock May Blunt The Deployment Of The Excess Savings Accrued During The Pandemic
A Significant Wealth Shock May Blunt The Deployment Of The Excess Savings Accrued During The Pandemic
A Significant Wealth Shock May Blunt The Deployment Of The Excess Savings Accrued During The Pandemic
On the inflation front, the May CPI release – and the Fed’s reaction to it – underscores that the US economy is at risk of a recession unless supply-side inflation dissipates quickly. Chart I-9 highlights that the May CPI release directly contradicted the view that the monthly rate of change in inflation has peaked. In addition, Chart I-10 presents a breakdown of the percent change in May’s headline consumer price index, with each bar in the chart representing the contribution of that category to headline CPI rising faster than 4% (annualized). The note next to each bar highlights our view of the main driver of that price category, and the color of the bars denotes how probable it is that we will soon see a significant easing in price pressure. Chart I-9The May CPI Report Was Clearly Inconsistent With A Peak Inflation Narrative
The May CPI Report Was Clearly Inconsistent With A Peak Inflation Narrative
The May CPI Report Was Clearly Inconsistent With A Peak Inflation Narrative
Chart I-10Some Elements Of Outsized CPI Will Dissipate Soon. Others May Not.
July 2022
July 2022
The chart makes it clear that certain price categories that have been strongly contributing to outsized headline inflation are likely to peak or even turn deflationary over the next few months. Gasoline and fuel oil inflation is clearly being driven by the trend in crude oil prices, which in our view will likely be flat for the rest of the year. In addition, motor vehicles and parts inflation continues to be driven by the impact of supply-chain shortages on vehicle production. Over the past year, the volume of industrial production of motor vehicle assemblies has averaged just 83% of its pre-pandemic level, which we noted in last month’s report now finally seems to be normalizing (Chart I-11). And while airlines have experienced legitimate cost increases due to rising fuel prices and COVID-related labor shortages, panel 2 of Chart I-11 highlights that real airfares have risen well above their pre-pandemic level. This underscores that a moderation in airfares is quite likely over the coming several months. However, Chart I-10 also highlights that there are several price categories that are less likely to ease quickly. Outsized food and energy services inflation has recently been tied to natural gas prices, given that natural gas is used to generate electricity and is a key element used in the production of fertilizer. Chart I-12 highlights that food inflation has been strongly correlated with the producer price index for pesticide, fertilizer, and other agricultural chemicals, and that there is no sign yet of the latter abating. Despite the fact that global wheat prices have recently been falling, the recent increase in European natural gas prices is likely to exacerbate US food inflation, as fertilizer is used to produce all major planted crops. In addition, European energy insecurity has created an even stronger link between the US and European natural gas markets than what prevailed prior to the Ukrainian war, because of what is likely to be permanently higher LNG demand from Europe. Chart I-11Vehicle And Airfare Inflation Is Likely To Ease Soon
Vehicle And Airfare Inflation Is Likely To Ease Soon
Vehicle And Airfare Inflation Is Likely To Ease Soon
Chart I-12Food Inflation May Remain Elevated For Some Time
Food Inflation May Remain Elevated For Some Time
Food Inflation May Remain Elevated For Some Time
On top of what is likely to be persistent food and energy services inflation, shelter inflation is likely to stay elevated for some time – a point highlighted by my esteemed former colleague, Martin Barnes, in Section 2 of this month’s report. The unemployment rate and house prices are the two main drivers of shelter inflation, and the effect of the latter clearly lags because owner’s equivalent rent is a surveyed measure. The fact that mortgage rates have risen so significantly points to a meaningful slowdown in house price appreciation and possibly even mild deflation, so shelter inflation will eventually slow. The Federal Reserve has made it clear, however, that they are now focused on quickly bringing down consumer prices, even at the cost of a recession. The justification for the Fed’s impatience comes straight from the Modern-Day Phillips Curve, which we discussed in great detail in our January 2021 Special Report.6 Economic theory dictates that inflation should be “normal” when the economy is in equilibrium – defined as economic growth in line with potential growth, no economic/labor market slack, and no supply-side shocks affecting prices. In the minds of many investors, “normal” inflation means the central bank’s target for inflation, but that is not necessarily the case. The experience of the 1970s highlighted that “normal” inflation is the rate that is expected by households and firms, and that the Fed will only succeed at achieving target inflation under normal economic conditions if inflation expectations are consistent with its target. The Fed’s failure to prevent inflation expectations from shifting higher on a structural basis led to two debilitating recessions in the early 1980s, and a prolonged period over which the Fed had to maintain comparatively tight monetary policy. This is a mistake that the Fed does not want to make again. Chart I-13Headline Inflation, Not Core, Is Driving Long-Term Inflation Expectations
Headline Inflation, Not Core, Is Driving Long-Term Inflation Expectations
Headline Inflation, Not Core, Is Driving Long-Term Inflation Expectations
Consistent with that view, Jerome Powell made it clear during the June FOMC meeting press conference that the Fed is now very concerned that long-term household inflation expectations may become unanchored to the upside. Powell implicitly referenced the University of Michigan’s 5-10 year median household inflation expectations survey during the press conference, which we have described in several previous reports as one of the most important macro data series for investors to monitor. The final reading for June came in materially lower than what was suggested by the preliminary report, but they were already at risk of a breakout even before the June release. In addition, Chart I-13 highlights that it is headline inflation (not core) that appears to be the main driver of rising long-term household inflation expectations, which raises a troubling point. If the Fed decides that inflation expectations need to be quickly reined in even at the cost of a higher unemployment rate, that decision implies that it is headline inflation that needs to return rapidly towards the Fed’s target, not just core. Given that some price categories shown in Chart I-10 are likely to be sticky for some time, and that the chart accounted for deviations in headline inflation from 4% (which itself is above the Fed’s target), the implication is that the Fed may have to crowd out demand for goods and services that are comparatively less affected by supply-side constraints. That would be clearly negative for economic growth, and is potentially recessionary in nature. As a final point, it is not just the potential for future economic weakness that concerns us. The US economy was already slowing prior to the Fed’s hawkish pivot and Russia’s invasion of Ukraine, and important indicators for economic activity continue to deteriorate. Chart I-14 highlights that the S&P Global US manufacturing and services PMIs fell meaningfully in June, and Chart I-15 highlights that the Conference Board’s US leading economic indicator continues to deteriorate. In fact, the Conference Board’s LEI has now decreased for three consecutive months, and the bottom panel of Chart I-15 highlights that four consecutive month-over-month declines have all essentially been associated with a recession. 2006 seemingly stands out as an exception to this rule, but given the fact that the housing market downturn began two years before the recession officially started, we simply regard this as an early recessionary signal rather than a false one. Chart I-14The US Is Losing Economic Momentum
The US Is Losing Economic Momentum
The US Is Losing Economic Momentum
Chart I-15The Conference Board's LEI May Soon Send A Recessionary Signal
The Conference Board's LEI May Soon Send A Recessionary Signal
The Conference Board's LEI May Soon Send A Recessionary Signal
No Help From Europe Or China An overweight stance towards global equities might still be warranted in the face of a significant slowdown in US economic activity if economic growth in Europe or China were accelerating. However, the European outlook has been strongly tied to natural gas flows from Russia since the invasion of Ukraine, which tightened meaningfully in June in response to Europe’s oil ban, the looming expansion of NATO, and Europe’s success at replenishing its amount of natural gas in storage. Russia has not fully weaponized its natural gas exports and its actions so far have fallen well short of a complete cutoff, but prices have risen close to 70% over the past month, forcing Germany to trigger the alert level of its emergency gas plan. Aside from the negative impact that higher natural gas prices will have on headline inflation globally, this is obviously incrementally negative for European economic activity. Chart I-16 highlights that the German IFO business climate indexes have led the S&P Global Germany PMI lower over the past few months, and that they imply further manufacturing weakness. And while the services climate index for Germany ticked higher, it remains meaningfully below the levels that prevailed last summer and implies a deterioration in German services activity over the coming few months. In China, we see no compelling signs of a sustainable pickup in economic activity that will provide a ballast to slowing growth in the DM world. We have seen a bounce back in some activity indicators following the significant easing of restrictions in Shanghai and Beijing (Chart I-17). These indicators, however, are still quite weak, and it is likely that China will experience significant further COVID outbreaks over the coming 6-12 months. Chart I-16Europe's Economy Is Likely To Slow Further
Europe's Economy Is Likely To Slow Further
Europe's Economy Is Likely To Slow Further
Chart I-17China's Post-Lockdown 'Recovery' Remains Tepid
China's Post-Lockdown 'Recovery' Remains Tepid
China's Post-Lockdown 'Recovery' Remains Tepid
While Chinese stocks have been rallying in absolute terms over the past few weeks, Chart I-18 highlights that this is essentially the only positive market-based signal about the pace of economic activity in China. The chart highlights that our market-based China Growth Indicator has experienced a renewed down leg, and that the diffusion index never rose above the boom/bust line earlier this year. The recent decline in industrial metals prices is also not a positive market-based signal for Chinese economic activity (Chart 19). Some investors have argued that weak metals prices reflect growth concerns outside of China, but even if that is the case, it implies that China’s reopening will not be forceful enough to offset slowing global ex-China growth. Chart I-18Market-Based Signals Are Not Pointing To An Improvement In Chinese Economic Activity
Market-Based Signals Are Not Pointing To An Improvement In Chinese Economic Activity
Market-Based Signals Are Not Pointing To An Improvement In Chinese Economic Activity
Chart I-19Metals Prices Are Now Falling, Highlighting Mounting Global Growth Fears
Metals Prices Are Now Falling, Highlighting Mounting Global Growth Fears
Metals Prices Are Now Falling, Highlighting Mounting Global Growth Fears
Has The US Equity Market Already Priced In A Recession? One very important question for investors to answer is how much further downside is likely to occur for US equities in the event of a US recession. At its worst point in mid-June, the S&P 500 fell close to 24% from its early January high, and many investors have since questioned whether the US equity market is already priced for a potential contraction in output. Chart I-20The S&P 500 Is Not Currently Priced For A US Recession
July 2022
July 2022
We disagree with this perspective, and believe that the S&P 500 would fall close to 3100 in a typical recession scenario. Chart I-20 presents a range of estimates for the S&P 500 based on a Monte Carlo approach, using what we believe are feasible ranges for the US equity risk premium, real 10-year government bond yields, and the extent of the decline in 12-month forward earnings per share. The chart shows that the equity market only has a positive return at the 5th percentile, which can be interpreted as just a 5% chance that the US equity market has already priced in the impact of a recession. Charts I-21 and I-22 highlight the range of possible outcomes that we used when modeling the likely decline in stock prices in a recession scenario. We assume that the equity risk premium, defined here as the difference between the S&P 500 12-month forward earnings yield and 10-year TIPS yields, rises on average to its early-March level in the wake of Russia’s invasion of Ukraine. We assume that both 10-year nominal Treasury yields and 10-year breakeven inflation rates fall to 2%, reflecting an expectation that 10-year TIPS yields will not return to negative territory in a recessionary scenario. Finally, we expect that S&P 500 forward EPS will decline by 15% from current levels, which is in line with the historical average decline in 12-month trailing operating EPS during recessions. Chart I-21We Do Not Expect Real Bond Yields To Fall Back Into Negative Territory In A Typical Recession Scenario
We Do Not Expect Real Bond Yields To Fall Back Into Negative Territory In A Typical Recession Scenario
We Do Not Expect Real Bond Yields To Fall Back Into Negative Territory In A Typical Recession Scenario
Chart I-22We Expect Earnings To Decline Between 10-20% In A Recession
We Expect Earnings To Decline Between 10-20% In A Recession
We Expect Earnings To Decline Between 10-20% In A Recession
One key takeaway from our analysis is that the likely recessionary equity market decline projected by our approach is fairly close to our estimate of the likely decline in earnings. One potential pushback against our view that earnings will fall in line with what usually occurs during recessions is the fact that nominal revenue growth may only mildly contract or may not contract at all in a recession that is occurring due to high rates of inflation (and thus higher prices charged by firms). Chart I-23 highlights that 12-month trailing S&P 500 sales per share growth never turned negative in the 1970s, even following the 1970 and 1974 recessions. Chart I-23Revenue Growth Did Not Contract In The 1970s, And May Not Contract Significantly If A Recession Occurs Today...
Revenue Growth Did Not Contract In The 1970s, And May Not Contract Significantly If A Recession Occurs Today...
Revenue Growth Did Not Contract In The 1970s, And May Not Contract Significantly If A Recession Occurs Today...
There are two counterpoints to this argument. First, the current risk of a recession mostly stems from the Fed’s determination not to repeat the mistakes that it made during the 1970s, meaning that inflation expectations are unlikely to rise to the level that they did during that period in advance of a recession. That implies that actual inflation, and thus corporate pricing power, will come down significantly during a recession. Second, even in a scenario in which a recession occurs and S&P 500 revenue growth contracts less aggressively than it has during previous recessions, Chart I-24 highlights that the mean-reversion risks to earnings from falling profit margins are quite high. The chart shows that even if profit margins were merely to return to their pre-pandemic levels during a recession (which would actually be a comparatively mild decline given the historical behavior of margins during recessions), it would imply close to a 20% contraction in earnings if sales per share growth were flat. Given this, we feel that our assumption of a 10-20% decline in earnings per share in a recessionary scenario is reasonable. Chart I-24But Profit Margins Are At Great Risk Of A Significant Decline If The Economy Contracts
But Profit Margins Are At Great Risk Of A Significant Decline If The Economy Contracts
But Profit Margins Are At Great Risk Of A Significant Decline If The Economy Contracts
There is another important takeaway from our analysis, which is that the decline in bond yields that will occur in a recessionary scenario will likely be more than offset by a rise in the equity risk premium. Another potential pushback against our view that the US equity market has already priced in a recession is focused on our assumption that the 10-year US Treasury yield will only fall back to 2%, and that real 10-year yields will not return to negative territory. For some investors, this assumption seems far too high, given the structural decline in long-maturity bond yields over the past decade and the fact that the 10-year yield stood below 2% at the beginning of the year when the odds of a recession were lower than they are today. In response to this, we offer three points for structurally-bullish bond investors to consider. The first is that the decline in the nominal 10-year US Treasury yield to 0.5% in 2020 was extremely irregular and it occurred because of the extent of the essentially unprecedented economic weakness wrought by the pandemic. This is absolutely the wrong yield benchmark to use in a typical recession scenario, because the Fed’s response to the recession will be much less aggressive. The second point is related to the first, in that negative real 10-year government bond yields have been heavily driven by the secular stagnation narrative and the general view that the natural/neutral rate of interest has permanently fallen. We agree that the neutral rate of interest fell for a time following the global financial crisis, but we believe strongly that it rose in the latter half of the last economic expansion as US households aggressively deleveraged their balance sheets. Academic estimates of R-star, such as that derived from the previously popular (but now discontinued) Laubach-Williams model, continued to point to a low neutral rate from 2015-2019 because of the deflationary impact of an energy-driven decline in long-term inflation expectations on actual inflation, a factor that is clearly no longer present. Chart I-25We Doubt That The Fed Will Resort To QE When The Next Recession Occurs
We Doubt That The Fed Will Resort To QE When The Next Recession Occurs
We Doubt That The Fed Will Resort To QE When The Next Recession Occurs
Finally, we agree that the existence of the Fed’s asset purchase program has likely had some impact on the 10-year term premium over the past decade. We doubt that the Fed would resort to QE as a monetary policy tool in response to a conventional recession, implying that the term premium will not fall as low as it has over the past decade when growth slowed or contracted. Chart I-25 highlights one important reason for this. Since 2008, the Fed’s use of asset purchases has been part of a strategy to ease monetary policy further when the policy rate had already fallen to zero, to meet its dual mandate of maximum employment and price stability. The chart highlights that even just prior to the pandemic, a persistent gap existed between the headline and core PCE deflator and the level that would have prevailed if both deflators had grown at a 2% annual rate since the onset of the 2008 recession. The chart makes it clear that this gap will completely disappear within the next 12 months for both the headline and core deflator, if the recent pace of change in prices is sustained. In effect, Chart I-25 highlights that the entire post-GFC missed inflation-target era is almost over, which severely undercuts the idea that the Fed will resort to QE as a monetary policy tool in a recession scenario unless the contraction is very severe as it was in 2008 and 2020. We doubt that this will be the case if a recession does occur, implying that both a deeply negative term premium and a significant decline in the 5-year/5-year forward bond yield in a typical recession scenario is unlikely. Investment Conclusions Wayne Gretsky’s famous quotation, that he “skate[s] to where the puck is going, not where it has been” is often invoked by BCA strategists. Successful active investing requires anticipation rather than reaction, and it is legitimate for investors to ask whether downgrading risky assets at the current juncture represents the latter rather than the former. We are cognizant of that risk, but we are also mindful of the importance of capital preservation. When we wrote our annual outlook last year, we believed fairly confidently that inflation would peak and specifically that supply-side inflation would wane. We still believe that pandemic-related effects on consumer prices will eventually dissipate, and it is still possible that inflation is in the process of peaking. Recent evidence, however, about the pace of price advances, the clear impact that high inflation is having on real wage growth, and the Fed’s desire to see consumer prices fall quickly back toward its target, means that the cyclical economic outlook is now highly dependent on the speed at which prices normalize – not just whether it will occur. To us, that implies that investors need to have a high-conviction view that supply-side inflation will normalize soon in order to stay overweight risky assets, and that the Fed will look through elevated housing-related inflation that is likely to persist for several months. At least in the case of supply-side inflation, we think normalization is probable but we no longer have high conviction about the speed of adjustment. As such, we recommend that investors maintain no more than a neutral stance towards stocks versus bonds in a global multi-asset portfolio. We also recommend that investors increase their allocation to government bonds within a global fixed income portfolio (to overweight), at the expense of corporate bonds, as part of an overall shift towards more defensive positions. In terms of other important asset class allocations, we recommend the following: Within a global equity portfolio, maintain a neutral regional allocation, a neutral stance toward cyclicals versus defensives, and a neutral stance towards small-cap stocks versus their large-cap peers. Modestly favor value stocks over growth stocks, as most of the outsized outperformance of growth stocks during the pandemic has already reversed. Within a fixed-income portfolio, a modestly short stance is warranted over the coming 6- to 12-months. Extremely stretched technical and valuation conditions point to a bearish view towards the US dollar over the coming 6- to 12-months, but USD will likely remain well-bid over the nearer-term. We are only likely to upgrade our cyclical USD call in a scenario in which we recommend underweighting global equities within a multi-asset portfolio. As noted above, financial markets rarely trend sideways over 6-to-12 month periods. We regard a neutral global asset allocation stance as a temporary stepping stone to either a further downgrade of risky assets to underweight or an increase in risky asset exposure back to a high-conviction overweight. Thus, additional changes to our recommended cyclical allocation may occur over the coming few months, in response to the incoming data and our assessment of the likely implications for monetary policy. Stay tuned! Jonathan LaBerge, CFA Vice President The Bank Credit Analyst June 30, 2022 Next Report: July 28, 2022 II. Inflation Whipsaw Ahead Dear Client, This month’s Special Report has been written by Martin Barnes, BCA’s former Chief Economist. Martin, who retired from BCA Research last year after a long and illustrious career, discusses the long-run outlook for inflation. The views expressed in this report are his, and may not be consistent with those of the Bank Credit Analyst or other BCA Research services. But Martin’s warning of future stagflation is sobering, and I trust you will find his report both interesting and insightful. Jonathan LaBerge, CFA The Bank Credit Analyst Overly stimulative policies meant that inflation was set to rise even before the disruptions caused by the pandemic and Ukraine conflict. Inflation should decline sharply over the coming year in response to weaker economic growth and an easing in supply problems. But it will be a temporary respite. Central banks will not have the stomach to keep policy tight enough for long enough to squeeze inflation out of the system. Price pressures will return as economies bottom and the environment will become one of stagflation. Financial assets will rally strongly when inflation fears subside but subsequent stagflation will not be bullish for markets. Former Federal Reserve Chairman Alan Greenspan once defined price stability as existing when “households and businesses need not factor expectations of changes in the average level of prices into their decisions”. Until recently, that state of affairs was the case for much of the past 30 years and for many, inflation was quiescent during their entire working lives. But inflation is now back as a huge issue and there is massive debate and uncertainty about whether it will be a temporary or lasting problem. I lean toward the latter view. Major changes in the economic and/or financial environment more often are identified in hindsight than in real time. It is easier to attribute large trend deviations to temporary factors than to make bold predictions about structural shifts. Obviously, the pandemic and conflict in Ukraine have had a significant impact on the near-term inflation picture via massive supply-side disruptions and represent temporary events. Thus, inflation will retreat from current elevated levels as those disruptions diminish. But the conditions for higher inflation were already in place before those two unfortunate events occurred. Specifically, central banks have been erring on the side of stimulus for several years and they will find it extremely difficult, if not impossible, to put the inflation genie back into the bottle. Inflation has moved from a non-issue to the most important factor driving markets. Over the next year, the next big surprise might be how fast inflation retreats and investors and policymakers will then breathe a big sigh of relief. However, this will prove to be a temporary respite because it will not take long for inflation to move back up and remain stubbornly above central bank targets. In other words, a whipsaw is in prospect over the next few years as inflation goes from up, to down, and to up again. The Current Inflation Problem The biggest increases in consumer prices have occurred in areas most affected by supply problems, with energy attracting the most attention. Nevertheless, in most countries, inflation has risen across the majority of goods and services. The core inflation rate (i.e. consumer prices excluding food and energy) in the G7 economies climbed from 2% to 4.8% between April 2021 and April 2022 (Chart II-1). Meanwhile, the Cleveland Fed’s trimmed mean measure of US consumer price inflation has spiked dramatically higher, consistent with a broad-based acceleration in inflation.7 The rise in underlying inflation is a bigger problem in the US, UK and Canada than in Japan or the Euro Area. Chart II-2 shows current core inflation rates relative to the target rate of 2% pursued by most central banks. That geographical divergence will be touched on later and in the meantime, the focus will be on the US situation. Chart II-1A Broad-Based Pickup In Inflation
A Broad-Based Pickup in Inflation
A Broad-Based Pickup in Inflation
Chart II-2The US, UK And Canada Have A Bigger Inflation Problem
July 2022
July 2022
The latest US inflation data for a range of goods and services is shown in Table II-1. The table shows the three- and six-month annualized changes in prices because 12-month rates can be affected by a base effect given the impact of pandemic-related shutdowns and disruptions a year ago. Also, a comparison of the three- and six-month rates shows if momentum is building or fading. The trends are not encouraging in that momentum has accelerated, not diminished in many key areas. Table II-1Selected Inflation Rates In The US CPI
July 2022
July 2022
Even if the data show a moderation in core inflation in the months ahead, it is important to note that rent inflation – the CPI component with the biggest weight – is seriously underestimated. This is one of the few items where prices are collected with a lag and real estate industry reports highlight that rent inflation is running at double-digit rates in the major cities. According to one report, average rents nationally increased by more than 25% in the year to May.8 The CPI data will eventually catch up with reality, providing at least a partial offset to any inflation improvements in other areas. Another problem for inflation is the acceleration in wage growth against the backdrop of an unusually tight labor market. Currently, the number of unfilled vacancies is almost twice the number of unemployed and it is thus no surprise that wage growth has picked up sharply (Chart II-3). The Atlanta Fed’s measure of annual wage inflation has risen above 6%, its highest reading since the data began in 1997. Wage growth is unlikely to suddenly decline absent a marked rise in the unemployment rate. There is much debate about whether the US economy is on the verge of recession, but let’s not get bogged down in semantics. Regardless of whether the technical definition of recession is met (at least two consecutive quarters of negative GDP growth), the pace of activity is set to slow sharply. Plunging consumer and business confidence, contracting real incomes and a peaking in housing activity all point to a significant weakening in growth, even if the labor market stays healthy (Chart II-4). Chart II-3A Very Tight US Labor Market
A Very Tight US Labor Market
A Very Tight US Labor Market
Chart II-4The US Economy Is In Trouble
The US Economy is in Trouble
The US Economy is in Trouble
Softer economic growth eventually will take the edge off inflationary pressures in many goods and services. Combined with an easing in supply-side disruptions, the inflation rate is certain to decline in the coming year, even if oil prices move higher in the short run. Currently, the Fed is talking tough about dealing with inflation and there is little doubt that further rate hikes are on the way. However, policymakers will have little stomach for inflicting enough economic pain to completely squeeze inflation out of the system. Once there are clear signs of a significant economic slowdown, the Fed will back off quickly. What Causes Inflation Anyway? Economics 101 teaches that prices are determined by the interaction of supply and demand. If the demand for a good or service exceeds supply, then prices will rise to bring things back into balance. Seems simple enough but, unfortunately, this leaves many unanswered questions. How much must prices rise and for how long in order to restore balance? What if there are structural impediments to supply? What if there are monopolies in key commodities or services? What if policy interferes with the operation of market-clearing solutions? And, finally, what measure of inflation should we be looking at? Chart II-5Inflation Is A 'Modern' Issue
Inflation is a 'Modern' Issue
Inflation is a 'Modern' Issue
For much of economic history, deflation was just as prevalent as inflation, with the latter only being a problem during periods of war (Chart II-5). As the pre-WWII world pre-dated fiat money, automatic stabilizers (e.g. the welfare state), and counter-cyclical fiscal policy, economies were prone to regular depressions that served to wash out financial and economic excesses and any inflationary pressures. But those days are long gone and free market forces should not be expected to keep inflation under wraps. I rather like the simple explanation of inflation’s roots as being “too much money chasing too few goods”. In that sense, the control of inflation lies firmly at the door of central banks. In the “old days” (i.e. before the 1990s), it was possible to use the growth in the money supply to gauge the stance of policy because there was a fairly stable and predictable relationship between monetary and economic trends. That all ended when financial deregulation and the explosion in non-bank financial activities meant that monetary trends ceased to be a reliable indicator of economic growth and inflation. As a result, the Fed stopped setting monetary growth targets more than 20 years ago and since then, money supply data has rarely been mentioned in FOMC discussions. Chart II-6A Simple Measure Of The Monetary Stance
A Simple Measure of the Monetary Stance
A Simple Measure of the Monetary Stance
Fortunately, all is not lost. The gap between the federal funds rate and nominal GDP growth is a reasonably good proxy for the stance of monetary policy. Conditions are easy when rates are persistently below GDP growth and vice versa when they are above. As can be seen in Chart II-6, rates were below GDP growth during most of the 1960s and 1970s, a period when inflation rose sharply. And inflation fell steadily in the 1980s into the first half of the 1990s when the Fed kept interest rates above GDP growth. And look at what has happened in the past decade: rates have been significantly below GDP growth, suggesting an aggressively easy monetary stance. It was only a matter of time before inflation picked up, even without the recent supply-side disruptions. The FOMC’s latest projections show long-run growth of 3.8% in nominal GDP while the fed funds rate is expected to average only 2.5%. That implies a continued accommodative stance, yet inflation is forecast to be in line with the 2% target. That all seems very unlikely. Fed policymakers spend a lot of time trying to figure out the level of the equilibrium real interest rate – the level consistent with steady non-inflationary economic growth. It would be very helpful to have this number but coming up with an accurate measure is a largely futile exercise. It cannot be measured empirically and its estimation requires a lot of assumptions, explaining why there is no broad agreement on what the right number is. I think there is a case for the simpler approach of using the nominal growth in GDP as a proxy for where rates should be in normal circumstances. As noted above, that suggests monetary policy was excessively accommodative for an extended period. If US Policy Was Too Easy, Why Was Inflation Low For So Long? The Fed’s preferred measure of underlying inflation is the change in the personal consumption deflator, excluding food and energy. In the 25 years to 2019, inflation by this measure averaged only 1.7%, compared to the Fed’s desired level of 2%. Thus, even though the level of interest rates implied very accommodative policy over that period, inflation remained tame. This leads to an important caveat. The stance of monetary policy plays the key role in driving inflation, but it is not everything. Offsetting forces on inflation (in both directions) can mute or even swamp the impact of policy. There were several disinflationary forces in operation during the past 25 years. Specifically: In the second half of the 1990s, the explosive growth of the internet and accompanying boom in technology spending led to a marked pickup in productivity growth. The entry of China into the World Trade Organization at the end of 2001 unleashed a wave of offshoring and downward pressure on traded goods prices. A series of deflationary shocks hit the US and global economy including the 1998 financial crisis in South-East Asia and Russia, the bursting of the tech bubble after 2000, and of course the global financial meltdown in 2007-09. Unstable economic conditions undermined labor’s bargaining power, keeping a tight lid on wage growth. This was highlighted by the dramatic decline in labor’s share of income after 2000. Importantly, the above forces are no longer in place and in some cases are reversing. The key technological advances of the past decade have not been particularly good for productivity. Indeed, one could argue that the activities of most so-called FANG stocks – especially those involved in social media - have had a negative impact on productivity. Time spent on FaceBook, Twitter and Netflix do not have obvious benefits for increased economic efficiency. Chart II-7Globalization In Retreat
Globalization in Retreat
Globalization in Retreat
Even before the pandemic’s impact on supply chains, there were signs that globalization had peaked (Chart II-7). Indeed, BCA first suggested in 2014 that globalization was running out of steam. More recently, the interruption to supply chains has highlighted the downside of relying excessively on overseas production for key goods such as semi-conductors and pharmaceuticals. Onshoring rather than offshoring will become more common with higher prices being the cost for greater control over supply. Globalization is not dead, but, at the margin, it no longer is a powerful source of disinflation. US import prices from China are back to their highest level in a decade after falling steadily during the eight years to 2020. The inflationary impact of the pandemic and the war in Ukraine via supply-side disruptions are more than offsetting any disinflationary effects of softer economic growth. In other words, they have represented stagflationary rather than deflationary shocks. Finally, with regard to income shares, the pendulum has swung more in favor of labor. Demographic trends (e.g. slow growth in the working-age population) suggest that the labor market will remain relatively tight in the years ahead, notwithstanding short-term weakness as the economy slows. Profit margins are likely to weaken and labor’s share of income will rise. The bottom line is that easy money policies will no longer be offset by a number of powerful external forces that served to keep consumer price inflation under wraps in the pre-pandemic period. And this raises another important point. If monetary policy is too easy, then it will show up somewhere, even if consumer price inflation is under control. There Is More Than One Kind Of Inflation Inflation most commonly refers to the change in the prices of consumer goods and services. That is understandable because consumer spending accounts for more than half of GDP in the major developed economies (and almost 70% in the US). And because consumers are the ones who vote, it is the inflation rate that politicians care most about. However, there are other kinds of inflation. If there are structural impediments to increased consumer prices, then excessively easy monetary policy most likely will show up in higher asset prices. This is a very different kind of inflation because it is welcomed by the owners of assets and by politicians. Nobody is happy to face higher prices for the goods and services they buy, but asset owners love the wealth-boosting effect of higher prices for homes and shares. Consumer inflation may have been subdued in the pre-pandemic decade, but the same is not true for asset prices. During the period that the Fed ran accommodative policies, there were several periods of rampant asset inflation such as the tech stock bubble of the late 1990s, the housing bubble of the 2000s, and the bond bubble of 2016-2020. And both equity and home prices surged in response to monetary stimulus triggered by the pandemic. Central banks may fret about the potential financial stability implications of surging asset prices, but in practice they do not act to curb them. Policymakers argue that it is hard to determine when an asset bubble exists and even when one is obvious, monetary policy is a crude tool to deal with it. If rising asset prices occur alongside an economy that is characterized by stable growth and moderate inflation, then acting to burst a bubble could inflict unnecessary economic damage. That is an understandable position, but it means ignoring the longer-term problems that occur when bubbles inevitably burst. This was highlighted by the economic and financial chaos after the US housing bubble burst in 2007. The reality is that central banks have been forced to rely more heavily on asset inflation as a source of monetary stimulus. An easing in monetary policy affects economic conditions in three primary ways: boosting credit demand and supply, raising asset prices, and lowering the exchange rate.9 Historically, the credit channel was by far the most important. BCA has written extensively about the Debt Supercycle and the role of monetary policy in fueling ever-rising levels of private sector indebtedness (see the Appendix for a brief description of the Debt Supercycle). Chart II-8No Releveraging Cycle In Household Debt
No Releveraging Cycle in Household Debt
No Releveraging Cycle in Household Debt
The environment changed dramatically after the 2007-09 financial meltdown. The collapse of the credit-fueled housing bubble drove a stake through the heart of the household sector’s love affair with debt. The ratio of household debt to income peaked in early 2009 and ten years later it was back to the levels of 2001 (Chart II-8). Even an extended period of record low interest rates has failed to trigger a new leveraging cycle. If the Fed can’t persuade consumers and businesses to fall back in love with debt, then it must rely on the other two transmission channels for monetary policy – asset prices and the exchange rate. And the Fed really has limited control over the latter channel given that it also depends on the actions of other central banks. The deleveraging of the household sector in the post-2009 period could have been very bearish for the economy, but the Fed’s easy money policies underpinned the stock market, allowing household net worth to revive. There was an explosive rise in household net worth in 2020-21 as surging house prices added to stock market gains. Between end-2019 and end-2021, the household sector’s direct holdings of equities plus owner’s equity in real estate increased in value by around $20 trillion, equal to more than one year’s personal disposable income. The recent decline in equity prices has reversed some of the gains, but net worth remains elevated by historical standards. The bottom line is that it was wrong to suggest that the Fed’s accommodative stance did not create inflation. Consumer price inflation was tame in the pre-pandemic period, but there was lots of asset inflation and that gathered pace in 2020 and 2021. There was always going to be some leakage of this into more generalized inflation but this was accelerated by the double whammy of the supply disruptions caused by the pandemic and the Ukraine war. The Strange Case Of Japan If higher inflation in the US has seemed inevitable, how can one explain the situation in Japan? In contrast to other developed countries, Japan’s annual core inflation rate was only 0.2% in May. While this was an increase from the average -1.3% rate in the prior six months, it is impressive given the country’s continued highly stimulative monetary policy and the same exposure to supply disruptions as elsewhere. Most importantly, Japan has suffered structural deflation for so long that inflation expectations are totally dormant for both consumers and businesses. In other words, raising prices is seen as a desperate measure and something to be avoided. Japan’s poor demographics may also have played a role. A sharply declining labor force and rapidly aging population are disinflationary rather than inflationary influences and help reinforce the corporate sector’s reluctance to raise prices. While Japan seems an outlier, it is worth noting that core inflation also has remained relatively subdued in many European countries. For the overall Euro area, the latest core inflation rate is 3.8%, well below that of the US and UK. Two common features of the higher inflation countries are that they tended to have more aggressively-easy fiscal policies in recent years and greater asset inflation – especially in real estate. Unfortunately, inflation expectations and business pricing behavior in the US and other Anglo-Saxon economies have not followed Japan’s example. Employees have become more aggressive in demanding higher wages, and most companies have no problem in passing on higher costs to their customers. The UK is facing a wave of public sector strikes over pay the likes of which have not been seen for decades. The Outlook Chart II-9A Peaking In Supply Problems?
A Peaking in Supply Problems?
A Peaking in Supply Problems?
Inflation may prove sticky over the next few months, but as noted earlier, it should move significantly lower over the coming year. Crude oil prices have risen by around 75% in the past year and that pace of rise cannot be sustained. Meanwhile, while shipping rates remain historically high, they are down sharply from earlier peaks (Chart II-9). Together with a revival in Chinese exports, this suggests some easing in supply chain problems. And as mentioned above, the pace of economic activity is set to slow sharply. But a return to pre-pandemic inflation levels is not in the cards. The Fed currently is talking tough and further rate hikes are on the way. But the tightening will end as soon as it becomes clear that the economy is heading south. A deep recession is not likely because there are not the worrying imbalances such as excessive consumer debt or inventories that typically precede serious downturns. However, policymakers will not take any risks and policy will return quickly to an accommodative stance, even though inflation is unlikely to return to the desired 2% level. On a positive note, inflation may be the highest in 40 years in many countries, but we are not facing a return to the destructive high-inflation environment of the 1970s. Inflation back then was institutionalized and a self-feeding cycle of higher wages and rising prices was deeply embedded. I was working as an economist for BP in London in the 1970s and remember receiving large quarterly pay rises just to compensate for inflation. In the absence of inflation-accounting practices, companies seriously underestimated the destruction that inflation was creating to balance sheets and profitability, making them complacent about the problem. Moreover, there were not the same global competitive pressures that exist today. Inflation in the US likely will form a new base of 3% to 4% over the medium term, with occasional fluctuations to 5% or above. An environment of stagflation is in prospect: growth will not be weak enough to suppress inflation and not strong enough to allow the Fed to maintain a restrictive stance. This puts the Fed in a difficult spot as it will be reluctant to admit defeat by raising the inflation target from its current 2%, even though that level will be out of reach in practical terms. A counter view is that I am too pessimistic by underestimating the disinflationary effects of technological advances. A sustained improvement in productivity would certainly help lower inflation but how likely is this? Technological advances are occurring all the time, but in recent years they largely have been incremental in nature and it is hard to think of any new breakthrough productivity-enhancing technologies. There is a difference between new technologies that simply represent better ways to do existing tasks (3D printing would fall into that category) and general purpose technologies that completely change the way economies operate (e.g. electricity and the internet). While businesses are still exploiting the benefits of the digital world, we await innovations that will trigger a new sustained upsurge in productivity. A game changer would be the development of unlimited cheap energy (cold fusion?) but that does not seem likely any time soon. Nevertheless, I will keep an open mind about the potential for productivity to surprise on the upside, despite my current skepticism. Chart II-10Inflation Expectations Spike Higher
Inflation Expectations Spike Higher
Inflation Expectations Spike Higher
What does all this mean for the markets? Not surprisingly, shifts in market expectations for future inflation are highly correlated with the current rate and have thus spiked higher in recent months, hurting both bonds and stocks (Chart II-10). Obvious inflation hedges would be inflation-protected bonds and resources, but neither group currently is attractively priced. The good news is that the current panic about inflation is setting the scene for a buying opportunity in both stocks and bonds. The exact timing is tricky to predict but both stocks and bonds will rally strongly later this year when inflation expectations retreat as it becomes clear that the economy is weakening and the Fed softens its hawkish tones. The bad news is that this bullish phase will not last much more than a year because a re-emergence of inflationary pressures will bring things back to earth. The long-run outlook is one of stagflation and that will be a tough environment for financial assets. Martin H. Barnes Former Chief Economist, BCA Research mhbarnes15@gmail.com Appendix: A Primer On The Debt Supercycle The Debt Supercycle is a description of the long-term decline in U.S. balance-sheet liquidity and rise in indebtedness during the post-WWII period. Economic expansions have always been associated with a buildup of leverage. However, prior to the introduction of automatic stabilizers such as the welfare state and deposit insurance, balance-sheet excesses tended to be fully unwound during economic downturns, albeit at the cost of severe declines in activity. The pain of the Great Depression led governments to intervene to smooth out the business cycle, and their actions were given legitimacy by the economic theories of John Maynard Keynes. Fiscal and monetary reflation, together with the introduction of automatic stabilizers such as unemployment insurance, were successful in preventing the frequent depressions that plagued the pre-WWII economy, but the downside was that balance-sheet imbalances and financial excesses built up during each expansion phase were never fully unwound. Periodic "cyclical" corrections to the buildup of debt and illiquidity occurred during recessions, but these were never enough to reverse the long-run trend. Although liquidity was rebuilt during a recession, it did not return to its previous cyclical high. Meanwhile, the liquidity rundown during the next expansion phase established new lows. These trends led to growing illiquidity, and vulnerability in the financial markets. The greater the degree of illiquidity in the economy, the greater is the threat of deflation. Thus, the bigger that balance-sheet excesses become, the more painful the corrective process would be. So, the stakes became higher in each cycle, putting ever-increasing pressure on the authorities to reflate demand, by whatever means were available. The Supercycle process was driven over time by the building tension between rising underlying deflationary risks in the economy, and the ability of policymakers to create inflation. The Supercycle reached an important inflection point in the recent economic and financial meltdown, with the authorities reaching the limit of their ability to get consumers to take on more leverage. This forced the government to leverage itself up instead, representing the Debt Supercycle's final inning. III. Indicators And Reference Charts BCA’s equity indicators paint a bearish picture for stock prices. Our monetary indicator is now at its weakest in almost three decades and our valuation indicator highlights that stocks are still overvalued, albeit less so than they were last year. Meanwhile, both our sentiment and technical indicators have now broken down very significantly, and are not yet providing a contrarian buy signal. The odds of a US recession over the next 12 months have recently risen, and we now recommend a neutral stance for stocks versus bonds over the coming year. Forward earnings are no longer being significantly revised up, but bottom-up analysts’ expectations for earnings are still too rosy. Although earnings growth is still likely to be positive over the coming year if a US recession is avoided, it will be in the mid-to-low single-digits. Within a global equity portfolio, we recommend a neutral stance on cyclicals versus defensives, small caps versus large, and a neutral stance on regional equity allocation. Within a fixed-income portfolio, investors should stay modestly short duration. The increase in commodity prices that followed Russia’s invasion of Ukraine has cooled, and prices are now rolling over significantly on the back of global growth concerns. Our composite technical indicator has dropped meaningfully, indicating that commodities are now no longer overbought. Our base-case view is that oil prices have peaked, but there some risk to that view given the current geopolitical situation. In addition, the recent rise in European natural gas prices suggests that global food inflation could remain elevated, given that natural gas is used in the production of fertilizer. We remain structurally bullish on industrial metals, but metals prices are likely to decline further until recessionary concerns abate. US and global LEIs have rolled over significantly and are now edging towards negative territory. The Conference Board’s LEI has now decreased for three consecutive months, and four consecutive month-over-month declines have historically been associated with a recession. Our global LEI diffusion index has bottomed, but we are not convinced that this heralds a major upturn in the LEI itself. EQUITIES: Chart III-1US Equity Indicators
US Equity Indicators
US Equity Indicators
Chart III-2Willingness To Pay For Risk
Willingness To Pay For Risk
Willingness To Pay For Risk
Chart III-3US Equity Sentiment Indicators
US Equity Sentiment Indicators
US Equity Sentiment Indicators
Chart III-4US Stock Market Breadth
US Stock Market Breadth
US Stock Market Breadth
Chart III-5US Stock Market Valuation
US Stock Market Valuation
US Stock Market Valuation
Chart III-6US Earnings
US Earnings
US Earnings
Chart III-7Global Stock Market And Earnings: Relative Performance
Global Stock Market And Earnings: Relative Performance
Global Stock Market And Earnings: Relative Performance
Chart III-8Global Stock Market And Earnings: Relative Performance
Global Stock Market And Earnings: Relative Performance
Global Stock Market And Earnings: Relative Performance
FIXED INCOME: Chart III-9US Treasurys And Valuations
US Treasurys And Valuations
US Treasurys And Valuations
Chart III-10Yield Curve Slopes
Yield Curve Slopes
Yield Curve Slopes
Chart III-11Selected US Bond Yields
Selected US Bond Yields
Selected US Bond Yields
Chart III-1210-Year Treasury Yield Components
10-Year Treasury Yield Components
10-Year Treasury Yield Components
Chart III-13US Corporate Bonds And Health Monitor
US Corporate Bonds And Health Monitor
US Corporate Bonds And Health Monitor
Chart III-14Global Bonds: Developed Markets
Global Bonds: Developed Markets
Global Bonds: Developed Markets
Content Chart III-15Global Bonds: Emerging Markets
Global Bonds: Emerging Markets
Global Bonds: Emerging Markets
CURRENCIES: Chart III-16US Dollar And PPP
US Dollar And PPP
US Dollar And PPP
Chart III-17US Dollar And Indicator
US Dollar And Indicator
US Dollar And Indicator
Chart III-18US Dollar Fundamentals
US Dollar Fundamentals
US Dollar Fundamentals
Chart III-19Japanese Yen Technicals
Japanese Yen Technicals
Japanese Yen Technicals
Chart III-20Euro Technicals
Euro Technicals
Euro Technicals
Chart III-21Euro/Yen Technicals
Euro/Yen Technicals
Euro/Yen Technicals
Chart III-22Euro/Pound Technicals
Euro/Pound Technicals
Euro/Pound Technicals
COMMODITIES: Chart III-23Broad Commodity Indicators
Broad Commodity Indicators
Broad Commodity Indicators
Chart III-24Commodity Prices
Commodity Prices
Commodity Prices
Chart III-25Commodity Prices
Commodity Prices
Commodity Prices
Chart III-26Commodity Sentiment
Commodity Sentiment
Commodity Sentiment
Chart III-27Speculative Positioning
Speculative Positioning
Speculative Positioning
Chart III-28US And Global Macro Backdrop
US And Global Macro Backdrop
US And Global Macro Backdrop
ECONOMY: Chart III-29US Macro Snapshot
US Macro Snapshot
US Macro Snapshot
Chart III-30US Growth Outlook
US Growth Outlook
US Growth Outlook
Chart III-31US Cyclical Spending
US Cyclical Spending
US Cyclical Spending
Chart III-32US Labor Market
US Labor Market
US Labor Market
Chart III-33US Consumption
US Consumption
US Consumption
Chart III-34US Housing
US Housing
US Housing
Chart III-35US Debt And Deleveraging
US Debt And Deleveraging
US Debt And Deleveraging
Chart III-36US Financial Conditions
US Financial Conditions
US Financial Conditions
Chart III-37Global Economic Snapshot: Europe
Global Economic Snapshot: Europe
Global Economic Snapshot: Europe
Chart III-38Global Economic Snapshot: China
Global Economic Snapshot: China
Global Economic Snapshot: China
Jonathan LaBerge, CFA Vice President The Bank Credit Analyst Gabriel Di Lullo Research Associate Footnotes 1 Please see Global Investment Strategy Special Alert "Hard Or Soft Landing? BCA Strategists Debate The Question," dated June 21, 2022, available at gis.bcaresearch.com 2 Please see The Bank Credit Analyst "April 2022," dated March 31, 2022, available at bca.bcaresearch.com 3 Please see Global Investment Strategy "Revisiting The Neutral Rate Of Interest: A Contrarian View In A Time Of Crisis," dated March 20, 2020, available at gis.bcaresearch.com; The Bank Credit Analyst "R-star, And The Structural Risk To Stocks," dated March 31, 2021, available at bca.bcaresearch.com; The Bank Credit Analyst "Do Excess Savings Explain Low US Interest Rates?" dated March 31, 2022, available at bca.bcaresearch.com 4 Please see The Bank Credit Analyst "Is The US Housing Market Signaling An Imminent Recession?" dated May 26, 2022, available at bca.bcaresearch.com 5 Please see Emerging Markets Strategy "A Conversation With Ms. Mea: Navigating An Inflation Storm," dated June 16, 2022, available at ems.bcaresearch.com 6 Please see The Bank Credit Analyst "The Modern-Day Phillips Curve, Future Inflation, And What To Do About It," dated December 18, 2020, available at bca.bcaresearch.com 7 This trimmed mean measure excludes the top 8% of CPI components with the largest monthly price gains and the bottom 8% with the smallest monthly gains. 8 Rent.com, https://www.rent.com/research/average-rent-price-report/, June 2022. 9 A fourth channel can be via a psychological boost to business and consumer confidence, but this can cut both ways if an easing in policy is interpreted as a sign of worsening economic conditions rather than as a reason for optimism.
Executive Summary There has never been a modern era recession or sharp slowdown in which the oil price did not collapse. In a recession, the massive destruction of oil demand always overwhelms a tight supply. Across the last six recessions, the median collapse in the oil price was -60 percent, with the best case being -30 percent, and the worst case being -75 percent. Hence, in the coming recession, the oil price is likely headed to $55, with the best case being $85, and the worst case being $30. Investors should short oil, or short oil versus copper. Equity investors should underweight the oil sector versus basic resources and/or industrials and/or banks, and underweight oil-heavy equity markets such as Norway. Fractal trading watchlist: Oil versus industrials, and oil versus banks. Oil Didn’t Get The ‘Everything Sell-Off’ Memo
Oil Didn't Get The 'Everything Sell-Off' Memo
Oil Didn't Get The 'Everything Sell-Off' Memo
Bottom Line: There has never been a modern era recession or sharp slowdown in which the oil price did not collapse, and this time will be no different. Feature We have just witnessed a rare star-alignment. The near-perfect line up of Mercury, Venus, Mars, Jupiter and Saturn in the heavens is a spectacular sight for the early birds who can star gaze through clear skies. And it is a rare event, which last happened in 2004. But investors have just witnessed an even rarer star-alignment. The ‘everything sell-off’ in stocks, bonds, inflation-protected bonds, industrial metals, and gold during the second quarter has happened in only one other calendar quarter out of almost 200. Making it a ‘1 in a 100’ event, which last happened way back in 1981 (Chart I-1 and Chart I-2). Chart I-1The ‘Everything Sell-Off’ In 2022…
Oil Didn't Get The 'Everything Sell-Off' Memo
Oil Didn't Get The 'Everything Sell-Off' Memo
Chart I-2...Last Happened In 1981
...Last Happened In 1981
...Last Happened In 1981
As we detailed in our previous reports Markets Echo 1981 When Stagflation Morphed Into Recession and More On 2022-23 = 1981-82 And The Danger Ahead, a once-in-a-generation conjugation connects the ‘1 in a 100’ everything sell-offs in 1981 and 2022. The conjugation is inflation fears, exacerbated by a major war between commodity producing neighbours, and countered by aggressive rate hikes, morph into recession fears. The 1981-82 episode is an excellent blueprint for market action through 2022-23. This makes the 1981-82 episode an excellent blueprint for market action through 2022-23, and we refer readers to the previous reports for the implications for stocks, bonds, equity sectors, and currencies. Oil Didn’t Get The ‘Everything Sell-Off’ Memo But one major investment didn’t get the ‘everything sell-off’ memo. That major investment is crude oil. Even within the commodity space, oil is the outlier. In the second quarter, industrial commodity prices have collapsed: copper, -20 percent; iron ore -25 percent; tin, -40 percent; and lumber, -40 percent. Yet the crude oil price is up, +7 percent, and the obvious explanation is the Russia/Ukraine war (Chart I-3). Chart I-3Oil Didn't Get The 'Everything Sell-Off' Memo
Oil Didn't Get The 'Everything Sell-Off' Memo
Oil Didn't Get The 'Everything Sell-Off' Memo
The Russia/Ukraine war is an important part of the 2022/1981 once-in-a-generation conjugation. In 1981, just as now, the full-scale invasion-led war between two major commodity producing neighbours – Iraq and Iran – disrupted commodity supplies, and thereby added fuel to an already red-hot inflationary fire. When Russia invaded Ukraine earlier this year, the oil price surged by 25 percent. Remarkably, when Iraq invaded Iran in late 1980, the oil price also surged by 25 percent. But by mid-1981, with the global economy slowing, the oil price had given back those gains. Then, as the economy entered recession in early 1982, the oil price slumped to 15 percent below its pre-war level. If 2022-23 follows this blueprint, it would imply the oil price falling to $85/barrel (Chart I-4). Chart I-4If Oil Follows The 1981-82 Blueprint, It Will Tumble To $85
If Oil Follows The 1981-82 Blueprint, It Will Tumble To $85
If Oil Follows The 1981-82 Blueprint, It Will Tumble To $85
There Has Never Been A Recession In Which The Oil Price Did Not Collapse Everybody knows the narrative for the oil price surge this year. In what is putatively a very tight market, the embargo of Russian oil has removed enough supply to put significant upward pressure on the price. The trouble with this story is that Russian oil will find a buyer, even if it requires a discount. Moreover, with the major buyers being China and India, it will be politically and physically impossible to police secondary sanctions. The bottom line is that Russian oil will find its way into the market. There has never been a modern era recession or sharp slowdown in which the oil price did not collapse. But the bigger problem will come from the demand side of the equation when the global economy enters, or even just flirts with, a recession. Put simply, because of massive demand destruction, there has never been a modern era recession or sharp slowdown in which the oil price did not collapse (Chart I-5 - Chart I-10). Chart I-5In The Early 80s Recession, Oil Collapsed By -30 Percent
In The Early 80s Recession, Oil Collapsed By -30 Percent
In The Early 80s Recession, Oil Collapsed By -30 Percent
Chart I-6In The Early 90s Recession, Oil Collapsed By -60 Percent
In The Early 90s Recession, Oil Collapsed By -60 Percent
In The Early 90s Recession, Oil Collapsed By -60 Percent
Chart I-7In The 2000 Dot Com Bust, Oil Collapsed By ##br##-55 Percent
In The 2000 Dot Com Bust, Oil Collapsed By -55 Percent
In The 2000 Dot Com Bust, Oil Collapsed By -55 Percent
Chart I-8In The 2008 Global Financial Crisis, Oil Collapsed By -75 Percent
In The 2008 Global Financial Crisis, Oil Collapsed By -75 Percent
In The 2008 Global Financial Crisis, Oil Collapsed By -75 Percent
Chart I-9In The 2015 EM Recession, Oil Collapsed By ##br##-60 Percent
In The 2015 EM Recession, Oil Collapsed By -60 Percent
In The 2015 EM Recession, Oil Collapsed By -60 Percent
Chart I-10In The 2020 Pandemic, Oil Collapsed By ##br##-75 Percent
In The 2020 Pandemic, Oil Collapsed By -75 Percent
In The 2020 Pandemic, Oil Collapsed By -75 Percent
Furthermore, as we explained in Oil Is The Accessory To The Murder, a preceding surge in the oil price is a remarkably consistent ‘straw that breaks the camel’s back’, tipping an already fragile economy over the brink into recession. Meaning that the oil price ends up in a symmetrical undershoot to its preceding overshoot. The result being a massive drawdown in the oil price in every modern era recession or sharp slowdown. Specifically: Early 80s recession: -30 percent Early 90s recession: -60 percent 2000 dot com bust: -55 percent 2008 global financial crisis: -75 percent 2015 EM recession: -60 percent 2020 pandemic: -75 percent What about the 1970s episode – isn’t this the counterexample in which the oil price remained stubbornly high despite a recession? No, even in the 1974 recession, the oil price fell by -25 percent. Moreover, the commonly cited explanation for the elevated nominal price of oil through the 70s is a misreading of history. The popular narrative blames OPEC supply cutbacks related to geopolitical events – especially the US support for Israel in the Arab-Israel war of October 1973. As neat and popular as this narrative is, it ignores the real culprit: the collapse in August 1971 of the Bretton Woods ‘pseudo gold standard’, which severed the fixed link between the US dollar and quantities of commodities. To maintain the real value of oil, OPEC countries were raising the price of crude oil just to play catch up. Meaning that while geopolitical events may have influenced the precise timing and magnitude of price hikes, OPEC countries were just ‘staying even’ with the collapsing real value of the US dollar, in which oil was priced. In terms of gold, in which oil was effectively priced before 1971, the oil price was no higher in 1980 than in 1971! (Chart I-11) Chart I-11Priced In Gold, The Oil Price Was No Higher In 1980 Than in 1971!
Priced In Gold, The Oil Price Was No Higher In 1980 Than in 1971!
Priced In Gold, The Oil Price Was No Higher In 1980 Than in 1971!
Shorting Oil And Oil Plays Will Be Very Rewarding For Patient Investors The four most dangerous words in investment are ‘this time is different’. Today, the oil bulls insist that this time really is different because of an unprecedented structural underinvestment in fossil fuel extraction. Leaving the precariously tight oil market vulnerable to the slightest uptick in demand, or downtick in supply. Maybe. But to reiterate, in a recession, the massive destruction of oil demand always overwhelms a tight supply. In this important regard, this time will not be different. Taking the median drawdown of the last six recessions of 60 percent, and applying it to the post-invasion peak of $130, it implies that, in the coming recession, oil will plunge to $55. In a recession, the massive destruction of oil demand always overwhelms a tight supply. Of course, this is the average of a range of recession outcomes, with the best case being $85 and the worst case being $30. Still, this means that patient investors who short oil can look forward to substantial gains. Alternatively, those who want a hedged position should short oil versus copper – especially as oil versus copper is now at the top of its 25-year trading channel (Chart I-12). Chart I-12Oil Versus Copper Is At The Top Of Its 25-Year Trading Channel
Oil Versus Copper Is At The Top Of Its 25-Year Trading Channel
Oil Versus Copper Is At The Top Of Its 25-Year Trading Channel
Equity investors should underweight the oil sector versus basic resources (Chart I-13) and/or versus industrials and/or versus banks, and underweight oil-heavy stock markets such as Norway (Chart I-14). Chart I-13Underweight Oil Versus Basic Resources
Underweight Oil Versus Basic Resources
Underweight Oil Versus Basic Resources
Chart I-14Underweight Oil-Heavy Stock Markets Such As Norway
Underweight Oil-Heavy Stock Markets Such As Norway
Underweight Oil-Heavy Stock Markets Such As Norway
Suffice to say, these are all correlated trades. They will all work, or they will all not work. But to repeat, this time is never different. Fractal Trading Watchlist Confirming the fundamental arguments to underweight oil plays, the spectacular recent outperformance of oil equities versus both industrials and banks has reached the point of fragility on its 260-day fractal structures that has reliably signalled previous turning points (Chart I-15). Chart I-15The Outperformance Of Oil Versus Industrials Is Exhausted
The Outperformance Of Oil Versus Industrials Is Exhausted
The Outperformance Of Oil Versus Industrials Is Exhausted
We are adding oil versus banks to our watchlist, with this week’s recommendation being to underweight oil versus industrials, setting a profit target and symmetrical stop-loss of 10 percent, with a maximum holding period of 6 months. Fractal Trading Watchlist: New Additions The Outperformance Of Oil Versus Banks Is Exhausted
The Outperformance Of Oil Versus Banks Is Exhausted
The Outperformance Of Oil Versus Banks Is Exhausted
Chart 1BRL/NZD At A Resistance Point
BRL/NZD At A Resistance Point
BRL/NZD At A Resistance Point
Chart 2Homebuilders Versus Healthcare Services Has Turned
Homebuilders Versus Healthcare Services Has Turned
Homebuilders Versus Healthcare Services Has Turned
Chart 3CNY/USD At A Potential Turning Point
CNY/USD Has Reversed
CNY/USD Has Reversed
Chart 4US REITS Are Oversold Versus Utilities
US REITS Are Oversold Versus Utilities
US REITS Are Oversold Versus Utilities
Chart 5CAD/SEK Is Vulnerable To Reversal
CAD/SEK Reversal Has Started
CAD/SEK Reversal Has Started
Chart 6Financials Versus Industrials Has Reversed
Financials Versus Industrials To Reverse
Financials Versus Industrials To Reverse
Chart 7The Outperformance Of Resources Versus Biotech Has Ended
The Outperformance Of Resources Versus Biotech Has Started To Reverse
The Outperformance Of Resources Versus Biotech Has Started To Reverse
Chart 8The Outperformance Of Resources Versus Healthcare Has Ended
The Outperformance Of Resources Versus Healthcare Is Vulnerable To Reversal
The Outperformance Of Resources Versus Healthcare Is Vulnerable To Reversal
Chart 9FTSE100 Outperformance Vs. Euro Stoxx 50 Is Vulnerable To Reversal
FTSE100 Outperformance Vs. Euro Stoxx 50 Is Reversing
FTSE100 Outperformance Vs. Euro Stoxx 50 Is Reversing
Chart 10Netherlands' Underperformance Vs. Switzerland Is Ending
Netherlands Underperformance Vs. Switzerland Has Been Exhausted
Netherlands Underperformance Vs. Switzerland Has Been Exhausted
Chart 11The Sell-Off In The 30-Year T-Bond At Fractal Fragility
The Sell-Off In The 30-Year T-Bond Is Approaching Fractal Fragility
The Sell-Off In The 30-Year T-Bond Is Approaching Fractal Fragility
Chart 12The Sell-Off In The NASDAQ Is Approaching Fractal Fragility
The Sell-Off In The NASDAQ Is Approaching Fractal Fragility
The Sell-Off In The NASDAQ Is Approaching Fractal Fragility
Chart 13Food And Beverage Outperformance Is Exhausted
Food And Beverage Outperformance Has Been Exhausted
Food And Beverage Outperformance Has Been Exhausted
Chart 14German Telecom Outperformance Vulnerable To Reversal
AT REVERSAL
AT REVERSAL
Chart 15Japanese Telecom Outperformance Vulnerable To Reversal
AT REVERSAL
AT REVERSAL
Chart 16The Strong Downtrend In The 18-Month-Out US Interest Rate Future Has Ended
The Strong Trend In The 18-Month-Out US Interest Rate Future Is Fragile
The Strong Trend In The 18-Month-Out US Interest Rate Future Is Fragile
Chart 17The Strong Downtrend In The 3 Year T-Bond Is Fragile
The Strong Trend In The 3 Year T-Bond Is Fragile
The Strong Trend In The 3 Year T-Bond Is Fragile
Chart 18A Potential Switching Point From Tobacco Into Cannabis
A Potential Switching Point From Tobacco Into Cannabis
A Potential Switching Point From Tobacco Into Cannabis
Chart 19Biotech Is A Major Buy
Biotech Is A Major Buy
Biotech Is A Major Buy
Chart 20Norway's Outperformance Has Ended
Norway's Outperformance Could End
Norway's Outperformance Could End
Chart 21Cotton Versus Platinum Has Reversed
Cotton's Outperformance Is Vulnerable To Reversal
Cotton's Outperformance Is Vulnerable To Reversal
Chart 22Switzerland's Outperformance Vs. Germany Has Ended
Fractal Trading Watch List
Fractal Trading Watch List
Chart 23USD/EUR Is Vulnerable To Reversal
The Rally In USD/EUR Could End
The Rally In USD/EUR Could End
Chart 24The Outperformance Of MSCI Hong Kong Versus China Has Ended
The Outperformance Of MSCI Hong Kong Versus China Is Vulnerable To Reversal
The Outperformance Of MSCI Hong Kong Versus China Is Vulnerable To Reversal
Chart 25A Potential New Entry Point Into Petcare
A Potential New Entry Point Into Petcare
A Potential New Entry Point Into Petcare
Chart 26GBP/USD At A Potential Turning Point
GBP/USD At A Turning Point
GBP/USD At A Turning Point
Chart 27US Utilities Outperformance Vulnerable To Reversal
Fractal Trading Watch List
Fractal Trading Watch List
Chart 28The Outperformance Of Oil Versus Banks Is Exhausted
Fractal Trading Watch List
Fractal Trading Watch List
Dhaval Joshi Chief Strategist dhaval@bcaresearch.com Fractal Trading System Fractal Trades
Why Oil Is Headed To $55
Why Oil Is Headed To $55
Why Oil Is Headed To $55
Why Oil Is Headed To $55
6-Month Recommendations Structural Recommendations Closed Fractal Trades Indicators To Watch - Bond Yields Chart II-1Indicators To Watch - Bond Yields - Euro Area
Indicators To Watch - Bond Yields - Euro Area
Indicators To Watch - Bond Yields - Euro Area
Chart II-2Indicators To Watch - Bond Yields - Europe Ex Euro Area
Indicators To Watch - Bond Yields - Europe Ex Euro Area
Indicators To Watch - Bond Yields - Europe Ex Euro Area
Chart II-3Indicators To Watch - Bond Yields - Asia
Indicators To Watch - Bond Yields - Asia
Indicators To Watch - Bond Yields - Asia
Chart II-4Indicators To Watch - Bond Yields - Other Developed
Indicators To Watch - Bond Yields - Other Developed
Indicators To Watch - Bond Yields - Other Developed
Indicators To Watch - Interest Rate Expectations Chart II-5Indicators To Watch - Interest Rate Expectations
Indicators To Watch - Interest Rate Expectations
Indicators To Watch - Interest Rate Expectations
Chart II-6Indicators To Watch - Interest Rate Expectations
Indicators To Watch - Interest Rate Expectations
Indicators To Watch - Interest Rate Expectations
Chart II-7Indicators To Watch - Interest Rate Expectations
Indicators To Watch - Interest Rate Expectations
Indicators To Watch - Interest Rate Expectations
Chart II-8Indicators To Watch - Interest Rate Expectations
Indicators To Watch - Interest Rate Expectations
Indicators To Watch - Interest Rate Expectations
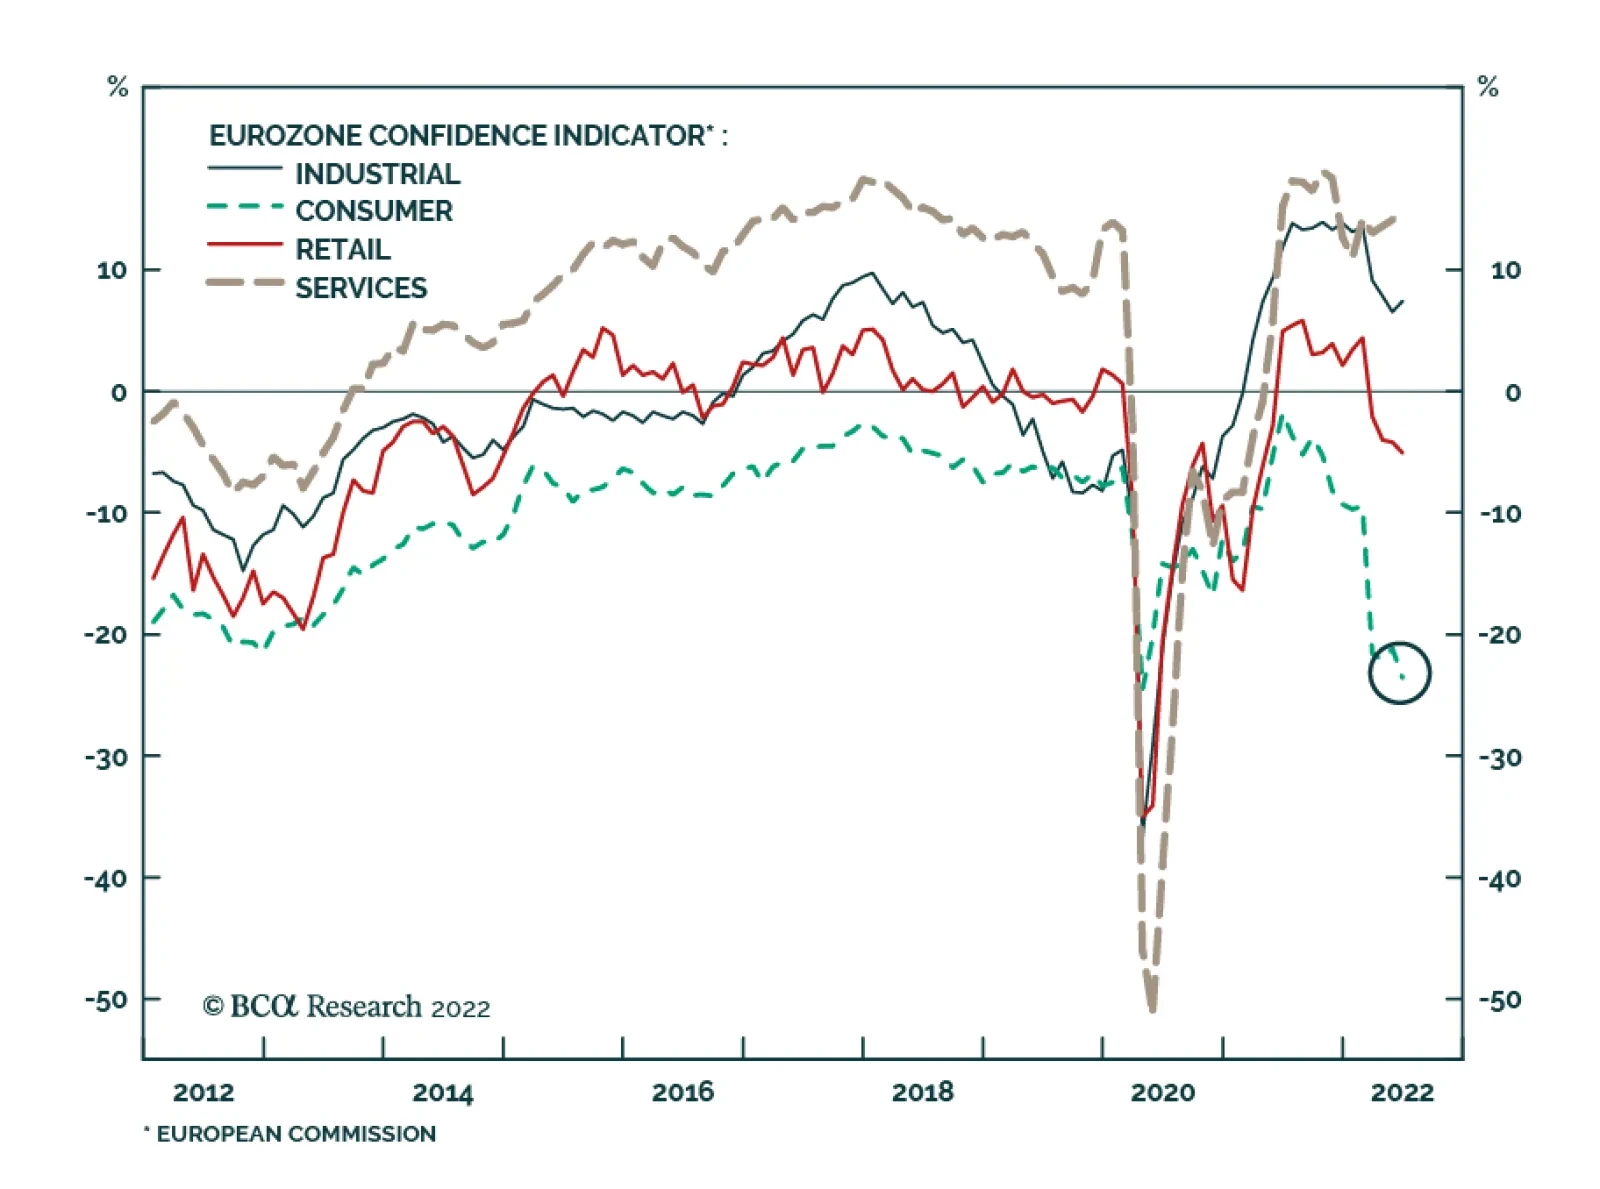
Eurozone economic confidence fell 1 point to 104.0 in June, slightly above expectations of 103.0. Deteriorating consumer morale (which fell from -21.1 to -23.6) offset improvements in industrial (from 6.5 to 7.5) and services sector confidence (from 14.1 to…
Executive Summary Unhappy Households Make Unhappy Voters
Unhappy Households Make Unhappy Voters
Unhappy Households Make Unhappy Voters
US polarization while down is still near historic peaks. Negative sentiments are forming among households and businesses due to inflation and high gas price, which makes fiscal expansion unlikely in the near future. President Biden is running out of options to shore the Democrats’ political capital ahead of the midterm. Biden will resort to using executive orders and move on to foreign affairs as the legislative route is blocked. More actions in the international realm will inject geopolitical risks in an already volatile year. Asset Initiation Date Return Long US Health Care Vs. S&P 500 2021-06-30 13.5% Bottom Line: Higher political risk in the near term warrants a defensive posture. Feature Dear Client, This week’s report is brought to you by Jesse Kuri, Associate Editor of our US Political Strategy. Jesse provides an update of our US Political Capital Index, which enables us to quantify the Biden administration’s ability to get things done. Jesse measures precisely how far Biden’s political capital has fallen since his election in November 2020 and highlights the key indicators investors should monitor to assess whether the administration can regain effectiveness after the midterm election. Jesse also updates our US Equity Sector Political Risk Matrix, which combines insights from our US Equity Strategist Irene Tunkel with our own assessments of whether politics will add upside or downside risk to each sector. Health care stocks are notable for facing policy risks skewed to the upside. All very best, Matt Gertken, Chief US Political Strategist Last week, the Supreme Court delivered two political shocks to the system. On June 23rd, the Supreme Court ruled that New York’s state limit on carrying guns in public violates the Second Amendment. Furthermore, on June 24th, the court delivered what was well known for almost a month: A ban on abortion by the state of Mississippi is constitutional, overturning a 49-year-old precedent set up by Roe v. Wade. Both rulings are set to aggravate the already elevated political tensions in the US. Related Report US Political StrategyThe Supreme Court And Midterm Elections The high court rulings overshadowed a momentous bipartisan move in Congress – the passage of the first gun control bill in almost 30 years on June 24th. 15 Republican Senators and 14 Republican House Members joined their Democratic colleagues to pass the Bipartisan Safer Communities Act. This bill includes more stringent background checks for gun buyers younger than 21 years of age, more funding for mental health care programs, federal funding to encourage states to implement red flag laws to take guns away from questionable owners, and the closing of the boyfriend loophole. So, how should investors reconcile the seemingly contradictory moves in US politics: Extreme polarization and unrest punctuated by moments of bipartisanship? Investors should ignore the US gun law — and instead focus on women’s support of Biden in coming months. If women start becoming more active in voting and start approving Democrats much more than expected, then that will help Democrats marginally. But it will not likely change the outcome of the midterm, which favors Republicans heavily in the House at least. Is President Biden’s political capital too low to save his party from a political reckoning this year? Most likely the answer is yes. Biden’s Political Capital Roundup Political Polarization Chart 1Polarization: Declining But Near Peak
Polarization: Declining But Near Peak
Polarization: Declining But Near Peak
It would be easier to push for a policy in a less divided country, as there is a consensus on what constitutes good policy among the stakeholders. But a country that is depolarizing in times of economic stress is a negative for the political capital of the government of the day, as there is a consensus that times are tough, and the acting government will be blamed for this. In June, our polarization proxy, constructed by differencing Democrats’ and Republicans’ approval of President Biden, increased. The polarization proxy increased as Democrats’ approval of Biden rose while Republicans’ approvals remained flat, relative to their respective levels in May. Also in May, our economic sentiment polarization indicator, which is the difference between the economic sentiment of Democrats and Republicans, increased from its level in April, as Republicans’ sentiment declined by 25%, while Democrats’ sentiment only fell by 7%. On the other hand, the Philadelphia Fed Partisan Conflict Index, another indicator that the US Political Strategy team tracks, declined in May. This is not surprising considering that this indicator is constructed by the Philly Fed from news headlines which had either been dominated by the war in Ukraine or by the skyrocketing inflation. The only other time that this indicator declined was during the pandemic because everyone was in agreement that the pandemic is a negative event, just like the war in Ukraine and inflation. All three indicators are below their respective levels of November 2020. While polarization declined, it is still close to its peak in 2019-2020 (Chart 1). Household Sentiment Chart 2Biden's Approval Plumbing New Lows
Biden's Approval Plumbing New Lows
Biden's Approval Plumbing New Lows
A government with a high approval rating among households can afford to pass policies and painful reforms, as it is less likely to be punished at the ballot box if voters are happy. Unfortunately for President Biden, his approval rating is plumbing new lows; the American Rescue Plan, loose monetary policy, and external geopolitical shocks have all resulted in US inflation reading that were last seen 40 years ago. As a result, Biden was never rewarded by voters for the passage of the American Rescue Plan and the Infrastructure Investment and Jobs Act. To shore up his and the Democrats’ political capital, Biden is now attempting to strike deals with partners and adversaries in Europe, the Middle East, and China, but they are not likely to lend him or the Democrats a helping hand; and, even if deals could be reached, the damage to the Democrats’ midterm prospect has already been done, which goes beyond the pattern where the President’s party tends to suffer in the first midterm. In another sign of the souring mood among voters, the Conference Board Consumer Confidence Index declined by 2% in May on a month-over-month basis and 11% on a year-over-year basis. While the consumer confidence index is higher now than it was in November 2020, it is 17% below its peak in the summer of 2021. What would have been a comeback year for US consumer spending is going to be dampened by high energy prices and general price inflation due to external shocks (Chart 2). Business Sentiment Governments also need the support of the business community to implement policies: Negative sentiment in the business community would subdue capital spending and job growth, which would affect household sentiment and subsequently, the ability of the government to pass its agenda. In May, high-frequency business indicators pointed to business sentiment turning negative. The capex intention survey declined by 20% from April and 37% compared to May of last year. Every activity indicator from the ISM, apart from the manufacturing employment index, is below their respective levels in November 2020, when the pandemic was raging, and vaccines had not yet been rolled out (Chart 3). The small business surveys conducted by the NFIB is indicative of the underlying reasons behind negative business sentiment: Despite lower concern about regulation and taxes, business concerns over inflation and labor costs are up by 1300% and 100%, respectively, since November of 2020. Concerns over taxes and regulation have largely been allayed as the Democrats have failed to use their second chance at reconciliation, with moderate senators objecting to higher taxes. But this decline in worries over taxes and regulation have given way to concerns about inflation and labor costs, and President Biden and the Democrats are struggling to address these concerns (Chart 4). Chart 3Businesses Are Downbeat...
Businesses Are Downbeat...
Businesses Are Downbeat...
Chart 4... Due to Inflation and Labor Costs
... Due to Inflation and Labor Costs
... Due to Inflation and Labor Costs
Government Sector Chart 5The Purse String Will Be Tightened
The Purse String Will Be Tightened
The Purse String Will Be Tightened
The government can use fiscal policy to shore up its diminishing political capital. In Q1 2022, the fiscal thrust for the federal government was -14.3% of GDP, a 27 percentage-point swing from Q1 of last year when the Biden administration passed the American Rescue Plan (Chart 5). It is unlikely that fiscal thrust would recover anytime soon considering that fiscal stimulus early in Biden’s term had contributed to the inflation that the economy is experiencing now. While the Democrats have one last chance at using reconciliation, at best they would pass a deficit neutral budget, as there is no appetite for another extravagant budget in this inflationary environment; at worst, they could be pushed by moderate Democrats towards increasing revenue through tax hikes. Hence, Biden’s political capital through the use of fiscal policy is unlikely to recover. Economic Conditions The economy is the one bright spot underpinning Biden’s political capital (Chart 6). The unemployment rate was unchanged at 3.6% in May, close to an all-time low and 3.1 percentage points below November 2020. For the first time in his term, the stock market-to-wage ratio fell in April to below the level of November 2020 – mainly due to the sell-off in the stock market. While this is positive for reducing inequality, the Fed’s attempt to cool down the economy will also affect wage growth and household wealth via the stock market. In May, policy uncertainty was still lower than what it was in November 2020, but on a month-on-month basis, uncertainty in the US increased by 12%. Personal bankruptcies in Q1 barely increased from Q4 2021, while business bankruptcies declined by 3% during the same period. Consumer loan delinquencies also remained flat at 1.6%. Financial distress levels are still significantly below their pre-pandemic level (Chart 7). Chart 6Recovery Is Going Well...
Recovery Is Going Well...
Recovery Is Going Well...
Chart 7... And Household And Business Finances Are Improving...
... And Household And Business Finances Are Improving...
... And Household And Business Finances Are Improving...
Chart 8... But Inflation And Gas Price Overshadow the Recovery
... But Inflation And Gas Price Overshadow the Recovery
... But Inflation And Gas Price Overshadow the Recovery
If voters weigh these indicators equally, Biden will have strong political capital underpinned by the strong economy (78% of these indicators are sending positive signals), but there are two indicators with outsized impacts on household and business sentiment: inflation and gas prices (Chart 8). Inflation is close to an all-time high, and the high inflation will force the Federal Reserve to act to raise rates which will, in turn, cool down economic activity. The latest readings of gas prices pin them at 5 dollars per gallon, a 138% increase from November 2020. The oil/energy shock is happening at a time when Americans are experiencing their first summer without restrictions since 2019. High gas prices, high inflation, and the potential for a recession may threaten the much-awaited pent-up demand. Asset Market Chart 9Stock Market Woes Add To The Negative Sentiment
Stock Market Woes Add To The Negative Sentiment
Stock Market Woes Add To The Negative Sentiment
The equity market is also a component of political capital – while a booming stock market is not guaranteed to be a tailwind for the President as seen from the case of President Trump during the midterm of 2018, a bear market will compound the negativity that is abound in the economy. The S&P 500 is down 18% from December 2021 and the 2-year Treasury yield is up by 231 bps. The S&P 500 is only 8% above its November 2020 level and if one takes into consideration inflation since then, the S&P 500 is below its level of November 2020 (Chart 9). Our colleagues at the Emerging Markets Strategy service have estimated that the recent selloff has wiped out roughly US$12 trillion from the US equity market and US$3.5 trillion from the US bond market. Political/Constitutional Strength An immutable component of political capital is the constitutional strength of the President – majorities in the Electoral College and popular votes, and control of Congress and the Supreme Court. President Biden, unlike Presidents Bush and Trump, had majorities in both the electoral college and national popular votes. But his control of Congress was significantly weaker; in 2017 Republicans had a seat majority in the Senate and a 23-seat advantage in the House, while the Democrats a one seat advantage in the Senate, via the Vice President, and a 4-seat majority in the House at Biden’s inauguration. Furthermore, Trump started his term with an evenly split Supreme Court, which later was expanded to 5-4 once Justice Gorsuch was confirmed, while Democrats have a 3-6 disadvantage due to the passing of Justice Ginsburg in 2020. Biden’s constitutional strength is weaker than Trump’s and Obama’s. Bottom Line: Biden’s political capital had been greatly diminished and he will unlikely be able to push for his agenda through legislative means. He is also unlikely to be able to replenish his political capital anytime soon due to skyrocketing inflation, which makes fiscal policy unpalatable to the public. As the midterm closes in, Biden will be desperate to shore up his and the Democrats political capital, and as the legislative route will be unavailable, he will resort to regulatory, executive, and foreign policy actions. Investment Conclusions As a foreign energy shock is mainly responsible for high gasoline prices in the US, Biden will attempt to have a reset with oil producers in the Middle East; but this will come at the cost of diplomacy with Iran, while attempting to restart nuclear negotiations with Iran will come at the cost of further alienating oil producers and allies in the Middle East. The Democrats domestic approach which was to disparage oil producers for alleged price gouging will also inject downside risk to the energy sector. Europe and Japan will be weighed down by the global energy shock as they are both net importers of energy, unlike the US. This will affect the sales of US industrial products abroad and by extension, the US industrial sector. Geopolitical risks will depress capex spending in Europe. The consumer discretionary sector could trade sideways as inflation bites and the stock market declines, yet strong household finances – as seen by low delinquency rates and massive pent-up demand from 2 years of lockdowns – will be tailwinds for the sector. The tech and communication services sectors will benefit from near-peak polarization, yet there are regulatory challenges at home and abroad which could weigh these sectors down. Financial regulations will pick up from low levels at end-2021 due to changes at the Fed. Plus, the Democrats and regulatory agencies will not look too kindly on banks aiding companies in merging and consolidating in a market where inflation is sky-high. The increases in rents could spur action from local governments to act on housing market which may include anti-market policies such as rent control and stabilization, which will negatively impact the real estate sector. Health care is the only sector with political risks to the upside – Biden had punted on radical changes to the health care system and even if he seeks to make changes, he lacks the political capital to do so. His actions abroad will also put a floor under global geopolitical risks, ensuring the USD remains well bid, and health care tends to do well when the dollar is in a bull market. Jesse Anak Kuri Associate Editor jesse.kuri@bcaresearch.com Matt Gertken Senior Vice President Chief US Political Strategist mattg@bcaresearch.com Strategic View Open Tactical Positions (0-6 Months) Open Cyclical Recommendations (6-18 Months)
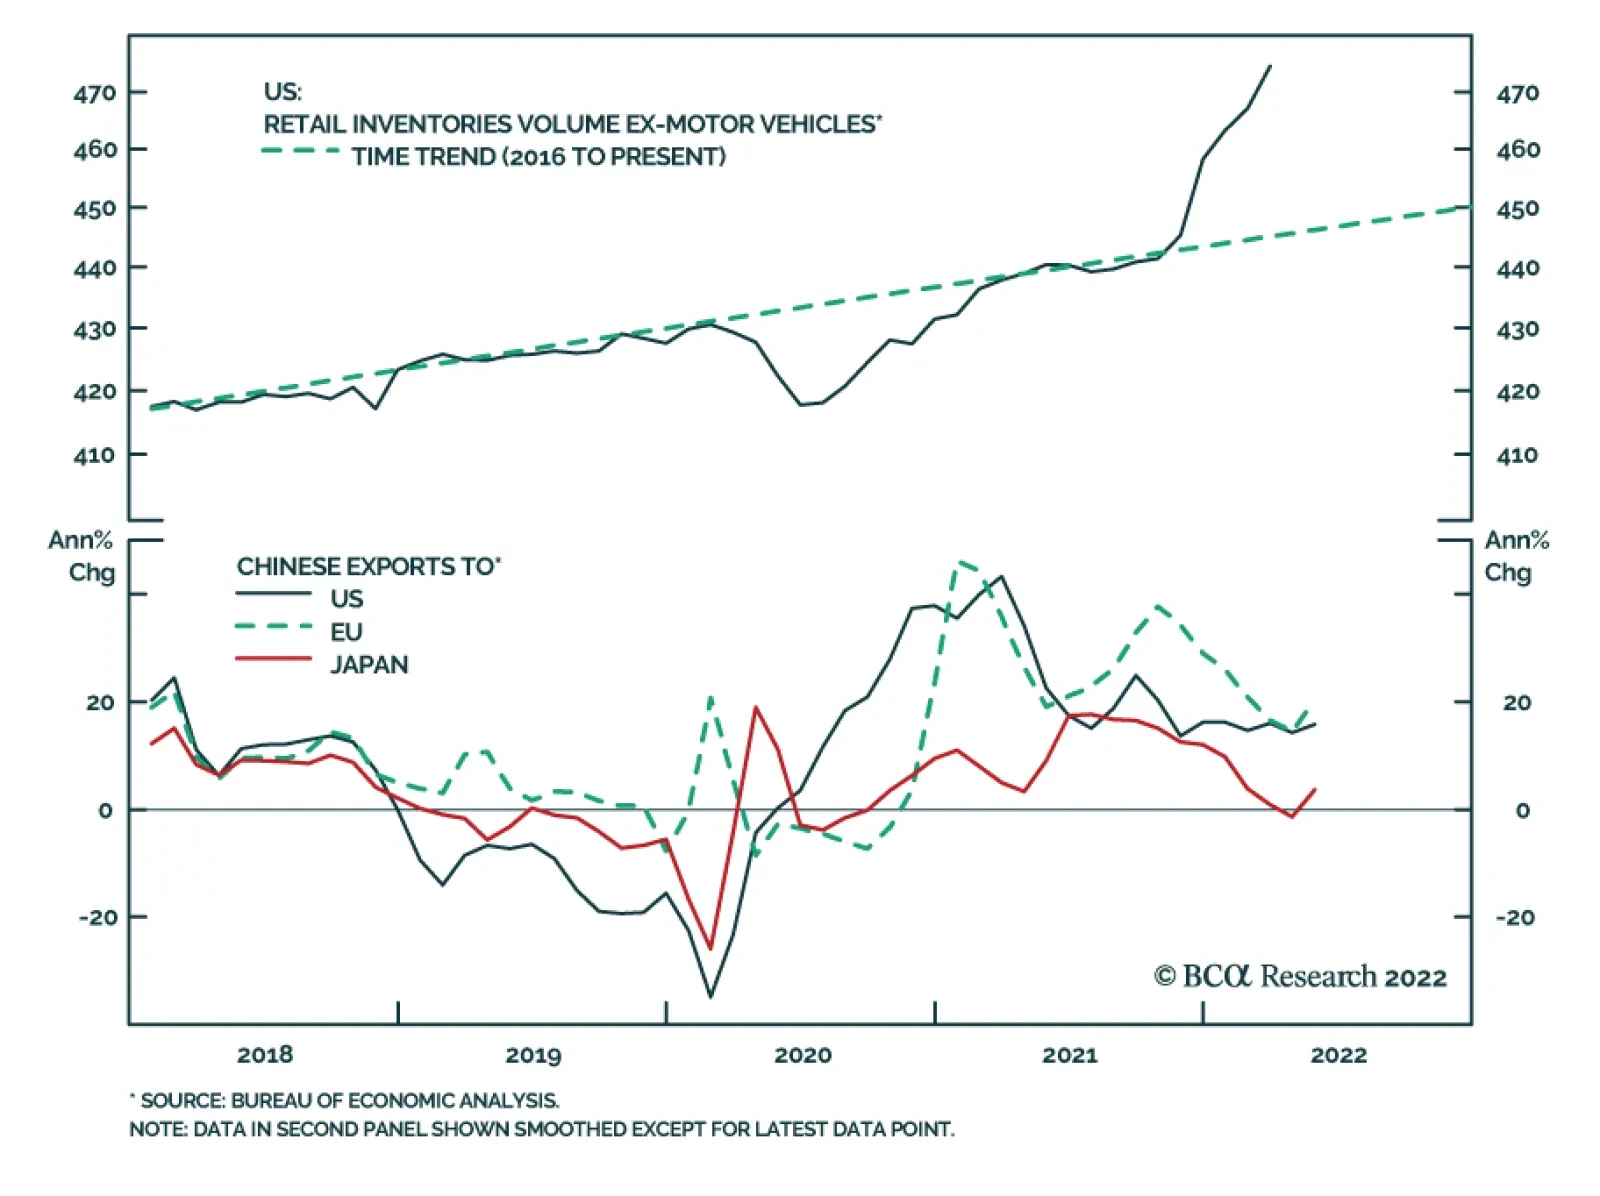
Preliminary estimates indicate that the US merchandise trade deficit shrunk from $106.7 billion to $104.3 billion in May – the smallest deficit so far this year. In particular, industrial supplies and consumer goods led to a $2.0 billion increase in goods…
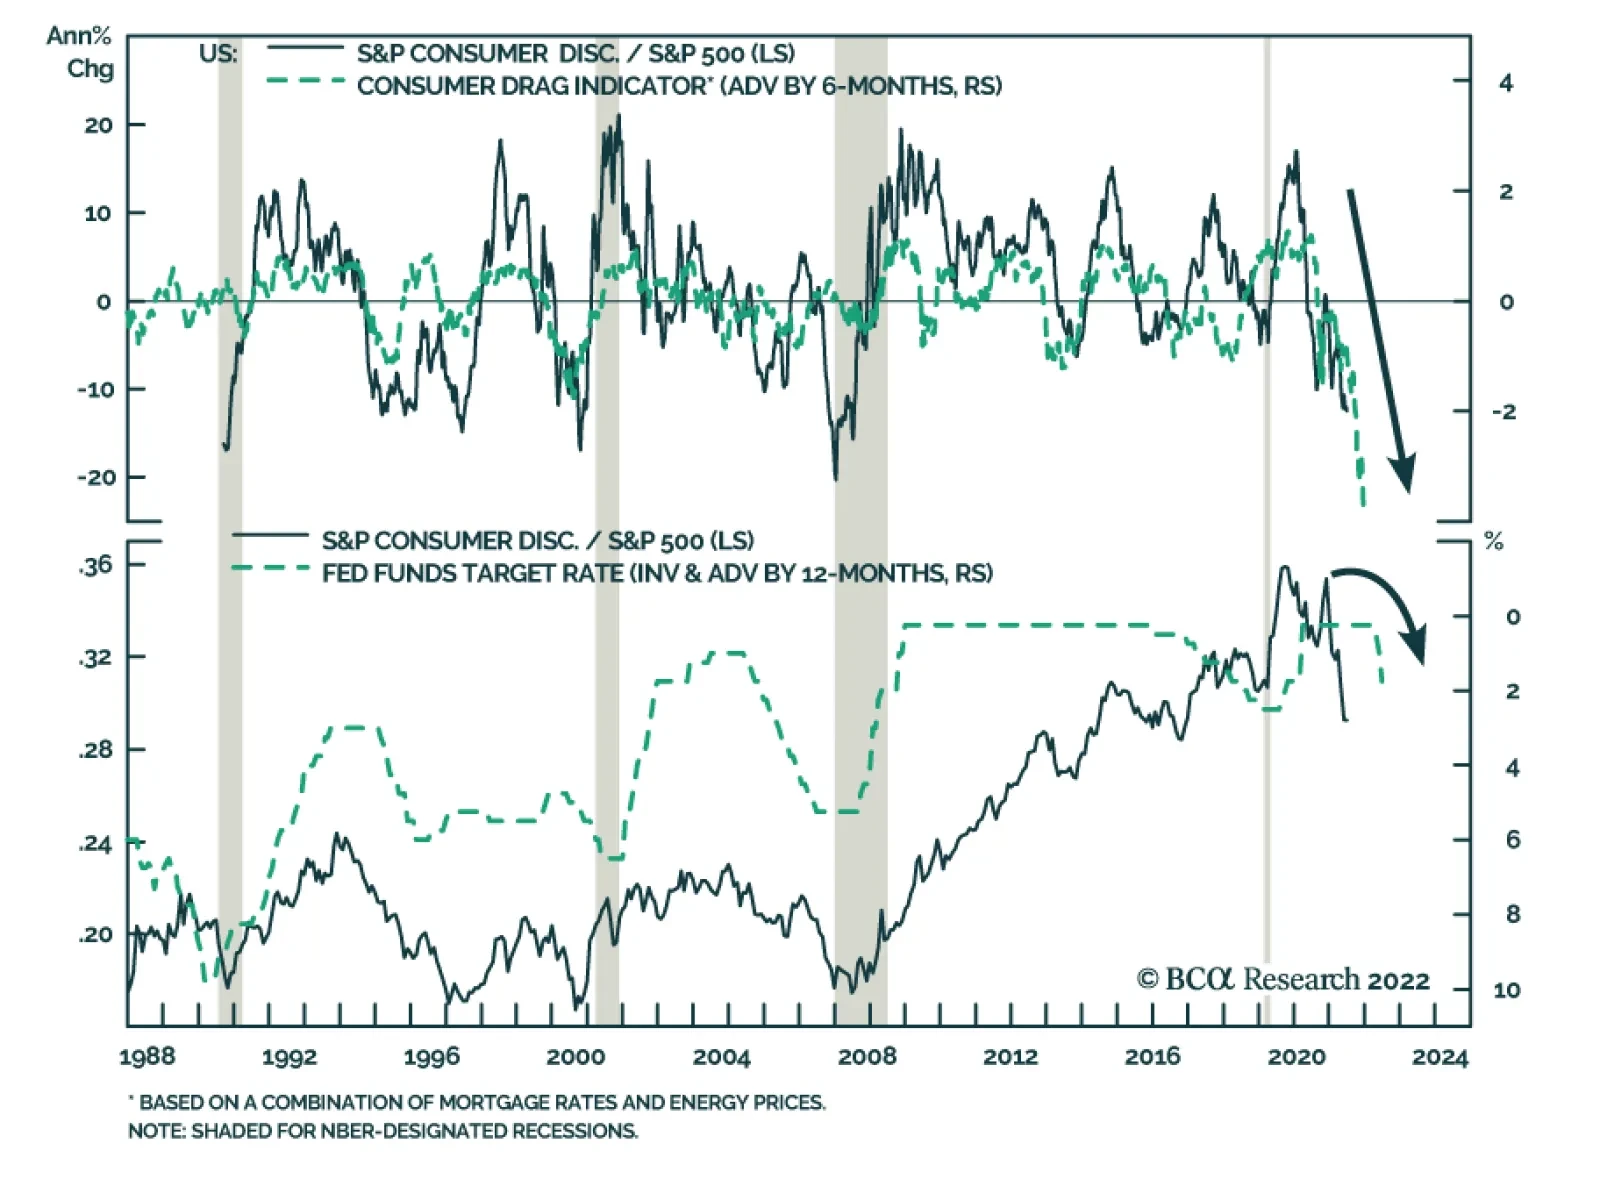
Our US equity team has been among the more cautious within BCA Research. They recently highlighted that they expect persistent inflationary pressures, aggressive monetary tightening, and the withdrawal of liquidity to weigh down on US stocks. Cyclical sectors…