Developed Countries

Highlights Chart 1Are Expectations Too Dovish?
Are Expectations Too Dovish?
Are Expectations Too Dovish?
The dominant market narrative has clearly shifted in the last few days. The primary concern among investors used to be that the Fed had fallen behind the curve on inflation. Now, asset prices are telling us that investors are more worried about an overly hawkish Fed and an increased risk of recession. The shift is evident in bond market prices. The yield curve is now priced for only 176 basis points of rate hikes over the next 12 months and only 90 bps of tightening over the next 24 months (Chart 1). What’s more, long-dated market-based inflation expectations have plunged to below the Fed’s target range (bottom panel). We recommend keeping portfolio duration close to benchmark for now, as bond yields could still have some downside during the next few months as both inflation and economic growth slow. That said, we suspect that the market is now pricing-in an overly dovish Fed tightening path for the next couple of years, a change that may soon warrant a shift back to below-benchmark portfolio duration. Stay tuned. Feature Table 1 Recommended Portfolio Specification Table 2Fixed Income Sector Performance
A Narrative Shift
A Narrative Shift
Investment Grade: Underweight Chart 2Investment Grade Market Overview
Investment Grade Market Overview
Investment Grade Market Overview
Investment grade corporate bonds underperformed the duration-equivalent Treasury index by 168 basis points in June, dragging year-to-date excess returns down to -379 bps. The average index option-adjusted spread widened 28 bps on the month and it currently sits at 158 bps. Similarly, our quality-adjusted 12-month breakeven spread moved up to its 61st percentile since 1995 (Chart 2). A report from a few months ago made the case for why investors should underweight investment grade corporate bonds on a 6-12 month investment horizon.1 The main rationale for this recommendation is that the slope of the Treasury curve is very flat, signaling that we are in the mid-to-late stages of the credit cycle. Corporate bond performance tends to be weak during such periods unless spreads start from very high levels. Despite our underweight 6-12 month investment stance, there’s a good chance that spreads will narrow during the next few months as inflation falls. That said, the persistent removal of monetary accommodation and flatness of the yield curve will limit how much spreads can compress. A recent report dug deeper into the corporate bond space and concluded that investment grade-rated Energy bonds offer exceptional value on a 6-12 month horizon.2 That report also concluded that long maturity investment grade corporates are attractively priced relative to short maturity bonds. Table 3A Corporate Sector Relative Valuation And Recommended Allocation* Table 3BCorporate Sector Risk Vs. Reward*
A Narrative Shift
A Narrative Shift
High-Yield: Neutral Chart 3High-Yield Market Overview
High-Yield Market Overview
High-Yield Market Overview
High-Yield underperformed the duration-equivalent Treasury index by 591 basis points in June, dragging year-to-date excess returns down to -889 bps. The average index option-adjusted spread widened 172 bps on the month to reach 578 bps, 209 bps above the 2017-19 average and 41 bps above the 2018 peak. The 12-month spread-implied default rate – the default rate that is priced into the junk index assuming a 40% recovery rate on defaulted debt and an excess spread of 100 bps – moved higher in June. It currently sits at 8% (Chart 3). As is the case with investment grade, there’s a good chance that high-yield spreads will stage a relief rally in the back half of this year as inflation falls. But due to the flatness of the yield curve, we think it will be difficult for spreads to move below the average seen during the last tightening cycle (2017-19). But even a move back to average 2017-19 levels would equate to roughly 11% of excess return for the junk index if it is realized over a six month period. This potential return is the main reason to prefer high-yield over investment grade in a US bond portfolio. While we maintain a neutral (3 out of 5) allocation to high-yield for now, we would be inclined to downgrade the sector if spreads tighten to the 2017-19 average or if core inflation falls back to 4%.3 MBS: Underweight Chart 4MBS Market Overview
MBS Market Overview
MBS Market Overview
Mortgage-Backed Securities underperformed the duration-equivalent Treasury index by 63 basis points in June, dragging year-to-date excess returns down to -171 bps. We discussed the outlook for Agency MBS in a recent report.4 We noted that MBS’s poor performance in 2021 and early-2022 was driven by duration extension. Fewer homeowners refinanced their loans as mortgage rates rose, and the MBS index’s average duration increased (Chart 4). But now, the index’s duration extension is at its end. The average convexity of the MBS index is close to zero (panel 3), meaning that duration is now insensitive to changes in rates. This is because hardly any homeowners have the incentive to refinance at current mortgage rates (panel 4). The implication is that excess MBS returns will be stronger going forward. That said, we still don’t see enough value in MBS spreads to increase our recommended allocation. The average index spread for conventional 30-year Agency MBS remains close to its lowest level since 2000 (bottom panel). At the coupon level, we observe that low-coupon MBS have much higher duration than high-coupon MBS and that convexity is close to zero for the entire coupon stack. This makes the relative coupon trade a direct play on bond yields. Given that we see some potential for yields to fall during the next six months, we recommend favoring low-coupon MBS (1.5%-2.5%) within an overall underweight allocation to the sector. Emerging Market Bonds (USD): Underweight Chart 5Emerging Markets Overview
Emerging Markets Overview
Emerging Markets Overview
Emerging Market bonds underperformed the duration-equivalent Treasury index by 182 basis points in June, dragging year-to-date excess returns down to -737 bps. EM Sovereigns underperformed the Treasury benchmark by 280 bps on the month, dragging year-to-date excess returns down to -925 bps. The EM Corporate & Quasi-Sovereign Index underperformed by 122 bps, dragging year-to-date excess returns down to -617 bps. The EM Sovereign Index underperformed the duration-equivalent US corporate bond index by 99 bps in June. The yield differential between EM sovereigns and duration-matched US corporates remains negative. Further, the relative performance of EM sovereigns versus US corporates has been tracking the performance of EM currencies versus the dollar and our Emerging Markets Strategy service sees further headwinds for EM currencies in the near term (Chart 5).5 The EM Corporate & Quasi-Sovereign Index outperformed duration-matched US corporates by 1 bp in June. The index continues to offer a significant yield advantage versus duration-matched US corporates (bottom panel), and as such, we continue to recommend a neutral (3 out of 5) allocation to the sector. Municipal Bonds: Overweight Chart 6Municipal Market Overview
Municipal Market Overview
Municipal Market Overview
Municipal bonds underperformed the duration-equivalent Treasury index by 89 basis points in June, dragging year-to-date excess returns down to -167 bps (before adjusting for the tax advantage). We view the municipal bond sector as better placed than most to cope with the recent bout of spread volatility. As we noted in a recent report, state & local government revenue growth has been strong and yet governments have also been slow to hire.6 The result is that net state & local government savings are incredibly high (Chart 6) and it will take some time to deplete these coffers even as economic growth slows and federal fiscal thrust turns to drag. On the valuation front, munis have cheapened up relative to both Treasuries and corporates during the past few months. The 10-year Aaa Muni / Treasury yield ratio is currently 94%, up significantly from its 2021 trough of 55%. The yield ratio between 12-17 year munis and duration-matched corporate bonds is also up significantly off its lows (panel 2). We reiterate our overweight allocation to municipal bonds within US fixed income portfolios, and we continue to have a strong preference for long-maturity munis. The yield ratio between 17-year+ General Obligation Municipal bonds and duration-matched US corporates is 92%. The same measure for 17-year+ Revenue bonds stands at 97%, just below parity even without considering municipal debt’s tax advantage. Treasury Curve: Buy 5-Year Bullet Versus 2/10 Barbell Chart 7Treasury Yield Curve Overview
Treasury Yield Curve Overview
Treasury Yield Curve Overview
The Treasury curve bear-flattened in June. The 2-year/10-year Treasury slope flattened 26 bps on the month and the 5-year/30-year slope flattened 13 bps. The 2/10 and 5/30 slopes now stand at 4 bps and 23 bps, respectively. In a recent Special Report we noted the unusually large divergence between flat slopes at the long end of the curve and steep slopes at the front end.7 This divergence has narrowed in recent weeks, but it remains wide by historical standards. For example, the 5-year/10-year Treasury slope is currently 0 bps while the 3-month/5-year slope is 122 bps. The divergence is happening because the market moved quickly to price-in a rapid near-term pace of rate hikes, but the Fed has only delivered 150 bps of tightening so far and this is holding down the very front-end of the curve. The oddly shaped curve presents us with an excellent trading opportunity. Specifically, we recommend buying the 5-year Treasury note versus a duration-matched barbell consisting of the 2-year and 10-year notes. The 5 over 2/10 butterfly spread has narrowed during the past month, but the trade continues to look attractive on our model (Chart 7). We also continue to recommend a position long the 20-year bullet versus a duration-matched 10/30 barbell as an attractive carry trade. TIPS: Underweight Chart 8TIPS Market Overview
TIPS Market Overview
TIPS Market Overview
TIPS underperformed the duration-equivalent nominal Treasury index by 246 basis points in June, dragging year-to-date excess returns down to -14 bps. The 10-year TIPS breakeven inflation rate fell 31 bps on the month, landing back inside the Fed’s 2.3% - 2.5% comfort zone (Chart 8). Consistently, our TIPS Breakeven Valuation Indicator is drifting toward neutral territory, signaling that TIPS are becoming less expensive (panel 2). At the front-end of the yield curve, the 2-year TIPS breakeven inflation rate fell 57 bps in June – from 3.86% to 3.29% - and the 2-year TIPS yield rose 96 bps – from -1.33% to -0.37% (bottom 2 panels). The large drop in short-maturity breakevens is the result of increasing investor conviction that inflation has indeed peaked. In a recent report we made the case that core CPI inflation can fall to a range of 4%-5% (from its current 6.0% rate) without the Fed needing to cause a recession. We also argued that a recession will be required to push inflation from 4% back down to 2%.8 The upshot for bond investors is that TIPS breakeven inflation rates will drop further as core inflation rolls over. This will be particularly true at the front-end of the yield curve. We also noted in last week’s report that Fed policymakers have increasingly indicated a desire for positive real yields across the entire curve.9 This tells us that investors should continue to short 2-year TIPS, targeting a positive real 2-year yield. ABS: Overweight Chart 9ABS Market Overview
ABS Market Overview
ABS Market Overview
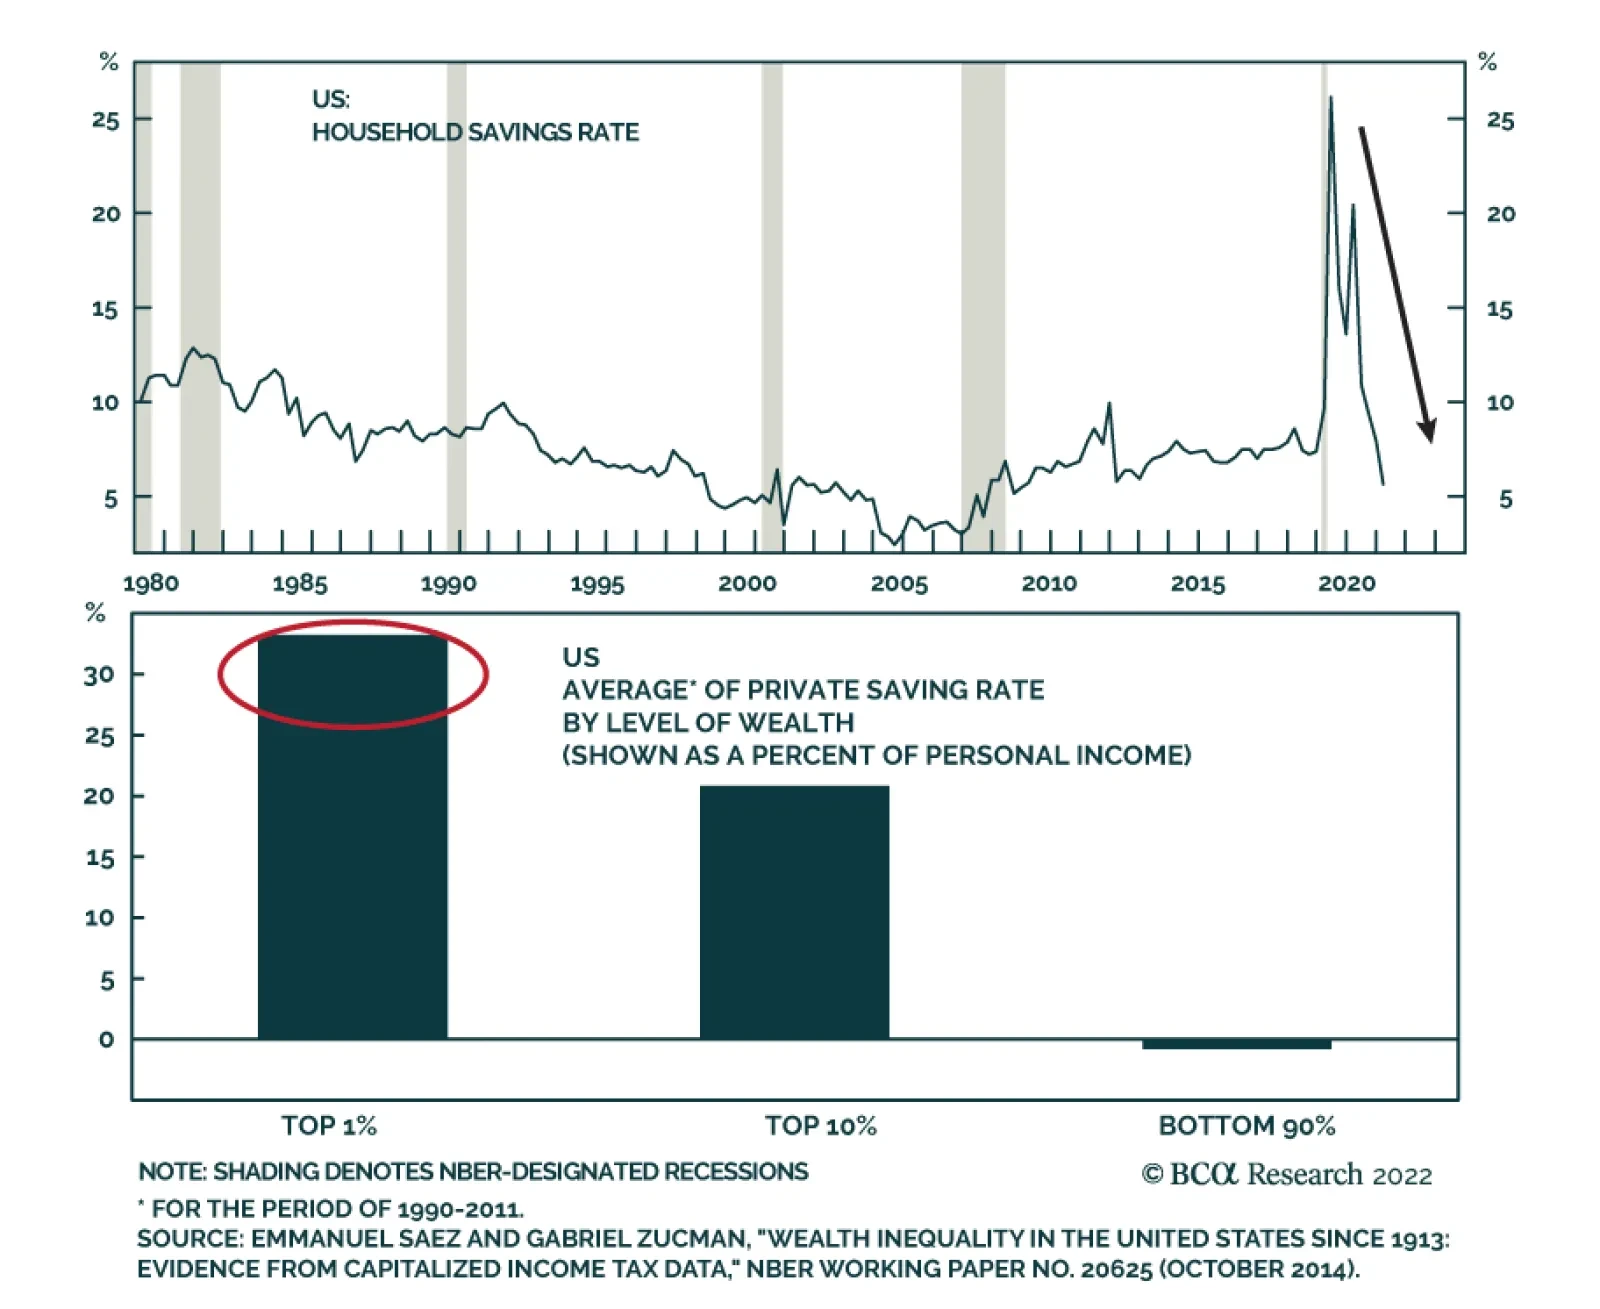
Asset-Backed Securities outperformed the duration-equivalent Treasury index by 21 basis points in June, bringing year-to-date excess returns up to -42 bps. Aaa-rated ABS outperformed by 25 bps on the month, bringing year-to-date excess returns up to -33 bps. Non-Aaa ABS underperformed by 5 bps on the month, dragging year-to-date excess returns down to -93 bps. During the past two years, substantial federal government support for household incomes caused US households to build up an extremely large buffer of excess savings. Nowhere is this more evident than in the steep drop in the amount of outstanding credit card debt that was witnessed in 2020 and 2021 (Chart 9). In 2022, consumers have started to re-lever. The personal savings rate was just 5.4% in May and the amount of outstanding credit card debt has recovered to its pre-COVID level (bottom panel). But while household balance sheets are starting to deteriorate, they remain exceptionally strong in level terms. In other words, it will be some time before we see enough deterioration to cause a meaningful uptick in consumer credit delinquencies. Investors should remain overweight consumer ABS and should take advantage of the high quality of household balance sheets by moving down the quality spectrum, favoring non-Aaa rated securities over Aaa-rated ones. Non-Agency CMBS: Overweight Chart 10CMBS Market Overview
CMBS Market Overview
CMBS Market Overview
Non-Agency Commercial Mortgage-Backed Securities underperformed the duration-equivalent Treasury index by 5 basis points in June, dragging year-to-date excess returns down to -194 bps. Aaa Non-Agency CMBS outperformed Treasuries by 12 bps on the month, bringing year-to-date excess returns up to -141 bps. Non-Aaa Non-Agency CMBS underperformed by 52 bps on the month, dragging year-to-date excess returns down to -340 bps. CMBS spreads remain wide compared to other similarly risky spread products and are currently slightly above their historic averages (Chart 10). Meanwhile, weak commercial real estate (CRE) investment continues to drive strong CRE price appreciation (panel 4). Agency CMBS: Overweight Agency CMBS outperformed the duration-equivalent Treasury index by 32 basis points in June, bringing year-to-date excess returns up to 9 bps. The average index option-adjusted spread tightened 3 bps on the month. It currently sits at 47 bps, close to its long-term average (bottom panel). Agency CMBS spreads also continue to look attractive compared to other similarly risky spread products. Stay overweight. Appendix A: The Golden Rule Of Bond Investing We follow a two-step process to formulate recommendations for bond portfolio duration. First, we determine the change in the federal funds rate that is priced into the yield curve for the next 12 months. Second, we decide – based on our assessments of the economy and Fed policy – whether the change in the fed funds rate will exceed or fall short of what is priced into the curve. Most of the time, a correct answer to this question leads to the appropriate duration call. We call this framework the Golden Rule Of Bond Investing, and we demonstrated its effectiveness in the US Bond Strategy Special Report, “The Golden Rule Of Bond Investing”, dated July 24, 2018. Chart 11 illustrates the Golden Rule’s track record by showing that the Bloomberg Barclays Treasury Master Index tends to outperform cash when rate hikes fall short of 12-month expectations, and vice-versa. Chart 11The Golden Rule's Track Record
The Golden Rule's Track Record
The Golden Rule's Track Record
At present, the market is priced for 176 basis points of rate hikes during the next 12 months. We can also use our Golden Rule framework to make 12-month total return and excess return forecasts for the Bloomberg Barclays Treasury index under different scenarios for the fed funds rate. Excess returns are relative to the Bloomberg Barclays Cash index. To forecast total returns we first calculate the 12-month fed funds rate surprise in each scenario by comparing the assumed change in the fed funds rate to the current value of our 12-month discounter. This rate hike surprise is then mapped to an expected change in the Treasury index yield using a regression based on the historical relationship between those two variables. Finally, we apply the expected change in index yield to the current characteristics (yield, duration and convexity) of the Treasury index to estimate total returns on a 12-month horizon. The below tables present those results, along with excess returns for a front-loaded and a back-loaded rate hike scenario. Excess returns are calculated by subtracting assumed cash returns in each scenario from our total return projections.
A Narrative Shift
A Narrative Shift
Appendix B: Butterfly Strategy Valuations The following tables present the current read-outs from our butterfly spread models. We use these models to identify opportunities to take duration-neutral positions across the Treasury curve. The following two Special Reports explain the models in more detail: US Bond Strategy Special Report, “Bullets, Barbells And Butterflies”, dated July 25, 2017, available at usbs.bcaresearch.com US Bond Strategy Special Report, “More Bullets, Barbells And Butterflies”, dated May 15, 2018, available at usbs.bcaresearch.com Table 4 shows the raw residuals from each model. A positive value indicates that the bullet is cheap relative to the duration-matched barbell. A negative value indicates that the barbell is cheap relative to the bullet. Table 4Butterfly Strategy Valuation: Raw Residuals In Basis Points (As Of June 30, 2022)
A Narrative Shift
A Narrative Shift
Table 5 scales the raw residuals in Table 4 by their historical means and standard deviations. This facilitates comparison between the different butterfly spreads. Table 5Butterfly Strategy Valuation: Standardized Residuals (As Of June 30, 2022)
A Narrative Shift
A Narrative Shift
Table 6 flips the models on their heads. It shows the change in the slope between the two barbell maturities that must be realized during the next six months to make returns between the bullet and barbell equal. For example, a reading of -9 bps in the 5 over 2/10 cell means that we would expect the 5-year to outperform the 2/10 if the 2/10 slope flattens by less than 9 bps during the next six months. Otherwise, we would expect the 2/10 barbell to outperform the 5-year bullet. Table 6Discounted Slope Change During Next 6 Months (BPs)
A Narrative Shift
A Narrative Shift
Appendix C: Excess Return Bond Map The Excess Return Bond Map is used to assess the relative risk/reward trade-off between different sectors of the US bond market. It is a purely computational exercise and does not impose any macroeconomic view. The Map’s vertical axis shows 12-month expected excess returns. These are proxied by each sector’s option-adjusted spread. Sectors plotting further toward the top of the Map have higher expected returns and vice-versa. Our novel risk measure called the “Risk Of Losing 100 bps” is shown on the Map’s horizontal axis. To calculate it, we first compute the spread widening required on a 12-month horizon for each sector to lose 100 bps or more relative to a duration-matched position in Treasury securities. Then, we divide that amount of spread widening by each sector’s historical spread volatility. The end result is the number of standard deviations of 12-month spread widening required for each sector to lose 100 bps or more versus a position in Treasuries. Lower risk sectors plot further to the right of the Map, and higher risk sectors plot further to the left. Chart 12Excess Return Bond Map (As Of June 30, 2022)
A Narrative Shift
A Narrative Shift
Ryan Swift US Bond Strategist rswift@bcaresearch.com Footnotes 1 Please see US Bond Strategy / Global Fixed Income Strategy Special Report, “Turning Defensive On US Corporate Bonds”, dated April 12, 2022. 2 Please see US Bond Strategy / Global Fixed Income Strategy Special Report, “Looking For Opportunities In US & European Corporates After The Recent Selloff”, dated May 31, 2022. 3 For more details on this call please see US Bond Strategy Weekly Report, “When The Dual Mandates Clash”, dated June 28, 2022. 4 Please see US Bond Strategy Weekly Report, “The Bond Market Implications Of A 5% Mortgage Rate”, dated April 26, 2022. 5 Please see Emerging Markets Strategy Charts That Matter, “Beware Of Another Downleg In Risk Assets”, dated June 30, 2022. 6 Please see US Bond Strategy Weekly Report, “Echoes Of 2018”, dated May 24, 2022. 7 Please see US Bond Strategy / US Investment Strategy / US Equity Strategy Special Report, “The Yield Curve As An Indicator”, dated March 29, 2022. 8 Please see US Bond Strategy Weekly Report, “No End In Sight For Fed Tightening”, dated June 21, 2022. 9 Please see US Bond Strategy Weekly Report, “When Dual Mandates Clash”, dated June 28, 2022. Recommended Portfolio Specification Other Recommendations Treasury Index Returns Spread Product Returns
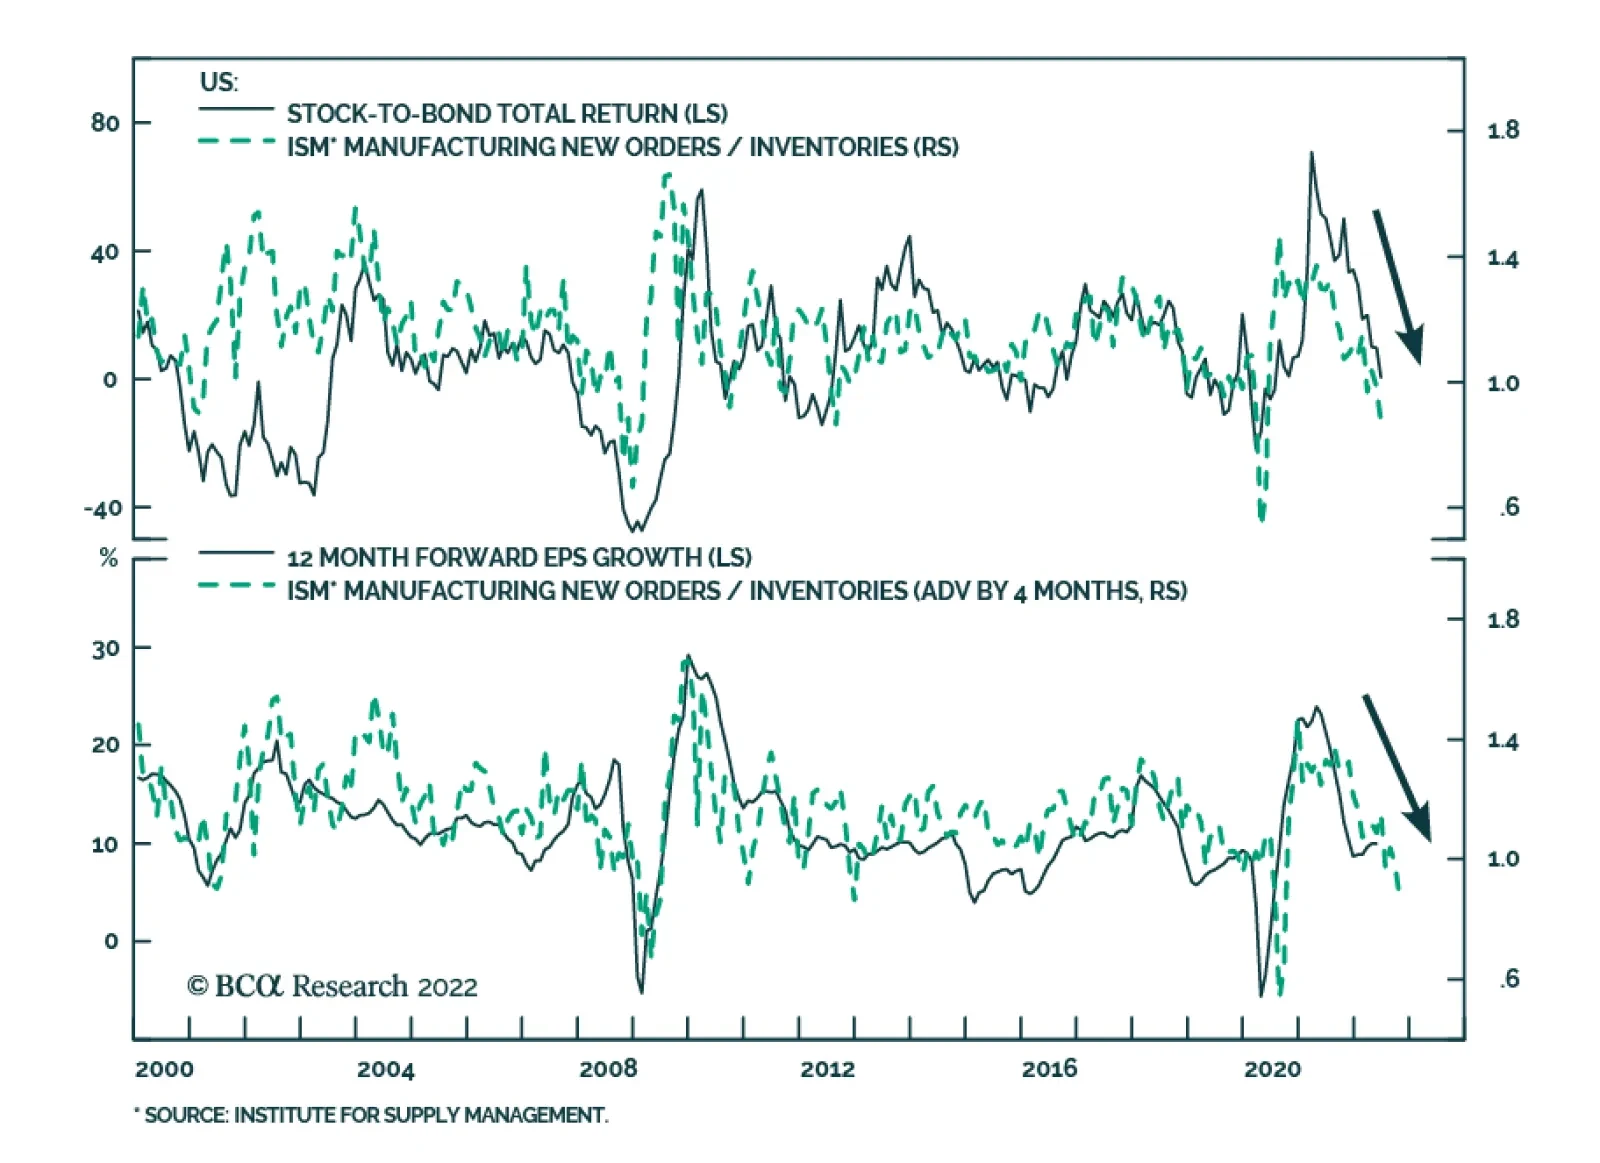
The ISM Manufacturing PMI painted a bleak picture of the US manufacturing sector in June. The headline index dropped 3.1 points to 53.0 and fell short of expectations of 54.5. Moreover, new orders dropped 5.9 points to contractionary territory of 49.2, the…
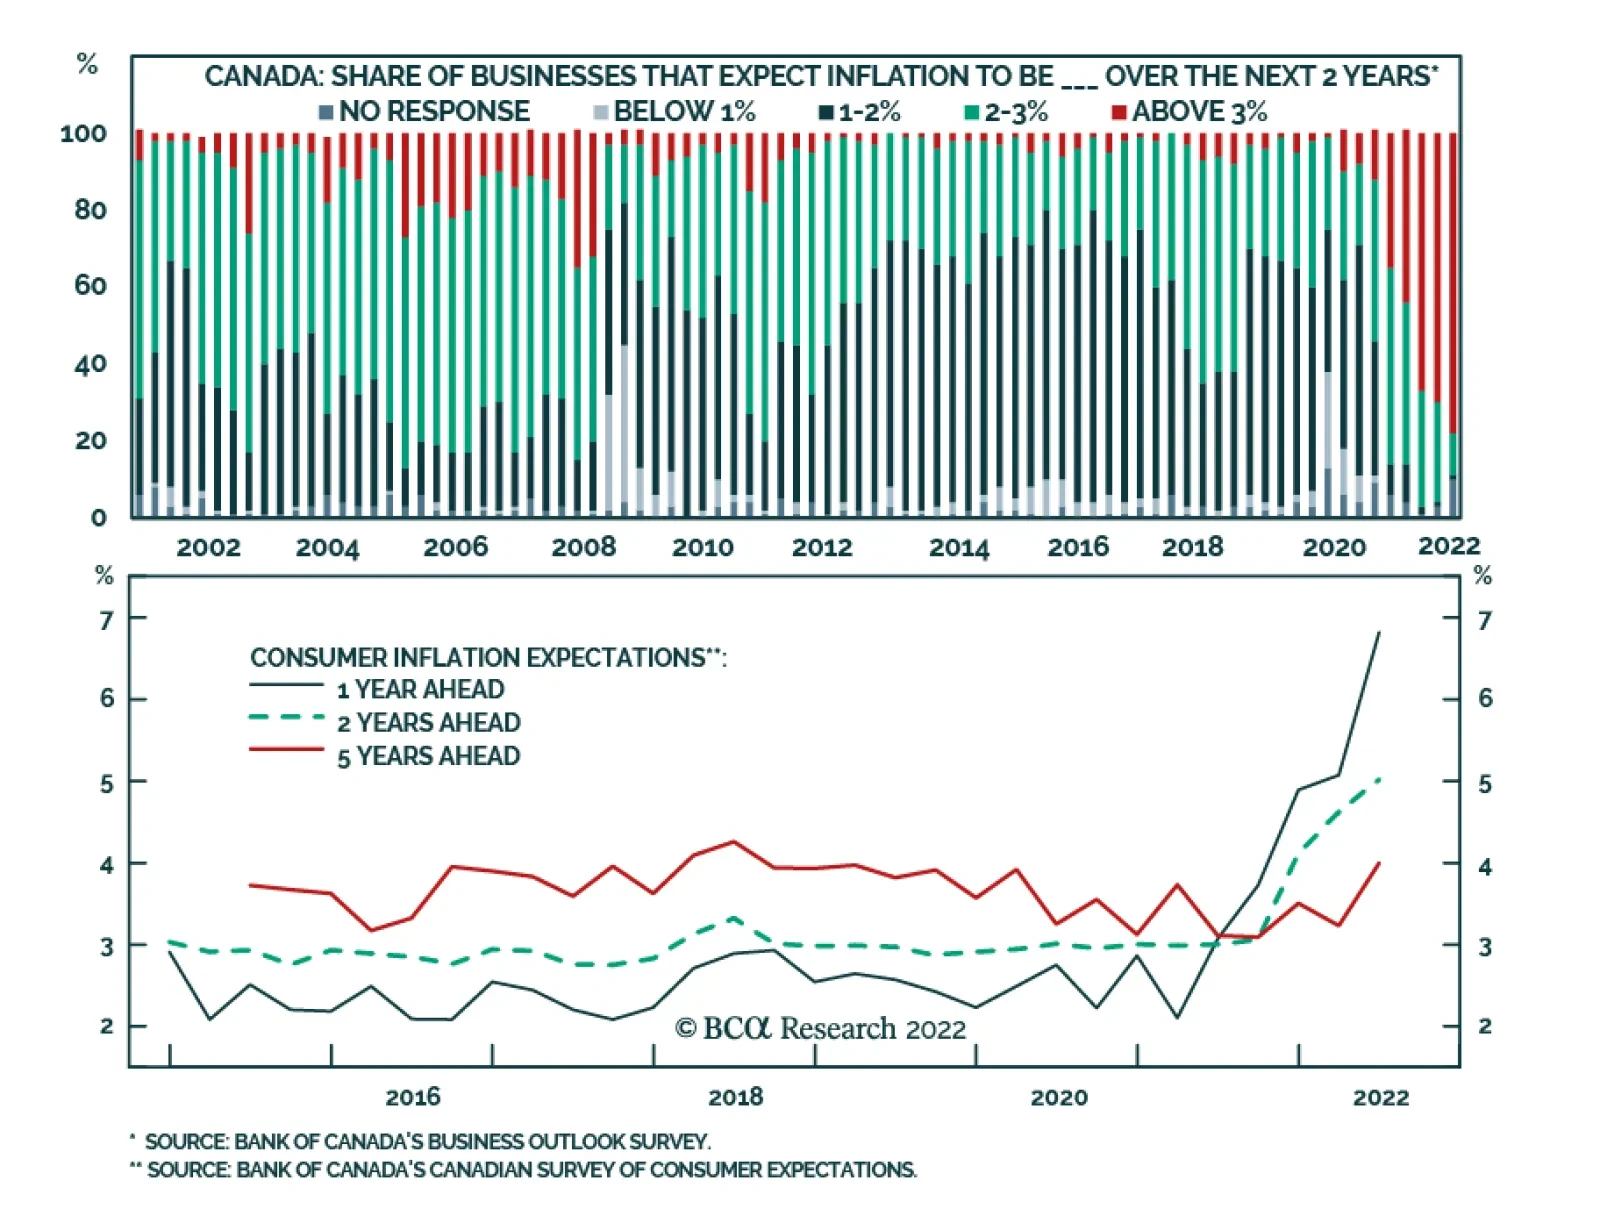
The Bank of Canada’s Q2 Business Outlook Survey reveals that businesses expect intense price pressures to persist. The share of surveyed firms that expect input prices to increase significantly over the coming 12 months remains unchanged at 47% while those…
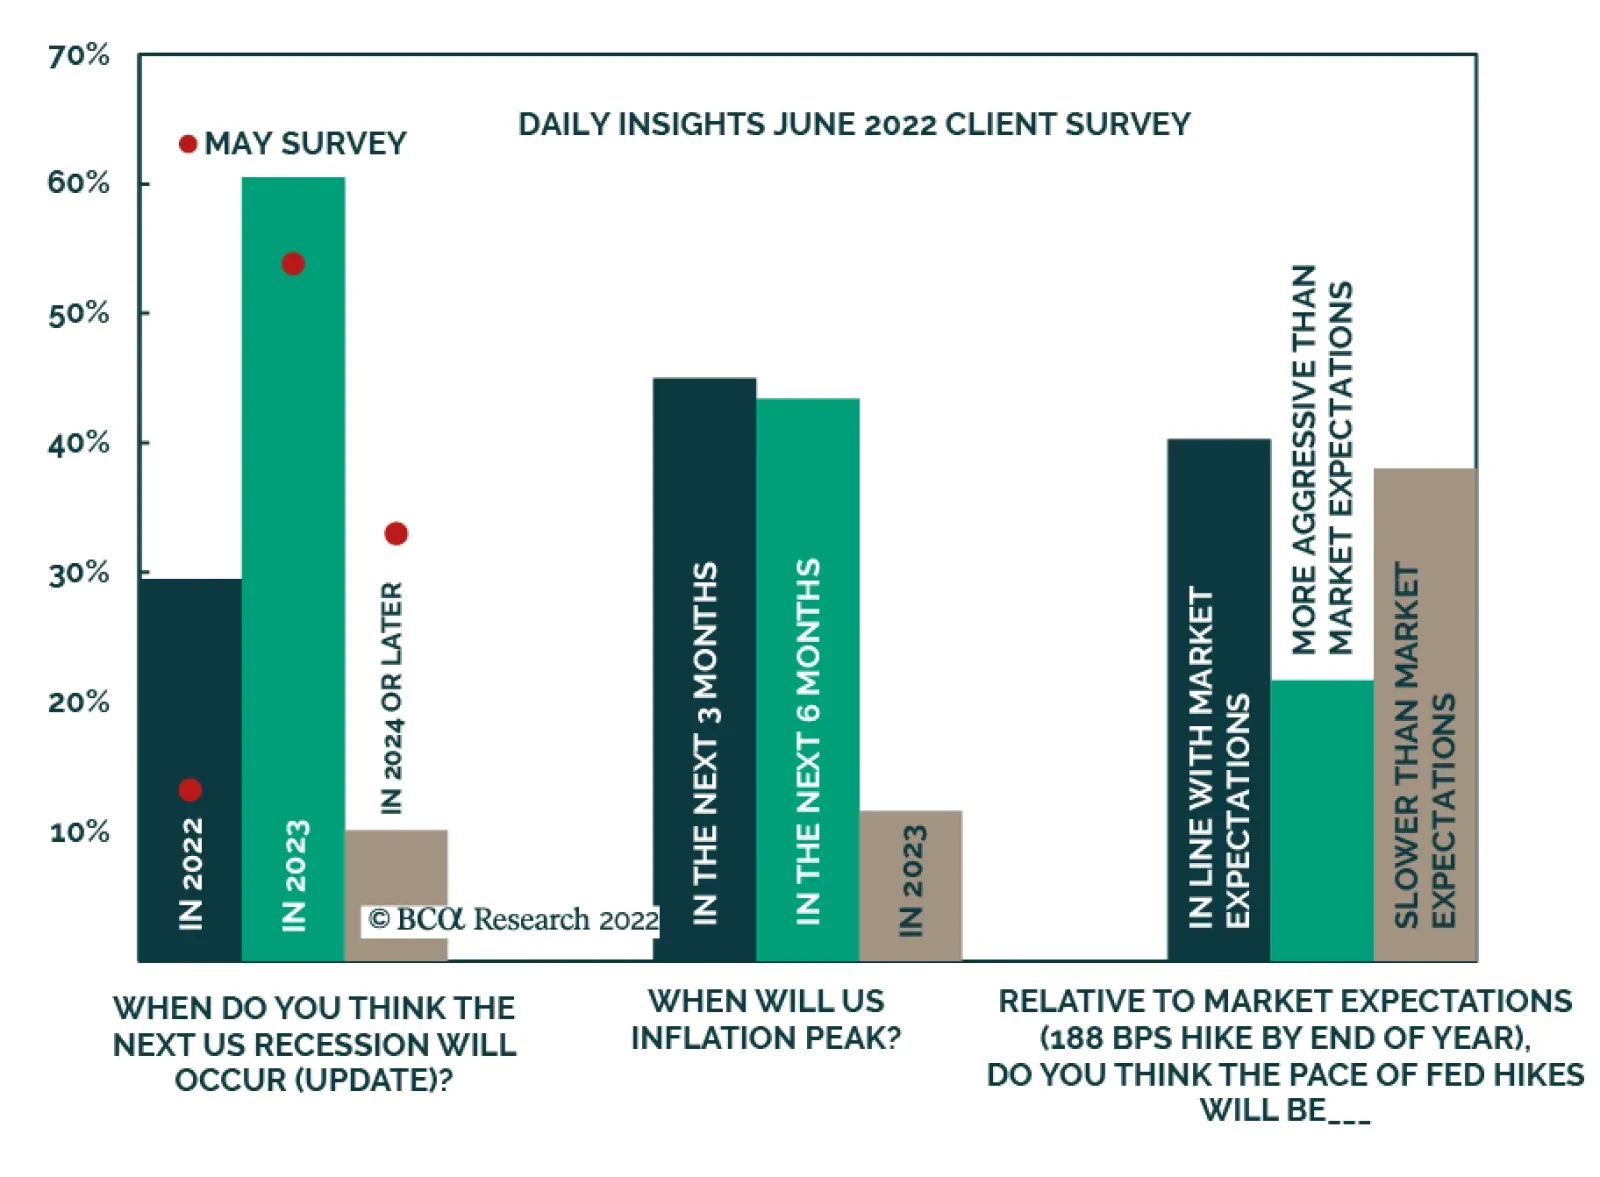
Given the more aggressive pace of Fed tightening in June (in light of hotter-than-expected CPI inflation and preliminary long-dated consumer inflation expectations from the University of Michigan survey), we asked our readers for updated expectations…
According to BCA Research’s European Investment Strategy service, the risk-reward ratio over the coming twelve months leans increasingly in favor of European risk assets. The EURO STOXX 50 has plunged 22% from its January 5th high, the euro is down to 1.04…
Executive Summary Financial markets have buckled under the weight of 40-year highs in inflation that have forced the Fed and other major central banks to promise no quarter in their fight against inflation, spooking investors with visions of Volcker-like monetary policy. Well-anchored long-run inflation expectations suggest that the Fed may not have to throttle the economy before the year is out to achieve “clear and convincing evidence” that inflation is trending lower. The labor market may be in a sweet spot in which jobs are plentiful, but workers lack the leverage to drive compensation high enough to initiate a wage-price spiral. Corporate earnings may be more resilient than many investors fear. An earnings recession is not inevitable, as S&P 500 earnings have grown at a robust rate when year-over-year consumer prices have risen between 3.5 and 7%. Not As Bad As We First Thought
Not As Bad As We First Thought
Not As Bad As We First Thought
Bottom Line: A once-in-a-century global pandemic, unprecedented fiscal and monetary policy responses and war have produced an especially uncertain macroeconomic backdrop. We acknowledge that financial markets could go either way, but we think the bearish consensus presents an opportunity to outperform by overweighting risk assets over the next twelve months. Feature 2022 has been a gloomy year for the economy and financial assets of all stripes. The reckoning from the excessive monetary and fiscal stimulus that allowed the economy to come through the pandemic mostly unscathed while fueling the greatest eight-quarter stretch of real household net worth gains on record, arrived ahead of schedule, hurried along by war in eastern Europe. Russia’s invasion of Ukraine took a bite out of global grain and energy supplies, sending the prices of select commodities soaring and contributing to the worst developed-nation inflation in four decades. Global equity and bond markets have been upended by apprehension over just how forcefully the Fed and other central banks will have to squeeze their economies to keep inflation from taking lasting root. No investor should take the Fed lightly, but the sense of gloom pervading general media, financial media, Wall Street broker-dealers, our clients and their clients is at risk of going a little too far if it hasn’t already. This is a fraught moment, and the uncertainty is heightened by the unprecedented events of the last two years, but we perceive the backdrop as far more mixed than it’s being made out to be. As a result, we think there’s much more potential for positive surprises over the next year than most investors perceive. To give clients a chance to see it our way, we are getting out of the way. This week’s report belongs to the charts and we present them with a minimum of commentary. We do not know how things will turn out – the backdrop is unprecedented and leaves all of us to find our way without historical antecedents to guide us – and we are approaching our job with elevated humility and lower-than-normal conviction. We have been advising clients to be prepared to shorten the holding periods of their positions just as we are prepared to change our mind swiftly if incoming data fail to validate our view. For now, however, we continue to believe that the potential for positive surprises is greater than market pricing acknowledges and we recommend overweighting equities in multi-asset portfolios over the next twelve months. Doug Peta, CFA Chief US Investment Strategist dougp@bcaresearch.com Chart 1Omicron Has Produced A Lot Of Infections,...
Omicron Has Produced A Lot Of Infections,...
Omicron Has Produced A Lot Of Infections,...
Chart 2... But They've Been Decidedly Less Serious
... But They've Been Decidedly Less Serious
... But They've Been Decidedly Less Serious
Chart 3Core Inflation Will Cool As Demand Shifts To Services, ...
Core Inflation Will Cool As Demand Shifts To Services, ...
Core Inflation Will Cool As Demand Shifts To Services, ...
Chart 4...And Households Maintain Their Discipline
...And Households Maintain Their Discipline
...And Households Maintain Their Discipline
Table 1The Term Structure Of Inflation Expectations …
Chartbook
Chartbook
Chart 5… Remains Comfortably Inverted
Chartbook
Chartbook
Chart 6Households See It Like Investors ...
Households See It Like Investors ...
Households See It Like Investors ...
Chart 7... For Now, Anyway
... For Now, Anyway
... For Now, Anyway
Chart 8Real Wages Have Been Falling For A Year And A Half ...
Real Wages Have Been Falling For A Year And A Half ...
Real Wages Have Been Falling For A Year And A Half ...
Chart 9... As Workers Are At The Bottom Of A Steep Structural Hill
... As Workers Are At The Bottom Of A Steep Structural Hill
... As Workers Are At The Bottom Of A Steep Structural Hill
Table 2Excess Savings Provide A Cushion Against Rising Food And Fuel Costs
Chartbook
Chartbook
Chart 10High-End Households Have Had A Good Pandemic, Too
High-End Households Have Had A Good Pandemic, Too
High-End Households Have Had A Good Pandemic, Too
Chart 11Businesses Haven't Taken Down The Help Wanted Signs ...
Businesses Haven't Taken Down The Help Wanted Signs ...
Businesses Haven't Taken Down The Help Wanted Signs ...
Chart 12... And There's No Lack Of Supply To Fill The Positions
... And There's No Lack Of Supply To Fill The Positions
... And There's No Lack Of Supply To Fill The Positions
Table 3Inflation Isn’t So Bad For Nominal Earnings …
Chartbook
Chartbook
Chart 13... And Companies May Be Re-Learning That Now
... And Companies May Be Re-Learning That Now
... And Companies May Be Re-Learning That Now
Chart 14Originators Have Lent To Good Borrowers …
Chartbook
Chartbook
Chart 15... On Proper Terms This Time Around
... On Proper Terms This Time Around
... On Proper Terms This Time Around
Footnotes
Listen to a short summary of this report. Executive Summary A Tremendous Inflow Into US Government Bonds
A Tremendous Inflow Into US Government Bonds
A Tremendous Inflow Into US Government Bonds
Multiple frameworks exist for managing currencies. These include forecasting growth differentials, watching central banks, gauging terms of trade and balance of payment dynamics or even assigning a probability to the occurrence of black swans. For us, the most useful tool has been to simply track portfolio flows. In today’s paradigm, portfolio flows into US equities are rapidly dwindling, while those flowing into fixed income have picked up meaningfully. Gauging what happens next will be critical for the dollar call (Feature chart). The Fed is being viewed as the most credible central bank to curb inflation. As a result, US rates have risen more than in other markets. This has also pushed valuation and sentiment of the dollar to very elevated levels. If inflation peaks and the world economy achieves a soft landing, downside in the dollar will be substantial. On sentiment, being a contrarian can make you a victim, but when the stars are aligned where valuation, sentiment and the appropriate macro analysis point towards a single direction, our framework proves extremely useful. In a nutshell, many currencies, especially the euro, are already pricing in a nasty recession into their respective economies. If a recession does occur, they could undershoot. If one does not, they are poised for a coiled spring rebound. Bottom Line: Tactical investors should be neutral to overweight the dollar in the near term, as the probability of a recession rises. Longer-term investors should be slowly accumulating assets in countries where fundamentals make sense, and their currencies are deeply undervalued. Feature The real neutral rate of interest in the US is difficult to estimate ex ante, but Chart 1 highlights that the real Fed Funds rate is well below many estimates of neutral. In a world where inflation has become a widespread problem, and a few economies (like the US) are overheating, markets have moved to test the credibility of their respective central banks. The consensus has been that the Federal Reserve will be the most credible in taming runaway inflation by being able to raise rates faster than other central banks (Chart 2). This is especially the case as many European economies remain at firing range from the Russia-Ukraine conflict and, as such, face more supply-side driven inflation. Chart 1The Fed Has Scope To Tighten Further
The Fed Has Scope To Tighten Further
The Fed Has Scope To Tighten Further
Chart 2Interest Rates Have Moved In Favor Of The Dollar
Interest Rates Have Moved In Favor Of The Dollar
Interest Rates Have Moved In Favor Of The Dollar
The typical pattern for the dollar is that it tends to rise when growth is falling and inflation is also subsiding, which triggers tremendous haven flows into US Treasurys. Right now, inflation remains strong but growth is rolling over, which has historically painted a mixed picture for the dollar (Chart 3). Chart 3The Dollar Rises On Falling Growth
A Lens For Managing Currencies In Today’s Paradigm
A Lens For Managing Currencies In Today’s Paradigm
What happens next is critical. The dollar tends to rise 10%-15% during downturns. We are already there. The DXY index is up 8.8% this year, and up 16.3% from the trough last year. European currencies like the SEK and the EUR have already priced in a recession as deep as in 2020. If this indeed proves to be the case, commodity currencies will be next, which could push the DXY to fresh highs. But as we outline below, even in a pessimistic scenario, a systematic approach to looking at currencies warns against fresh bets in favor of the dollar. Inflation And Central Banks One of the key themes we outlined in our outlook for this year is that inflation is a global problem, and not centric to the US. So, while supply side factors have had an outsized effect on energy deficient countries like Germany, the UK, Sweden and, to an extent Japan, inflation is also well above target in Canada, Australia, Norway, New Zealand, and many other developed and emerging market countries. In fact, the inflation impulse is slowing in the US, relative to a basket of G10 countries (Chart 4). Related Report Foreign Exchange StrategyLessons From Fed Interest Rate Hikes Falling inflation will be a welcome relief valve from the tension in markets over much tighter financial conditions. It will also lower the probability of a global recession. For currency markets however, the starting point is that the market has priced the Fed to continue leading the tightening cycle until something breaks. If inflation does subside, then hawkish expectations by the Fed will be heavily priced out of the curve, which will remove a key source of support for the greenback. From a chartist point of view, the dollar has already overshot the level of rates the markets expect from the Fed, relative to more dovish central banks (Chart 5). This suggests a hefty safety premium is already embedded in the dollar. Chart 4US Inflation Is Peaking, Relative To Other ##br##Economies
US Inflation Is Peaking, Relative To Other Economies
US Inflation Is Peaking, Relative To Other Economies
Chart 5The Dollar Has Overshot The Path Implied By Interest Rates
The Dollar Has Overshot The Path Implied By Interest Rates
The Dollar Has Overshot The Path Implied By Interest Rates
The Dollar And Global Growth If the Fed and other central banks tame the inflation genie, then we will have achieved a soft landing. The dollar has tended to track the path of the US yield curve, and a flattening usually underscores longer-term worries about a recession (Chart 6). A steepening curve will signal mission accomplished. In the view of the Foreign Exchange Strategy service, recession risks could be relatively balanced. While major central banks have been tightening policy (the US and most of the G10), China, a big whale in terms of its monetary policy impact, has been easing monetary conditions. Chart 7 highlights that most procyclical currencies have tracked the Chinese credit impulse tick for tick. Bond yields in China are near the lows for the year. Unless China enters another economic down-leg in growth that matches the 2015 slowdown, we might just witness a rotation in economic vigor from the US towards other economies, led by China, allowing the world to achieve a soft landing. Chart 6The Dollar Is Tracking The US Yield ##br##Curve
The Dollar Is Tracking The US Yield Curve
The Dollar Is Tracking The US Yield Curve
Chart 7Commodity Currencies Are Tracking The Chinese Credit Impulse
Commodity Currencies Are Tracking The Chinese Credit Impulse
Commodity Currencies Are Tracking The Chinese Credit Impulse
In the currency world, typical recessionary indicators are not yet flashing red. Cross-currency basis swaps remain well contained, suggesting dollar funding pressures, or that the ability to service dollar debt abroad remains healthy. The Fed’s liquidity swap lines, which allow foreign central banks to obtain dollar funding, also remain untapped (Chart 8). That said, currency put-call ratios are rising, suggesting the cost of obtaining downside protection has increased. Chart 8The Fed"s Recession Models Are Still Sanguine
The Fed"s Recession Models Are Still Sanguine
The Fed"s Recession Models Are Still Sanguine
The Dollar And Portfolio Flows Aside from hedging against downside protection for the EUR, the AUD or even the CAD, one driver of dollar strength has been huge portfolio inflows into US Treasurys (Chart 9). That has occurred while equity inflows have collapsed. Admittedly, this took us by surprise since by monitoring the big Treasury whales (Japan and China), holdings have been rolling over for quite some time (Chart 10). This has also occurred amidst an accumulation of speculative short positions on US Treasurys. Chart 9A Tremendous Inflow Into US Government Bonds
A Tremendous Inflow Into US Government Bonds
A Tremendous Inflow Into US Government Bonds
Chart 10Japan And China Remain Treasury Sellers
Japan And China Remain Treasury Sellers
Japan And China Remain Treasury Sellers
Historically, bond inflows are the driver of portfolio flows into the US, but the equity market has also dictated the trend in the dollar from time to time. Overall, the basic balance in the US, sum of all portfolio flows, has done a good job capturing turning points in the dollar. Our focus on equity flows this time around is due to the conundrum the US faces. Relative profits tend to drive the performance of relative stock prices, and US profits tend to be more defensive – rising on a relative basis when bond yields and commodity prices are collapsing and falling otherwise (Chart 11). As such, the rise in bond yields has already derated US equity multiples but profits have held up remarkably well. An underperformance in US equities during a downturn has been unprecedented with a strong dollar since the end of the Bretton Woods system. So should a market shakeout lead to a violent rotation out of US equities, the profile for the dollar could be a mirror image of what we witnessed in 2008 or even 2020. The conundrum for bond inflows is that according to traditional measures, real rates in the US remain deeply negative, but they have improved significantly under the lens of market-based measures (Chart 12). This partly explains the dollar overshoot. A scenario of faster growth outside the US could see real rates improve more quickly abroad. Chart 11US Profits Have Held Up Remarkably Well
US Profits Have Held Up Remarkably Well
US Profits Have Held Up Remarkably Well
Chart 12Market-Based Real Yields In The US Have Improved
A Lens For Managing Currencies In Today’s Paradigm
A Lens For Managing Currencies In Today’s Paradigm
A final point: managing currencies is about anticipating the next macroeconomic driver. In our view, this could be fears about balance of payments dynamics, especially as the world becomes marginally less globalized. Since the 1980s, we have never had a configuration where the dollar is very overvalued, US real rates are extremely low, and the trade deficit is near a record high (meaning it needs to be financed externally). A bet on US exceptionalism has a natural limit, as competitiveness abroad is improving tremendously vis-à-vis many of the goods and services the US exports. Currencies And Valuations Currencies should revert to fair value. The question then becomes "which fair value should they mean-revert to?" In our view, simple works best – purchasing power parity values. A simple chart shows that selling the dollar when it is expensive and buying it when cheap according to its purchasing power generates alpha over the long term (Chart 13). In A Simple Trading Rule For FX Valuation Enthusiasts, we showed that a shorter-term trading strategy also based on valuation adds value. Granted, the dollar started to become overvalued in 2015, but it is now sitting close to a historical extreme. A fair assessment is that currencies will revert to their fair value, but that takes time (3-5 years). As such, longer-term investors should be slowly accumulating assets in countries where fundamentals make sense, and their currencies are deeply undervalued. These include Japan, Australia, Sweden and even Mexico (Chart 14). Chart 13The Dollar Is Overvalued On a PPP Basis
The Dollar Is Overvalued On a PPP Basis
The Dollar Is Overvalued On a PPP Basis
Chart 14The Real Effective Exchange Rate For The Dollar Is High
A Lens For Managing Currencies In Today’s Paradigm
A Lens For Managing Currencies In Today’s Paradigm
The Dollar And Momentum There is quite simply a dearth of dollar bears. Internally at BCA, a lot of strategists who see more downside to US (and global) equities, simply cannot be negative on the dollar. Within the foreign exchange strategy, we have been short the DXY index since 104.8, and are sticking with that bet on a 12-18-month horizon. For risk management purposes, our stop loss is at 107. First, we are seeing record long positions by speculators (Chart 15). Fielding clients, or even the media, no one wants to be a dollar bear when the Fed is clearly an inflation vigilante. If inflation keeps surprising to the upside, then speculators will keep bidding up the dollar. But it is also fair to say that most investors who want to be long the greenback at this point already have that position on. Our intermediate-term indicator, a combination of technical variables, also warns against initiating dollar-long positions at the current juncture (Chart 16). This series mean-reverts quite quickly, so it does not dictate the trend in the dollar, but warns of capitulation extremes. Chart 15Speculators Are Very Long The Dollar
Speculators Are Very Long The Dollar
Speculators Are Very Long The Dollar
Chart 16Technical Dollar Indicators Are Overbought
Technical Dollar Indicators Are Overbought
Technical Dollar Indicators Are Overbought
Finally, the dollar has been used as a bet on rising volatility. The dollar is well above levels that a correction in the S&P 500 index would dictate (Chart 17). It has also moved in tandem with bond volatility (Chart 18). This suggests much of equity downside risk has been priced into the dollar. Chart 17The Dollar Has More Than Compensated For The Drawdown In Equities
The Dollar Has More Than Compensated For The Drawdown In Equities
The Dollar Has More Than Compensated For The Drawdown In Equities
Chart 18The Dollar Is Tracking ##br##Volatility
The Dollar Is Tracking Volatility
The Dollar Is Tracking Volatility
Chester Ntonifor Foreign Exchange Strategist chestern@bcaresearch.com Trades & Forecasts Strategic View Cyclical Holdings (6-18 months) Tactical Holdings (0-6 months) Limit Orders Forecast Summary
Executive Summary China: GeoRisk Indicator
China: GeoRisk Indicator
China: GeoRisk Indicator
A new equilibrium between NATO, which now includes Sweden and Finland, and Russia needs to be reestablished before geopolitical risks in Europe subside. Russia aims to inflict a recession on the EU which will revive dormant geopolitical risks embedded in each country. Investors should ignore the apparent drop in China’s geopolitical risk as it could rise further until Xi Jinping consolidates power at the Party Congress this fall. Stay on the sideline on Brazilian, South African, Australian, and Canadian equities despite the commodity bull market, at least until China’s growth stabilizes. Korean risk will rise, albeit by less than Taiwanese risk. The US political cycle ensures that Biden may take further actions against adversaries in Europe, Middle East, and East Asia, putting a floor under global geopolitical risk. Tactical Recommendation Inception Date Return LONG GLOBAL AEROSPACE & DEFENSE / BROAD MARKET EQUITIES 2020-11-27 9.3% Bottom Line: Geopolitical risk will rise in the near term. Stay long gold and global defensive stocks. Feature This month we update our GeoRisk Indicators and make observations about the status of political risk for each territory, and where risks are underrated or overrated by global financial markets. Russia GeoRisk Indicator Our “Original” quantitative measure of Russian political risk – the Russian “geopolitical risk premium” shown in the dotted red line below – has fallen to new lows (Chart 1). One must keep in mind that this geopolitical premium is operating under the assumption of a “free market” but the Russian market in the past few months had been anything but free. The Russian government and central bank had been manipulating the ruble and preventing capital outflows. Hence, Russian assets and any indicator derived from it does not reflect its true risk premium, merely the resolve of its government in the geopolitical struggle. Chart 1Russia: GeoRisk Indicator
Russia: GeoRisk Indicator
Russia: GeoRisk Indicator
While the Russia Risk Premium accurately detected the build-up in tensions before the invasion of Ukraine this year, today it gives the misleading impression that Russian geopolitical risk is low. In reality the risk level remains high due to the lack of strategic stability between Russia and the West, particularly the United States, and particularly over the question of NATO enlargement. Our “Old” Russia GeoRisk Indicator remains elevated but has slightly fallen back. This measure failed to detect the rise in risk ahead of this year’s invasion of Ukraine. We predicted the war based on non-market variables, including qualitative analysis. As a result of the failure of our indicator, we devised a “New” Russia GeoRisk Indicator after this year’s invasion, shown as the green line below. This measure provides the most accurate reading. It is pushing the upper limits, which we truncated at 4, as it did during the invasion of Georgia in 2008 and initial invasion of Ukraine in 2014. Related Report Geopolitical StrategyThird Quarter Geopolitical Outlook: Thunder And Lightning Has Russian geopolitical risk peaked for Europe and the rest of the world? Not until a new strategic equilibrium is established between the US and Russia. That will require a ceasefire in Ukraine and a US-Russia understanding about the role of Finland and Sweden within NATO. However, Hungary is signaling that the EU should impose no further sanctions on Russia. Russia’s cutoff of natural gas exports to Europe will create economic hardship that will start driving change in European governments or policies. A full ban on Russian natural gas may not be implemented in the coming years due to lack of EU unanimity. Still, the EU cannot lift sanctions on Russia because that would enable economic recovery and hence military rehabilitation, which could enable new aggression. Also, Russia will not relinquish the territories it has taken from Ukraine even if President Putin exits the scene. No Russian leader will have the political capital to do that given the sacrifices that Russia has made. Bottom Line: Russia’s management of the ruble is distorting some of our risk indicators. Russia remains un-investable for western investors. Substantial sanction relief will not come until late in the decade, if at all. UK GeoRisk Indicator British political risk is rising, and it may surpass the peaks of the Brexit referendum period in 2016 now that Scotland is pursuing another independence referendum (Chart 2). Chart 2United Kingdom: GeoRisk Indicator
United Kingdom: GeoRisk Indicator
United Kingdom: GeoRisk Indicator
New elections are not due until January 25, 2025 and the ruling Conservative Party has every reason to avoid an election over the whole period so that inflation can come down and the economy can recover. But an early election is possible between now and 2025. Prime Minister Boris Johnson has become a liability to his party but he is still a more compelling leader than the alternatives. If Johnson is replaced, then the change of leadership will only temporarily boost the Tories’ public approval. It will ultimately compound the party’s difficulties by dividing the party without resolving the Scottish question. Regardless, the Tories face stiff headwinds in the coming referendum debate and election, having been in power since 2010 and having suffered a series of major shocks (Brexit, the pandemic, inflation). Bottom Line: The US dollar is not yet peaking against pound sterling, As from a global geopolitical perspective it can go further. Investors should stay cautious about the pound in the short term. But they should prefer the pound to eastern European currencies exposed to Russian instability. Germany GeoRisk Indicator German political risk spiked around the time of the 2021 election and has since subsided, including over the course of the Ukraine war (Chart 3). However, risk will rise again now that Germany has declared that it is under “economic attack” from Russia, which is cutting natural gas in retaliation to Germany’s oil embargo. Chart 3Germany: GeoRisk Indicator
Germany: GeoRisk Indicator
Germany: GeoRisk Indicator
This spike in strategic tensions should not be underrated. Germany is entering a new paradigm in which Russian aggression has caused a break with the past policy of Ostpolitik, or economic engagement. Germany will have to devote huge new resources to energy security and national defense and will have to guard against Russia for the foreseeable future. Domestic political risk will also rise as the economy weakens and industrial activity is rationed. Germany does not face a general election until October 26, 2025. Early elections are rare but cannot be ruled out over the next few years. The ruling coalition does not have a solid foundation. It only has a 57% majority in the Bundestag and consists of an ideological mix of parties (a “traffic light” coalition of Social Democrats, Greens, and Free Democrats). Still, Germany’s confrontation with Russia will keep the coalition in power for now. Bottom Line: From a geopolitical point of view, there is not yet a basis for the dollar to peak and roll over against the euro. That is not likely until there is a ceasefire in Ukraine and/or a new NATO-Russia understanding. France GeoRisk Indicator French political risks are lingering at fairly high levels in the wake of the general election and will only partially normalize given the likelihood of European recession and continued tensions around Russia (Chart 4). Chart 4France: GeoRisk Indicator
France: GeoRisk Indicator
France: GeoRisk Indicator
President Emmanuel Macron was re-elected, as expected, but his Renaissance party (previously En Marche) lost its majority and Macron will struggle to win over 39 deputies to gain a majority of 289 seats in the Assembly. He will, however, be able to draw from an overall right-wing ideological majority – especially the Republicans – when it comes to legislative compromises. The election produced some surprises. The right-wing, anti-establishment National Rally of Marine Le Pen, which usually performs poorly in legislative elections, won 89 seats. The left-wing alliance (NUPES) underperformed opinion polls and has not formed a unified bloc within the Assembly. Still, the left will be a powerful force as it will command 151 seats (the sum of the left-wing anti-establishment leader Jean-Luc Mélenchon’s La France Insoumise party and the Communists, Socialists, and Greens). Macron’s key reform – raising the average retirement age from 62 to 65 – will require an ad hoc majority in the Assembly. The Republicans, with 74 seats, can provide the necessary votes. But some members have already refused to side with Macron on this issue. Macron will most likely get support from the populist National Rally on immigration, including measures to make it harder to be naturalized or obtain long-term residence permits, and measures making it easier to expel migrants whose asylum applications have been refused. France will remain hawkish on immigration, but Macron will be able to rein in the populists. On energy and the environment, Macron may be able to cooperate with the Left on climate measures, but ultimately any cooperation will be constrained by the fact that Mélenchon opposes nuclear power. The Republicans and the National Rally will support Macron’s bid to shore up France’s nuclear energy sector. Popular opinion will hold up for France’s energy security in the face of Russian weaponization of natural gas. Macron and Mélenchon will clash on domestic security. Police violence has emerged as a major source of controversy since the Yellow Vest protests. Macron and the Right will protect the police establishment while the Left will favor reforms, notably the concept of “proximity police,” which would entail police officers patrolling in a small area to create stronger, more personal links between the police and the population; officers being under the control of the mayor and prefect; and ultimately most officers not carrying lethal weapons, and the ban of physically dangerous arrest techniques. Grievances over the police as well as racial inequality will likely erupt into significant social unrest in the coming years. As a second-term president without a single-party majority, Macron will increasingly focus on foreign policy. He will aim to become the premier European leader on the world stage. He will seek to revive France’s historic role as a leading diplomatic power and arbiter of Europe. He will strengthen France’s position in the EU and NATO, keep selling arms to the Middle East, and maintain a French military presence in the Sahel. Macron will favor Ukraine’s membership in the EU but also a ceasefire with Russia. He will face a difficult decision on whether to join Israeli and American military action against Iran should the latter reach nuclear breakout capacity and pursue weaponization. Bottom Line: The outperformance of French equities is stretched relative to EMU counterparts. But France will not underperform until the EU’s natural gas crisis begins to subside and a new equilibrium is established with Russia. Italy GeoRisk Indicator Italy is perhaps the weakest link in Europe both economically and strategically (Chart 5). Elections are due by June 2023 but could come earlier as the ruling coalition is showing strains. A change of government would likely compromise the EU’s attempt to maintain a unified front against Russia over the war in Ukraine. Chart 5Italy: GeoRisk Indicator
Italy: GeoRisk Indicator
Italy: GeoRisk Indicator
Before the war Italy received 40% of its natural gas from Russia and maintained pragmatic relations with the Putin administration. Now Russia is reducing flows to Italy by 50%, forcing the country into an energy crisis at a time when expected GDP growth had already been downgraded to 2.3% this year and 1.7% in 2023. Meanwhile Italian sovereign bond spreads over German bunds have risen by 64 basis points YTD as a result of the global inflation. The national unity coalition under Prime Minister Mario Draghi came together for two purposes. First, to distribute the EU’s pandemic recovery funds across the country, which amounted to 191.5 billion euros in grants and cheap loans for Italy, 27% of the EU’s total recovery fund and 12% of Italy’s GDP. Second, to elect an establishment politician in the Italian presidency to constrain future populist governments (i.e. re-electing President Sergio Mattarella). Now about 13% of the recovery funds have been distributed in 2021, the economy is slowing, Russia is cutting off energy, and elections are looming. The coalition is no longer stable. Coalition members will jockey for better positioning and pursue their separate interests. The anti-establishment Five Star Movement has already split, with leader Luigi di Maio walking out. Five Star’s popular support has fallen to 12%. The most popular party in the country is now the right-wing, anti-establishment Brothers of Italy, who receive 23% support in polling. Matteo Salvini, leader of the League, another right-wing populist party, has seen its public support fall to 15% and will be looking for opportunities. On the whole, far-right parties command 38% of popular voting intentions, while far-left parties command 17% and centrist parties command 39%. Italy’s elections will favor anti-incumbent parties, especially if the country falls into recession. These parties will be more pragmatic toward Russia and less inclined to expand the EU’s stringent sanctions regime. Implementing a ban on Russian natural gas by 2027 will become more difficult if Italy switches. Italy will be more inclined to push for a ceasefire. A substantial move toward ceasefire will improve investor sentiment, although, again, a durable new strategic equilibrium cannot be established until the US and Russia come to an understanding regarding Finland, Sweden, and NATO enlargement. Bottom Line: Investors should steer clear of Italian government debt and equities until after the next election. Spain GeoRisk Indicator Infighting and power struggles within the People’s Party (PP) have provided temporary relief for the ruling Socialist Worker’s Party (PSOE) and Spanish Prime Minister Pedro Sanchez. However, with Alberto Nunez Feijoo elected as the new leader of PP on April 2, the People’s Party quickly recovered from its setback. It not only retook the first place in the general election polling, but also scored a landslide victory in the Andalusia regional election. Andalusia is the most populous autonomous community in Spain, contributing 17% of the seats in the lower house. The Andalusian regional election was a test run for the parties before next year’s general election. Historically, Andalusia was PSOE’s biggest stronghold, but it was ousted by the center-right People’s Party-Citizens coalition in 2018. Since then, the People’s party has consolidated their presence and popularity in Andalusia. The snap election in June, weeks after Feijoo was elected as the new national party leader, expanded PP’s seats in the regional parliament. It now has an absolute majority in the regional parliament while the Socialists suffered its worst defeat. With the sweeping victory in Andalusia, the People’s Party is well positioned for next year’s general election. In addition, the ruling Socialist Worker’s Party continues to suffer from the stagflationary economic condition. In May, Spain recorded the second highest inflation figure in more than 30 years, slightly below its March number. Furthermore, the recent deadly Melilla incident which resulted in dozens of migrants’ death, also caused some minor setbacks within Sanchez’s ruling coalition. His far-left coalition partner joined the opposition parties in condemning Sanchez for being complacent toward the Moroccan police. The pressure is on the Socialists now, and political risk will rise in the coming months, till after the election (Chart 6). Chart 6Spain: GeoRisk Indicator
Spain: GeoRisk Indicator
Spain: GeoRisk Indicator
Bottom Line: Domestic political risk will remain elevated in this polarized country, as elections are due by December 2023 and could come sooner. Populism may return if Europe suffers a recession. Russia aims to inflict a recession on the EU which is negative for cyclical markets like Spain, but Spain benefits from Europe’s turn to liquefied natural gas and has little to fear from Russia. Investors should favor Spanish stocks relative to Italian stocks. Turkey GeoRisk Indicator Turkey faces extreme political and economic instability between now and the general election due by June 2023 (Chart 7). Chart 7Turkey: GeoRisk Indicator
Turkey: GeoRisk Indicator
Turkey: GeoRisk Indicator
Almost any country would see the incumbent ruling party thrown from power under Turkey’s conditions. The ruling Justice and Development Party has been in charge since 2002, the country’s economy has suffered over that period, and today inflation is running at 73% while unemployment stands at 11%. However, President Recep Tayyip Erdoğan is doing everything he can with his recently expanded presidential powers to stay in office. He is making amends with the Gulf Arab states and seeking their economic support. He is also warming relations with Israel, as Turkey seeks to diversify away from Russian gas and Israel/Egypt are potential suppliers. He is doubling down on military distractions across the Middle East and North Africa. And he waged a high-stakes negotiation with the West over Finnish and Swedish accession to NATO. Russian aggression poses a threat to Turkish national interests. Turkey ultimately agreed to Finnish and Swedish membership after a show of Erdoğan strong hands in negotiating with the West over their membership, to show his domestic audience that he is one of the big boys ahead of the election. A risk to this view is that Erdoğan stages military operations against Greek-controlled Cyprus. This would initiate a crisis within NATO and put Finnish and Swedish accession on hold for a longer period. Bottom Line: Investors should not attempt to bottom-feed Turkish lira or stocks and should sell any rallies ahead of the election. A decisive election that removes Erdoğan from power is the best case for Turkish assets, while a decisive Erdoğan victory is second best. Worse scenarios include indecisive outcomes, a contested or stolen election, a constitutional breakdown, or a military coup. China GeoRisk Indicator China’s geopolitical risk is falling and relative equity performance is picking up now that the government has begun easing monetary, fiscal, and regulatory policy to try to secure the economic recovery (Chart 8). Chart 8China: GeoRisk Indicator
China: GeoRisk Indicator
China: GeoRisk Indicator
Easing regulation on Big Tech has spurred a rebound in heavily sold Chinese tech shares, while the Politburo will likely signal a pro-growth turn in policy at its July economic meeting. The worst news of the country’s draconian “Covid Zero” policy is largely priced, while positive news regarding domestic vaccines, vaccine imports, or anti-viral drugs could surprise the market. However, none of these policy signals are reliable until Xi Jinping consolidates power at the twentieth national party congress sometime between September and November (likely October). Chinese stimulus could fail to pick up as much as the market hopes and policy signals could reverse or could continue to contradict themselves. After the party congress, we expect the Xi administration to intensify its efforts to stabilize the economy. The economic work conference in December will release a pro-growth communique. The March legislative session will provide more government support for the economy if needed. However, short-term measures to stabilize growth should not be mistaken for a major reacceleration, as China will continue to struggle with debt-deflation as households and corporations deleverage and the economic model transitions to a post-manufacturing model. Bottom Line: A Santa Claus rally in the fourth quarter, and/or a 2023 rally, is likely, both for offshore and onshore equities. But long-term investors, especially westerners, should steer clear of Chinese assets. China’s reversion to autocracy and confrontation with the United States will ultimately result in tariffs and sanctions and geopolitical crises and will keep risk premiums high. Taiwan GeoRisk Indicator Taiwan’s geopolitical risk has spiked as expected due to confrontation with China. Tensions will remain high through the Taiwanese midterm election on November 26, the Chinese party congress, and the US midterm (Chart 9). But China is not ready to stage a full-scale military conflict over Taiwan yet – that risk will grow over in the later 2020s and 2030s, depending on whether the US and China provide each other with adequate security assurances. Chart 9Taiwan: GeoRisk Indicator
Taiwan: GeoRisk Indicator
Taiwan: GeoRisk Indicator
Still, Taiwan is the epicenter of global geopolitical risk. China insists that it will be unified with the mainland eventually, by force if not persuasion. China’s potential growth is weakening so it is losing the ability to absorb Taiwan through economic attraction over time. Meanwhile the Taiwanese people do not want to be absorbed – they have developed their own identity and prefer the status quo (or independence) over unification. Taiwan does not have a mutual defense treaty with the United States and yet the US and Taiwan are trying to strengthen their economic and military bonds. This situation is both threatening to China and yet not threatening enough to force China to forswear the military option. At some point China could believe it must assert control over Taiwan before the US increases its military commitment. Meanwhile China, the US, Japan, South Korea, and Europe are all adopting policies to promote semiconductor manufacturing at home, and/or outside Taiwan, so that their industries are not over-reliant on Taiwan. That means Taiwan will lose its comparative advantage over time. Bottom Line: Structurally remain underweight Taiwanese equities. Korea GeoRisk Indicator The newly elected President Yoon reaffirmed the strong military tie between Korea and the US, when he hosted President Biden in Seoul in May. Both Presidents expressed interests in expanding cooperation into new areas like semiconductors, economic security, and stability in the Indo-Pacific region. The new administration is also finding ways to improve relations with Japan, which soured in the past few years over the issue of forced labor during the Japanese occupation of Korea. A way forward is yet to be found, but a new public-private council will be launched on July 4 to seek potential solutions before the supreme court ruling in August which could further damage bilateral ties. President Yoon’s various statements throughout the NATO summit in Madrid on wanting a better relationship with Japan and to resolve historical issues showed this administration’s willingness towards a warming of the relations between the two countries, a departure from the previous administration. On the sideline of the NATO summit, Yoon also engaged with European leaders, dealing Korean defense products, semiconductors, and nuclear technologies, with a receptive European audience eager to bolster their defense, secure supply chain, and diversify energy source. North Korea ramped up its missile tests this year as it tends to do during periods of political transitions in South Korea. It is also rumored to be preparing for another nuclear test. Provocations will continue as the North is responding to the hawkish orientation of the Yoon administration. Investors should expect a rise in geopolitical risk in the peninsular, but on a relative basis, due to its strong alliance network, Korean risk will be lower compared to Taiwan (Chart 10). Korea will benefit from a rebound in China in the near term, but in the long-term, it is a secure source of semiconductors and high-tech exports, as Greater China will be mired in long-term geopolitical instability. Chart 10Korea: GeoRisk Indicator
Korea: GeoRisk Indicator
Korea: GeoRisk Indicator
Bottom Line: Overweight South Korean equities relative to emerging markets as a play on Chinese stimulus. Overweight Korea versus Taiwan. Australia GeoRisk Indicator Australia’s Labor Party ultimately obtained a one-seat majority in the House of Representatives following the general election in May (77 seats where 76 are needed). It does not have a majority in the Senate, where it falls 13 seats short of the 39 it needs. It will rely on the Green Party (12 seats) and a few stragglers to piece together ad hoc coalitions to pass legislation. Hence Prime Minister Anthony Albanese’s domestic agenda will be heavily constrained. Pragmatic policies to boost the economy are likely but major tax hikes and energy sector overhauls are unlikely (Chart 11). Chart 11Australia: GeoRisk Indicator
Australia: GeoRisk Indicator
Australia: GeoRisk Indicator
Fortunately for Albanese, his government is taking power in the wake of the pandemic, inflation, and Chinese slowdown, so that there is a prospect for the macroeconomic context to improve over his term in office. This could give him a tailwind. But for now he is limited. Like President Biden in the US, Albanese can attempt to reduce tensions with China after Xi Jinping consolidates power. But also like Biden, he will not have a basis for broad and durable re-engagement, since China’s regional ambitions threaten Australian national security over the long run. Global commodity supply constraints give Australia leverage over China. Bottom Line: Stay neutral on Australian currency and equities until global and Chinese growth stabilize. Brazil GeoRisk Indicator It would take a bolt of lightning to prevent former President Lula da Silva from winning re-election in Brazil’s October 2 first round election. Lula is more in line with the median voter than sitting President Jair Bolsonaro. Bolsonaro’s term has been marred with external shocks, following on a decade of recession and malaise. Polls may tighten ahead of the election but Lula is heavily favored. While ideologically to the left, Lula is a known quantity to global investors (Chart 12). However, Bolsonaro may attempt to cling to power, straining the constitutional system and various institutions. A military coup is unlikely but incidents of insubordination cannot be ruled out. Once Lula is inaugurated, a market riot may be necessary to discipline his new administration and ensure that his policies do not stray too far into left-wing populism. Chart 12Brazil: GeoRisk Indicator
Brazil: GeoRisk Indicator
Brazil: GeoRisk Indicator
Brazil’s macroeconomic context is less favorable than it was when Lula first ruled. During the 2000s he rode the wave of Chinese industrialization and a global commodity boom. Today China is slipping into a balance sheet recession and the next wave of industrialization has not yet taken off. Brazil’s public debt dynamics discourage a structural overweight on Brazil within emerging markets. At least Brazil is geopolitically secure – far separated from the conflicts marring Russia, East Europe, China, and East Asia. It also has a decade of bad news behind it that is already priced. Bottom Line: Stay neutral Brazilian assets until global and Chinese growth stabilize and the crisis-prone election season is over. South Africa GeoRisk Indicator South Africa’s economy continues to face major headwinds amid persistent structural issues that have yet to be adequately addressed and resolved by policy makers. The latest bout of severe energy supply cuts by the state-run energy producer, Eskom, serve as a reminder to investors that South Africa’s economy is still dealing with a major issue of generating an uninterrupted supply of electricity. Each day that electricity supply is cut to businesses and households, the local economy stalls. Among other macroeconomic issues such as high unemployment and rising inflation, low-income households which are too the median voter, are facing increasing hardships. The political backdrop is geared toward further increases in political risk going forward (Chart 13). Chart 13South Africa: GeoRisk Indicator
South Africa: GeoRisk Indicator
South Africa: GeoRisk Indicator
Fiscal reform and austerity are underway but won’t last long enough to make a material difference in government finances. The 2024 election is not that far out and the ruling political party, the ANC, will look to quell growing economic pressures to shore up voter support and reinforce its voter base. Fiscal austerity will unwind. Meanwhile, the bull market in global metal prices stands to moderate on weakening global growth, which reduces a tailwind for the rand, South African equities relative to other emerging markets, and government coffers, reducing our reasons for slight optimism on South Africa until global growth stabilizes. Bottom Line: Shift to a neutral stance on South Africa until global and Chinese growth stabilize. Canada GeoRisk Indicator Canadian political risk has spiked since the pandemic (Chart 14). Populist politics can grow over time in Canada, especially if the property sector goes bust. However, the country is geopolitically secure and benefits from proximity to the US economy. Chart 14Canada: GeoRisk Indicator
Canada: GeoRisk Indicator
Canada: GeoRisk Indicator
Global commodity supply constraints create opportunities for Canada as governments around the world pursue fiscal programs directed at energy security, national defense, and supply chain resilience. Bottom Line: Stay neutral Canadian currency and equities. While Canada benefits from the high oil price and robust US economy, rising interest rates pose a threat to its high-debt model, while US growth faces disappointments due to Europe’s and China’s troubles. Matt Gertken Chief Geopolitical Strategist mattg@bcaresearch.com Yushu Ma Research Analyst yushu.ma@bcaresearch.com Jesse Anak Kuri Associate Editor jesse.kuri@bcaresearch.com Guy Russell Senior Analyst GuyR@bcaresearch.com Alice Brocheux Research Associate alice.brocheux@bcaresearch.com Strategic Themes Open Tactical Positions (0-6 Months) Open Cyclical Recommendations (6-18 Months) Regional Geopolitical Risk Matrix Section III: Geopolitical Calendar
In this <i>Strategy Outlook</i>, we present the major investment themes and views we see playing out for the rest of the year and beyond.
Nominal US Personal Spending grew by a lower-than-expected 0.2% m/m in May, following a downwardly revised 0.6% in April. Adjusted for inflation, personal spending contracted 0.4% m/m. Underlying dynamics testify to the demand shift from goods to services…