Developed Countries
The ECB is in somewhat of a pickle. Prices are surging, which has prompted the central bank to start its rate hike cycle with a bang on Thursday – raising rates by an outsized 50bps. However, these price pressures ultimately reflect the ramifications of the…
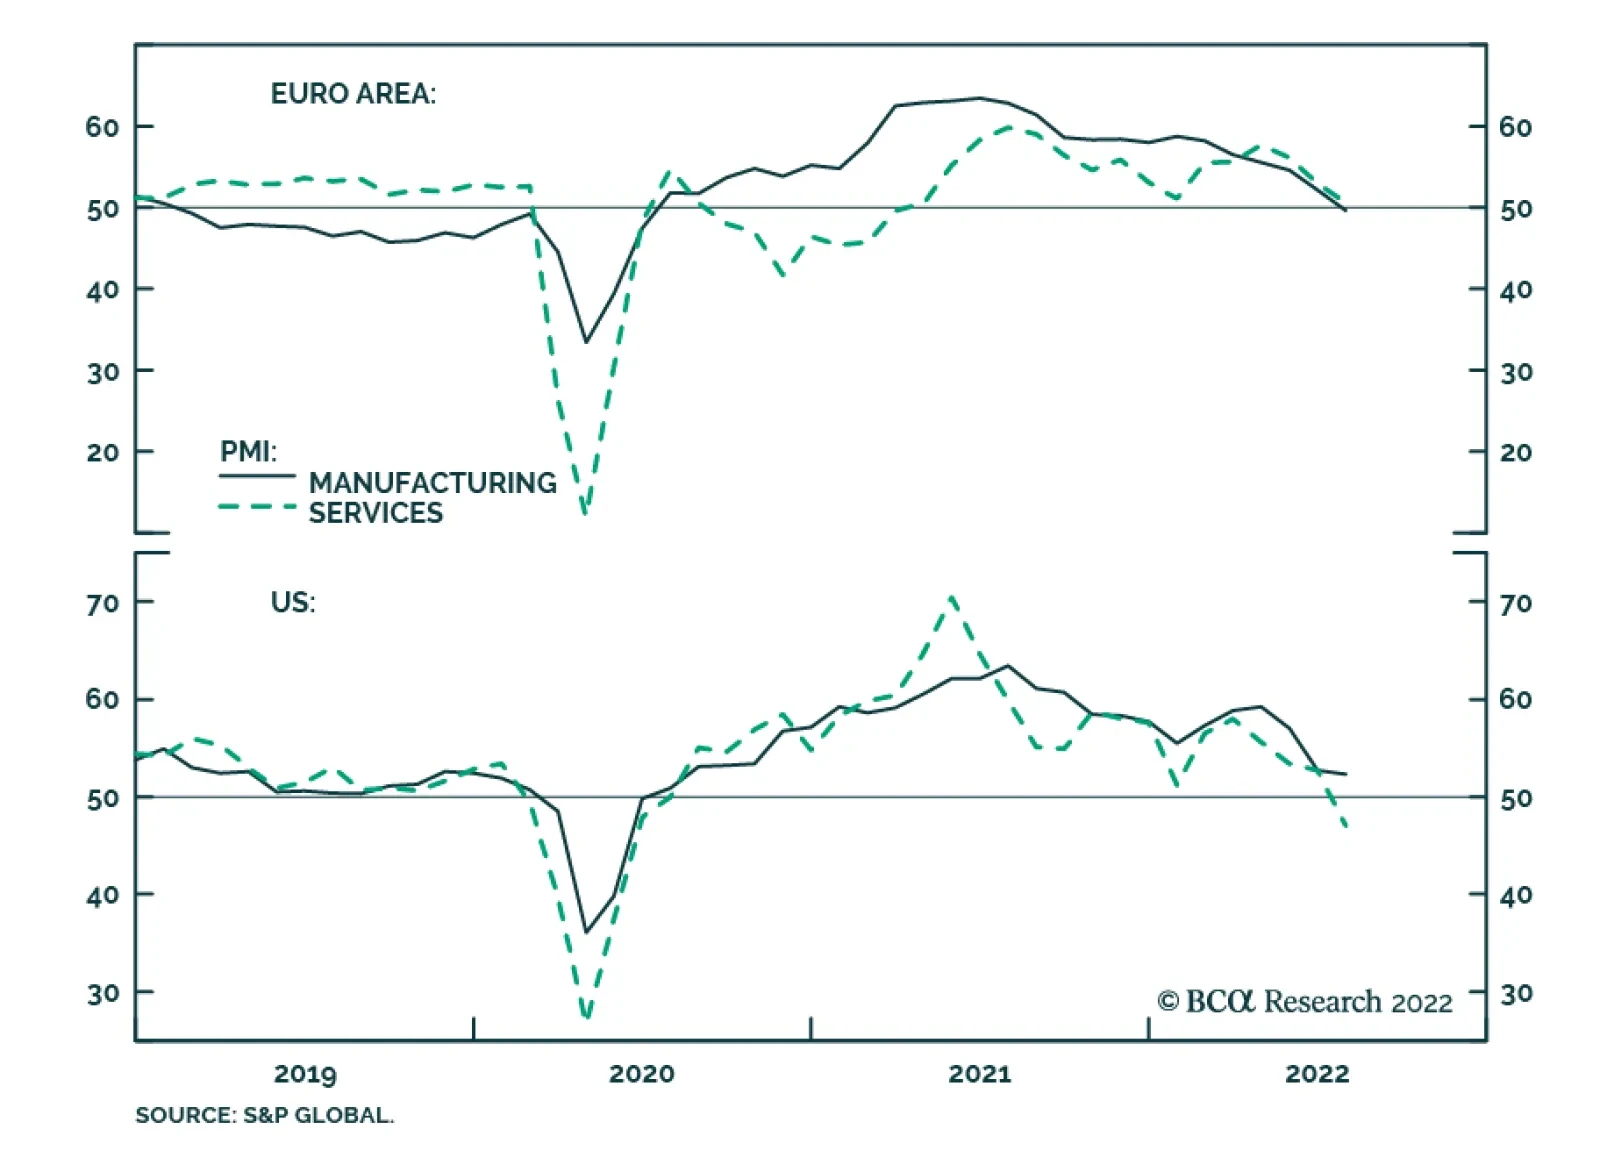
Flash PMIs sent an ominous signal about economic activity in July. The Eurozone composite index dropped to contractionary territory of 49.4 from 52.0, disappointing expectations of a slowdown to 51.0. In particular, the manufacturing index dropped below…
On Friday, Russia and Ukraine signed UN-backed agreements in Turkey that will enable Ukraine to restart exports of grains that have been blocked by Russian forces in Black Sea ports since the start of the conflict earlier this year. The agreement will also…
BCA Research’s Global Asset Allocation & Foreign Exchange Strategy services conclude that the deployment of CBDCs will be transformative for monetary policy, fiscal policy, and the banking system. Some tentative long term investment conclusions…

Listen to a short summary of this report. Executive Summary The odds of a recession in the US are lower than widely perceived. The probability of a recession is higher in Europe, although this week’s partial resumption of gas flows through the Nord Stream 1 pipeline, along with increased use of coal-fired power plants, should soften the blow. Chinese growth should rebound in the second half of the year. However, the specter of future lockdowns, the shift in global spending away from manufactured goods towards services, and the weakening property sector will continue to weigh on activity. With the Twentieth Party Congress slated for later this year, it is increasingly likely that the authorities will open up a firehose of stimulus. Fading recession risks will buoy stocks in the near term. However, a brighter economic outlook also means that the Fed, and several other central banks, may see little need to cut policy rates in 2023, as the markets are currently discounting. The end result is that government bond yields will rise from current levels, implying that stock valuations will not return to last year’s levels even if a recession is averted. After Rapidly Raising Rates, Markets Expect Some DM Central Banks To Start Easing Next Year
The Downside Of A Soft Landing
The Downside Of A Soft Landing
Bottom Line: We recommend a modest overweight on global equities for now but would turn neutral if the S&P 500 were to rise above 4,050. Dear Client, I am delighted to announce that Ritika Mankar, CFA, has joined the Global Investment Strategy team. Ritika will be writing occasional special reports on a variety of topical issues. Next week, she will make the case that the US economy’s ability to spawn mega-sized companies may become increasingly compromised over the next decade. Best regards, Peter Berezin, Chief Global Strategist The Case for a Soft Landing in the US Chart 1Cyclicals Underperformed Defensives As Recession Risks Intensified
Cyclicals Underperformed Defensives As Recession Risks Intensified
Cyclicals Underperformed Defensives As Recession Risks Intensified
Over the last few months, investors have become concerned that the Fed and many other central banks will need to engineer a recession in order to bring inflation down to more comfortable levels. While these fears have abated over the past trading week, they still continue to dominate market action (Chart 1). We place the odds of a US recession at about 40%. This is arguably more optimistic than the consensus view. According to Bank of America, the majority of fund managers saw recession as likely in this month’s survey. Not surprisingly, investors consider recession to be a major risk for equities over the next 12 months (Chart 2). Chart 2Many Investors Now See Recession As Baked In The Cake
The Downside Of A Soft Landing
The Downside Of A Soft Landing
Even if a recession does occur, we have contended that it will likely be a mild one, perhaps so mild that it will be difficult to distinguish it from a soft landing. A number of things make a soft landing in the US more probable than in the past: Labor supply has scope to increase. The labor participation rate is still 1.2 percentage points below its pre-pandemic level, two-thirds of which is due to decreased participation among workers under the age of 55 (Chart 3). The share of workers holding multiple jobs is also below its pre-pandemic level (Chart 4). The number of multiple job holders has been rising briskly lately. That is one reason why job growth in the payroll survey – which double counts workers if they hold more than one job – has been stronger than job growth in the household survey. Increased labor supply would obviate the need for the Fed to take drastic actions to curtail labor demand in its effort to restore balance to the labor market. Chart 3Labor Supply Has Scope To Rise
Labor Supply Has Scope To Rise
Labor Supply Has Scope To Rise
Chart 4The Number Of Multiple Job Holders Is Still Below Pre-Pandemic Levels
The Number Of Multiple Job Holders Is Still Below Pre-Pandemic Levels
The Number Of Multiple Job Holders Is Still Below Pre-Pandemic Levels
A high level of job openings creates a moat around the labor market. There are almost two times as many job openings as there are unemployed workers in the US (Chart 5). Many firms are likely to pull job openings before they cut jobs in response to a slowing economy. A high level of job openings will also allow workers who lose their jobs to find employment more quickly than usual, thus limiting the rise in so-called frictional unemployment. It is worth noting that the job openings rate has declined from a record 7.3% in March to a still-high 6.9% in May, with no change in the unemployment rate over this period. Chart 5A High Level Of Job Openings Creates A Moat Around The Labor Market
A High Level Of Job Openings Creates A Moat Around The Labor Market
A High Level Of Job Openings Creates A Moat Around The Labor Market
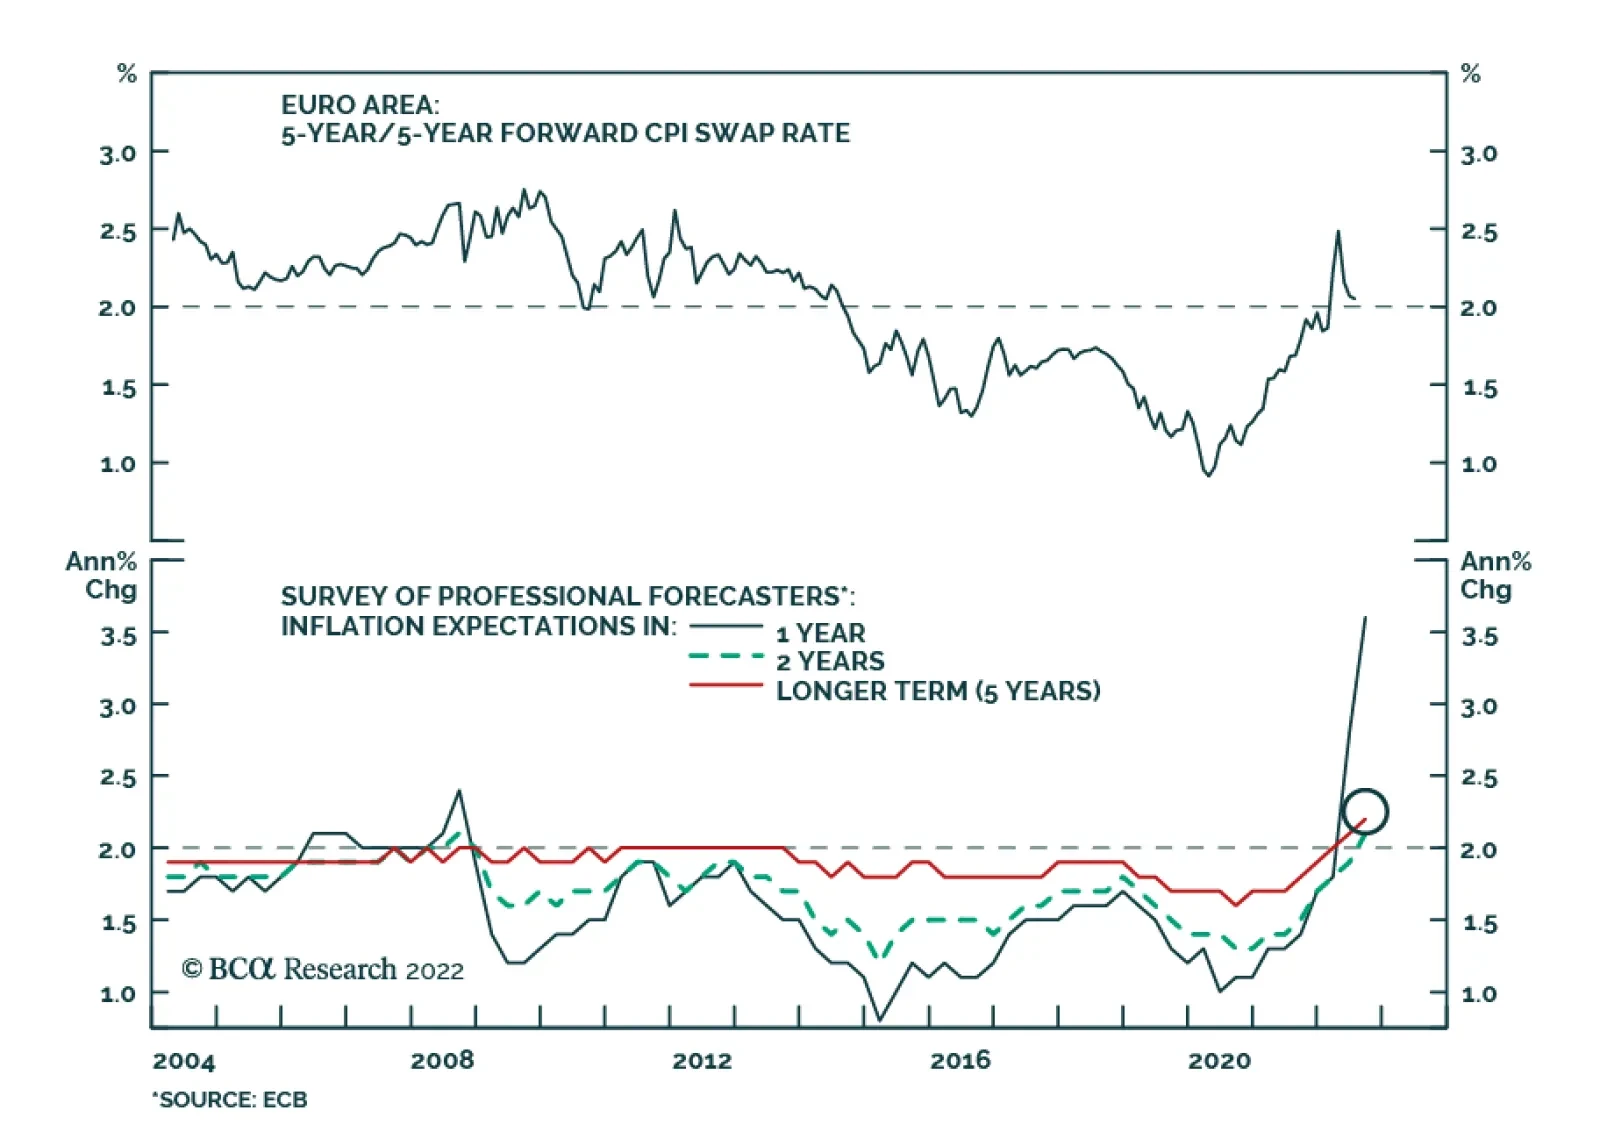
A steep Phillips curve implies that only a modest increase in unemployment may be necessary to knock down inflation towards the Fed’s target. Just as was the case in the 1960s, the Phillips curve has proven to be kinked near full employment (Chart 6). Unlike in the late 1960s, however, when rising realized inflation caused long-term inflation expectations to reset higher, expectations have remained well anchored this time around (Chart 7). Chart 6The Phillips Curve Is Kinked At Very Low Levels Of Unemployment
The Downside Of A Soft Landing
The Downside Of A Soft Landing
Chart 7Long-Term Inflation Expectations Are Well Anchored
Long-Term Inflation Expectations Are Well Anchored
Long-Term Inflation Expectations Are Well Anchored
The unwinding of pandemic and war-related dislocations should push down inflation. A recent study by the San Francisco Fed estimates that about half of May’s PCE inflation print was the result of supply-side disturbances (Chart 8). While the ongoing war in Ukraine and the threat of another Covid wave in China will continue to unsettle global supply chains, these problems should fade over time. Falling inflation would allow real wages to start rising again. This would bolster confidence, making a soft landing more likely (Chart 9). Chart 8Supply Factors Explain Half Of The Increase In Prices Over The Past Year
The Downside Of A Soft Landing
The Downside Of A Soft Landing
Chart 9Positive Real Wage Growth Will Bolster Consumer Confidence
Positive Real Wage Growth Will Bolster Consumer Confidence
Positive Real Wage Growth Will Bolster Consumer Confidence
A lack of major financial imbalances makes the US economy more resilient to economic shocks. As a share of disposable income, US household debt is 34 percentage points below its 2008 peak (Chart 10). Relative to net worth, household debt is at multi-decade lows. About two-thirds of mortgages carry a FICO score above 760 compared to only one-third during the housing bubble (Chart 11). Non-mortgage consumer credit also remains in good shape, as my colleague Doug Peta elaborated in this week’s US Investment Strategy report. While corporate debt has risen over the past decade, the ratio of corporate debt-to-assets today is still below where it was during the 1990s. Moreover, thanks to stronger corporate profitability, the interest coverage ratio is near an all-time high (Chart 12). Chart 10AUS Household Debt Is Not Especially High Anymore (I)
US Household Debt Is Not Especially High Anymore (I)
US Household Debt Is Not Especially High Anymore (I)
Chart 10BUS Household Debt Is Not Especially High Anymore (II)
US Household Debt Is Not Especially High Anymore (II)
US Household Debt Is Not Especially High Anymore (II)
Chart 11FICO Scores For Residential Mortgages Have Improved Considerably Since The Pre-GFC Housing Bubble
The Downside Of A Soft Landing
The Downside Of A Soft Landing
Chart 12Corporate Balance Sheets Are In Decent Shape
Corporate Balance Sheets Are In Decent Shape
Corporate Balance Sheets Are In Decent Shape
Chart 13Tight Supply Limits The Downside Risks To Housing
Tight Supply Limits The Downside Risks To Housing
Tight Supply Limits The Downside Risks To Housing
Just like the US does not suffer from major financial imbalances, it does not suffer from any major economic imbalances either. The homeowner vacancy rate is near a record low, which should put a floor under residential investment (Chart 13). Outside of investment in intellectual property, which is not especially sensitive to the business cycle, nonresidential investment is still below pre-pandemic levels and not much above where it was as a share of GDP during the Great Recession (Chart 14). Spending on consumer durable goods has retraced four-fifths of its pandemic surge, with little ill-effect on aggregate employment (Chart 15). Chart 14Outside Of IP, Nonresidential Investment Is Still Low
Outside Of IP, Nonresidential Investment Is Still Low
Outside Of IP, Nonresidential Investment Is Still Low
Chart 15Spending On Durable Goods Has Been Normalizing Without Derailing The Economy
Spending On Durable Goods Has Been Normalizing Without Derailing The Economy
Spending On Durable Goods Has Been Normalizing Without Derailing The Economy
Europe: A Deep Freeze Will Likely Be Avoided Chart 16Russia Can Potentially Cause Significant Economic Damage In The EU If It Closes The Taps
The Downside Of A Soft Landing
The Downside Of A Soft Landing
The macroeconomic picture is less benign outside the US. Four years ago, German diplomats laughed off warnings that their country had become dangerously dependent on Russian energy. They are not laughing anymore. German industry, just like industry across much of Europe, is facing a major energy crunch. The IMF estimates that output losses associated with a full Russian gas shutoff over the next 12 months could amount to as much as 2.7% of GDP in the EU (Chart 16). In Central and Eastern Europe, output could shrink by 6%. Among the major economies, Germany and Italy are the most at risk. Fortunately, Europe is finally stepping up to the challenge. The highly ambitious REPowerEU plan seeks to displace two-thirds of Russian gas by the end of 2022. The plan does not include any additional energy that could be generated by increased usage of coal-fired power plants, a strategy that the European political establishment (including the German Green Party!) has only recently begun to champion. It is possible that EU leaders felt the need to generate a crisis mentality to justify the decision to burn more coal. Dire warnings about how Europe is prepared to ration gas also send a message to Russia that the EU is ready to suffer in order to thwart Putin’s despotic regime. Whether Europe actually follows through is a different story. It is worth noting that the Nord Stream 1 pipeline resumed operations this week after Germany received, over Ukrainian objections, a repaired turbine from Canada. The resumption of partial flows through the pipeline, along with increased fiscal support for households and firms, reduces the risks of a “deep freeze” recession in Europe. The unveiling of the ECB’s new Transmission Protection Instrument (TPI) this week should also help anchor sovereign credit spreads across the euro area. While the exact conditions under which the TPI will be engaged have yet to be fleshed out, we expect the terms to be fairly liberal, reflecting not only the lessons learned from last decade’s euro debt crisis, but also to serve as a powerful bulwark against Putin’s efforts to destabilize the EU economy. China: Government’s Growth Target Looks Increasingly Unrealistic Stronger growth in China would help European exporters (Chart 17). Chinese real GDP grew by just 0.4% in the second quarter from a year earlier as the economy was battered by Covid lockdowns. Activity should pick up in the second half of the year, but at this point, the government’s 5.5% growth target looks completely unachievable. The specter of future lockdowns, the shift in global spending away from manufactured goods towards services, and the weakening Chinese property sector are all weighing on the economy (Chart 18). Chart 17European Exporters Would Welcome A Stronger Chinese Economy
European Exporters Would Welcome A Stronger Chinese Economy
European Exporters Would Welcome A Stronger Chinese Economy
The authorities will likely seek to stimulate the economy by allowing local governments to bring forward $220 billion in bond issuance that had been originally slated for 2023. The problem is that land sales – the main source of local government revenue – have collapsed. Worried about the ability of local governments to service their obligations, both retail investors and banks have shied away from buying local government debt. Chart 18A Slowing Property Market And Covid Lockdowns Have Been Weighing On The Chinese Economy
A Slowing Property Market And Covid Lockdowns Have Been Weighing On The Chinese Economy
A Slowing Property Market And Covid Lockdowns Have Been Weighing On The Chinese Economy
Meanwhile, the inability of property developers to secure adequate financing to complete construction projects has left a growing number of home buyers in the lurch. In most cases, these properties were purchased off-the-plan. Understandably, home buyers have balked at the prospect of having to make mortgage payments on properties that they do not possess. With the Twentieth Party Congress slated for later this year, it is increasingly likely that the authorities will open up a firehose of stimulus, including increased assistance for property developers and banks, as well as income-support measures for households. While such measures will not address China’s myriad structural problems, they will help keep the economy afloat. Equity Valuations in a Soft-Landing Scenario A few weeks ago, the consensus view was that stocks would tumble in the second half of the year as the global economy fell into recession but would then rally in 2023 as central banks began lowering rates. We argued the opposite, namely that stocks would likely rebound in the second half of the year as the economy outperformed expectations but would then face renewed pressure in 2023 as it became clear that the Fed and several other central banks had no reason to cut rates (Chart 19). Chart 19After Rapidly Raising Rates, Markets Expect Some DM Central Banks To Start Easing Next Year
The Downside Of A Soft Landing
The Downside Of A Soft Landing
Chart 20Real Rates Have Jumped This Year
Real Rates Have Jumped This Year
Real Rates Have Jumped This Year
In a baseline scenario where a recession is averted, we argued that the S&P 500 could rise to 4,500 (60% odds). In contrast, we noted that the S&P 500 could fall to 3,500 in a mild recession scenario (30% odds) and to 2,900 in a deep recession scenario (10% odds). It is worth stressing that even at 4,500, the S&P 500 would still be 11% lower in real terms than it was on January 4th. At the stock market’s peak in January, the 10-year TIPS yield stood at -0.91%, while the 30-year TIPS yield stood at -0.27%. Today, they stand at 0.58% and 0.93%, respectively (Chart 20). If real rates do not return to their prior lows, it is unlikely that equity valuations will return to their prior highs. This limits the upside for stocks, even in a soft-landing scenario. The sharp rally in stocks over the past week has priced out some of this recession risk, moving equity valuations closer towards what we regard as fair value. As we noted last week, we will turn neutral on equities if the S&P 500 were to rise above 4,050. As we go to press, we are only 1.3% from that level. Peter Berezin Chief Global Strategist peterb@bcaresearch.com Follow me on LinkedIn & Twitter Global Investment Strategy View Matrix
The Downside Of A Soft Landing
The Downside Of A Soft Landing
Special Trade Recommendations Current MacroQuant Model Scores
The Downside Of A Soft Landing
The Downside Of A Soft Landing
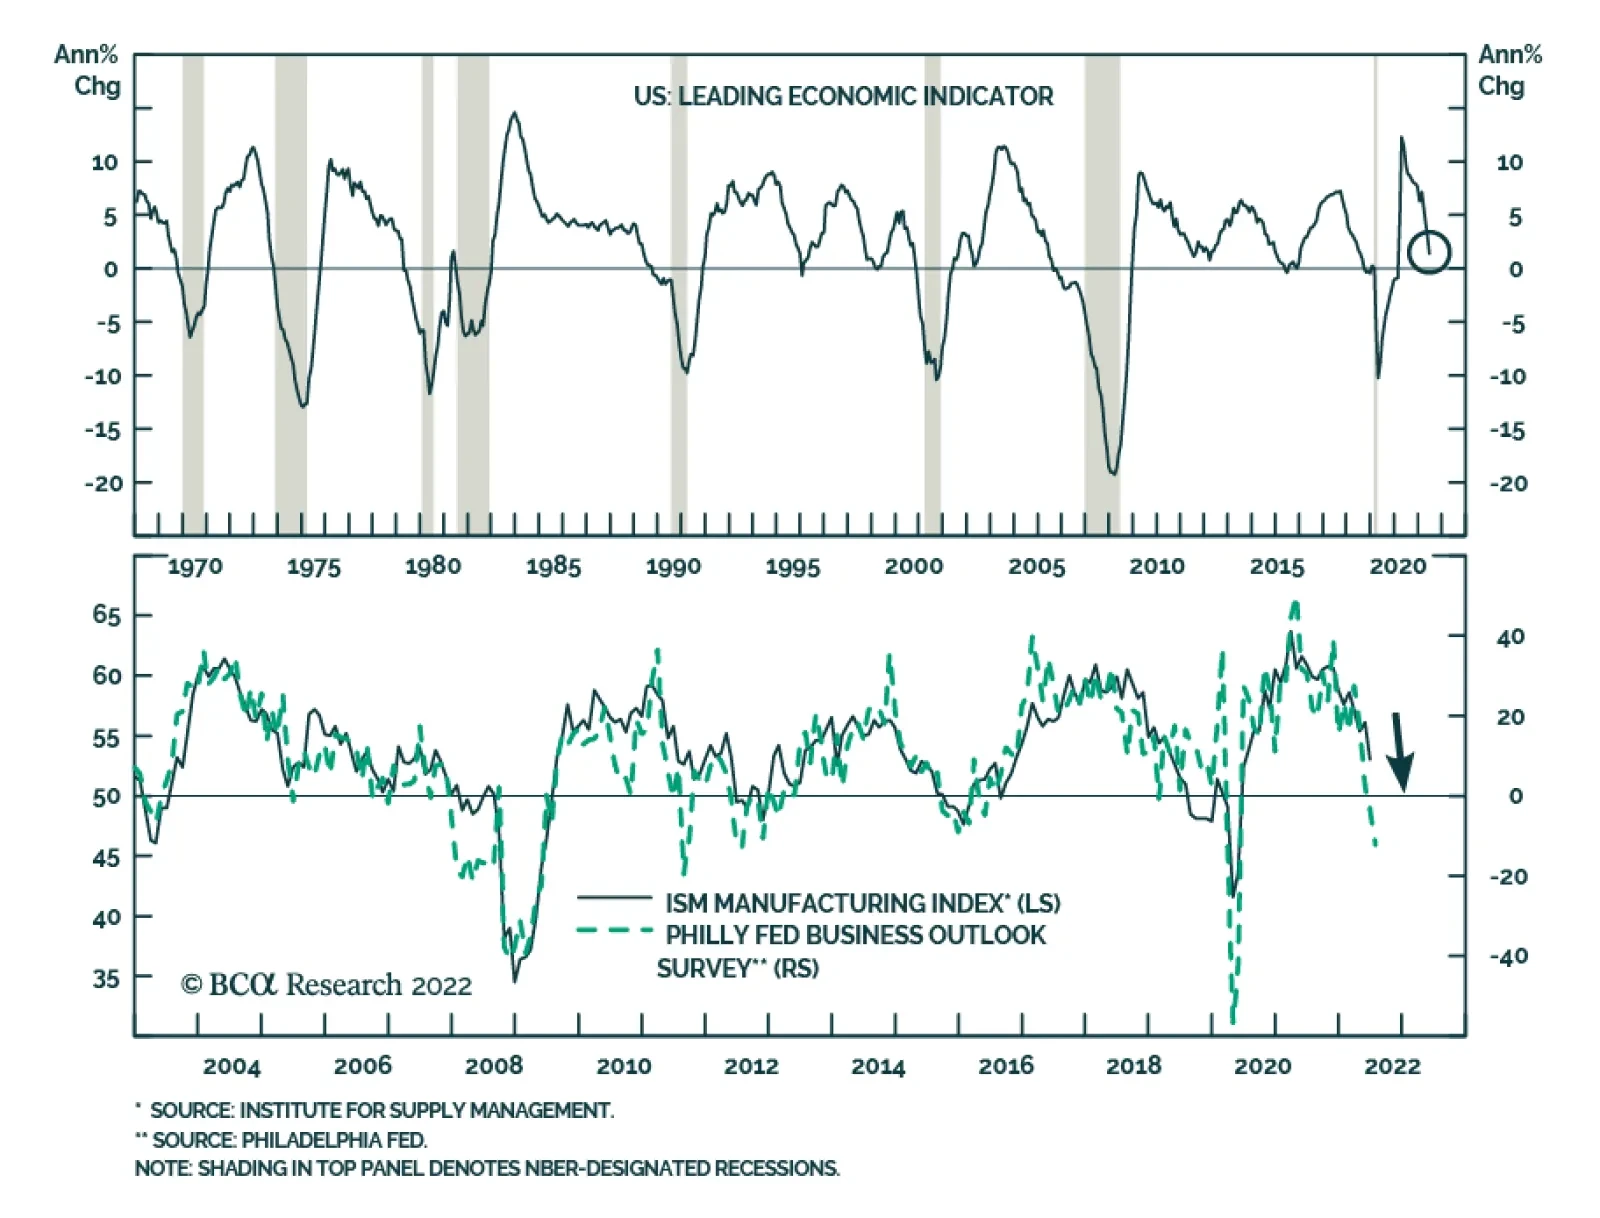
The Conference Board US Leading Economic Index (LEI) deteriorated further in June, contracting by a larger-than-expected 0.8% following a 0.4% decline in May. Consumer sentiment, labor market conditions, stock prices and manufacturing new orders were the main…
As expected, the Bank of Japan maintained its ultra-accommodative monetary policy stance following its meeting on Thursday. The central bank kept its -0.1% target for short-term rates and reiterated its pledge to conduct daily purchases of 10-year bonds at a…
The ECB took a big step in normalizing monetary policy on Thursday. It hiked interest rates for the first time in 11 years, raising the deposit rate by 50bps to zero. The central bank noted that upside risks to inflation and support from its toolkit (PEPP as…
Executive Summary Upside Oil Price Risk Dominates
Upside Oil Price Risk Dominates
Upside Oil Price Risk Dominates
Despite global recession fears and uncertainty over Russia’s retaliation for the EU embargo against its exports, oil markets will continue to tighten. After breaching $15/bbl in June, the Dec22 vs Dec23 Brent backwardation – our preferred seasonal indicator for inventory tightness – is back above $10/bbl and rising. There is an increasing risk Russia will cut crude output, if G7 states impose a price cap on its oil sales. Our modeling indicates the loss of an additional 2mm b/d of Russian output vs our base case beginning in 4Q22 would lift prices above $220/bbl by 4Q23. On the downside, our modeling indicates the loss of 2mm b/d of demand vs our base case – i.e., essentially wiping out this year’s expected growth – would push average Brent prices toward $60/bbl next year. Our base case forecast for Brent crude oil is unchanged. We expect 2022 Brent to average $110/bbl, and for 2023 prices to average $117/bbl. WTI will trade $3-$4/bbl below Brent. Bottom Line: We expect markets to continue to tighten as the EU embargo of Russia oil progresses. A price cap on Russian oil sales could lead to a production cut that takes prices above $220/bbl by 4Q23. An economic collapse could push Brent toward $60/bbl. Risks remain skewed to the upside. Our base case Brent price forecast remains unchanged: $110/bbl on average this year and $117/bbl in 2023. Feature The global oil market is tightening even with China demand restrained by its zero-Covid-19 tolerance policy, and parts of Europe almost surely facing recession if Russian pipeline gas supplies are cut off or tighten significantly between now and the approach of winter. Upside price risk dominates, in our view. Our Brent price forecast remains unchanged, averaging $110/bbl this year and $117/bbl in 2023. Markets remain tight: Oil supply will remain below demand, which will force inventories to draw (Chart 1). Related Report Commodity & Energy StrategyRecession Unlikely To Batter Oil Prices This will push Brent into a steeper backwardation going into year-end, forcing the Dec22 v Dec23 Brent spread higher (Chart 2). High levels of backwardation – i.e., prompt-delivery futures trading above deferred-delivery futures – is how inventory tightness manifests itself: Refiners are willing to pay more for prompt delivery than deferred delivery, because they need oil now to meet demand. This is occurring despite weaker demand coming out of China and EU states, as the latter begins to ration energy supplies ahead of the coming winter. Chart 1Inventories Will Tighten
Inventories Will Tighten
Inventories Will Tighten
Chart 2Markets Will Backwardate Further
Markets Will Backwardate Further
Markets Will Backwardate Further
Russia Risk Is Increasing The supply-side risks that we outlined in last week's report — chiefly the risk Russia will unilaterally cut oil supply if a price cap is imposed by G7 states led by the US – remain in place. We expect the EU to follow through on its commitment to phase out all Russian oil and refined product imports in 2H22 and 1Q23. The EU formally agreed to cut 90% of its Russian oil imports by the end of this year. The EU’s goal is to be completely out of ~ 2.3mm b/d of seaborne crude oil imports and 800k b/d of pipeline imports this year. In 1Q23, the EU will be reducing its refined product imports (e.g., diesel fuel) from Russia as well. Russia will lose more than 4mm b/d of crude and product exports to the EU as a result of these embargoes. We continue to expect the cutoffs in EU exports will result in Russia being forced to shut in 1.6mm b/d of production this year and another 500k b/d next year. In our base case, we expect this to take Russian crude production down from more than 10.5mm b/d prior to its invasion of Ukraine to something close to 8.0mm b/d by the end of next year. Spare capacity remains tight. Almost all of OPEC 2.0’s spare capacity is in the Kingdom of Saudi Arabia (KSA) and the United Arab Emirates (UAE). These are the only two OPEC 2.0 states that are able to increase production and maintain it at higher levels for an indefinite period of time. Despite repeated pleas from the US, these states continue to indicate they do not see the need to sharply increase oil production, even after US President Joe Biden made a trip to the region last week to ask them in person to do so. With ~ 2-3mm b/d of spare capacity available – the exact level is not public knowledge – digging into spare capacity now would leave nothing in the tank, so to speak, to meet another supply shock (e.g., a unilateral cut-off of Russian supplies in response to a G7 price cap on oil sales). KSA, as a matter of policy, maintains a minimal level of spare capacity (1.0 – 1.5mm b/d) to handle unforeseen supply shocks. In addition, the OPEC 2.0 agreement to return production removed from the market during the COVID-19 pandemic agreed last July, and the US release of 1mm b/d of inventories out of its Strategic Petroleum Reserve (SPR) both expire in September.1 The US SPR has not indicated it will extend its release of inventory beyond September. Markets will tighten. The return of barrels from OPEC 2.0 is largely moot, since only KSA and the UAE – which we dub Core OPEC 2.0 – have been able to consistently raise output since the July 2021 agreement to return barrels to the market. The other OPEC 2.0 member states – the “Other Guys” – have consistently missed their production quotas this past year (Chart 3). Lastly, the odds of the US and Iran reaching a rapprochement continue to fade, almost to the point of vanishing. Iran reportedly will supply Russia with drones for its war in Ukraine. This indicates the Iranian government has all but capitulated on reviving its nuclear deal with the US, which would have brought an additional 1mm b/d back on the market.2 Outside of OPEC 2.0, we expect US production in the Lower 48 states ex-US Gulf will increase 0.8mm b/d this year, and 0.75mm b/d next year, given price levels and the shape of the WTI forward curve (Chart 4). This is mostly unchanged from previous production expectations. Chart 3Lower OPEC 2.0 Production ex-KSA, UAE
Tighter Oil Markets On The Way
Tighter Oil Markets On The Way
Chart 4Capital Discipline Drives US Shale Production Growth
Capital Discipline Drives US Shale Production Growth
Capital Discipline Drives US Shale Production Growth
We continue to expect US shale-oil producers will maintain capital discipline, and will continue to prioritize shareholder interests by returning capital to investors via share buybacks and strong dividend distributions. Besides, boosting output over the balance of this year is becoming increasingly difficult, given oil-services equipment shortages and lack of capital.3 In our base case, we continue to anticipate demand will rise by 2.0mm b/d this year and 1.8mm b/d next year. This is lower than our estimates at the start of the year by close to 3mm b/d. This is all down to the sharp GDP growth slowdown forecast by the World Bank last month, which pushed our oil-demand estimates lower.4 Oil demand continues to grow, albeit it slowly, which, against a backdrop of tightening supplies, means the risk to prices remains to the upside. In our base case, the supply-demand fundamentals are largely balanced (Chart 5). These fundamentals (Table 1) are driving our forecast for $110/bbl Brent this year and $117/bbl next year (Chart 6). Chart 5Markets Remain Finely Balanced
Markets Remain Finely Balanced
Markets Remain Finely Balanced
Chart 6Brent Backwardation Will Steepen
Brent Backwardation Will Steepen
Brent Backwardation Will Steepen
Table 1BCA Global Oil Supply - Demand Balances (MMb/d, Base Case Balances) To Dec23
Tighter Oil Markets On The Way
Tighter Oil Markets On The Way
Uncertain Evolutions: Between $60 And $220/bbl We have noted the heightened uncertainty surrounding our oil-price expectations, which makes forecasting more tentative than usual.5 This week, we consider larger supply and demand shocks via econometric simulations to at least define possible price paths consistent with our assumptions and modeling. To the upside, we estimate a 2mm b/d loss of output resulting from a cutoff of Russian crude oil production. Relative to the status quo ante – i.e., prior to Russia’s invasion of Ukraine in February – this would remove a total of ~ 4mm b/d of Russian production from the market (2mm in our base case plus an additional 2mm b/d). Our modeling indicates this could push prices above $220/bbl by 4Q23, depending on how the additional 2mm b/d production cut is implemented – i.e., suddenly or staged pro-rata (Chart 7).6 This high-price scenario would be difficult for markets to adjust to, given the short-term inelasticity of global oil demand. In its wake, we would expect demand destruction on a large scale. Chart 7Upside Oil Price Risk Dominates
Upside Oil Price Risk Dominates
Upside Oil Price Risk Dominates
On the downside, we simulate a sharp contraction in oil consumption that removes an additional 2mm b/d of demand vs our base case – i.e., essentially wiping out this year’s expected growth. This would push average 2023 prices toward $60/bbl in our modeling. Losing this much demand would amount to a global economic collapse. A deep global recession cannot be ruled out, as markets have been reminding us over the past couple of weeks. However, the downside risks are not as pronounced as the upside risks in our estimation. There has not been an excessive accumulation of inventory in the OECD, as Chart 1 indicates. In the non-OECD economies, inventory accumulation in China appears to be intentional and policy driven. In addition, the supply response to sharply lower prices would be met by sharply lower production by KSA and the UAE, along with the US shale-oil producers over the course of a couple of months. This would arrest the down leg a demand shock produced in previous oil-price collapses when production was not as flexible, and inventories adjusted with longer lags. Economic growth in the EU could slow in some but not all of the member states, according to recent IMF estimates.7 The US may slow, and is at risk to a hard landing due to poorly calibrated Fed tightening. This could usher in a deep recession. However, the US also might even benefit from the EU going into recession, since it is not as resource constrained as the EU. Lastly, the EU’s been getting ready for this Russian energy cut-off and has lined up alternative energy sources (LNG and coal mostly). In addition, states already have begun asking their citizens to conserve energy, particularly natural gas. This forced conservation can achieve significant energy savings and is not new to the world: It was demonstrated by Japan after the Fukushima disaster in 2011 and the US in the late 1970s. Investment Implications Our base case oil-price forecast remains $110/bbl and $117/bbl on average for this year and next. Simulations of uncertain prices evolutions – i.e., evolutions we cannot attach a probability to at present – indicate upside price risk is dominant. This inclines us to remain long oil equities via the XOP ETF. We were tactically long 4Q22 and 1Q23 TTF futures until stop losses on both trades were elected on July 15th, generating returns of 89.6% and 83.1% respectively. Robert P. Ryan Chief Commodity & Energy Strategist rryan@bcaresearch.com Ashwin Shyam Research Analyst Commodity & Energy Strategy ashwin.shyam@bcaresearch.com Paula Struk Research Associate Commodity & Energy Strategy paula.struk@bcaresearch.com Commodities Round-Up Energy: Bullish Markets will await the conclusion of maintenance on the Nord Stream 1 (NS1) pipeline scheduled for this week. We continue to expect a cut-off of Russian natgas shipments to Europe, in addition to the 60% of volumes that already have been cut. In its latest GDP forecasts, the IMF expects EU GDP growth of 2.9% and 2.5% in 2022 and 2023, respectively. In and of itself, this would support our expectation for oil prices averaging $110/bbl and $117/bbl this year and next, as it is in line with the GDP forecast expected by the World Bank, which drives our forecasts. However, EU GDP still could contract in response to a complete shut-off of Russian gas imports in 2H22, particularly if it is sudden and prompts the EU to go to Phase 3 of its energy emergency plan and invoke gas rationing. EU gas inventories continue to build going into winter (Chart 8). Markets are critically dialed in to how the inventory builds ahead of winter proceed following NS1 maintenance: If it is delayed for technical reasons the storage fill rate will slow. Base Metals: Bullish China formally created a state-backed company to oversee all of its iron ore imports and overseas ore assets on Tuesday. The purpose of this company is to wrest pricing power away from iron ore suppliers – most of which are based in Australia – and reduce its reliance on Australian iron ore imports. A single buying entity will effectively create a monopsony, since China imports ~70% of global iron ore to supply its steel making industry, the largest in the world. Precious Metals: Bullish We have tactically downgraded our gold view on the back of continued USD strength. Reports of civil unrest in China – which was forecast by BCA’s Geopolitical Strategy - arising from the unfolding mortgage crisis likely will boost demand for gold, but it will boost demand for USD even more, in our view (Chart 9). We are closely monitoring this situation, along with possible increases in systemic financial risk in Chinese banks, which also would support USD demand. We remain strategically bullish gold. Chart 8
Tighter Oil Markets On The Way
Tighter Oil Markets On The Way
Chart 9
Nominal Broad US Dollar Index Going Up
Nominal Broad US Dollar Index Going Up
Footnotes 1 Please see OPEC+ agrees oil supply boost after UAE, Saudi reach compromise and U.S. to sell up to 45 mln bbls oil from reserve as part of historic release published by reuters.com on July 19, 2021 and June 14, 2022, respectively. OPEC 2.0 is our moniker for the producer coalition led by KSA and Russia; it also is referred to as OPEC+ in the media. 2 This could presage an unravelling of the status quo in the Middle East, as our colleagues at BCA Research’s Geopolitical Strategy highlight in their most recent report Questions From The Road published on July 15, 2022. 3 Please see Fracking Growth ‘Almost Impossible’ This Year, Halliburton Says, published by bloomberg.com on July 19, 2022. 4 Please see Recession Unlikely To Batter Oil Prices, which we published on June 16, 2022. It is available at ces.bcaresearch.com. 5 Running simulations is a good way to identify risks and at least have an intuition for where prices might go given difference evolutions of fundamentals. Please see Russia Pulls Oil, Gas Supply Strings for discussions and simulations of prices in response to different supply and shocks we ran last week. 6 The timing and depth of the shocks we simulate here are not assigned a probability to express our view of their likelihood. This reflects our belief that these are highly uncertain outcomes. That said, having an intuition for what to expect should the markets evolve in such a way as to create a probability one of these outcomes has become likely is useful. 7 The smaller EU economies are most at risk to sharp economic downturns from a cutoff in Russian gas exports, according to the IMF. The Fund estimates that in “Hungary, the Slovak Republic and the Czech Republic—there is a risk of shortages of as much as 40 percent of gas consumption and of gross domestic product shrinking by up to 6 percent.” Please see How a Russian Natural Gas Cutoff Could Weigh on Europe’s Economies published by the IMF on July 19, 2022. Investment Views and Themes Recommendations We were stopped out of our Long 4Q22 TTF Futures trade on July 15, with a return of 89.6%. We were stopped out of our Long 1Q23 TTF Futures trade on July 15, with a return of 83.1%. Strategic Recommendations Trades Closed in 2022
Table 1
Q2-2022 Earnings Commentary
Q2-2022 Earnings Commentary
Q2-22 reporting season is of paramount importance for investors as it may help shape market expectations into the balance of the year. After all, the multiples compression stage of the bear market, driven by entrenched inflation and monetary tightening, is likely complete. Now all eyes are on the growth and the ability of the companies to navigate the economy that is being slowed down by the Fed. The following is a quick snapshot of the results and expectations: As of July 20th, 60 S&P 500 companies have reported. According to Refinitiv, the S&P 500 EPS is expected to grow at 5.9% this quarter based on the expectations and the early results (blended). Excluding the Energy sector, the blended growth rate drops to -3.5% (Table 1). The S&P 500 blended sales growth is expected to be 11.2%. Excluding Energy, the rate falls to -3.9% (Table 1). 24 of the 60 companies that have reported are in the Financials sector, making it the only sector with a “critical mass” of results (24 out 42 in the sector). So far, the Financials sector has delivered a sales surprise of 1.3%, and an earnings surprise of 4.2% with 75% of companies beating analyst earnings expectations. The caveat here is that the bar for the sector has been set low, with analysts expecting earnings to contract by 21.7%. Some initial thoughts: Sales growth expectations by far exceed earnings growth expectations, signaling margins compression, and exacerbating trends that have started in Q1-2022. We have anticipated 2022 margins compression in the “Marginally Worse” report back in October 2021. So far corporate results have been reassuring, with a high share of companies beating both sales and earnings expectations. However, it is too early to draw far-reaching conclusions. On a positive note, the largest US banks have reported that their Net Income Margins (NIM) have expanded and describe US consumers as “healthy”. However, there are some red flags and negative guidance: Most banks have increased non-performing loan reserves which reflect their concerns about slowing growth and deteriorating credit conditions. Companies are reporting the adverse effects of withdrawing from Russia – IBM. The largest technology companies have announced hiring slowdowns on the back of the weakening demand for their products and overall concerns about the economy – Apple, Google, Amazon Companies across the board are mentioning the negative effects of dollar appreciation on their earnings from abroad – Microsoft pre-announcement, Johnson & Johnson, Pepsico, IBM, Halliburton, Netflix Slowdown in demand for chips – Micron, Nvidia Forward guidance has also been concerning. Most companies talk about deteriorating economic conditions. Chart 1
CHART 1
CHART 1
Despite the negative commentary summarized above, so far earnings have been strong. Then why are we worried about corporate earnings? First, analysts are still forecasting earnings to grow at about a 10% rate over the next 12 months despite ubiquitous negative corporate guidance. As Chart 1 highlights, most of that EPS growth is expected to come in Q3-22, which implies that over the next several months at least some of the macro headwinds (slowing growth, the hawkish Fed, stubborn inflation, energy crisis, and rising wages) will dissipate. We don’t consider this to be a high probability outcome as we are now halfway through the quarter, and macroeconomic conditions are not improving. Moreover, analysts themselves have little confidence in their own forecasts as is evident in the elevated earnings uncertainty (Chart 2). In all likelihood, downgrades are on the way. Second, our earnings growth regression model indicates that earnings growth is slowing, and earnings recession is likely within six months or so (Chart 3). Chart 2
CHART 2
CHART 2
Image
Bottom Line: We continue to recommend that investors remain patient and prudent in the range-bound markets. Earnings growth is likely to deteriorate into the year end.