Developed Countries

Dear Clients, Next week we will attend the BCA Investment Conference in New York. Therefore we will not publish our regular report. We will resume regular publication in the week of September 12. We apologize in advance for any inconvenience. Thank you, Matt Gertken, Senior Vice President US Political Strategy Executive Summary Top Issues On Voters’ Minds
Waiting On The Biden Doctrine
Waiting On The Biden Doctrine
President Biden has a foreign policy but not yet a foreign policy doctrine. The Biden Doctrine will emerge after critical tests. These tests are likely to be imminent, signaling more volatility and negative surprises for global investors. The three key foreign policy tests are: the Russia-EU energy crisis, the Iran nuclear crisis, and the fourth Taiwan Strait crisis. Of these, only Iran is looking like it could become a win for Biden – and a boon for markets – but even there deal is not yet confirmed. Biden’s foreign policy is domestically focused given the looming midterm elections. The result is likely to be high or higher volatility in the short run. Recommendation (Tactical) INITIATION DATE Return Long DXY (Dollar Index) Feb 23, 2022 13.1% Bottom Line: Stay defensive and long US dollar in the short run. The fourth quarter could be a turning point but for now political risk remains negative for risk assets. Feature Successful US presidents establish a foreign policy doctrine. The doctrine should not be defined by ideas and ideals but rather by the test of reality and experience – i.e. the decisions the president makes during crises. The Biden administration has a foreign policy and it has been tested in Ukraine. The focal point is to strengthen US alliances – even if that means deferring to allies’ interests on critical points. For example, while the US wanted to sell natural gas to Europe at the expense of Russia, Biden approved of Germany’s decision to finish building and operate the Nord Stream 2 pipeline to Russia in summer 2021. He condoned this decision even though Russia was already threatening Ukraine with invasion. Once Russia invaded, Germany froze the pipeline. The US had given its ally a choice, the choice ended badly, and now the ally is more certain that its interest lies with the United States. Bottom Line: The Biden administration’s foreign policy aims to restore US alliances and thus looks for the common denominator among allies. Biden’s Reactive Foreign Policy Biden’s foreign policy is fundamentally defensive, not offensive like that of the Trump administration. Trump initiated a trade war with China and others, revoked several international deals, tried to build a wall on the Mexican border, and imposed “maximum pressure” sanctions on Iran. By contrast, Biden, who entered office with a weak grip on Congress and a rebellion at the capitol, preferred to focus on domestic politics and social issues. He preferred to be reactive rather than proactive abroad, slapping sanctions on Russia only after it invaded Ukraine and so far avoiding major new sanctions on Iran or China. Biden’s foreign policy has also been reactive in the sense that it aims to win the approval of his domestic audience. Biden is a first-term US president, he faces midterm elections and the potential for re-election in 2024 – and the odds for him and his party are not great (Chart 1). Elections encourage him to maximize domestic legislation and minimize risks on the international scene. Chart 1Midterm Election Odds From The Street
Waiting On The Biden Doctrine
Waiting On The Biden Doctrine
The second term – when the president is no longer eligible for re-election and could become a “lame duck” – is opportune for prioritizing national interests over partisan interests and taking risks abroad. The 2022 midterm election fits into this rubric: Biden’s foreign policy this year has been domestically focused and will continue to be through November. Biden’s goal must be balanced: to pursue his foreign policies but avoid worsening the Democratic Party’s difficulties at the voting booth. Our quantitative election models show that Democrats are likely to lose 21 seats in the House of Representatives (Table 1) and two seats in the Senate (Chart 2), thus losing control of all Congress to Republicans. The Senate is uncertain but the House is not. Given that the Senate is highly competitive, Biden must tread carefully to avoid worsening the economy or suffering a policy humiliation. Table 1BCA’s US House Election Quant Model
Waiting On The Biden Doctrine
Waiting On The Biden Doctrine
Chart 2BCA’s US Senate Election Quant Model
Waiting On The Biden Doctrine
Waiting On The Biden Doctrine
Hence while sanctions on Russia have pushed up energy prices and given ammunition to critics at home, Biden has encouraged Europe to take a pragmatic and gradual approach so as to soften the blow. The EU agrees for its own reasons and the oil embargo will not fully kick in until December 5, after the midterm election. Bottom Line: The Biden administration’s foreign policy is focused on its domestic audience, which means that midterm elections will continue to drive US foreign policy this year. Taking Risks Before The Midterms Since May we have observed that the Ukraine war and Biden’s midterm woes have stirred the administration into taking greater risks in its foreign policy. If American interests are asserted, Biden will look stronger at home. If a crisis erupts, Americans will rally around the flag. For example, Biden agreed to sell long-range artillery rockets (HIMARS) to Ukraine and provide higher value targeting intelligence to Ukraine. Biden expanded export controls on China and agreed to send legislators and eventually a new arms package to Taiwan. The current crisis in the Taiwan Strait arose because of the Biden administration’s initiatives – House Speaker Nancy Pelosi’s trip. Similarly Biden has not, as of August 31, provided Iran with the concessions necessary to clinch a nuclear agreement, raising the risk of rising tensions across the Middle East. He has slightly expanded sanctions, though, to be fair, the odds of an Iran deal are not low.1 We are contrarians on this issue and have put the odds of a deal at 40%, but rumors are swirling in the news media that a deal is at hand. In short, with his job approval rating falling to a net negative 13 percentage points (net negative 18 percentage points on his handling of the economy), Biden is increasingly willing to take foreign policy risks. The domestic focus of foreign policy is overwhelming its initial defensiveness. Biden’s policy is becoming more offensive, albeit still not to the same degree as the Trump administration’s. This shift in foreign policy does not line up well with what voters want. Voter priorities for the midterms are shaping up as follows: Economy: Voters are far more concerned about the economy than anything else (Chart 3, first panel). Biden’s foreign policy actions – sanctions on oil producers like Russia and Iran and tariffs on manufacturers like China – add to inflation, which is the top concern for voters within the economic sphere. Society: Voters are concerned about a range of social grievances such as gun policy, health care, crime, the electoral system. Abortion access and gun rights have become more important over the year, while foreign policy and energy policy have become less important (Chart 3, second panel). Foreign Policy: True, Biden’s foreign policy can tap into unfavorable views of Russia, Iran, and China (Chart 3, third panel). But voters are not demanding a more hawkish foreign policy in this election, so Biden’s decision to take more foreign policy risks this year must come from somewhere else. That somewhere else is the need to respond to foreign events, such as Russian invasions, but there is also the political expediency of stirring up nationalism, as is clear in the case of China. Chart 3Top Issues On Voters’ Minds
Waiting On The Biden Doctrine
Waiting On The Biden Doctrine
Bottom Line: Voters are focused on the economy and social issues but Biden must respond to international challenges. In doing so, Biden is increasingly willing to take risks as the Democrats could benefit from any crisis that leads to an outburst of nationalism and patriotism. Biden’s Foreign Policy And Anti-Inflation Drive Back in June the Biden administration unveiled an anti-inflation plan that consisted of (1) Fed rate hikes (2) a reconciliation bill (3) budget discipline. We pointed out that the first option was the only one that would truly reduce inflation – but that it would also bring recession within a year or two. Once the reconciliation bill passed, we showed how the Inflation Reduction Act would increase budget deficits and inflation, especially when taken along with other new legislation like the Chips and Science Act. More recently Biden’s $500 billion plan for student debt forgiveness has underscored the continuing inflationary bent of his policies. Gasoline prices have come down slightly over the summer but not to the extent that Democrats can declare victory (Chart 4). Midterm voters will feel the year-on-year increase in headline inflation. Chart 4Prices At The Pump
Prices At The Pump
Prices At The Pump
Market-based inflation expectations are rising again and consumers still report very high expectations for the one-year period, which is most relevant this fall (Chart 5). This brings us to Biden’s three foreign policy options for reducing inflation: reduce tensions with Russia, lift sanctions on Iran, and lift tariffs on China. Back in June we doubted that any of these would come to fruition. Now Biden faces a series of tests that will define his foreign policy doctrine: Chart 5Inflation Expectations Unabated
Inflation Expectations Unabated
Inflation Expectations Unabated
European Energy Crisis: Biden faces a European energy crisis stemming from Russia’s clash with NATO. Biden is providing Ukraine with extensive support in the form of money and weapons. That will continue in the short run as the Ukrainians are launching a counter-offensive against Russia. There are some signs of Russia signaling a willingness to negotiate but until Russia defeats the new counter-offensive it is highly unlikely to offer any serious concessions, or to relieve the pressure on Europe. The Biden administration has not yet accepted Russia’s broader demands, namely on the topic of NATO enlargement and whether NATO will ever try to station military bases in Finland or Sweden when they join the alliance (Table 2). Russia’s reaction to western policy is to constrict Europe’s energy supply further – namely shutting down the Nord Stream 1 pipeline – which will also tighten American energy supply via exports and exacerbate energy price inflation and expectations (Chart 6). Table 2US Response To Russia’s Demands On Finland, Sweden
Waiting On The Biden Doctrine
Waiting On The Biden Doctrine
Biden can allow slippage on sanction enforcement prior to the midterm but still his Russia policy will be a source of both conflict and inflation. Chart 6Russia Squeezes Europe Harder
Russia Squeezes Europe Harder
Russia Squeezes Europe Harder
Iranian Nuclear Crisis: Biden faces an Iranian nuclear crisis but it could be resolved quickly through a return to the 2015 nuclear deal. Apparently Biden is closer to clinching a deal. But the US and Iran do not trust each other, as shown in Chart 3 above. Biden could unilaterally relieve sanctions and allow Iranian their oil exports to pick up substantially (Chart 7). He can overcome Congress after a 30-day delay. But any deal will alienate the Saudi Arabians, who are threatening to cut oil production and reverse the oil price drop that Biden is seeking on behalf of US voters. So Iran is an option for Biden but it is not very compelling: the oil can be traded regardless of any deal. Biden’s capitulation would hurt politically without helping much economically. However, the failure of a deal poses a greater risk of instability in the Middle East and inflationary energy price shocks. So Biden faces an immediate and critical foreign policy test on this issue. Chart 7Iranian Oil Exports By Destination
Waiting On The Biden Doctrine
Waiting On The Biden Doctrine
Fourth Taiwan Strait Crisis: Biden also faces a crisis in relations with China over the One China Policy and the status quo in the Taiwan Strait. This is the fourth such crisis since 1954. In previous crisis the US sent aircraft carriers through the strait, including in 1995-96. But it is not clear that Biden will do so given that China’s capabilities are much greater today (Map 1). The crisis probably will not be resolved before the midterm election since China will remain firm given its own domestic concerns this fall. Recently there emerged a tentative deal on the US auditing Chinese firms that list on US stock exchanges and an attempt to restart talks on climate change cooperation. The US and China are still talking despite tensions. But Biden has ruled out the option of reducing tariffs … which would only marginally have reduced inflation anyway. Map 1US Aircraft Carriers Suggest Taiwan Risk Is Substantial
Waiting On The Biden Doctrine
Waiting On The Biden Doctrine
Bottom Line: Biden faces three foreign policy crises that threaten to exacerbate inflation. In each case he will likely uphold US security interests at the expense of higher inflation expectations in the short run. Investment Takeaways The Biden administration has a foreign policy but it does not yet have a foreign policy doctrine. The Biden Doctrine will be forged in the crucible of experience. The critical tests look to be coming soon. It will be difficult for Biden to pass the tests without fanning inflation expectations, at least in the short run. While bold action on Iran will not reduce oil prices as much as the consensus holds, a deal could avoid a worse scenario in which the Middle East destabilizes and energy shocks multiply. Investors should brace for more volatility, at least through the November 8 midterm election. Investors will need to see US-Russia, US-China, and US-Iran relations improve concretely and verifiably before determining that the geopolitical and macroeconomic backdrop are turning more favorable for risk assets. Matt Gertken Senior Vice President Chief US Political Strategist mattg@bcaresearch.com Footnotes 1 See Ivana Saric, “Biden administration ramps up Iran sanctions as nuclear talks falter,” Axios, June 16, 2022, axios.com; Ellen Nakashima, “Biden administration slaps export controls on Chinese firms for aiding PLA weapons development,” Washington Post, April 8, 2021, washingtonpost.com; see also Karen Freifeld, “Biden administration reviewing China chip export policies, official says,” Reuters, July 14, 2022, reuters.com. Strategic View Open Tactical Positions (0-6 Months) Open Cyclical Recommendations (6-18 Months) Table A2Political Risk Matrix
Waiting On The Biden Doctrine
Waiting On The Biden Doctrine
Table A3US Political Capital Index
Waiting On The Biden Doctrine
Waiting On The Biden Doctrine
Chart A1Presidential Election Model
Third Quarter US Political Outlook: Last Ditch Effort
Third Quarter US Political Outlook: Last Ditch Effort
Chart A2Senate Election Model
Third Quarter US Political Outlook: Last Ditch Effort
Third Quarter US Political Outlook: Last Ditch Effort
Table A4House Election Model
Waiting On The Biden Doctrine
Waiting On The Biden Doctrine
Table A5APolitical Capital: White House And Congress
Waiting On The Biden Doctrine
Waiting On The Biden Doctrine
Table A5BPolitical Capital: Household And Business Sentiment
Waiting On The Biden Doctrine
Waiting On The Biden Doctrine
Table A5CPolitical Capital: The Economy And Markets
Waiting On The Biden Doctrine
Waiting On The Biden Doctrine
Executive Summary Low-Yielding Countries Facing High USD Hedging Costs
Low-Yielding Countries Facing High USD Hedging Costs
Low-Yielding Countries Facing High USD Hedging Costs
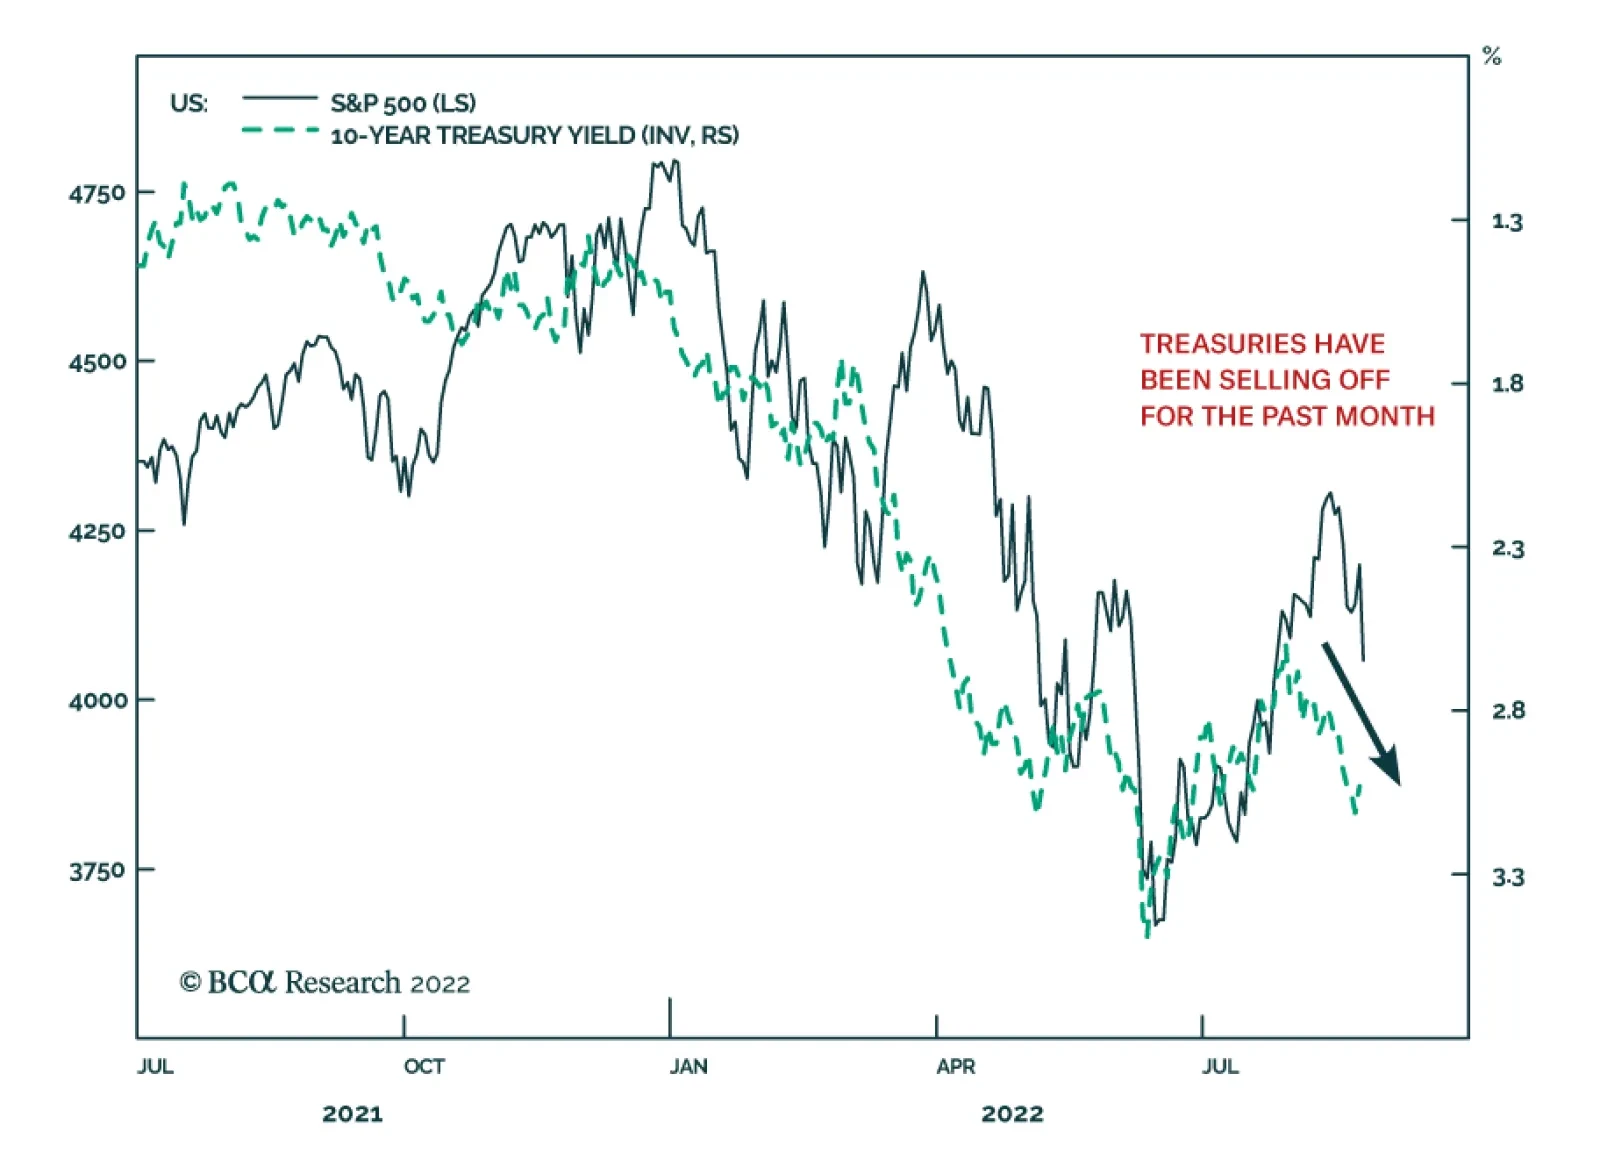
The US dollar will remain strong alongside continued Fed rate hikes. Interest rate differentials will remain positive for the greenback, alongside other USD-positive factors like slowing global growth and rising investor risk aversion. Relatively high US interest rates have made hedging away US currency risk very expensive for some of the largest holders of US Treasuries like Japan. US Treasury yields, on an FX-hedged basis, look unattractive relative to local currency denominated bonds across the developed world. Increased foreign demand for US Treasuries evident in the US TIC data appears to reflect a re-establishment of positions unwound by global hedge funds and mutual funds dating back to the 2020 “dash for cash” in global financial markets. UST yields must rise even further versus non-US yields to attract more fundamental buyers like Japanese and European institutional investors, given elevated volatility in both US Treasury prices and the dollar. Bottom Line: Global investors should continue to underweight US Treasuries in global bond portfolios, on both a currency-unhedged and USD-hedged basis. Feature Dear Client, The schedule for the next two Global Fixed Income Strategy reports will be impacted by the upcoming Labor Day holiday and next week’s BCA’s annual conference in New York (I hope to see you there!). This Friday, September 2, we will be publishing a joint report with our colleagues at Foreign Exchange Strategy discussing Japan. On Monday, September 12, we will be publishing another joint report with our colleagues at European Investment Strategy, covering estimates of global neutral interest rates. -Rob Robis The title of our report from four weeks ago was “Dovish Central Bank Pivots Will Come Later Than You Think.” This could have also been the title for Fed Chair Jerome Powell's Jackson Hole speech. He reiterated the Fed’s commitment to tighten policy further and “keep at it” until the US economy slows enough to bring down inflation. Other central bankers who spoke at the conference had a similar tone to Powell, talking up an ongoing inflation fight that will require much slower growth and higher unemployment. Related Report Global Fixed Income StrategyRecent USD Strength Is Not Bond Bullish By quickly and bluntly dispensing any notion that the Fed could soon pause its rate hiking cycle, Powell poured ice cold water on the risk asset rally that boosted the S&P 500 by nearly 17% between mid-June and mid-August. The S&P 500 plunged 3.4% after Powell’s speech, a tightening of US financial conditions that was likely welcomed by the Fed, as it helps their goal of slowing the US economy. Minneapolis Fed President Neil Kashkari even said he was “happy” to see the negative market reaction to Powell’s speech. Powell, Kashkari and the rest of the FOMC are probably happy over the strength of the US dollar, which is also helping tighten US financial conditions – while also having a major impact on global bond returns and currency hedging decisions for investors. A Collision Of A USD Bull Market & Global Bond Bear Market Chart 1A Big Move In The USD
A Big Move In The USD
A Big Move In The USD
The current strength of the US dollar is becoming increasingly broad-based. The EUR/USD exchange rate has fallen below parity, while USD/JPY continues to flirt with the 140 level (Chart 1). The British pound is trading at a 2-year low versus the US dollar, many important emerging market (EM) currencies are struggling, and the Chinese renminbi is set to retest the 7.0 level. The strength of the US dollar is no recent phenomenon. The current uptrend dates back to the start of 2021, with the DXY dollar index up 21% since then. The dollar bull market has been supported by several factors, most critically rising US interest rates. The 2-year US Treasury yield started 2021 just above 0% and now sits at 3.4%. Higher US interest rates have raised the benefit of hedging currency risk into US dollars for global bond investors. The Bloomberg Global Aggregate Bond Index in USD-hedged terms has outperformed the unhedged version of the index by 6.3% over the past year, one of the largest such increases dating back to 2000 (Chart 2). This means that global bond investors have been paid handsomely to simply swap non-US bond exposures into US dollars – in some cases, making low-yielding assets like Japanese government bonds (JGBs), hedged from yen into dollars, comparable to US Treasury yields. Chart 2Big Gains From Hedging Global Bond Exposure Into USD
Big Gains From Hedging Global Bond Exposure Into USD
Big Gains From Hedging Global Bond Exposure Into USD
This wedge between USD-hedged and unhedged bond returns is unlikely to reverse soon, as the fundamental drivers of the dollar remain biased to more dollar strength. The US dollar is not only supported by more favorable interest rate differentials versus other currencies (both in nominal and inflation-adjusted terms), but is also benefitting from its safe haven status at a time of considerable uncertainty on the future of the global economy (Chart 3). Global growth expectations are depressed and showing no signs of turning around anytime soon, particularly in Europe and the UK where electricity and gas prices are climbing at a record pace. The dollar not only typically appreciates during periods of slowing growth, but also during episodes of investor risk aversion. Investors remain cautious, according to indicators like the US equity put/call ratio which shows greater demand for downside protection via puts – an outcome that also typically coincides with a stronger US dollar. In this current environment of broad-based US dollar strength, the gap between hedged and unhedged bond returns has varied widely depending on the base currency of the investor. For a euro-based investor, the performance gap between the unhedged Global Aggregate index and the EUR-hedged index has been 6% over the past year (Chart 4). Chart 3USD Strength Supported By Key Fundamental Drivers
USD Strength Supported By Key Fundamental Drivers
USD Strength Supported By Key Fundamental Drivers
Chart 4FX Hedging Decisions Mean Everything In A Global Bond Bear Market
FX Hedging Decisions Mean Everything In A Global Bond Bear Market
FX Hedging Decisions Mean Everything In A Global Bond Bear Market
Chart 5Low-Yielding Countries Facing High USD Hedging Costs
Low-Yielding Countries Facing High USD Hedging Costs
Low-Yielding Countries Facing High USD Hedging Costs
The gap has been even larger for yen-based investors, with the unhedged index beating the JPY-hedged index by a whopping 13% over the past twelve months. Although Japanese fixed income investors are not typically known for taking unhedged currency risk on foreign bond holdings, doing so would have turned an awful year of global bond returns into a great year, simply due to yen weakness. When looking at current levels of interest rate differentials versus the US, which are the main determinant of currency hedging costs, the low yielding currencies like the euro, yen and Swiss franc see the greatest gain on returns versus the high-yielding US dollar (Chart 5). Hedging euros into dollars results in an annualized pickup of 252bps, while hedging yen into dollars produces an even bigger gain of 327bps. At the same time, the USD-hedging gains for relatively higher yielders are much lower. Hedging Australian dollars into US dollars only produces an annualized gain of 48bps, while hedging Canadian dollars into US dollars produces an annualized loss of -18bps. These varying hedging costs matter for global bond investors, as they impact the attractiveness of an individual country’s bond yields, depending on the investor’s base currency. We show the unhedged yield levels, and currency-hedged yield levels for six main developed market base currencies (USD, EUR, JPY, GBP, CAD, AUD) in the tables on the next two pages. Table 1 shows 2-year government bond yields, Table 2 shows 5-year government bond yields, Table 3 shows 10-year government bond yields and Table 4 shows 30-year government bond yields. Unsurprisingly, hedging into euros and yen, where short-term interest rates are the lowest, produces the smallest yields. Meanwhile, hedging into higher-rate currencies like US dollars and Canadian dollars generates the highest yields. Table 1Currency-Hedged 2-Year Government Bond Yields
Currency Hedging Matters More Than Ever For Bond Investors
Currency Hedging Matters More Than Ever For Bond Investors
Table 2Currency-Hedged 5-Year Government Bond Yields
Currency Hedging Matters More Than Ever For Bond Investors
Currency Hedging Matters More Than Ever For Bond Investors
Table 3Currency-Hedged 10-Year Government Bond Yields
Currency Hedging Matters More Than Ever For Bond Investors
Currency Hedging Matters More Than Ever For Bond Investors
Table 4Currency-Hedged 30-Year Government Bond Yields
Currency Hedging Matters More Than Ever For Bond Investors
Currency Hedging Matters More Than Ever For Bond Investors
We take the analysis a step further in the next set of tables on pages 9-11. Here, we take the hedged yields for each currency and compare them to the yields of the base currency. For example, in Table 5, it can be seen that a 2-year US Treasury yield of 3.4%, hedged into euros, produces a yield of 0.82% that is -17bps below the 2-year German yield (which is obviously denominated in euros). In other words, from the point of view of a euro-based investor who wants to hedge away the currency risk in a global bond portfolio, he gets paid a bit more to own a German bond over a US Treasury. Table 5Currency-Hedged 2-Year Govt. Bond Yield Spreads
Currency Hedging Matters More Than Ever For Bond Investors
Currency Hedging Matters More Than Ever For Bond Investors
Similar results are shown in the subsequent tables for 5-year yields (Table 6), 10-year yields (Table 7) and 30-year yields (Table 8). From these tables, we can make the following broad conclusions: Table 6Currency-Hedged 5-Year Govt. Bond Yield Spreads
Currency Hedging Matters More Than Ever For Bond Investors
Currency Hedging Matters More Than Ever For Bond Investors
Table 7Currency-Hedged 10-Year Govt. Bond Yield Spreads
Currency Hedging Matters More Than Ever For Bond Investors
Currency Hedging Matters More Than Ever For Bond Investors
Table 8Currency-Hedged 30-Year Govt. Bond Yield Spreads
Currency Hedging Matters More Than Ever For Bond Investors
Currency Hedging Matters More Than Ever For Bond Investors
For USD-based bond investors, all non-US markets except Canada have a yield pickup over US Treasuries on an FX-hedged basis For EUR-based investors, all non-euro area markets except Australia produce yields lower than those of Germany on an FX-hedged basis For GBP-based investors, all non-UK bond markets except the US and Canada have yields greater than those of Gilts for maturities from 5-30 years (the results are more mixed across countries for 2-year yields) For JPY-based investors, euro area and Australian bonds are clearly more attractive than JGBs on an FX-hedged basis, while US Treasuries, UK Gilts and Canadian government bonds offer FX-hedged yields below puny JGB yields. This is true up to the 10-year maturity point, as 30-year JGB yields – which are not targeted by the Bank of Japan in its yield curve control program – are much higher than those on the rest of the JGB curve For CAD-based investors, hedging virtually all non-Canadian bonds into CAD results in yields that are higher than Canadian government bond yields, with the largest hedged yield advantage for euro area and Australian bonds For AUD-based investors, only euro area bonds offer a consistent yield pickup over Australian government bonds on an FX-hedged basis. Broadly speaking, government bonds in the euro area and Australia offer consistently attractive FX-hedged yield pickups over the unhedged bonds for all currencies shown in the tables. On the other hand, Canadian government bonds have consistently less attractive FX-hedged yields across all currencies shown. Perhaps most importantly, US Treasuries look unattractive on an FX-hedged basis to all but CAD-based investors – a result that has meaningful implications for the potential of foreign buying to help stem the rise of US bond yields. Bottom Line: The US dollar bull market is having a huge influence on global bond returns. US Treasury yields, on an FX-hedged basis, look unattractive relative to most local currency denominated bonds across the developed world. Who Are The Foreign Buyers Of US Treasuries? When simply looking at currency-unhedged yield spreads, US Treasury yields offer particularly inviting yields over low-yielding (and low “beta” to US yields) markets like Germany and Japan. The unhedged 10-year US-Germany spread is now 160bps, while the unhedged US-Japan spread is up to 286bps (Chart 6). Meanwhile, among high-beta markets, the US-Canada 10-year spread is flat on an FX-unhedged basis, while an unhedged Australian 10-year bond yields 56bps more than a 10-year US Treasury. Chart 6UST Yields Only Look Attractive In FX-Unhedged Terms
UST Yields Only Look Attractive In FX-Unhedged Terms
UST Yields Only Look Attractive In FX-Unhedged Terms
Yet after factoring in the currency hedging costs shown earlier, US Treasuries look consistently unattractive versus the other major developed economy bond markets. Chart 7UST Yields Look Unattractive After Hedging Out USD Exposure
UST Yields Look Unattractive After Hedging Out USD Exposure
UST Yields Look Unattractive After Hedging Out USD Exposure
A 10-year US Treasury hedged into euros now yields -77bps less than a 10-year German bund, at the low end of the historical range for this spread dating back to 2000 (Chart 7). A 10-year Treasury hedged into GBP and JPY also offers lower yields versus 10-year UK Gilts (-11bps) and 10-year JGBs (-50bps), respectively. The 10-year hedged US-Australia spread (with the US yield hedged into AUD) is also at a stretched negative extreme at -114bps (Chart 8). Despite these broadly unattractive hedged US yield spreads, the US Treasury market has seen significant foreign inflows this year, according to the US Treasury Department’s capital flow (TIC) data. Total net purchases of US Treasuries by foreign buyers accelerated to $470bn (on a 12-month rolling total basis) as of the latest data for June (Chart 9). When broken down by type of buyer, private buyers bought a net $619bn, while official buyers were net sellers to the tune of -$149bn. Chart 8No Compelling Yield Advantage To Owning FX-Hedged USTs
No Compelling Yield Advantage To Owning FX-Hedged USTs
No Compelling Yield Advantage To Owning FX-Hedged USTs
When looking at the TIC data by country, China was an important net seller of -$18bn of Treasuries. This is consistent with the reduced demand for US dollar assets from China, where policymakers are actively targeting a weaker renminbi. Chart 9TIC Data Shows USTs Seeing Foreign Buying (Ex-China)
TIC Data Shows USTs Seeing Foreign Buying (Ex-China)
TIC Data Shows USTs Seeing Foreign Buying (Ex-China)
There was also net selling from many EM countries that have seen reduced trade surpluses and, hence, fewer US dollars to recycle into Treasuries. Chart 10Even Higher UST Yields Needed To Entice Japanese & European Buyers
Even Higher UST Yields Needed To Entice Japanese & European Buyers
Even Higher UST Yields Needed To Entice Japanese & European Buyers
The largest net buying (Chart 10) was seen from the UK (+$306bn) and Cayman Islands (+$154bn) – the latter being a large source of Treasury buying through hedge funds and offshore investment funds located there. Those two countries accounted for almost all of the net foreign inflows into Treasuries, despite the fact they only hold a combined 12% of all foreign US Treasury holdings. There was modest net buying from the euro area (+$37bn) and small net selling by the country with the largest stock of US Treasury holdings, Japan. The relatively subdued inflows from Europe, and lack of inflows from Japan, are consistent with the unattractive hedged US-Europe and US-Japan yield spreads shown earlier, particularly at a time of elevated US bond yield volatility. The huge inflows from the UK and Cayman Islands are harder to explain on a fundamental basis, but are likely due to a continued normalization of Treasury market liquidity after the spring 2020 “dash for cash”. In a report published back in January, Fed researchers analyzed foreign demand for US Treasuries around the worst of the COVID pandemic shock in 2020. The report concluded that the huge collapse in private inflows into Treasuries – from a peak of +$238bn at the start of 2020 to a trough of -$373bn at the end of 2020 – was the result of aggressive net selling by hedge funds and global mutual funds. These are exactly the types of investors that would be domiciled in the Cayman Islands and UK (London). Specifically, the Fed report noted that: “In short, two prominent reasons for the large sales are the unwind of the Treasury basis trade by hedge funds (including foreign-domiciled funds) and the sudden, massive investor outflows from mutual funds that caused these funds to sell their most liquid assets, U.S. Treasury securities, to meet these redemptions.” The “basis trade” mentioned likely involved buying cash Treasuries versus selling Treasury futures, attempting to exploit unsustainable price differences between the two. As market liquidity conditions dried up in the spring of 2020 during the first wave of global lockdowns, leveraged bond investors needed to frantically unwind positions. For Treasury basis trades, that would have involved selling cash Treasuries, which was likely what is being picked up in the TIC data from the Cayman Islands which showed a huge plunge in net buying in 2020. The mutual fund outflows were likely a global phenomenon, but given the large fund management presence in London, the huge net selling of Treasuries from the UK in 2020 were almost certainly related to global fund managers, not purely UK investors. As Treasury market liquidity conditions normalized in 2021 and 2022, those large sellers in the UK and Cayman Islands (and other offshore investment locations) have likely turned into big net buyers, as evidenced from the TIC data. However, the modest inflows from Europe, and outflows from Japan, tell a more important story about the fundamental demand for US Treasuries. Treasury yields must rise further, widening both currency-hedged and unhedged spreads versus non-US government bonds to more historically attractive levels, to entice more foreign buying. Bottom Line: UST yields must rise even further versus non-US yields to attract more fundamental buyers like Japanese and European institutional investors, given elevated volatility in both US Treasury prices and the dollar. Global investors should underweight US Treasuries in global bond portfolios, on both a currency-unhedged and USD-hedged basis. Robert Robis, CFA Chief Fixed Income Strategist rrobis@bcaresearch.com GFIS Model Bond Portfolio Recommended Positioning Active Duration Contribution: GFIS Recommended Portfolio Vs. Custom Performance Benchmark
Currency Hedging Matters More Than Ever For Bond Investors
Currency Hedging Matters More Than Ever For Bond Investors
The GFIS Recommended Portfolio Vs. The Custom Benchmark Index Global Fixed Income - Strategic Recommendations*
Currency Hedging Matters More Than Ever For Bond Investors
Currency Hedging Matters More Than Ever For Bond Investors
Tactical Overlay Trades
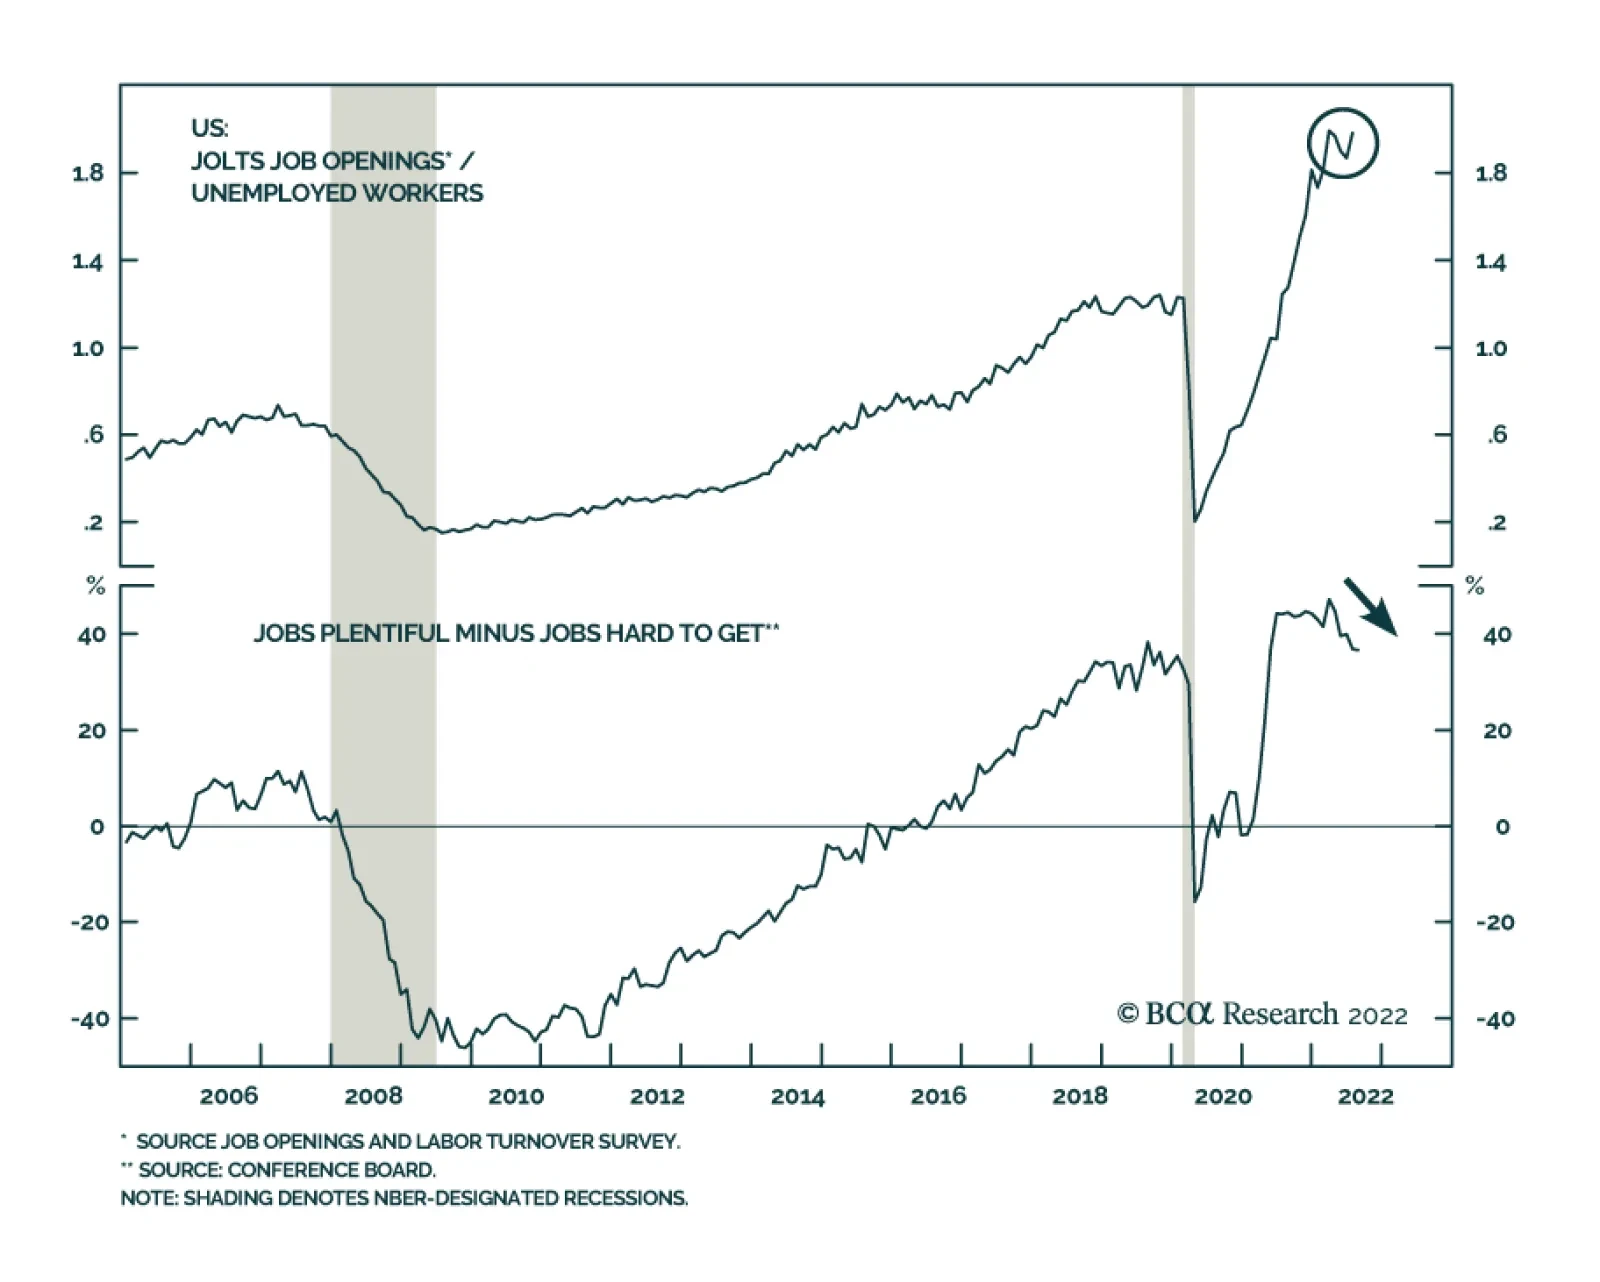
After having declined for three consecutive months, job openings unexpectedly rose to 11.2 million in July, from an upwardly revised 11 million in June, beating expectations they would continue to decrease. Transportation, warehousing and utilities, as well…
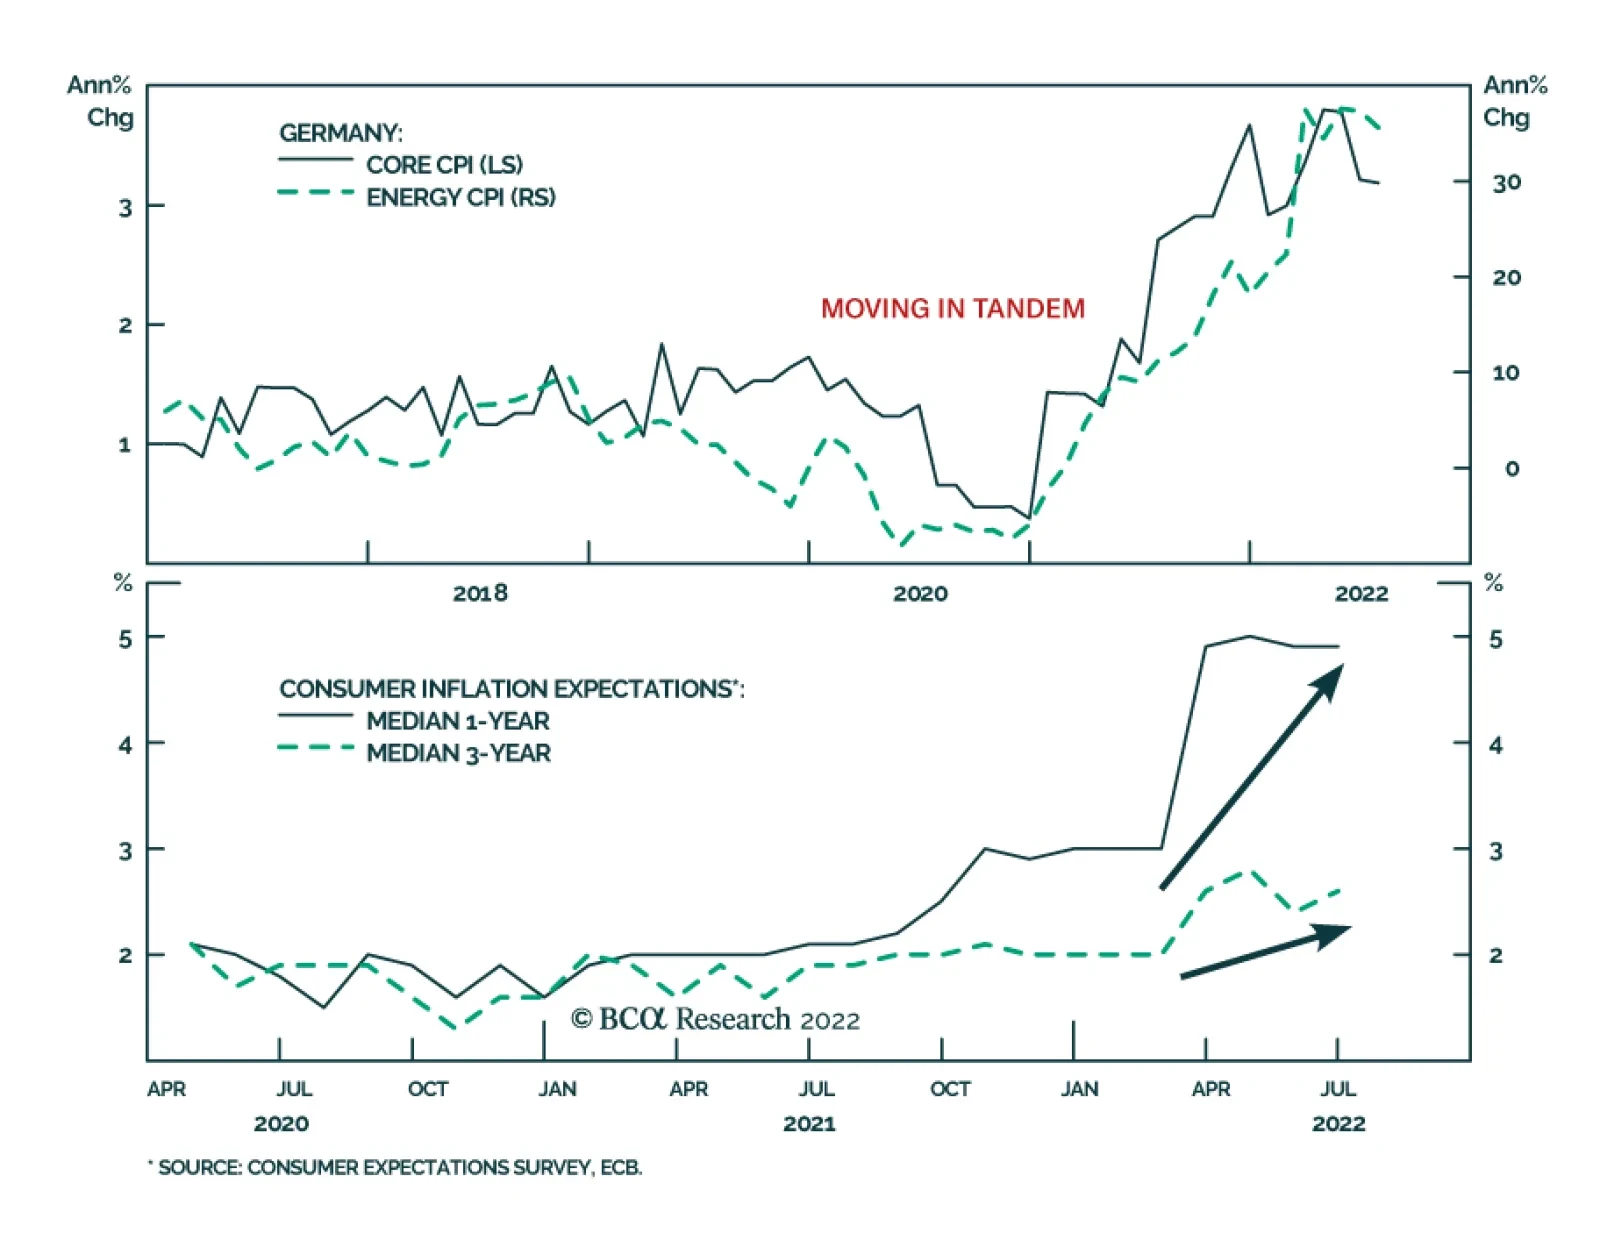
Preliminary estimates indicate that German inflation accelerated from 7.5% y/y to 7.9% y/y in August (8.8% y/y for CPI inflation calculated according to the EU’s harmonized methodology). Higher energy prices – which surged by 35.6% y/y in August – have been…
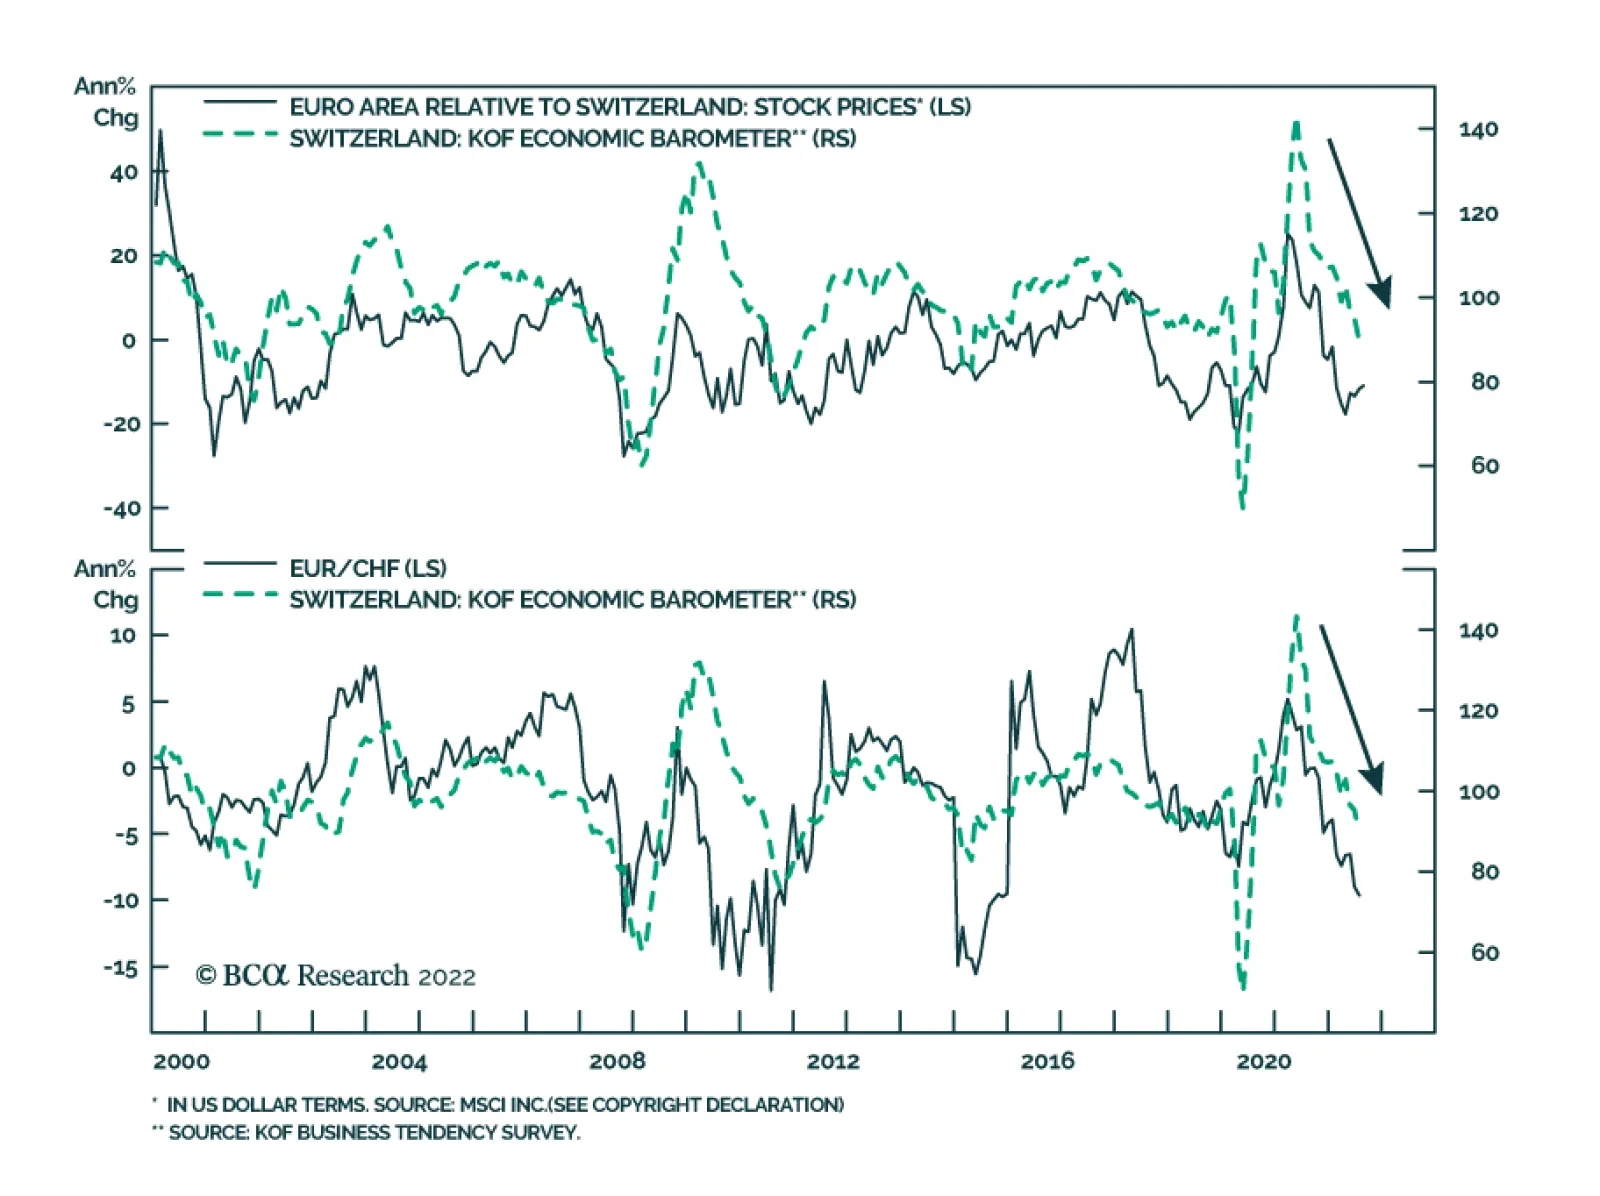
The Swiss KOF Economic Barometer continued its descent in August, falling four points to 86.5 – below its long-term average. The deterioration was broad-based with all variable groups contributing negatively to the headline index. The weak print sends a…
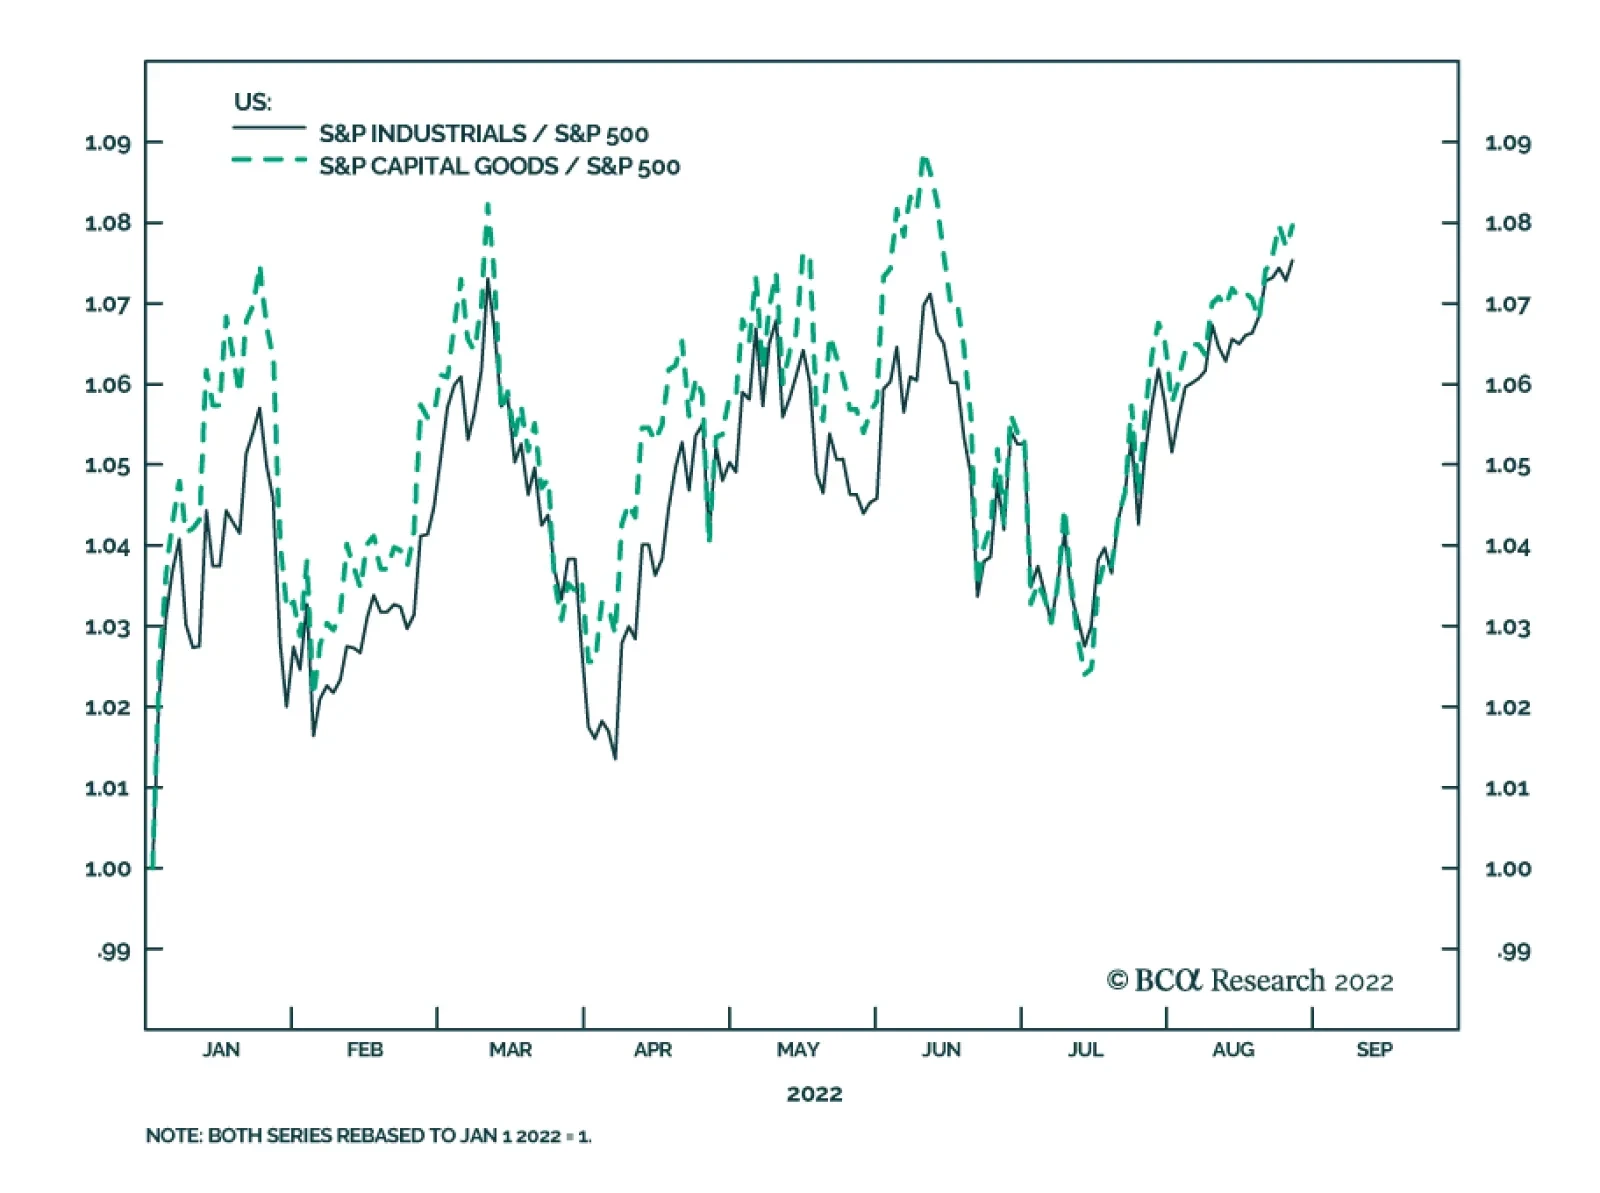
US industrial stocks face conflicting forces. On the one hand, the macroeconomic environment poses challenges to this sector. Industrial stocks typically underperform when economic growth conditions deteriorate. Our US Equity strategists recently showed…
Over the past couple of trading sessions, equities around the world have been under downwards pressure as they digest the hawkish commentary from central bankers at the Jackson Hole Symposium. The S&P 500 and Euro Stoxx 50 are down by 4% and 2.8%…
According to BCA Research’s European Investment Strategy service, it is still too early to overweight European equities. Euro Area stocks are much cheaper than their US counterparts, but too many headwinds continue to blow that are likely to weigh on…
Executive Summary Reshoring And FDI Job Creation Have Accelerated After The Pandemic
Industrials: A Trifecta Of Positives
Industrials: A Trifecta Of Positives
The US is entering a period of an industrial boom thanks to limited manufacturing capacity paired with strong demand for industrial and consumer goods. In addition, a trifecta of positive developments is further boosting US manufacturing: Onshoring, automation, and fiscal stimulus. Onshoring has accelerated after the onset of the pandemic and reshoring announcements are growing steadily. Automation and robotization allow industrial companies to circumvent labor shortages and rising wages and, hence, boost their profit margins. The domestic political landscape in the US is also favorable for industrial stocks given the three major legislative Acts (Infrastructure Investment & Jobs, Inflation Reduction, and National Defense Authorization) that will secure a healthy demand pipeline. While long-term trends are favorable for the sector, a macroeconomic backdrop of slowing growth is a headwind. However, thanks to a confluence of positive long-term trends, most companies are optimistic. Bottom Line: The US industrial sector is in the middle of a boom fueled by onshoring, automation, and favorable government policy. This trifecta of positives helps the sector to defy the gravity of the slowing economy. We remain overweight Industrials on both tactical and strategical time horizons but will continue to monitor it closely, watching out for potential cracks in operating performance. Feature A little over a year ago EMS, GIS, and USES co-published a report “Industrials as equity sector winner in the coming years”. In that report, we posited that the Industrial sector is poised for outperformance as it enjoys a boom thanks to strong new trends in onshoring and automation. In addition to the tectonic shifts described above, the sector has also found itself at the epicenter of the US legislative activity, which will provide a significant tailwind for its performance. Since we published the report on July 30, 2021, Industrials have performed in line with the S&P 500. However, since the beginning of the year, Industrials and Capital Goods outperformed the index by 7%, showing impressive resilience (Chart 1 and Table 1). Chart 1A Resilient Cyclical Sector
A Resilient Cyclical Sector
A Resilient Cyclical Sector
In this week’s report, we take a close look at the trends highlighted above and conduct a deep dive to evaluate whether the sector is still attractive on a tactical basis considering the backdrop of rising rates and slowing economic activity. Our focus is on the Industrial sector in general, and the Capital Goods Industry Group, in particular. We will also assess which industries are best positioned for outperformance. Table 1Industrials Outperformed On The Way Down And During The Summer Rally
Industrials: A Trifecta Of Positives
Industrials: A Trifecta Of Positives
Sneak Preview: The US industrial sector is in the middle of a boom fueled by onshoring, automation, and favorable government policy. This trifecta of positives helps the sector to defy the gravity of the slowing economy. For now, we are both strategically and tactically bullish on the sector but remain vigilant. US Manufacturing Capacity Has Been Severely Limited For Years US manufacturing capacity has been stagnant over the past 20 years, and the level of US manufacturing employment has declined by 30% since 2000 (Charts 2 & 3). Presently, manufacturing employment accounts for only 8% of total US employment. Chart 2US Manufacturing Employment Has Been Shrinking For Decades
US Manufacturing Employment Has Been Shrinking For Decades
US Manufacturing Employment Has Been Shrinking For Decades
Chart 3US Manufacturing Capacity Has Not Expanded In The Past Two Decades
US Manufacturing Capacity Has Not Expanded In The Past Two Decades
US Manufacturing Capacity Has Not Expanded In The Past Two Decades
The reason for the lack of capacity expansion over the past 20 years has been the outsourcing and shifting of production to other countries, especially China. The peak in US manufacturing capacity and employment occurred after the massive Asian currency devaluation in 1998 and China’s WTO admission in 2001. The semiconductor sector, which has recently come into the limelight, is a case in point: From 1990 to 2020, the percentage of chips manufactured in the US has fallen from 37% to 10%, with the lion’s share of chips manufactured in Asia. This trend has brought about The Chips Act which seeks to reverse the trend for national security reasons. Notably, more recently, the decline in manufacturing capacity and employment has started to reverse. More about this later. American Manufacturing Is Booming Again Limited manufacturing capacity paired with a strong demand for industrial and consumer goods translates into an industrial boom. Industrial companies are incentivized to expand given they are already operating at nearly full capacity (Chart 4) and enjoying considerable pricing power. Building industrial capacity in itself lifts demand for industrial goods and the US may be in the early innings of the new Capex cycle, unless the trend is derailed by headwinds from a significantly tighter monetary policy. After all, the age of US capital stock, at 24 years, is two years older than at previous peaks, indicating that many companies are overdue for replacing some of their equipment and machinery (Chart 5). Chart 4Industrial Companies Operate At Nearly Full Capacity
Industrial Companies Operate At Nearly Full Capacity
Industrial Companies Operate At Nearly Full Capacity
Chart 5The US Capital Stock Has To Be Renewed
The US Capital Stock Has To Be Renewed
The US Capital Stock Has To Be Renewed
Indeed, this may already be happening. According to S&P Dow Jones Indices, which analyzed second-quarter earnings season data, capital expenditures of the companies in the S&P 500, have been growing at a faster pace than stock repurchases for the first time since the first quarter of 2021, rising by 20% from a year earlier. Companies from Pepsi to Google to GM are investing in their production capacity, which in itself may be an encouraging sign that they are comfortable with the demand outlook. Of course, the caveat here is that industrials are late in cycle performance, as companies usually wait towards the end of the cycle to expand, only to find waning demand for their products. You Say “Reshoring,” I Say “Onshoring” A multi-decade decline in US manufacturing employment has started to reverse after the GFC, with the onset of the pandemic and geopolitical tensions accelerating the pace of reshoring and Foreign Direct Investing (FDI). Reshoring and FDI job announcements have increased from 6K in 2010 to 345K in 2022 (Chart 6). The resulting cumulative 950,000 incremental hires represent about 7% of US manufacturing employment. The acceleration of jobs coming back combined with the decline in the rate of offshoring has resulted in a 12-year steady uptrend in US manufacturing jobs. Truly amazing! Onshoring remains on top of mind for companies’ management. According to Statista, mentions of onshoring buzzwords in earnings calls and presentations of US public companies have increased from about 100 throughout 2020 to nearly 200 in Q2-2020. Chart 6Reshoring And FDI Job Creation Have Accelerated After The Pandemic
Industrials: A Trifecta Of Positives
Industrials: A Trifecta Of Positives
According to Morgan Stanley’s survey of more than 400 executives of large corporations from the US to Germany to Japan, the most important factor in supply chain decisions is geopolitical stability, followed by skilled labor, physical infrastructure, and a developed supply chain ecosystem. On nearly every count, the US outranked Europe, China, and Mexico. Some 18% of the companies planned to significantly expand US manufacturing in the next 12 months, while 36% anticipated doing so within three years. More than 40% of US companies were taking steps to “onshore” supply chains. The reasons are well publicized: The COVID crisis has revealed over-dependence on imports. China’s decoupling from the US, tensions in the Taiwan Strait, and the Russian/Ukraine war have invoked concerns about the reliability of the existing supply chains. Supply chain disruptions have highlighted corporate vulnerabilities and had made companies realize that “just-in-case” trumps “just-in-time.” The US is pursuing protectionist policies that are to benefit companies operating in the US, Mexico, and Canada. According to Reshoring Initiative,1 Industrial and Tech companies are at the forefront of reshoring: Electrical Equipment, Chemicals, Transportation Equipment, Computer, and Electronic Products, and Medical Equipment suppliers are the leaders in onshoring (Table 2). Many large manufacturers such as Caterpillar have implemented or announced plans to bring offshore manufacturing back to the US. Table 2Reshoring Jobs By Top 5 Industries
Industrials: A Trifecta Of Positives
Industrials: A Trifecta Of Positives
Will onshoring benefit some of the former manufacturing hubs? We believe it will, as Kentucky, North Carolina, Georgia, Ohio, and Alabama are the top five destinations (Table 3). However, there is a hitch. The US unemployment rate, which is at an all-time low of 3.5%, is certainly a speed limit. Moreover, companies that bring their businesses back home do realize that labor costs in this country are many times higher than, say, in Asia. Hence, one of the solutions they pursue is automation. After many years in the making, onshoring is finally gaining pace, benefiting the US manufacturing base. Table 32022 Projected Reshoring Jobs By Top 10 States
Industrials: A Trifecta Of Positives
Industrials: A Trifecta Of Positives
Automation To The Rescue! The Pace of Robotization And Automation Is Accelerating A critical constraint for the expansion of US manufacturing is the labor shortage. Open vacancies in manufacturing are now at a record high, 100% above the 2018 peak (Chart 7, top panel). Notably, industrial companies have been experiencing difficulties hiring qualified staff over the past 10 years which has led to high wage growth (Chart 7, bottom panel). Chart 7US Manufacturers Cannot Fill Vacant Positions, Wages Are Surging
US Manufacturers Cannot Fill Vacant Positions, Wages Are Surging
US Manufacturers Cannot Fill Vacant Positions, Wages Are Surging
Chart 8Automation Expands Profits Margins Of Global Industrials
Automation Expands Profits Margins Of Global Industrials
Automation Expands Profits Margins Of Global Industrials
One remedy is automation. Replacing labor with automation/robots allows companies to produce more and avoid a profit margin squeeze (Chart 8). In a recent report published by the International Federation of Robotics, industrial robots reported record preliminary sales in 2021 with 486,800 units shipped globally, a 27% increase from 2020. The US has been lagging behind other developed countries in terms of automation and robotization (Chart 9). However, labor shortages brought about by the pandemic appear to have “moved the needle.” According to the Association for Advancing Automation (A3),2 the number of robots sold in the US in 2021 rose by 27% over 2020 with 49,900 units installed. 2022 is on pace to exceed previous records, with North American companies ordering a record 11,595 robots. Chart 9US Has Been Lagging Other Developed Nations In Robot Installations
Industrials: A Trifecta Of Positives
Industrials: A Trifecta Of Positives
Non-automotive sales now represent 58% of the total, demonstrating a broadening reach of automation. Metals, Auto, and Food and Consumer Goods have the highest growth in the purchase of robots (Chart 10). Chart 10In 2021 The Pace Of Robot Installation Has Picked Up
Industrials: A Trifecta Of Positives
Industrials: A Trifecta Of Positives
Implications For Industrial Companies The Industrials sector is home to companies that create robots and offer automation solutions as well as companies on the receiving end of the trend. Both sellers and buyers are to benefit: Buyers Of Robots: Manufacturing companies automating production and enlisting robots into their operations will enjoy higher operating leverage, lower labor costs, and more resilient margins. It is easier to automate processes in manufacturing than in service sectors. Consequently, we believe profit margins in manufacturing will outperform those of service sector companies, where automation will be slower. Sellers Of Robots: The sizzling demand for robots demonstrates that technological breakthroughs are no longer just about the Tech companies, and many industrial companies are to benefit from these nascent trends. Rockwell Automation, Eaton, and Caterpillar are the leaders in industrial automation. These companies also reach across the aisle to software companies to leverage their expertise in data storage, computing, and artificial intelligence. Rockwell has just recently partnered with Microsoft, while others are acquiring software companies. Deere has acquired GUSS Automation, a pioneer in semi-autonomous springs for high-value crops. These companies are to benefit from strong demand for their products and should exhibit strong sales and profit growth. To meet strong demand, industrial/manufacturing companies will automate their processes. This will allow them to boost volume and cap costs resulting in widening profit margins. Uncle Sam Loves American Manufacturing Both Biden and Trump before him, have stated that their overarching objective is to revive America’s manufacturing. However, their methods were drastically different, with Trump introducing tax cuts and tariffs, while Biden leans heavily on fiscal stimulus. The following is a recap of some of the recent laws passed by Congress and signed by President Biden. Infrastructure Investment And Jobs Act The $1.2-trillion Infrastructure Investment and Jobs Act will increase US government non-defense spending to bring it to around 3% of GDP, a level comparable to the 1980s-90s and larger than the 2010s. The bill’s focus is on traditional infrastructure – roads, bridges, ports, and electrical grid modernization – but also includes more modern elements such as $65 billion for 5G broadband Internet and $36 billion for electric vehicles and environmental remediation (Table 4). Implementation of the bill is delayed to 2023-24. Table 4Itemized Infrastructure Plan
Industrials: A Trifecta Of Positives
Industrials: A Trifecta Of Positives
However, the market is forward-looking and companies in Construction & Engineering, and Building Products industries are already winners, and are up 12% in relative terms since the bill was passed on November 15, 2021. The potential increase in public construction will help offset a slump in residential construction on the back of the softening housing market (Chart 11). Chart 11The Increase In Public Construction Will Help Offset A Slump In Residential Construction
The Increase In Public Construction Will Help Offset A Slump In Residential Construction
The Increase In Public Construction Will Help Offset A Slump In Residential Construction
Inflation Reduction Act (IRA) The bill earmarks $370 billion for clean energy spending as well as EV tax credits for both new and used cars. We have written on the topic of “Green and Clean” and the effect of the IRA on renewable energy and EV industries, two industries that are major beneficiaries of the bill. However, the bill also creates an enormous opportunity for industrial companies, which can build and service renewable infrastructure, such as Quanta Services (PWR) and Eaton (ETN). Companies that produce and service wind turbines (GE) and solar batteries will also get a revenue boost from the package. Chips Act Congress has passed the CHIPS+ bill to alleviate the chip shortage and shore up US competitiveness with China. Money is earmarked for domestic semiconductor production and research, and factory construction. While the key beneficiaries are chip foundries, construction of new factories will require equipment and services of a wide range from industrial companies from Construction to Machinery. National Defense Authorization Act In December, the House and Senate Armed Services Committee leadership released the Fiscal Year 2022 National Defense Authorization Act (NDAA). This bill introduces an overall discretionary authorization of $768.2 billion including $740.3 billion for base Department of Defense programs and $27.8 billion for national security programs in the Department of Energy. At a later date, another $37 billion was amended to the bill to include $2.5 billion to help pay higher fuel costs; $550 million for Ukraine, funding for five ships, eight Boeing Co-made F-18 Super Hornet fighter jets, and five Lockheed Martin C-130 Hercules planes; and about $1 billion for four Patriot missile units. For FY 2023, the House has already passed $839 billion, which is $37 billion above the White House request. The Senate will work on the bill after the summer recess. But it is already clear that defense spending has become a bipartisan issue. The increase in the defense budget, as well as additional allocation of funds towards Ukraine, have been a major boost for the Aerospace and Defense industry. We overweighted the sector back in January and it is up 24% in relative terms. Overweight Or Not, That Is The Question Macroeconomic Backdrop Business Cycle: Performance of the Industrial sector tends to lag the business cycle, as sector customers tend to wait until they are sure of recovery and have high utilization of their existing capacity before they expand their own production. However, demand is not entirely cyclical, as the need to replace obsolete or aging equipment or machines is relatively stable. There is also a stark difference in behavior of the largest industrial companies and smaller companies in their ecosystems. Larger manufacturers are long-cycle as it takes months to build machines, planes, or equipment. These companies are less sensitive to the business cycle. On the other hand, their suppliers are “short cycle” as they sell parts to many customers, turn their inventory frequently, and are very sensitive to the economic condition. At present, as economic growth is slowing, long-cycle industrial companies are preferable to short-cycle ones. Despite a bifurcation in demand, Industrials tend to underperform in a generic economic slowdown (Chart 12). This is unsurprising as the relative performance of Industrials is correlated to industrial production and the ISM PMI (Chart 13). Chart 12Historically, Industrials Underperformed During The Slowdown Stage Of The Business Cycle
Industrials: A Trifecta Of Positives
Industrials: A Trifecta Of Positives
Chart 13Industrials Usually Underperform When IP And ISM PMI Decline
Industrials Usually Underperform When IP And ISM PMI Decline
Industrials Usually Underperform When IP And ISM PMI Decline
Chart 14Survey Of Capex Intentions Is Weakening
Survey Of Capex Intentions Is Weakening
Survey Of Capex Intentions Is Weakening
And while we touted the beginning of the new industrial boom in the US, and a brand new Capex cycle, we need to monitor it carefully, as multiple surveys of Capex intentions are decelerating (Chart 14). Tighter Monetary Policy: Another potential headwind comes from rising rates. After all, the higher cost of corporate borrowing may weigh on demand for industrial goods. However, historically, US industrial stocks outperformed the S&P 500 Index in the past 70 years during periods of rising bond yields, including the inflation decade of the 1970s (Chart 15). Industrial companies are well positioned to withstand inflation as strong pricing power allows them to pass on their costs to customers. Chart 15When Rates Rise, Industrials Outperform
When Rates Rise, Industrials Outperform
When Rates Rise, Industrials Outperform
The macroeconomic backdrop presents challenges to Industrial companies Fundamentals Are Strong Significant Pricing Power: While dangers are looming in the macroeconomic backdrop, so far industrial companies have been doing well thanks to their significant pricing power (Chart 16), which they enjoy due to high capacity utilization. The relationship between capacity utilization and selling prices is not linear but exponential. When capacity reaches its limit and shortages arise, potential buyers will likely be willing to pay considerably higher prices to secure the supply of goods that they require. High Operating Leverage: In addition to high pricing power, industrial companies enjoy high operating leverage, which implies that while the economy is growing, even if at a slower pace, they can easily convert sales into profits. This will not be the case when the economy is outright contracting – then high operating leverage will become a liability. Chart 16Industrials Enjoy Substantial Pricing Power
Industrials Enjoy Substantial Pricing Power
Industrials Enjoy Substantial Pricing Power
Strong Q2-2022 Earnings And Sales Results: This explains the strong Q2-2022 sales and earnings results of the Industrial sector. Industrial earnings grew at 17.4%, while its sales increased by 13.3% – a remarkable feat, considering that many companies, especially consumer-facing ones, are struggling with shrinking profitability – earnings growth of the Consumer Discretionary sector was down 12.6%. Clearly, business-to-business companies are faring much better than consumer-facing ones, whose demand was pulled forward by the pandemic, and whose customers are reeling from rising prices and are tightening their belts. Looking ahead, margins are expected to shrink by 0.5% (Chart 17), which is modest compared to the 2.5% contraction expected for the S&P 500. In terms of earnings growth expectations, they have fallen but still exceed the market by an impressive 10% even after a series of downgrades. Importantly, earnings growth in real terms is also positive (Charts 18 & 19). Chart 17Operating Margins Are Expected To Hold Up Well
Operating Margins Are Expected To Hold Up Well
Operating Margins Are Expected To Hold Up Well
Chart 18Industrial Earnings Will Grow Faster Than The Market
Industrial Earnings Will Grow Faster Than The Market
Industrial Earnings Will Grow Faster Than The Market
Chart 19Earnings Expectations Have Been Re-calibrated
Earnings Expectations Have Been Re-calibrated
Earnings Expectations Have Been Re-calibrated
What Companies Are Saying All the charts and numbers align well with what we have heard from companies during the earnings season. For instance, nearly every major player within its own respective sub-industry reported healthy demand, low inventories, and a hefty backlog this quarter. Here are a few quotes from the largest players: Caterpillar (CAT): “We expect production and utilization levels will remain elevated, and our autonomous solutions continued to gain momentum … overall demand remained healthy across our segments … was unable to completely satisfy strong customer demand for our machines and engines.” MMM: “Continued strong demand for our solutions in semiconductor, factory automation, and automotive end markets.” GE: “In Renewables, … we are making progress. Our pricing has substantially improved onshore … we're growing our higher-margin businesses, such as grid automation, which delivered double-digit orders growth.” Honeywell (HON): “Orders were up 12% year over year and closing backlog was also up 12% year over year.” The profitability of the Industrial sector is expected to be resilient and to better the market. Valuations And Technicals The Industrial sector and the Capital Goods Industry group trade on par with the S&P 500 on a forward earnings basis (17.7x and 17.9x to 18.0x). The BCA Valuations Indicator signals a neutral level of valuation which is roughly in line with the 10-year average. From the BCA Technical Indicator standpoint, Capitals Goods are also in the neutral zone (Chart 20). Valuations and technicals are moderate for the sector. Chart 20Valuations And Technicals
Valuations And Technicals
Valuations And Technicals
Investment Implications The US industrial sector is in the middle of a boom fueled by a trifecta of positives: Onshoring, automation, and favorable government policy. And while it is hard to fight the Fed and the business cycle, it appears that for now, the sector is defying gravity despite slowing manufacturing surveys and tighter monetary policy. So far fundamentals appear strong, and earnings expectations are robust thanks to the high pricing power and operating leverage of the sector. Within Capital Goods, we favor industries and companies that benefit from these tailwinds: Aerospace and Defense which is to benefit from increased federal defense spending; Robotics and Automation which is overrepresented in the Electrical Equipment industry; and Renewables, i.e., companies that manufacture and service wind turbines and solar panels. Construction and building materials will have a second breath when Infrastructure spending projects will actually get selected and approved. We are both strategically and tactically bullish on the sector but will monitor it closely from a tactical standpoint. After all, industrial surveys are at odds with the resilient earnings expectations. ETFs There are a number of very inexpensive and highly liquid ETFs from Vanguard, iShares, and State Street, that capture the performance of the Industrial sector (Table 5). Table 5Industrial Sector ETFs
Industrials: A Trifecta Of Positives
Industrials: A Trifecta Of Positives
Bottom Line The US industrial sector is in the middle of a boom fueled by onshoring, automation, and favorable government policy. This trifecta of positives helps the sector to defy the gravity of the slowing economy. Companies are optimistic and earnings growth expectations are both robust and resilient. We are both strategically and tactically bullish on the sector but will continue to monitor it closely, watching out for potential cracks in operating performance. Irene Tunkel Chief Strategist, US Equity Strategy irene.tunkel@bcaresearch.com Footnotes 1 Reshoring Initiative reshorenow.org 2 https://www.automate.org/ Recommended Allocation Recommended Allocation: Addendum
What Our Clients Are Asking: The Bear Market 2.0 Webcast Follow Up
What Our Clients Are Asking: The Bear Market 2.0 Webcast Follow Up
Executive Summary Cheap But Challenged
Cheap But Challenged
Cheap But Challenged
European equities have bottomed in absolute terms, but they are still underperforming US ones. Eurozone equities are very cheap compared to US ones, but their profitability remains inferior. Five problems continue to hang over the relative performance of European stocks. The first problem is the Chinese and global growth outlook. The second problem is the natural gas crisis. The third problem is Europe’s expanding liquidity risk. The fourth problem is the weak euro. The fifth problem is Europe’s structural profitability weaknesses. Bottom Line: European stocks may be inexpensive, but too many problems are hanging over their profit outlook. As a result, European shares are unlikely to outperform until natural gas prices peak and the ECB activates the TPI. Until then, continue to underweight European stocks in global equity portfolios. European assets are on sale. Equities are trading at multigenerational lows against their US counterparts. Meanwhile, the euro is back below parity and embedding a 30% discount to purchasing power parity against the US dollar. These observations suggest that European stocks are very attractive relative to their US counterparts — but are they? Related Report European Investment StrategyQuestions From The Road On July 4, 2022, we turned positive on European stocks in absolute terms. Nonetheless, we expected US stocks to outperform because of their larger weighting toward defensive and growth names, which derive greater benefit from lower rates, especially when economic activity remains vulnerable. At this point, we maintain this stance. European valuations are appealing, but the entry point is still not right because the global environment continues to be hostile to the relative performance of European equities. Attractive Valuations Anyway you cut it, European stocks are much less expensive than their US counterparts. In theory, these attractive valuations imply higher long-term rates of return in European markets compared to US ones. Chart 1Cheap European Stocks
Cheap European Stocks
Cheap European Stocks
Based on the MSCI indices, the relative forward P/E ratio of Eurozone shares is 25% below that of US stocks, or the deepest discount in more than 20 years (Chart 1, top panel). European shares should naturally sport lower valuations than US ones due to sectoral biases. However, even when we adjust for those sectoral differences, European stocks stand out as exceptionally cheap. A P/E ratio calculated by giving equal weights to all the sectors in both Europe and the US reveals that, outside of the COVID-19 selloff, the European valuation discount has never been lower in the post-dotcom bubble era (Chart 1, bottom panel). Comparing individual sector performances to earnings reinforces that European stocks are uniquely inexpensive compared to US ones. Since 2018, the relative prices of most European sectors compared to their US competitors have underperformed relative earnings (Chart 2). Chart 2ABroad-based Cheapness
Broad-based Cheapness
Broad-based Cheapness
Chart 2BBroad-based Cheapness
Broad-based Cheapness
Broad-based Cheapness
The problem with valuations is that they can be misleading. If European earnings continue to underperform US ones, European equities are likely to underperform further. And, whether we adjust or not for sector composition, European earnings remain in a pronounced downtrend compared to US profits, which is driving relative performance (Chart 3). Perhaps there is hope for European earnings, but, in the short term, we doubt it. European earnings expectations have been downgraded already, with 2022 and 2023 earnings excluding the energy sector, already down 10% and 12% respectively since their February peak (Chart 4). However, five problems are likely to lead to a greater downgrade relative to the US in the coming months. They are the following: the Chinese and global growth difficulties, the energy market’s ructions, the European liquidity risk, the weakness in the euro, and Europe’s structural lack of profitability. Chart 3Earnings Are In The Driving Seat
Earnings Are In The Driving Seat
Earnings Are In The Driving Seat
Chart 4Downward Revisions Have Begun
Downward Revisions Have Begun
Downward Revisions Have Begun
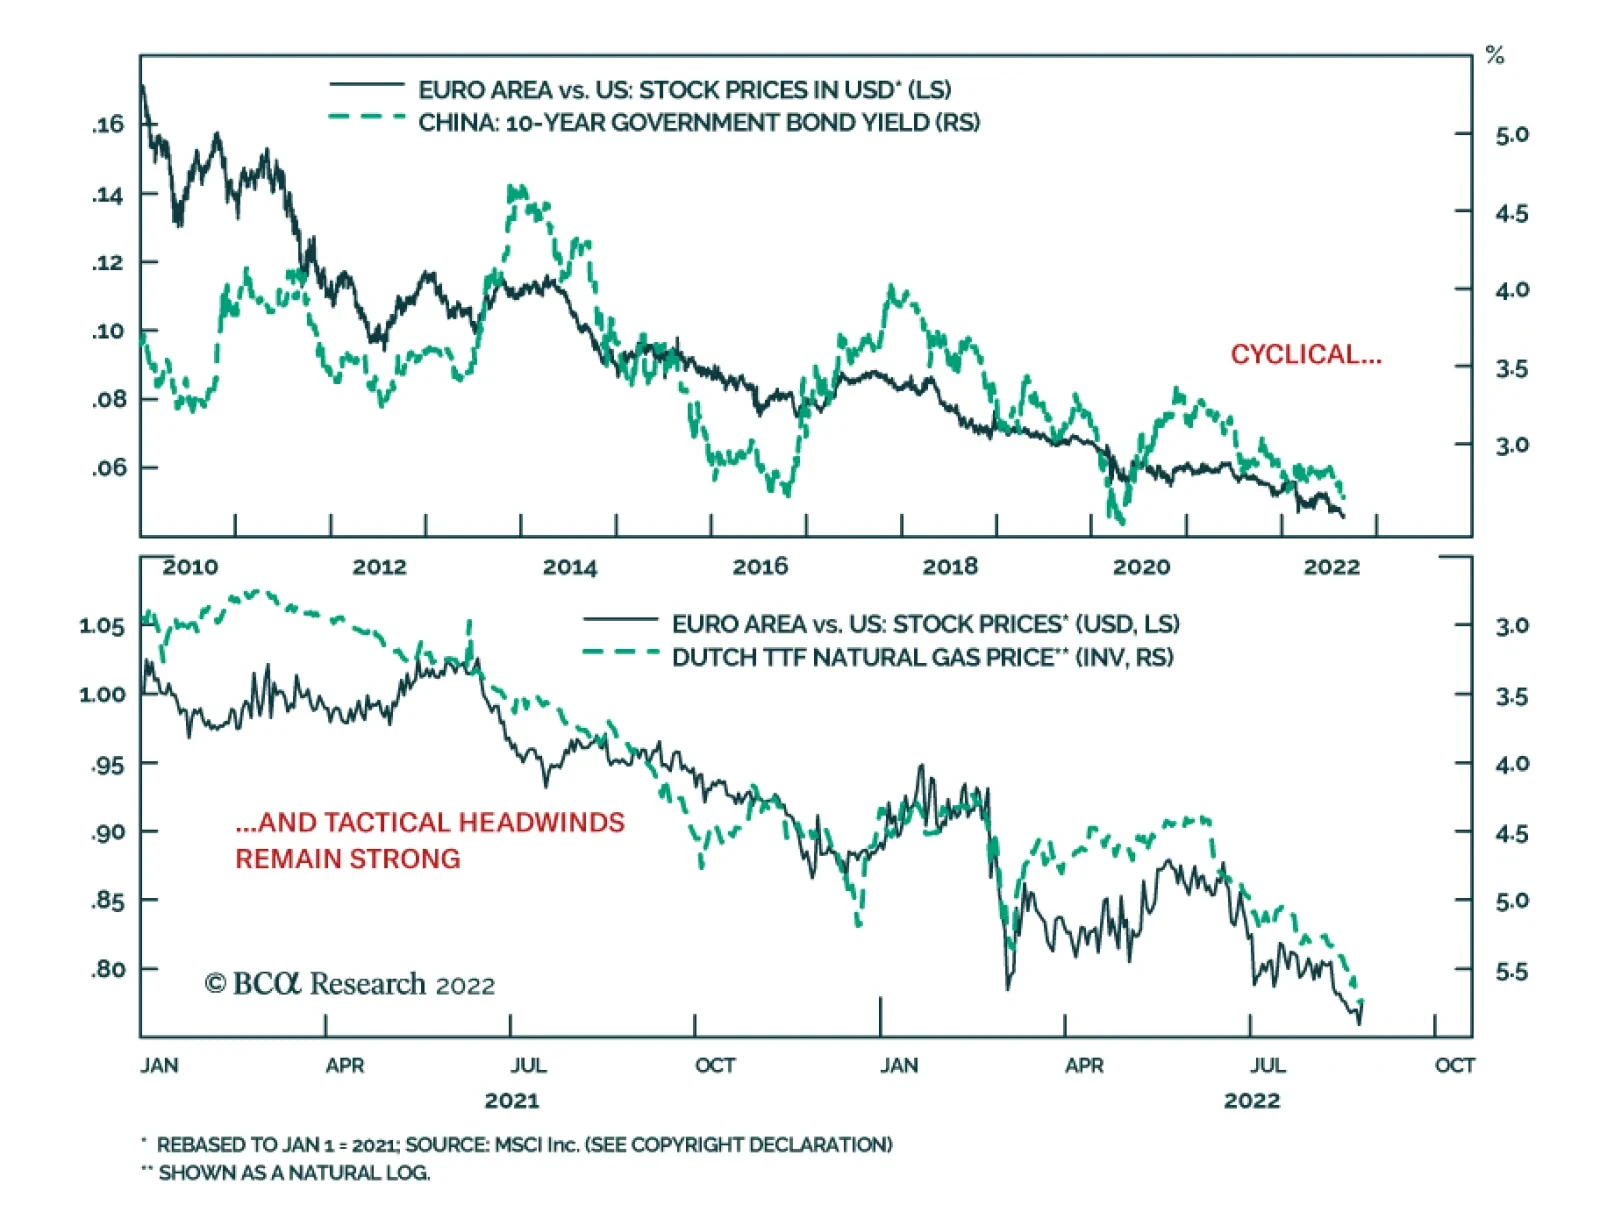
Bottom Line: Compared to the US, European stocks are very cheap. However, European stocks will only begin to outperform once investors see reasons to upgrade European relative earnings. For now, too many problems continue to place Europe’s profit outlook at a disadvantage. Problem 1: Chinese And Global Growth Chart 5Europe Is More Cyclical than the US
Europe Is More Cyclical than the US
Europe Is More Cyclical than the US
The performance of European equities relative to that of US stocks tracks the evolution of the global manufacturing PMI (Chart 5). This makes sense. Europe’s economy and markets are more specialized in the manufacturing sector, whether consumer or capital goods. Consequently, European earnings are also more geared to the fluctuations of global industrial activity and Chinese imports. Today, China remains one of the major risks to European stocks. Despite efforts by Beijing to stabilize growth, the private sector continues to retrench. The zero-tolerance toward COVID creates a powerful brake on animal spirits as lockdowns shift from one city to the next. Most crucially, the real estate sectors’ woes show no end in sight. Floor spaces sold, started, and completed are contracting at double-digit paces and real estate investment is declining at a 12% annual rate (Chart 6 top and second panels). Moreover, the 47% annual contraction in land purchases indicates that the situation will not improve soon. Consequently, consumer loan growth will decelerate further (Chart 6, bottom panel). While authorities are trying to manage the economic slowdown, they are still too concerned with real estate speculation to push as aggressively as the Chinese economy needs. Even the recent 19-point package from the State Council came with a warning that, although “the foundation of economic recovery is not solid,” Beijing will avoid “resorting to massive stimulus or compromising longer-term interests.” In this context, it is likely that China’s marginal propensity to consume will remain weak, that Chinese yields will decline further, and that the CNY will experience additional weaknesses. All these developments are consistent with a deeper underperformance of European equities (Chart 7). Chart 6China's Real Estate Industry Is Sick
China's Real Estate Industry Is Sick
China's Real Estate Industry Is Sick
Chart 7Weak China = Weak Europe
Weak China = Weak Europe
Weak China = Weak Europe
Looking at the global economy offers little hope. A weak China weighs on EMs’ growth prospects. Moreover, the strong dollar invites EMs’ central banks to tighten domestic liquidity and financial conditions, which historically results in lower growth. This softer economic activity ultimately hurts European earnings more than US ones and causes Eurozone shares to underperform US ones (Chart 8). Beyond EMs, the leading indicators of global economic activity do not inspire much confidence either. Arthur Budaghyan, BCA’s Emerging Market chief strategist, often highlights the downside risk to global exports, which would generate an underperformance of European earnings relative to those of the US. In fact, Taiwanese export orders, which lead global exports, are contracting anew. So is the Global Leading Economic Indicator (Chart 9). Ultimately, the tightening in global policy rates is doing what it should do: slowing global growth. Chart 8EM FCIs Matter To Europe's Relative Performance
EM FCIs Matter To Europe's Relative Performance
EM FCIs Matter To Europe's Relative Performance
Chart 9Clouds Over The Global Economy
Clouds Over The Global Economy
Clouds Over The Global Economy
Bottom Line: The weakness in Chinese economic activity is not over yet. Global growth will also continue to suffer as global exports are set to weaken considerably in the coming months. Together, these forces will hurt the earnings prospects of Europe compared to the US. Problem 2: The Energy Market Chart 10Pricey Nat Gas And Electricity
Pricey Nat Gas And Electricity
Pricey Nat Gas And Electricity
Let’s be more specific here: natural gas continues to weigh more on Europe’s earnings prospects than those of the US. European natural gas prices have surged, even when compared to US ones. As a result, electricity prices have also increased across the Eurozone’s main economies (Chart 10). This is deeply negative for domestic economic activity and hurts the competitiveness of European businesses. Consequently, as long as natural gas prices climb higher, European profitability will deteriorate relative to that of US firms. Unsurprisingly, investors are deeply aware of these dynamics. The more natural gas prices rise, the greater European equities underperform. In fact, since mid-2021, Dutch natural gas prices have become the single best explanatory variable for the relative performance of European stocks (Chart 11). Natural gas is likely to remain a problem for European equities until the beginning of the winter. We are currently in the peak period of upward pressure on natural gas prices in Europe. Relentless inventory buildup introduced an inelastic buyer to the market, which is propelling natural gas prices to new heights even though consumption is receding (Chart 12, top panel). In response to these efforts, European natural gas inventories have hit 80% of capacity and are set to rise to 90% by November, even though Russian flows have collapsed (Chart 12, bottom two panels). However, in November, natural gas prices are likely to peak. The re-stocking effort will be completed, coal power will fill in many gaps, and selective conservation efforts will allow most industries and heating to function. Chart 11Europe vs US = Nat Gas
Europe vs US = Nat Gas
Europe vs US = Nat Gas
Chart 12The Worse Is Now
The Worse Is Now
The Worse Is Now
Bottom Line: The surge in natural gas prices is the key force currently hurting the relative performance of Eurozone equities. However, this negative dynamic is likely to fade in the winter because the current price jump reflects inventory building. By November, inventories will be at the 90% of capacity targeted by the European Commission and coal power will fill the remaining production gap. Until then, natural gas prices will continue to hurt European profit margins. Problem 3: European Liquidity Risk Chart 13Unhinged Credit Markets
Unhinged Credit Markets
Unhinged Credit Markets
European equities are also hurt by an increase in risk premia relative to the US. Italian spreads continue to show upside and European junk spreads are widening compared to US ones (Chart 13). This problem could remain saliant in the coming months. The ECB is tightening policy in an economy already fettered by a severe energy shock. This process increases risk aversion. Moreover, because European inflation is likely to prove more sticky than that of the US this fall, this development will continue to hurt the price of European assets compared to US ones. Chart 14A Key Vulnerability
A Key Vulnerability
A Key Vulnerability
The imbalances in the Euro Area create a further source of liquidity risk. The TARGET2 balances remain extremely large, which indicates that Dutch, Luxembourg, and German savings continue to finance France, Spain, and Italy (Chart 14, top panel). However, the import-boosting impact of high energy costs and the negative effects of weaker global growth on exports are likely to worsen the current account balance of the Eurozone, including that of Germany, which acts as the Eurozone’s banker (Chart 14, bottom panel). The decreasing savings of Germany and the Netherlands in conjunction with the wide difference in neutral rates between Germany and France, Italy and Spain increase the odds that peripheral spreads will widen further in the short term. However, this too is likely to be a temporary risk that ebbs after the winter. First, as we wrote four weeks ago, the differences in neutral rates will force the ECB to activate the TPI before year-end. Second, once energy prices peak, the downward pressure on European gross savings will also ease, which will restore liquidity conditions in European credit markets. Bottom Line: The combination of an ECB tightening policy in a weak economy as well as TARGET2 imbalances and declining savings increase the likelihood of a liquidity shortage in European debt markets. Tremors in the credit market would translate into further underperformance of European equities relative to US ones. Problem 4: The Weak Euro At first glance, the weak euro is positive for European equities since it subsidizes profitability. However, in a context in which costs of production are rising faster in Europe than in the US, this benefit is elusive. The weak euro is not translating into greater pricing power for European firms. The increase in producer prices supercharged by higher natural gas prices (among others) is not met by a commensurate rise in consumer prices. The same is true in the US, but to a much lesser extent; as a result, the ratio of CPI to PPI is declining in Europe relative to the US. Chart 15A Weak Euro Reflects Poor Pricing Power
A Weak Euro Reflects Poor Pricing Power
A Weak Euro Reflects Poor Pricing Power
This lack of pricing power is an important driver of the weakness in the euro. EUR/USD closely tracks the evolution of the CPI-to-PPI ratio in Europe relative to the US (Chart 15). This confirms that a weaker euro is not helping the relative performance of European shares because it indicates a problem with the comparative profitability of European businesses. It also implies that the euro will weaken as long as Dutch natural gas prices are rising (Chart 15, bottom panel). Historically, a weak euro is associated with underperforming European equities. At the most basic level, a depreciating euro arithmetically derails the common-currency performance of European shares. Moreover, because a falling euro is often linked to poor rates of return in the Euro Area, it corresponds to periods when investors prefer foreign shares to European ones. For now, we see a large left tail in short-term distributions of the EUR/USD’s returns, even if the long-term prospects of the euro are brighter. This also signifies that the euro will remain a hurdle for the relative performance of European shares in the coming weeks. Bottom Line: The lack of pricing power of European firms weighs on the profitability of Eurozone businesses compared to that of US ones and on the euro. As long as this problem persists, the euro will suffer, which implies additional weaknesses in the relative performance of European shares. Problem 5: Europe Structurally Poor Profitability Chart 16Europe's Structural Profitability Problem
Europe's Structural Profitability Problem
Europe's Structural Profitability Problem
Since 2008, the EPS of the Eurozone MSCI benchmark have collapsed 73% compared to those of the US index. Moreover, this fall has followed a nearly straight line. This poor performance reflects an underlying structural challenge to European profitability. Europe’s low profit growth follows poor returns on assets. At first glance, lower levels of stock repurchases explain some of the underperformance of European earnings. However, the lower propensity of European firms to conduct buybacks mirrors their poor profitability. As Chart 16 highlights, European firms have much lower RoEs, RoAs, profit margins, and asset utilization rates than their US counterparts. The low profitability of European shares is multifaceted. To a large degree, it corresponds to the Eurozone’s anemic growth, whereby nominal as well as real GDP per capita continue to lag those of the US (Chart 17). This weak per-capita GDP is a consequence of the meager underlying productivity of the Euro Area. Many elements cause Europe’s lower productivity growth. The two most obvious culprits are the region’s greater economic fragmentation and its heavier regulatory burden when compared to the US. But also, the return on investment is much lower in Europe (Chart 17, bottom panel). The lower European return on investment is more complex. A key driver is the greater degree of misallocated capital in Europe than in the US. Europe’s capital stocks, especially in the periphery, represents a much greater share of GDP than it does in the US (Chart 18). A larger capital stock increases the odds that some previous capex was misallocated. Moreover, the greater prevalence of small businesses in Europe compared to the US also increases the likelihood of redundant and misallocated capital. Poor capital allocation hurts investment returns and productivity. Chart 17Weak Growth = Weak ROI
Weak Growth = Weak ROI
Weak Growth = Weak ROI
Chart 18Too Much Capital
Too Much Capital
Too Much Capital
Another reason for Europe’s poor profitability has nothing to do with productivity and tepid growth. European industries are less concentrated than US ones (Chart 19). Lower concentration means higher competition between businesses, which erodes markups and returns on assets. Chart 19Smaller Profitability Moats In Europe
Too Early To Overweight Europe
Too Early To Overweight Europe
None of Europe’s structural weaknesses in relation to profitability has been addressed. Consequently, this drag on the relative performance of Euro Area equities remains firmly in place, which warrants a significant discount in European equity valuations relative to US ones. Bottom Line: The last problem for European shares is the structural under profitability of the Eurozone. Because of lower productivity, misallocated capital, and lower industry concentration, European firms offer permanently weaker returns on assets than US businesses. Their disadvantage remains unaddressed, which suggests that structural forces are unlikely to generate a re-rating of European shares any time soon. Investment Implications Conditions are still not supportive for an outperformance of European equities relative to US ones. European stocks may have already bottomed in absolute terms and they are very cheap compared to US shares, but Euro Area earnings are set to underperform further. European stocks cannot beat US stocks until most of the five headwinds impacting Europe come to pass. The deceleration in Chinese and global growth, the surge in Dutch natural gas prices, the growing liquidity risk in the Eurozone, the collapse of EUR/USD, and the structural impediments to European profitability are just too strong collectively to allow Europe’s attractive valuation to crystalize into immediate high returns. Nonetheless, we cannot be dogmatic. Before year-end, we expect three of these variables to become favorable for European stocks. Namely, we anticipate the natural gas crisis to reach its apex around November 2022, the ECB to activate the TPI, which will tackle the budding illiquidity in European credit markets, and the euro to bottom. Hence, we are in the late stage of this year’s underperformance of European equities. An opportunity to upgrade Europe is around the corner – we are just not there yet. Even after all the cyclical and short-term negatives ebb, one key hurdle for European stocks will remain intact: the structural under profitability. This force suggests that periods of outperformance of European stocks are likely to be short-lived and that, as long as the profitability gap remains open, the structural relative bear market in European stocks will persist. Bottom Line: It is still too early to overweight European equities. Euro Area stocks are much cheaper than their US counterparts, but too many headwinds continue to blow that are likely to weigh on relative performance. Only after European natural gas prices peak will Europe enjoy a period of outperformance. This is unlikely to happen until this winter. Mathieu Savary, Chief European Strategist Mathieu@bcaresearch.com Tactical Recommendations Cyclical Recommendations Structural Recommendations