Developed Countries

Executive Summary EU Metal Industry Under Threat
EU Energy Crisis, Strong USD Imperil Bloc’s Metals Industry
EU Energy Crisis, Strong USD Imperil Bloc’s Metals Industry
Russia’s threat to cut off all remaining exports of natural gas to the EU via Ukraine will further imperil the bloc’s struggling metals industry, particularly aluminum smelting – where half of its capacity already has been shut – and zinc refining. The EU will have to prioritize energy security over its renewable-energy goals, given the challenges its manufacturing industries will confront for the next 3-5 years. Surging imports of raw copper concentrates and unwrought metal will consolidate the global dominance of China’s copper refiners, which sharply increased their treatment and refining charges this week. The US likely will see more investment in metals mining and refining on the back of the EU distress, which realistically cannot be addressed until gas and power prices fall to levels that allow them to sustain their operations. Bottom Line: Ongoing supply shocks to the EU’s base-metals industry will force the bloc to prioritize energy security over its renewable-energy goals. This will drive the bloc’s demand for liquified natural gas (LNG) and oil higher, even after short-term measures to increase LNG intake and distribution capacity are completed over the next 2-3 years. We expect the equities of oil and gas producers to outperform metals miners over this period. After being stopped out, we will be re-instating our long XOP ETF position at tonight’s close. Feature Earlier this month, Eurometaux, the EU metals lobbying group, published a memo to the European Commission drawing attention to “Europe’s worsening energy crisis and its existential threat to our future.”1 This is not hyperbole. At the heart of the industry’s woes is a chronic shortage of energy – in any form – for industrial use. Utilities are signing long-term LNG supply contracts to address this shortage, but they can expect to wait 3-4 years or more before gas arrives on Europe’s shores.2 Spot and one-off cargoes will become available over that time, but most of the existing LNG production is under long-term contract. Oil, coal, and nuclear energy are available for power generation, industrial applications and space-heating, and they increasingly are being used in the bloc, but these too are constrained.3 Measures to address the chronic energy shortage hammering the EU base-metals industry will take years to effect, and could come too late to meaningfully preserve existing refining capacity, which has been contracting for years (Chart 1).4 Most of the EU’s metals production is accounted for by aluminum, copper and zinc, which are extremely energy intensive, copper only less so (Chart 2). The surge in LNG prices following Russia's invasion of Ukraine propelled electricity prices higher, given gas is the marginal fuel for EU power generation (Chart 3). This crushed zinc and aluminum refining. Half of the EU’s aluminum smelter capacity – ~ 1mm MT – will be curtailed or shuttered this year, according to European Aluminum.5 Chart 1EU Metal Industry Under Threat
EU Energy Crisis, Strong USD Imperil Bloc’s Metals Industry
EU Energy Crisis, Strong USD Imperil Bloc’s Metals Industry
Chart 2EU Metals Are Extremely Energy Intensive
EU Energy Crisis, Strong USD Imperil Bloc’s Metals Industry
EU Energy Crisis, Strong USD Imperil Bloc’s Metals Industry
Chart 3EU Power Price Surge Crushes Metals Refining
EU Energy Crisis, Strong USD Imperil Bloc’s Metals Industry
EU Energy Crisis, Strong USD Imperil Bloc’s Metals Industry
The surge in European electricity prices and the resulting curtailment or shuttering of zinc refining paced the 2.6% y/y decline in global output in 1H22, which took global production down to 6.77mm MT, according to the International Lead and Zinc Study group. Europe accounts for ~ 15% of global zinc refining.6 Refined zinc consumption fell 3% y/y in 1H22 to 6.74mm MT. China Bingeing On Copper Global refined copper output in the January – July 2022 period slightly outpaced usage – with 3% growth in the former and 2.6% growth in the latter, according to the International Copper Study Group (ICSG). On the back of this report, we lowered our expected supply growth estimate to 3% this year, (Chart 4). This brings our estimate for total supply down by ~400k MT vs. our previous iteration to 25.3mm MT. We are keeping our estimate of 2023 supply growth rate at ~ 4.5%. Our copper demand estimate is a function of real GDP estimated by the World Bank, and remains at just under 26mm MT and 27.2 mm MT for 2022 and 2023 respectively. As a result of the lower 2022 production growth rate, our forecasted copper deficit has widened to ~ 605k tons in 2022 and 480k tons in 2023. The mismatch in supply and demand levels will keep inventories in China and the West under pressure (Charts 5A and 5B). Chart 4Copper Supply Estimate Lowered
Copper Supply Estimate Lowered
Copper Supply Estimate Lowered
Chart 5AChinese Copper Inventories Continue To Draw
Chinese Copper Inventories Continue to Draw
Chinese Copper Inventories Continue to Draw
Chart 5BAs Do Stocks In The West
As Do Stocks In The West
As Do Stocks In The West
China’s imports of copper condensates – the raw material used to make refined copper – surged to 16.65mm tons over January – August 2022, up 9% y/y. Imports of unwrought and semi-fabricated copper were up 8% over the same period at 3.9mm MT, according to Mysteel.com. As is to be expected, treatment and refining charges at Chinese smelters also moved higher: for 3Q22, refiners were charging $93/MT, up $13 from 2Q22 levels and $23/MT from 4Q21, according to Reuters. These charges increase when raw-material supplies increase, and vice versa. This is meant to be a floor charged for refining concentrates to produce refined copper. Real USD Matches US PPI After Re-Opening In an unusual turn of events, the USD Real Effective Exchange Rate (REER) has been moving higher along with the US Producer Price Index for all commodities. This trend started as the global economy accelerated its re-opening in 2021 (Chart 6). The USD has a profound affect on commodity prices: Most globally traded commodities are denominated in USD, funded in USD and invoiced in USD. This is the channel through which the Fed’s monetary policy impacts commodity buyers ex-US. A stronger dollar means commodities in local-currency terms are more expensive, and vice versa. It also means production costs in states that do not peg their currencies to the USD go down, and vice versa. Chart 6Real USD Gains With US PPI During Reopening
Real USD Gains With US PPI During Reopening
Real USD Gains With US PPI During Reopening
Given the USD’s elevated level, copper prices in local-currency terms will continue to face a massive headwind on the demand side, and a massive tailwind on the production side. For households and firms buying commodities, or durable goods with a lot of metals in them (copper, stainless steel, etc.), Fed policy has a direct effect on how their budgets get allocated.7 In the short and long run macroeconomic variables such as the USD influence copper prices by increasing the cost of copper ex-US when the dollar rallies, and vice versa. Fundamental variables like tight inventories, which arise when demand is consistently above supply, impart an upward price bias to the copper forward curve (backwardation increases as inventories decrease). Domestic economic factors matter, too. Copper prices have been pummeled by the meltdown of China’s property sector, which has been the growth engine for the country’s economy, accounting for ~ 30% of its copper demand. The USD has remained well bid following Russia’s invasion of Ukraine, presenting a powerful headwind to commodity prices in general. This is particularly true for refined copper, given China accounts for more than 50% of total global consumption. China’s RMB dropped 11.4% vs. the USD from the start of the year to now. This has not stood in the way of a sharp increase in imports of the copper ore and refined metal this year, despite the country’s weak economic performance. Given China’s property-market slowdown and its zero-tolerance COVID-19 policy and its attendant lockdowns, it is difficult to pinpoint a cause for its increased copper demand. It may be opportunistic purchasing – buying the metal when prices are far lower than their peak earlier this year – or it could signal a post-Communist Party Congress increase in economic activity (e.g., more fiscal stimulus hitting the system) officials are preparing for. Investment Implications The EU’s metals-refining sector faces existential challenges as a result of the bloc’s energy crisis. Significant employers – not just the metal refiners – will be confronting limited energy supply and higher costs for years, given the tightness in conventional energy markets – oil, gas and coal. The renewable-energy sector also faces daunting challenges, as a result of difficulties faced by metals refiners and the energy crisis they presently confront. It is worthwhile noting that none of the renewables technology is possible without metals. Given the abundant lessons re reliance on a single supply source Russia’s invasion of Ukraine has provided, we expect investment in US metals mining and refining to increase, as consumers of copper, aluminum and zinc seek to diversify away from Chinese dominance of this sector. This will take time to build out, just as the increase in LNG supplies will take time. This likely will keep a bid under the USD, as manufacturing, mining and refining capex investment shifts to the US. We expect the EU’s drive to secure conventional energy will drive the bloc’s demand for liquified natural gas (LNG) and oil higher, even after currently planned short-term measures to increase LNG intake and distribution capacity are completed over the next 2-3 years. After being stopped out this past week, we will be re-instating our long XOP ETF position on tonight’s close, consistent with our view. Robert P. Ryan Chief Commodity & Energy Strategist rryan@bcaresearch.com Ashwin Shyam Research Analyst Commodity & Energy Strategy ashwin.shyam@bcaresearch.com Commodities Round-Up Energy: Bullish. European Commission President Ursula von der Leyen proposed additional economic sanctions against Russia yesterday including extending price caps on oil to third countries, following the call-up of reserves in Russia last week, and a veiled threat to use nuclear weapons against Ukraine. In a related matter, Gazprom, the state-owned gas producer and trading company, threatened to cut off the remaining gas sales to Europe via Ukraine – close to half the ~ 80mm cm /d still being sold via pipeline to the continent (Chart 7). It is apparent the EU has been anticipating a full shut-off of Russian pipeline gas shipments, which likely motivates von der Leyen’s proposal. Any proposal to increase sanctions on Russia would have to be unanimously approved. Base Metals: Bullish. In a boost to prospective Chile copper production, a BHP executive indicated he expects regulatory uncertainties in the largest copper producing state to ease. BHP mentioned earlier this year that legal certainty in Chile would be key to investing over USD 10 billion in the state. Earlier this month, Chilean voters rejected a constitution, which, among other things, could have curtailed mining operation by including new taxes and environmental regulations. Precious Metals: Neutral. In their Q2 platinum balances report, the World Platinum Investment Council (WPIC) expects FY 2022 surplus to rise more than 50% vs. its Q1 estimates to 974k oz. Weak platinum ETF demand resulting from a strong USD and rising interest rates is expected to outweigh operational constraints in South African and North American mining operations. Bolstering supply is the fact that Russian platinum – which constitutes ~11% of global supply – has been reaching buyers. However, this security of supply may not last. Once buyers’ long-term contracts for Russian platinum end, as in the case with aluminum, companies may self-sanction, turning to the spot market and other producing states instead. For palladium, SFA Oxford sees the metal's surplus dropping to ~92% y/y, as demand is expected to increase and production is forecast to fall (Chart 8). Chart 7
EU Energy Crisis, Strong USD Imperil Bloc’s Metals Industry
EU Energy Crisis, Strong USD Imperil Bloc’s Metals Industry
Chart 8
Palladium Balances Expected To Drop
Palladium Balances Expected To Drop
Footnotes 1 Please see Europe’s non-ferrous metals producers call for emergency EU action to prevent permanent deindustrialisation from spiralling electricity and gas prices, posted by Eurometaux 6 September 2022. 2 See, e.g., Exclusive: German utilities close to long-term LNG deals with Qatar, sources say published by reuters.com 20 September 2022. 3 For additional discussion, please see Energy Security Rolls Over EU's ESG Agenda, which we published 28 July 2022. It is available at ces.bcaresearch.com. 4 Please see Agenda for a resilient European metals supply for the green and digital transitions, posted by Eurometaux in mid-2020. 5 Please see Reconciling growth and decarbonisation amidst the energy crisis, posted by European Aluminium May 2022. 6 Please see Column: European smelter hits mean another year of zinc shortfall published by reuters.com 17 May 2022. 7 Please see "Global Dimensions of U.S. Monetary Policy" by Maurice Obstfeld, which appeared in the February 2020 issue of International Journal of Central Banking for an in-depth discussion and analysis. Investment Views and Themes Strategic Recommendations Trades Closed in 2022
In Section I, we note that the Fed’s new interest rate projections show that US monetary policy is set to rise soon into restrictive territory even relative to what we consider to be the neutral rate of interest, and to a level that has been consistent with the onset of recession since the 1960s. Imminent supply-side and pandemic-related disinflation is crucial for the US to avoid a recession over the coming year. Stay neutral stocks versus bonds for now, but the next shift in our recommended asset allocation stance is more likely to be a downgrade to underweight rather than an upgrade to overweight. In Section II, a guest piece from our European Investment Strategy service discusses the outlook for European assets.
Dear Client, This month’s Special Report has been written by my colleagues Mathieu Savary and Jeremie Peloso, of BCA’s European Investment Strategy service. The report was published in that service on September 26, and addressed the outlook for European assets. The EUR/USD stop buy mentioned in the report has since been triggered, meaning that our European Investment Strategy service is now long the euro with a stop loss position at 0.94. Although this is a tactical position for that service, it is consistent with the view expressed in Section 1 of our report that the dollar has significantly overshot versus the euro what currency fundamentals would imply. I trust you will find their report both interesting and insightful. Jonathan LaBerge, CFA The Bank Credit Analyst Highlights The outlook for European assets is uniquely muddled. European energy prices will remain elevated, but the worst of the adjustment is already behind us. The global economy is teetering on the edge of a recession and weak global growth is historically very negative for European assets. However, European valuations and earnings forecasts already discount an extremely severe outcome for global growth. A hawkish Fed should support the dollar, but investors increasingly realize foreign central banks are fighting inflation equally aggressively. The dollar already anticipates a global recession. Meantime, European credit offers a large spread pickup over sovereigns and even appears as a decent alternative to equities. Within a credit portfolio, we adopt a more cautious approach towards European investment grade bonds (IG) relative to their US counterpart. Instead, we recommend favoring UK IG over Euro Area IG as well as Swedish IG relative to US IG. Feature Following the hawkishness that transpired from the Fed press conference and revised forecasts last week, EUR/USD plunged below 0.99 and hit a 20-year low. Moreover, President Vladimir Putin’s announcement of a broader mobilization of the Russian army is stoking fears that the Ukrainian conflict will only be prolonged. The prospects of a lengthier war and greater energy market shock are raising further worries for Europe’s growth outlook, which weighs on European asset prices, notably the euro and the pound. The odds of a global financial accident are on the rise. Global central banks have joined the Fed and are relentlessly tightening global monetary and financial conditions. Moreover, the surging dollar is adding to global risks by raising the cost of capital around the world. This is a very fragile situation and the odds of a global recession have jumped significantly. Against this backdrop, investors should continue to overweight defensive equities at the expense of cyclical stocks. The euro also has more downside, but we are issuing a tentative stop-buy at EUR/USD 0.9650 with a stop at 0.9400. Credit remains a safer alternative to European stocks. The Evolving European Energy Backdrop Chart II-1All About The Gas
All About The Gas
All About The Gas
The surge of natural gas and electricity prices since the fall of 2021 has been one of the main drivers of the underperformance of European assets and the fall in the euro (Chart II-1). While the medium-term outlook for European energy prices remains fraught with risk, the near-term prospects have improved. Following a surge from €77.4/MWh in June to €340/MWh on August 26, one-month forward natural gas prices at the Dutch Title Transfer Facility (TTF) have declined 45% to €187/MWh. These wild gyrations reflect the evolution of both the natural gas flows from Russia, which have fallen from 3,060Mcm to 599 Mcm today, and the rapid buildup of natural gas inventories across the European Union. The good news is that the costly efforts to rebuild European gas inventories have been successful. EU-wide inventories are at 85.6% capacity, achieving its 80% storage objective well before November. Germany has gone even further, with storage use now standing at 90% of capacity. This large stockpile, along with the re-opening of coal power plants and consumption curtailment efforts, should allow Europe to survive the winter without Russian energy imports, as long as the temperatures are not abnormally cold. The absence of a summer dip in Norwegian gas exports and the surge in LNG flows to Europe have partially replaced the missing Russian inflows, thus helping Europe rapidly rebuild its natural gas inventories (Chart II-2). This success was a consequence of elevated European natural gas prices, which have allowed Europe to absorb LNG flows from the rest of the world (Chart II-3). Chart II-2No Restocking Without LNG
No Restocking Without LNG
No Restocking Without LNG
Chart II-3LNG Flowed Toward High Prices
LNG Flowed Toward High Prices
LNG Flowed Toward High Prices
So far, the European industrial sector has managed to adjust better than expected to the jump in the price of natural gas, a crucial energy input. Take Germany as an example. For the month of August, Germany’s consumption of natural gas by the industrial sector fell 22% below the 2018-2021 average (Chart II-4, top panel), while PPI moved up vertically. Yet, industrial output is only down 5% year-on-year and industrial capacity utilization stands at 85%, which is still a level that beats two thirds of the readings recorded between 1990 and this the most recent quarter (Chart II-4, bottom panel). The adjustment will be uneven across various industries, with those most voracious of natural gas likely to experience a declining share of Europe’s gross value added. Using the German example once again, we can see that the chemicals, basic metal manufacturing, and paper products sectors are the most at risk from higher natural gas prices and most likely therefore to suffer the most from gas rationing this winter (Chart II-5). Chart II-4A Surprisingly Successful Transition
A Surprisingly Successful Transition
A Surprisingly Successful Transition
Chart II-5The Three Sectors Most At Risk
October 2022
October 2022
Going forward, important changes are likely to take place that will allow the European economy to continue to survive on diminished Russian gas flows: European natural gas prices will remain elevated compared to the rest of the world to attract LNG flows to the region. Importantly, Europe’s capacity to absorb these flows keeps increasing, as more re-gasification ships are docked around the continent. Moreover, North America is building more facilities to export LNG to Europe. Chart II-6Nuclear Energy's Contribution Will Rebound
Nuclear Energy's Contribution Will Rebound
Nuclear Energy's Contribution Will Rebound
Nuclear electricity production will rebound. Currently, the EU’s nuclear production is around 43.2TWh, well below the normal 60TWh to 70TWh winter levels, driven mostly by the collapse in French production from 35TWh to 18TWh (Chart II-6). This decline in nuclear electricity generation has accentuated the upward pressure on European natural gas and electricity prices. One of the key objectives of the nationalization of EDF by the French government is to accelerate the maintenance of France’s ageing nuclear power plants and allow a return to more normal production levels by the winter. The role of natural gas in European household’s energy mix will decline. Currently, EU households are the largest natural gas consumers and account for 41% of the bloc’s gas consumption (Chart II-7). It will be easier to replace their natural gas consumption over time with other sources of energy than it will be to cut the industrial sector’s consumption extensively. As a result, even if European natural gas imports are permanently below 2021 levels, the industrial sector will not bear the brunt of the adjustment. Chart II-7Households To Be Displaced
October 2022
October 2022
These developments imply that natural gas prices have limited downside. However, we believe that the worst of the spike in prices is behind us, at least over the near term. The reason is that the inelastic buying created by the inventory re-stocking exercise since May 2022 is ending. In fact, the German Federal Minister for Economic Affairs and Climate Action, Robert Habeck, declared last week that his country would no longer purchase gas at any price. Chart II-8The Most Painful Part Of The Adjustment Is Over
The Most Painful Part Of The Adjustment Is Over
The Most Painful Part Of The Adjustment Is Over
If prices stabilize around €200/MWh, European industrial activity will continue to face a headwind, but the worst of the adjustment process will be in the rearview mirror as natural gas inflation recedes (Chart II-8). Ultimately, capitalist systems are dynamic, and it is this rapid change in price that causes the most pain. In other words, the impoverishment of the European private sector has already happened. Steady states are easier to manage. Moreover, if natural gas prices eventually follow the future’s curve (this is a big “if”), the picture for Europe will improve considerably. One additional mitigating factor should ease the pain being experienced by the European private sector. Fiscal policy is responding very aggressively to the current energy crisis. So far, EU countries and the UK have allocated more than €500 billion to protect their private sectors against higher energy costs (Chart II-9) and the UK just announced tax cuts of £45 billion. This is in addition to the disbursement of €150 billion from the NGEU funds in 2023. Moreover, the European commission is planning to modify the EU fiscal rules to abandon annual structural deficit targets and for debt sustainability to be evaluated over a ten-year period. Bottom Line: The worst of Europe’s adjustment to higher energy prices is now behind us. However, European energy prices will remain elevated, which will continue to put Europe at a handicap compared to the rest of the world. Chart II-9Massive Fiscal Support
October 2022
October 2022
Bad News From The Rest Of The World Chart II-10A Global Recession This Way Comes
A Global Recession This Way Comes
A Global Recession This Way Comes
The worst of Europe’s energy crisis is behind us, but the world is teetering toward a recession, which will hurt the trade- and manufacturing-sensitive European economy. The tightening in global financial conditions created by the surge in the dollar and by the jump in global yields is pushing the US Manufacturing ISM and the Euro Area PMIs toward the low-40s, which is consistent with a recession (Chart II-10). The problem does not stop there. Global central banks have become solely focused on fighting inflation. For 2023, the FOMC’s dot plot forecasts both an interest rate rise to 4.6% and a 0.7% increase in the unemployment rate. This is tantamount to the Fed telling the market that it will increase interest rates as a recession emerges to repress inflation. Not to be undone, European central banks are also rapidly increasing their policy rates, even as they also forecast an imminent deterioration in domestic growth conditions. Quickly tightening policy in a slowing growth environment, especially as the dollar hits a 20-year high, is a recipe for a financial accident and a global recession. Chart II-11No Help From China
No Help From China
No Help From China
Moreover, China’s economy is still unable to create a positive offset to the deterioration in global monetary and financial conditions. The marginal propensity of China’s private sector to consume remains in a downtrend, hampered by the country’s zero-COVID policy and the continuing meltdown in real estate activity (Chart II-11). Furthermore, the most rapid decline in the yuan exchange rate in 5 years is imparting an additional downside risk to the global economy. European stocks are uniquely exposed to these threats. Europe overweights deep cyclicals, which are currently squeezed by the deteriorating global growth outlook. The message from the collapse in FedEx’s stocks on very poor guidance is particularly ominous: this company has a much closer correlation with the Dow Jones Euro STOXX 50 than with the S&P 500 (Chart II-12). European share prices are already factoring in much of the bad news. Valuations are significantly less expensive than they once were. The Shiller P/E ratio of European equities and their equity risk premium stand at the same levels as those in the 1980s. This is in sharp contrast to the US (Chart II-13). Chart II-12FedEx's Gloomy Delivery
FedEx's Gloomy Delivery
FedEx's Gloomy Delivery
Chart II-13Low CAPE In Europe
Low CAPE In Europe
Low CAPE In Europe
European forward earnings have also already done considerable work adjusting downward. Excluding energy, 2022 and 2023 forward EPS are down 11.7% and 13.3% since their peak, respectively (Table II-1). But inflation flatters earnings growth and European large-cap indices are dominated by multinational firms, which implies that looking at earnings in USD terms makes more sense. In both real and USD terms, 2022 and 2023 forward EPS, excluding energy, are already down 28.7% and 30.1%, respectively. These adjustments are in line with previous recessions. Table II-1A Deep Downgrade To European Earnings
October 2022
October 2022
The counterargument is that analysts still expect positive earnings growth in 2023 relative to 2022. However, at 4%, this increase in expected earnings is still well below inflation and 6% below the average expected growth in forward earnings recorded over the past 35 years (Chart II-14). Additionally, a global recession could put further downward pressure on energy prices in Europe, which would create an additional cushion under European earnings in 2023. The implication here is that it still makes sense to be modestly long European equities in absolute terms, especially for investors with an investment horizon of twelve months or more. However, we cannot be complacent, as the risk of an additional selloff is still too large for comfort. As a result, for now investors should only garner a small exposure to European equities and do so while favoring defensive names over cyclical ones (Chart II-15). Chart II-14Weak Forward Earnings Growth
Weak Forward Earnings Growth
Weak Forward Earnings Growth
Chart II-15Continue To Favor Defensive Names
Continue To Favor Defensive Names
Continue To Favor Defensive Names
Bottom Line: European stocks must still contend with the growing threat of a global recession catalyzed by tighter financial conditions and aggressive global central banks. The good news is that they already discount considerable pessimism, as illustrated by their low valuations and downgraded forward earnings. Consequently, investors can continue to nibble at European equities, but do so to a limited degree and by favoring defensive stocks over cyclical ones, at least for now. The Euro Dilemma On the back of the very hawkish Fed meeting and the announcement of Russia’s broadened military mobilization, the EUR/USD broke below the 0.99 support level and fell under 0.98, a level we judged in the past as very attractive on a six-to-nine months basis. Obviously, Fed Chair Jerome Powell’s reaffirmation of the FOMC’s war on inflation is a major boost to the dollar. The momentum property of the greenback implies that it has room to rally further in the near term. This narrative, however, overlooks the fact that the Fed is not the only central bank intent on fighting inflation, no matter the cost. The Norges Bank, the Riksbank, the ECB, and even the SNB have all showed their willingness to move aggressively against inflation. While the BoE only increased rates by 50bps last week, its communication suggested that an at least 75bps increase would be due at the November meeting, when the MPC publishes its Monetary Policy report that will incorporate the impact of the budget measures announced by new British Prime Minister, Liz Truss. As a result, market interest rate expectations are climbing in the US, but they are rising even faster in Europe, albeit from a lower base. However, the decline in the expected rate of interest in the US relative to Europe and in the number of expected hikes in the US relative to Europe are consistent with a sharp decline in the DXY in the coming months (Chart II-16). Due to its 80% weight in European currencies, a weaker DXY implies a rebound in the EUR, GBP, CHF, NOK, and SEK against the USD. Moreover, there could be room for expected interest rate differentials to narrow further against the dollar. The analysis we published two weeks ago shows that, even when the different nonfinancial private debt loads are accounted for, the gap in the US and Eurozone r-star stands at 1%. However, the spread between the Fed funds rate’s upper bound and the ECB Deposit Rate is 2%. The gap between the July 2023 US and Eurozone OIS is 1.7%. Since European inflation may prove more stubborn than that of the US in the near term, there is scope for the expected interest rate gap to narrow further, especially as the Euro Area final domestic demand is surprisingly more robust than that of the US (Chart II-17). Chart II-16The Rest Of The World Is Catching Up To The Fed
The Rest Of The World Is Catching Up To The Fed
The Rest Of The World Is Catching Up To The Fed
Chart II-17Surprising European Resilience
Surprising European Resilience
Surprising European Resilience
What about global growth? The view that the global economy is about to experience a recession is consistent with a stronger dollar, since the greenback is an extremely countercyclical currency. However, the DXY’s 25% rally since January 2021 already prices in such an outcome (Chart II-18). Similarly, the euro is trading again at 2002 levels, which is also in line with a global recession with deep negative repercussions for the Eurozone. Additionally, the Euro has fallen 21% since May 2021, which compares to the 21.4% fall in 2008, the 20% decline in 2010, the 18% plunge in 2011/12 and the 24% collapse in 2014/15; yet EUR/USD is much cheaper now than in any of those instances. Moreover, the wide difference between the competitiveness of Germany and that of the rest of the Euro Area has now faded, which means that a major handicap against the euro has disappeared (Chart II-19). Chart II-18The Dollar Already Foresees A Recession
The Dollar Already Foresees A Recession
The Dollar Already Foresees A Recession
Chart II-19Normalizing Eurozone Internal Competitiveness
Normalizing Eurozone Internal Competitiveness
Normalizing Eurozone Internal Competitiveness
This does not mean that the euro is not without risk. First, since the major euro collapse began in June 2021, EUR/USD breakdowns have been followed by average declines of 3.6%, ranging from 2.7% to 4.2%. Since the dollar is a momentum currency, it is unlikely that this time will be different. Second, if the tightening in global policy does cause a financial accident, the dollar will catch one last major bid that could push EUR/USD toward 0.9. As a result, to mitigate the danger, we recommend setting a stop-buy in the euro at EUR/USD 0.965 or 2.6% below the breakdown level of 0.9904. This position comes with a stop-loss at 0.94. For now, we would view this bet as a tactical position if it were triggered. Bottom Line: While a hawkish FOMC is very positive for the dollar, markets now expect foreign central banks to catch up to some extent with the Fed. This process is dollar bearish. Additionally, while a global recession would be supportive of the greenback, the USD already discounts this scenario. Instead, Europe is proving surprisingly resilient, which could soon create a tailwind for EUR/USD. Set a stop-buy at EUR/USD 0.965, with a stop-loss at 0.94. Market Update: European Credit After Central Bank Week For investors concerned with the left-tail risk in European equities, European credit offers a credible alternative in the near term. This asset class is also attractive relative to European government bonds. Chart II-20Central Bank Week
October 2022
October 2022
Taken together, the Fed, the ECB, the BoE, the Riksbank, the Norges Bank, the SNB, and the BoC have tightened policy by 475bps over the past month (Chart II-20). Moreover, the SNB’s hike closed the chapter of negative rates in Europe. But make no mistake – there will be a second chapter. Until then, European corporate bond yields have risen enough to offer attractive spreads over duration-matched government bonds and to challenge the earnings yield provided by equities (Chart II-21). Besides, the volatility observed in equity markets over the past few months makes the European corporate bond more appealing. In the Euro Area, BB-rated bonds, which are the highest credit quality and largest tranche within the high-yield space, are particularly attractive. They sport a 6.6% YTM, at a spread of 480bps over 3-year German government bond yields. This compares to an equity earnings yield of 7.4% (Chart II-21, top panel). In other European corporate bond markets, there is no need to go down in credit quality. Yields-to-maturity for investment grade corporate bonds in the UK, Sweden, and Switzerland provide appealing alternatives to equities, with shorter duration still. This is especially true in Sweden, where the equity earnings yield has collapsed and is now only 60bps above Swedish IG yield, with substantially greater risk. Meanwhile, the spread pickup offered by Swiss IG over Swiss government bonds of similar duration is at its widest in more than ten years (Chart II-21, bottom panel). This week, we turn neutral on European credit versus US credit. Back in March, we made the case that European credit would outperform its US counterpart in response to a more hawkish Fed than the ECB. Since then, European IG outperformed US IG by 1% on a total return basis. However, with the Fed funds rate at 3.25%, traders now expect more monetary policy tightening from the ECB, which often corresponds to an underperformance of Euro Area credit relative to that of the US (Chart II-22, top panel). On the other hand, Swedish IG is expected to outperform US IG over the next six months (Chart II-22, bottom panel). Chart II-21Push Back Against TINA Argument
Push Back Against TINA Argument
Push Back Against TINA Argument
Chart II-22Heed The Message From OIS Curve Differentials
Heed The Message From OIS Curve Differentials
Heed The Message From OIS Curve Differentials
Mathieu Savary, Chief European Strategist Mathieu@bcaresearch.com Jeremie Peloso, Editor/Strategist JeremieP@bcaresearch.com Footnotes
Executive Summary For the first time in a decade, it is much less attractive to buy than to rent a home. In both the UK and US, the mortgage rate is now almost double the average rental yield. To reset the equilibrium between buying and renting a home, either mortgage rates must come down by around 150 bps, or house prices must suffer a large double-digit correction. Or some combination, such as mortgage rates down 100 bps and house prices down 10 percent. In the US, a 10-year upcycle in housing investment has resulted in overinvestment relative to the number of households. Falling house prices coming hot on the heels of a combined stock and bond market crash will unleash a deflationary impulse in 2023, which will return economies to 2 percent inflation. This reiterates our ‘2022-23 = 1981-82’ template for the markets. A coordinated global recession will cause bond prices to enter a sustained rally in 2023, in which the 30-year T-bond yield will fall to sub-2.5 percent. Meanwhile, the S&P 500 will test 3500, or even 3200, before a strong rally will lift it through 5000 later in 2023. It Now Costs Twice As Much To Buy Than To Rent A UK Home!
It Now Costs Twice As Much To Buy Than To Rent A UK Home!
It Now Costs Twice As Much To Buy Than To Rent A UK Home!
Bottom Line: Falling house prices coming hot on the heels of a combined stock and bond market crash will unleash a deflationary impulse in 2023, which will return economies to 2 percent inflation. Feature Mortgage rates around the world have skyrocketed. The UK 5-year fixed mortgage rate which started the year at under 2 percent has more than doubled to over 5 percent. And the US 30-year mortgage rate, which began the year at 3 percent, now stands at an eyewatering 7 percent, its highest level since the US housing bubble burst in 2008. This raises a worrying spectre. Is the recent surge in mortgage rates about to trigger another housing crash? (Chart I-1 and Chart I-2). Chart I-1UK Mortgage Rate Has Doubled
UK Mortgage Rate Has Doubled
UK Mortgage Rate Has Doubled
Chart I-2US Mortgage Rate Has Doubled
US Mortgage Rate Has Doubled
US Mortgage Rate Has Doubled
A good way to answer the question is to compare the cashflow costs of buying versus renting a home. This is because home prices are set by the volume of homebuyers versus home-sellers. If would-be homebuyers decide to rent rather than to buy – because renting gets them ‘more house’ – then it will drag down home prices. Here’s the concern. For the first time in a decade, it is much less attractive to buy than to rent a home. In both the UK and US, the mortgage rate is now almost double the average rental yield. Put another way, whatever your monthly housing budget, you can now rent a home worth twice as much as you can buy (Chart I-3 and Chart I-4). Chart I-3It Now Costs Twice As Much To Buy Than To Rent A UK Home!
It Now Costs Twice As Much To Buy Than To Rent A UK Home!
It Now Costs Twice As Much To Buy Than To Rent A UK Home!
Chart I-4It Now Costs Twice As Much To Buy Than To Rent A US Home!
It Now Costs Twice As Much To Buy Than To Rent A US Home!
It Now Costs Twice As Much To Buy Than To Rent A US Home!
The Universal Theory Of House Prices Buying and renting a home are not the same thing, so the head-to-head comparison between the mortgage rate and rental yield is a simplification. Buying and renting are similar in that they both provide you with somewhere to live, a roof over your head or, in economic jargon, the consumption service called ‘shelter’. But there are two big differences. First, unlike renting, buying a home also provides you with an investment whose value you expect to increase in the long run. Second, unlike renting, buying a home incurs you the costs of maintaining it and keeping it up-to-date. Studies show that the annual cost averages around 2 percent of the value of the home.1 So, versus renting, buying a home provides you with an expected capital appreciation, but incurs you a ‘depreciation’ cost of around 2 percent a year. Which results in the following equilibrium between buying and renting: Mortgage rate = Rental yield + Expected house price appreciation - 2 But we can simplify this. In the long run, the price of any asset must trend in line with its income stream. Therefore, expected house price appreciation equates to expected rental growth. Also, rents move in lockstep with wages (Chart I-5). Understandably so, because rents must be paid from wages. And wage growth itself just equals consumer price inflation plus productivity growth, which averages around 1 percent (Chart I-6). Pulling all of this together, the equilibrium simplifies to: Chart I-5Rents Track Wages
Rents Track Wages
Rents Track Wages
Chart I-6Rent Inflation = Wage Inflation = Consumer Price Inflation + 1
Rent Inflation = Wage Inflation = Consumer Price Inflation + 1
Rent Inflation = Wage Inflation = Consumer Price Inflation + 1
Mortgage rate = Rental yield + Expected consumer price inflation - 1 So, here’s our first conclusion. Assuming central banks achieve their long-term inflation target of 2 percent, the equilibrium becomes: Mortgage rate = Rental yield + 1 Under this assumption, to justify the current UK rental yield of 3 percent, the UK mortgage rate must plunge to 4 percent. But given that the government has just triggered an incipient balance of payments and currency crisis, the mortgage rate is likely to head even higher. In which case the rental yield must rise to at least 4 percent. Meaning either house prices falling 25 percent, or rents rising 33 percent. Meanwhile, to justify the current US rental yield of 3.7 percent, the US mortgage rate must plunge to 4.7 percent. Alternatively, to justify the current mortgage rate of 7 percent, the rental yield must surge to 6 percent. Meaning either house prices crashing 40 percent, or rents surging 60 percent. More likely though, all variables will correct. The equilibrium between buying and renting will be re-established by some combination of lower mortgage rates, lower house prices, and higher rents. The Housing Investment Cycle Is Turning Down The relationship between buying and renting a home raises an obvious counterargument. What if central banks cannot achieve their goal of price stability? In this case, expected inflation in the equilibrium would be considerably higher than 2 percent. This would justify a much higher mortgage rate for a given rental yield. Put differently, it would justify rental yields to stay structurally low (house prices to stay structurally high), even if mortgage rates marched higher. In an inflationary environment, houses would become the perfect foils against inflation. In an inflationary environment, houses would become the perfect foils against inflation because expected rental growth would track inflation – allowing rental yields to stay depressed versus much higher mortgage rates. This is precisely what happened in the 1970s. When the US mortgage rate peaked at 18 percent in 1981, the US rental yield barely got above 6 percent (Chart I-7). Chart I-7In The Inflationary 70s, The Rental Yield Remained Well Below The Mortgage Rate...
In The Inflationary 70s, The Rental Yield Remained Well Below The Mortgage Rate...
In The Inflationary 70s, The Rental Yield Remained Well Below The Mortgage Rate...
If the market fears another such inflationary episode, would it make the housing market a good investment? In the near term, the answer is still no, for two reasons. First, even if rental yields do not track mortgage rates higher point for point, the yields do tend to move in the same direction – especially when mortgage rates surge as they did in the 1970s (Chart I-8). Some of this increase in rental yields might come from higher rents, but some of it might also come from lower house prices. Chart I-8...But Even In The 70s, The Rental Yield And Mortgage Rate Moved Directionally Together
...But Even In The 70s, The Rental Yield And Mortgage Rate Moved Directionally Together
...But Even In The 70s, The Rental Yield And Mortgage Rate Moved Directionally Together
Second, based on the US, it is a bad time in the housing investment cycle. Theoretically and empirically, residential fixed investment tracks the number of households in the economy. But there are perpetual cycles of underinvestment and overinvestment – the most spectacular being the overinvestment boom that preceded the 2007-08 housing crisis. US housing investment has just experienced a 10-year upcycle in which it has overshot its relationship with the number of households. Therefore, contrary to the popular perception, there is not an undersupply of homes, but a marked oversupply relative to the number of households. (Chart I-9). This is important because, as the cycle turns down now – as it did in 1973, 1979, 1990, and 2007 – the preceding overinvestment always weighs down housing valuations (Chart I-10). Chart I-9The US Housing Investment Cycle Has Moved Into Overinvestment
The US Housing Investment Cycle Has Moved Into Overinvestment
The US Housing Investment Cycle Has Moved Into Overinvestment
Chart I-10A Housing Investment Downcycle Always Weighs On Housing Valuations
A Housing Investment Downcycle Always Weighs On Housing Valuations
A Housing Investment Downcycle Always Weighs On Housing Valuations
The Investment Conclusions Let’s sum up. If the market believes that economies will return to price stability, then to reset the equilibrium between buying and renting a home, either mortgage rates must come down by around 150 bps, or house prices must suffer a large double-digit correction. Or some combination, such as mortgage rates down 100 bps and house prices down 10 percent. If the market believes that economies will not return to price stability, then house prices are still near-term vulnerable to rising mortgage rates – especially in the US, as a 10-year upcycle in housing investment has resulted in overinvestment relative to the number of households. US housing investment has just experienced a 10-year upcycle in which it has overshot its relationship with the number of households. Falling house prices coming hot on the heels of a combined stock and bond market crash will unleash a deflationary impulse in 2023, which will return economies to 2 percent inflation – even if the markets do not believe it now. This reiterates our ‘2022-23 = 1981-82’ template for the markets, as recently explained in Markets Still Echoing 1981-82, So Here’s What Happens Next. In summary, a coordinated global recession will cause bond prices to enter a sustained rally in 2023, in which the 30-year T-bond yield will fall to sub-2.5 percent. Meanwhile, the S&P 500 will test 3500, or even 3200, before a strong rally will lift it through 5000 later in 2023. Analysing The Pound’s Crash Through A Fractal Lens Finally, the incipient balance of payments and sterling crisis triggered by the UK government’s unfunded tax cuts has collapsed the 65-day fractal structure of the pound (Chart I-11). This would be justified if the Bank of England does not lean against the fiscal laxness with a compensating tighter monetary policy. But if, as we expect, monetary policy adjusts as a short-term counterbalance, then sterling will experience a temporary, but playable, countertrend bounce. Chart I-11The Pound Usually Turns When Its Fractal Structure Has Collapsed
The Pound Usually Turns When Its Fractal Structure Has Collapsed
The Pound Usually Turns When Its Fractal Structure Has Collapsed
On this assumption, a recommended tactical trade, with a maximum holding period of 65 days, is to go long GBP/CHF, setting a profit target and symmetrical stop-loss at 4 percent. Chart 1Hungarian Bonds Are Oversold
Hungarian Bonds Are Oversold
Hungarian Bonds Are Oversold
Chart 2Copper's Tactical Rebound Maybe Over
Copper's Tactical Rebound Maybe Over
Copper's Tactical Rebound Maybe Over
Chart 3US REITS Are Oversold Versus Utilities
US REITS Are Oversold Versus Utilities
US REITS Are Oversold Versus Utilities
Chart 4FTSE100 Outperformance Vs. Euro Stoxx 50 Is Vulnerable
FTSE100 Outperformance Vs. Euro Stoxx 50 Is Vulnerable
FTSE100 Outperformance Vs. Euro Stoxx 50 Is Vulnerable
Chart 5Netherlands' Underperformance Vs. Switzerland Has Ended
Netherlands' Underperformance Vs. Switzerland Has Ended
Netherlands' Underperformance Vs. Switzerland Has Ended
Chart 6The Sell-Off In The 30-Year T-Bond At Fractal Fragility
The Sell-Off In The 30-Year T-Bond At Fractal Fragility
The Sell-Off In The 30-Year T-Bond At Fractal Fragility
Chart 7Food And Beverage Outperformance Is Exhausted
Food And Beverage Outperformance Is Exhausted
Food And Beverage Outperformance Is Exhausted
Chart 8German Telecom Outperformance Has Started Is Fragile
German Telecom Outperformance Has Started Is Fragile
German Telecom Outperformance Has Started Is Fragile
Chart 9Japanese Telecom Outperformance Vulnerable To Reversal
Japanese Telecom Outperformance Vulnerable To Reversal
Japanese Telecom Outperformance Vulnerable To Reversal
Chart 10The Strong Trend In The 18-Month-Out US Interest Rate Future Is Fragile
The Strong Trend In The 18-Month-Out US Interest Rate Future Is Fragile
The Strong Trend In The 18-Month-Out US Interest Rate Future Is Fragile
Chart 11The Strong Downtrend In The 3 Year T-Bond Is Fragile
The Strong Downtrend In The 3 Year T-Bond Is Fragile
The Strong Downtrend In The 3 Year T-Bond Is Fragile
Chart 12The Outperformance Of Tobacco Vs. Cannabis Is Fragile
The Outperformance Of Tobacco Vs. Cannabis Is Fragile
The Outperformance Of Tobacco Vs. Cannabis Is Fragile
Chart 13Biotech Is A Major Buy
Biotech Is A Major Buy
Biotech Is A Major Buy
Chart 14Norway's Outperformance Has Ended
Norway's Outperformance Has Ended
Norway's Outperformance Has Ended
Chart 15Cotton Versus Platinum Has Reversed
Cotton Versus Platinum Has Reversed
Cotton Versus Platinum Has Reversed
Chart 16Switzerland's Outperformance Vs. Germany Is Exhausted
Switzerland's Outperformance Vs. Germany Is Exhausted
Switzerland's Outperformance Vs. Germany Is Exhausted
Chart 17USD/EUR Is Vulnerable To Reversal
USD/EUR Is Vulnerable To Reversal
USD/EUR Is Vulnerable To Reversal
Chart 18The Outperformance Of MSCI Hong Kong Versus China Has Ended
The Outperformance Of MSCI Hong Kong Versus China Has Ended
The Outperformance Of MSCI Hong Kong Versus China Has Ended
Chart 19US Utilities Outperformance Vulnerable To Reversal
US Utilities Outperformance Vulnerable To Reversal
US Utilities Outperformance Vulnerable To Reversal
Chart 20The Outperformance Of Oil Versus Banks Is Exhausted
The Outperformance Of Oil Versus Banks Is Exhausted
The Outperformance Of Oil Versus Banks Is Exhausted
Dhaval Joshi Chief Strategist dhaval@bcaresearch.com Footnotes 1 The Rate of Return on Everything, 1870–2015 (frbsf.org) Fractal Trading System Fractal Trades
Will Surging Mortgage Rates Crash House Prices?
Will Surging Mortgage Rates Crash House Prices?
Will Surging Mortgage Rates Crash House Prices?
Will Surging Mortgage Rates Crash House Prices?
6-12 Month Recommendations 6-12 MONTH RECOMMENDATIONS EXPIRE AFTER 15 MONTHS, IF NOT CLOSED EARLIER. Structural Recommendations Closed Fractal Trades Indicators To Watch - Bond Yields Chart II-1Indicators To Watch - Bond Yields - Euro Area
Indicators To Watch - Bond Yields - Euro Area
Indicators To Watch - Bond Yields - Euro Area
Chart II-2Indicators To Watch - Bond Yields - Europe Ex Euro Area
Indicators To Watch - Bond Yields - Europe Ex Euro Area
Indicators To Watch - Bond Yields - Europe Ex Euro Area
Chart II-3Indicators To Watch - Bond Yields - Asia
Indicators To Watch - Bond Yields - Asia
Indicators To Watch - Bond Yields - Asia
Chart II-4Indicators To Watch - Bond Yields - Other Developed
Indicators To Watch - Bond Yields - Other Developed
Indicators To Watch - Bond Yields - Other Developed
Indicators To Watch - Interest Rate Expectations Chart II-5Indicators To Watch - Interest Rate Expectations
Indicators To Watch - Interest Rate Expectations
Indicators To Watch - Interest Rate Expectations
Chart II-6Indicators To Watch - Interest Rate Expectations
Indicators To Watch - Interest Rate Expectations
Indicators To Watch - Interest Rate Expectations
Chart II-7Indicators To Watch - Interest Rate Expectations
Indicators To Watch - Interest Rate Expectations
Indicators To Watch - Interest Rate Expectations
Chart II-8Indicators To Watch - Interest Rate Expectations
Indicators To Watch - Interest Rate Expectations
Indicators To Watch - Interest Rate Expectations
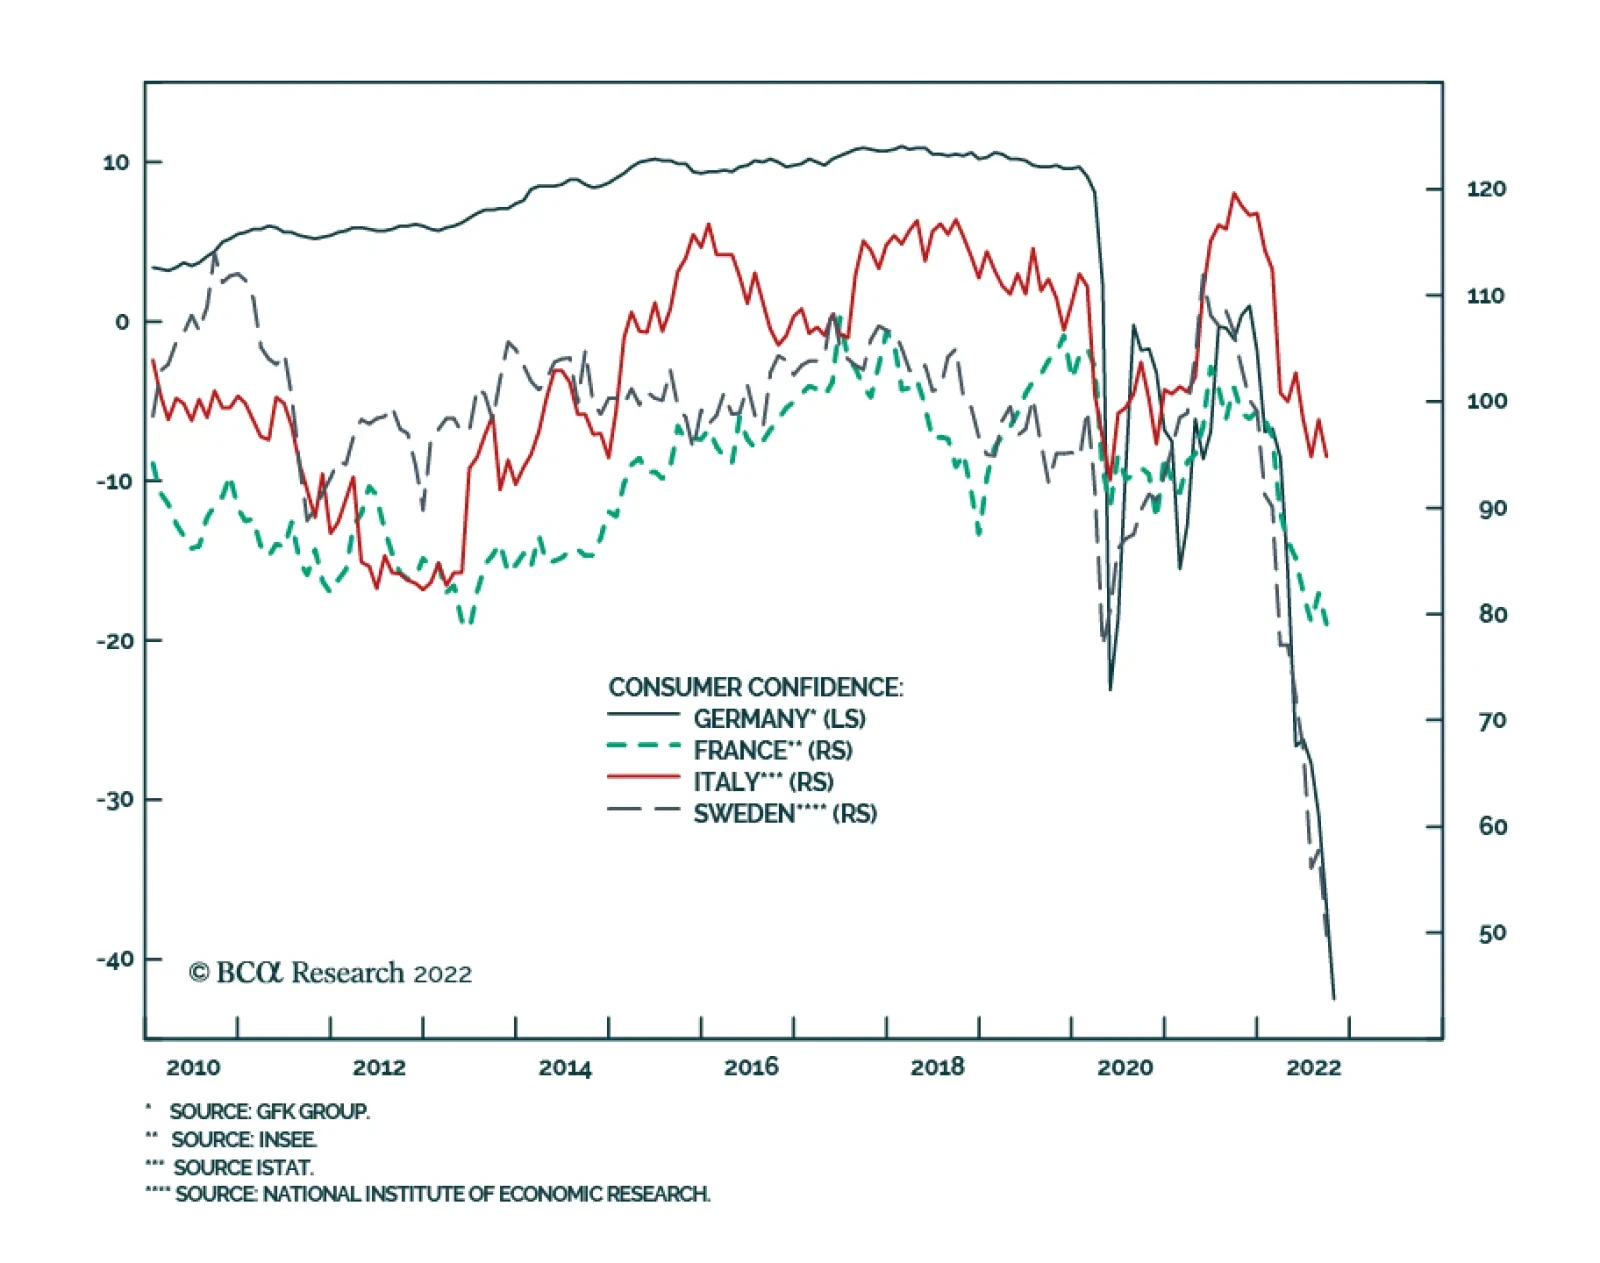
Consumer confidence continues to deteriorate across Europe. In Germany, GFK consumer confidence fell for the fourth straight month, collapsed to a new record low of -42.5 from -36.8. Similarly, French consumer confidence declined from 82 to 79, matching the…
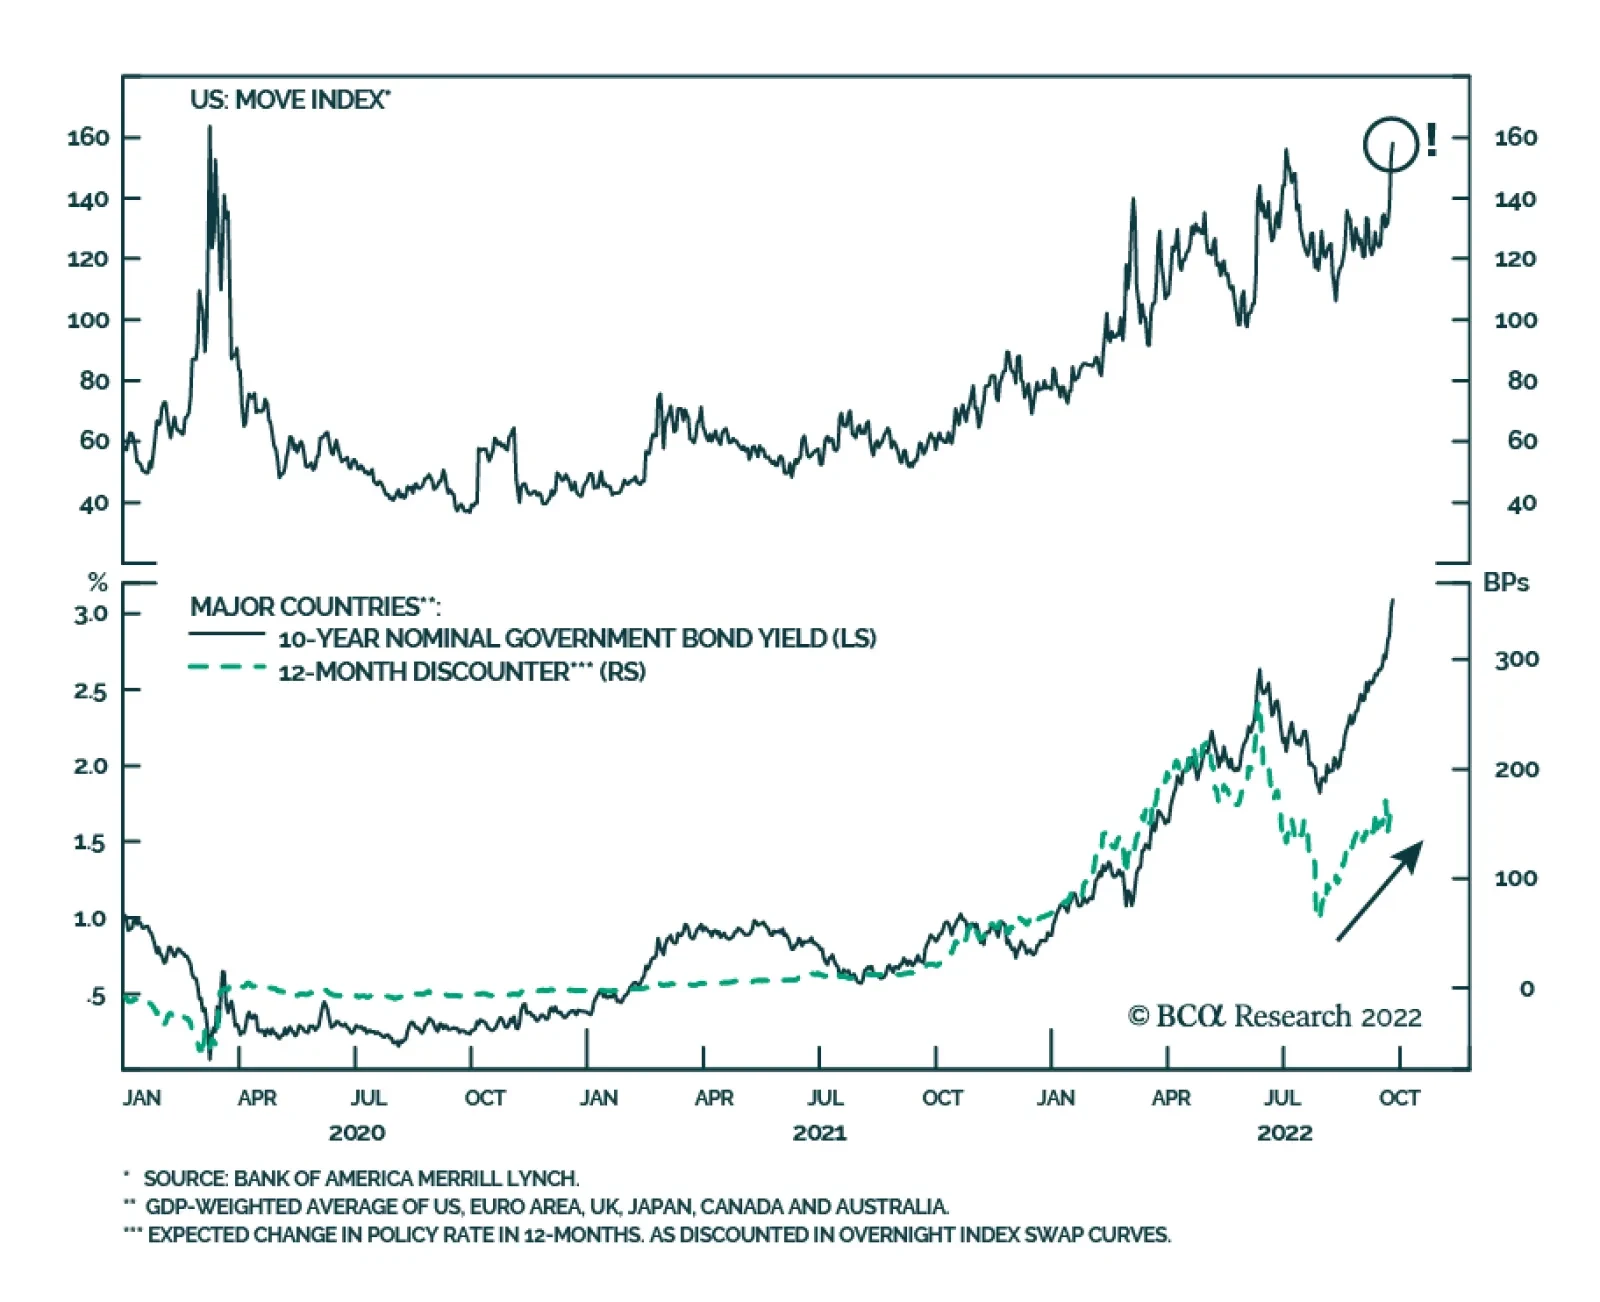
On Tuesday, the MOVE index of US Treasury option volatility hit 158. This is the second highest reading in the post-GFC period (the highest was during the initial shock of the Covid-19 pandemic on March 9, 2020). This comes amid soaring government bond yields…
Executive Summary Biden And Democrats Arrest Fall In Public Opinion
Fourth Quarter US Political Outlook: Gridlock And Stagflation
Fourth Quarter US Political Outlook: Gridlock And Stagflation
US policy is essential to the global macro, policy, and geopolitical outlook in the fourth quarter. Our three key views for 2022 are still in place: the Biden administration is facing congressional gridlock and shifting to executive action and foreign policy. Gridlock will be marginally positive for the stock market but foreign policy crises and additional energy shocks will be very negative. Stay defensive. Our three long-term strategic themes – Generational Change, Peak Polarization, and Limited Big Government – are still on track but the first two will take a back seat during the 2022-24 election cycle. Investors should stay overweight defensive sectors versus cyclicals, large caps versus small caps, cyber security, aerospace/defense, oil and gas transportation/storage, and renewable energy. Go tactically long US treasuries but keep the US dollar on watch for a downgrade. Recommendation (Tactical) INITIATION DATE Return Long DXY (Dollar Index) Feb 23, 2022 18.6% Bottom Line: US policy uncertainty will rise then fall over the course of the midterm election, which will produce gridlock. Gridlock is neutral toward inflation, or disinflationary, and a boon for stocks. But geopolitical risk can still wreak havoc and investors should stay defensive. Feature Market-relevant geopolitical analysis begins with the United States, which remains the critical actor in the international system – as reflected today by the US dollar’s extraordinary bull run both in times of global deflation and inflation (Chart 1). Investors need a base case for US national policy over the course of the 2022-24 election cycle to form a base case for global policy and the macroeconomic and financial outlook. Our annual outlook last December argued that the US had entered a period of greater government involvement in the economy and yet that the Biden administration would face rising checks and balances over the course of 2022 due to thin majorities in Congress, midterm elections, an inflationary macroeconomic environment, and an unstable geopolitical backdrop. Chart 1Dollar Strong During Deflation And Inflation
Dollar Strong During Deflation And Inflation
Dollar Strong During Deflation And Inflation
This forecast is largely intact today so the question is whether these checks and balances will inhibit inflation going forward. Biden has achieved significant liberal policy spending but now looks to be seriously constrained, having little ability to pass domestic legislation going forward. However, he faces three foreign policy crises (Ukraine, Taiwan, Iran), all of which are inflationary on the margin. In the coming months Biden’s foreign policy crises could morph into larger global supply shocks, most notably energy shocks from Russia and/or Iran. New shocks could kill demand and tip the economy into recession. If these risks fail to materialize, tighter monetary policy will reduce inflation but likely also at the cost of higher unemployment and recession. While we will maintain our defensive positioning, we may book some gains on bearish trades over the course of the fourth quarter, namely if we see compelling signs of US political and geopolitical risk subsiding and inflation rolling over. But we do not see that yet. Checking Up On Our Three Key Views For 2022 Here we update our three key views for 2022. We show how they have developed so far this year and what we expect in the final quarter: 1. From Single-Party Rule To Gridlock: In the third quarter the Biden administration made a “last ditch effort” to turn around its fortunes ahead of the midterm election, mainly by focusing on fighting inflation. This effort succeeded in stabilizing support for Biden and the Democratic Party in opinion polls, albeit at low levels (Chart 2). The midterm is usually a check against the party in power and its major policy victories. In 2006 anti-war Democrats imposed a check on the Bush Republicans and the war in Iraq. In 2010 and 2014 Tea Party Republicans imposed a check on Obama Democrats and government intervention into health care. In 2018 anti-Trump Democrats imposed a check on Trump Republicans and tax cuts. In early 2022 the election was shaping up to be a referendum on the Biden Democrats and inflationary spending. But the Supreme Court’s reversal of Roe v. Wade has muddied the usually clear pattern of the “midterm curse.” In critical swing states a majority of voters opposes extensive new restrictions on abortion access (Chart 3). Chart 2Biden And Democrats Arrest Fall In Public Opinion
Fourth Quarter US Political Outlook: Gridlock And Stagflation
Fourth Quarter US Political Outlook: Gridlock And Stagflation
Chart 3Swing States Support Abortion Access
Fourth Quarter US Political Outlook: Gridlock And Stagflation
Fourth Quarter US Political Outlook: Gridlock And Stagflation
Young voters and women are especially motivated to vote for Democrats in reaction to the high court’s ruling (Chart 4). However, so far support for the Democrats among these groups is still lower than it was in 2020-21. And young people are not thrilled with old man Biden. Chart 4Youth And Women’s Support For Democrats
Fourth Quarter US Political Outlook: Gridlock And Stagflation
Fourth Quarter US Political Outlook: Gridlock And Stagflation
Chart 5Voters Care Most About Economy … Where Biden Scores Lowest
Fourth Quarter US Political Outlook: Gridlock And Stagflation
Fourth Quarter US Political Outlook: Gridlock And Stagflation
As we enter the final stretch of the campaign, the president and his party receive the lowest grades on the economy, which is still voters’ top priority (Chart 5). Democrats face a negative cyclical backdrop and macroeconomic headwinds – namely falling real wages, incomes, and consumer confidence (Chart 6). In the House of Representatives, our quantitative election model considers how many seats the ruling party is defending, Congress’s net approval rating, and popular support for the two parties (the generic congressional ballot). The resulting estimate is that Democrats should lose 21 seats, whereas they only need to lose six to yield to Republican control (Table 1). Democrats can achieve a positive surprise and yet fail to retain control of the lower chamber. Chart 6Pocketbook Voter Is Frowning
Pocketbook Voter Is Frowning
Pocketbook Voter Is Frowning
Table 1Our House Election Quant Model Predicts GOP Victory
Fourth Quarter US Political Outlook: Gridlock And Stagflation
Fourth Quarter US Political Outlook: Gridlock And Stagflation
Democrats are more likely to retain the Senate but they cannot afford to lose a single seat on a net basis. State-level economic data, previous Senate margins of victory, presidential approval, the generic congressional ballot, and the tenure of Senate incumbents all suggest that Democrats will lose seats in Arizona and Georgia without gaining any seats, thus yielding control to Republicans. Yet this prediction from our quantitative election model necessarily excludes some of the idiosyncrasies of the 2022 election (Chart 7). Chart 7Our Senate Election Quant Model Favors GOP … But Too Close To Call
Fourth Quarter US Political Outlook: Gridlock And Stagflation
Fourth Quarter US Political Outlook: Gridlock And Stagflation
By contrast, state-level opinion polls suggest that Democrats will hold the Senate: several critical Republican-leaning races are tied while Democrats have a large lead in Arizona (Charts 8A & 8B). In short, the Senate is too close to call. Chart 8ADemocrats Tied In Red-Leaning States, Leading In Blue-Leaning States
Fourth Quarter US Political Outlook: Gridlock And Stagflation
Fourth Quarter US Political Outlook: Gridlock And Stagflation
Chart 8BDemocrats Tied In Red-Leaning States, Leading In Blue-Leaning States
Fourth Quarter US Political Outlook: Gridlock And Stagflation
Fourth Quarter US Political Outlook: Gridlock And Stagflation
As long as Republicans gain one chamber the effect is the same: gridlock. The prevailing wind is voter discontent over inflation. The Misery Index (headline inflation plus unemployment) is reminiscent of the stagflationary 1970s and points to a negative outcome for Democrats in the House overall (Table 2). Table 2Misery Index Signals Democratic Losses To Come
Fourth Quarter US Political Outlook: Gridlock And Stagflation
Fourth Quarter US Political Outlook: Gridlock And Stagflation
Hence the House will fall to the Republicans and single-party control will be broken. The federal spending spree will grind to a halt in 2023-24, which is positive for investors in an inflationary environment. For example, it is the opposite fiscal outcome from what is happening in the UK and Italy, where bonds are selling off sharply. 2. From Legislative To Executive Power: We expected Biden and the Democrats to pass a second budget reconciliation bill, which ended up being the inaptly named Inflation Reduction Act, signed into law on August 16. After that we expected the president to shift to executive action as his legislative options dwindled. There have already been some signs of this shift to executive power, such as President Biden’s tapping of the US Strategic Petroleum Reserve to release 180 million barrels of oil, which helped lower gasoline prices before the election (Chart 9). Biden also relaxed some regulations on fossil fuel production in a reversal of his 2020 call for “phasing out” oil and natural gas. More generally Biden has imposed a large number of economically significant regulations relative to previous administrations (Chart 10). He also unilaterally forgave $420 billion worth of student debt over 30 years. Chart 9Biden Tapped Strategic Petroleum Reserve
Biden Tapped Strategic Petroleum Reserve
Biden Tapped Strategic Petroleum Reserve
Chart 10Biden Flexes Regulatory Muscles
Fourth Quarter US Political Outlook: Gridlock And Stagflation
Fourth Quarter US Political Outlook: Gridlock And Stagflation
This trend toward executive action will intensify if Congress is indeed gridlocked in 2023-24. It is marginally inflationary but likely to be outweighed by disinflationary fiscal drag in 2023. The same trend also feeds into the next point: Biden’s shift from domestic-oriented to foreign-oriented policy. 3. From Domestic To Foreign Policy: Biden did not seek out foreign policy crises. His primary focus lay on domestic legislation and the midterms. His foreign policy intention was merely to solidify US alliances after quarrels under the Trump administration. However, looming gridlock is forcing him to focus more heavily on foreign policy, where presidential powers are greatest. In particular Russia’s invasion of Ukraine has pushed foreign policy to the center of the agenda. Once Biden’s approval ratings collapsed he began to take on greater foreign policy risks, as we noted in May. His foreign policy is reactive and defensive in the sense that he is responding to foreign aggression and trying to avoid any blowback that hurts his party in the midterms. But he can no longer be said to be risk-averse. Instead Biden is doubling down on the enlargement of NATO and military support for Ukraine. He is arming Taiwan and pledging an unequivocal US willingness to defend it in the event of an “unprecedented attack.” He has expanded high-tech export controls on China while maintaining President Trump’s tariffs. And he is threatening to respond “decisively” to Russia in the non-negligible chance that it deploys a tactical nuclear weapon against Ukraine. The US-Iran attempt to rejoin the 2015 nuclear deal is faltering, as we expected, due to mutual distrust. Almost immediately after negotiations failed in August, widespread social unrest broke out in Iran. While Iran’s structural conditions are conducive to social unrest, the Iranian government suspects the US of fomenting unrest, which is possible. Iran is threatening to retaliate. Iran will also continuing making nuclear advances prompting Israel to publicly entertain military options. The Biden administration will be forced to counteract Iranian threats against regional political stability and oil infrastructure. Hence Biden can no longer avoid energy supply risks emanating from the Middle East. The shift from domestic to foreign policy will become even more pronounced in 2023-24, as foreign policy will become more proactive due to gridlock at home. Taken together, gridlock will bring neutral fiscal policy and hawkish foreign policy. Any post-election decline in policy uncertainty will be short-lived. The loss of the House will increase the odds of economic policy mistakes in 2023 and a ruling party change in 2024 (Chart 11). A Republican House can impeach (but not remove) President Biden, put pressure on the Federal Reserve, and engage in brinksmanship over the national debt limit, which will need to be renewed in the third quarter of 2023. Obstructionism will put a floor under policy uncertainty, which will skyrocket as the 2024 election cycle approaches. Chart 11Biden’s 2024 Odds Fall If GOP Wins House
Fourth Quarter US Political Outlook: Gridlock And Stagflation
Fourth Quarter US Political Outlook: Gridlock And Stagflation
Meanwhile proactive US foreign policy is not positive for investors as it risks escalating global instability. None of America’s rivals will be willing to offer major concessions to forge agreements with the Biden administration in 2023-24 because they will fear that President Trump or another populist Republican will retake the White House in 2025 and impose tariffs or sanctions regardless. The US cannot offer credible guarantees. This is how the Iran deal failed and it is likely to prevent a substantial US-China thaw in relations. Bottom Line: The investment takeaways from our key views for 2022 are mostly on track: inflation and policy uncertainty are rising, stocks are performing poorly, bond yields have spiked, and defensive sectors have outperformed cyclicals. These trends could start to shift in the fourth quarter given that domestic policy uncertainty will at least temporarily abate in the US and China after the fall’s political events. However, geopolitical energy shocks could still escalate if Russia or Iran disrupts global oil supply. And investors must plan for the worst. Even without additional energy shocks, Fed rate hikes are likely to precipitate a recession. Gridlock will have a neutral fiscal impact over the course of the subsequent 24 months, which is marginally disinflationary, but proactive US foreign policy will keep high the risk of energy shocks and global policy uncertainty. Checking Up On Our Strategic Themes For The 2020s It is useless to predict specific policy outcomes too far in the future but investors need a framework for understanding the general drift of national policy amid the dramatic macro shifts occurring today. Here is a short update to our strategic themes for the decade: 1. Millennials/GenZ Rising: The death of the Silent Generation, the retirement of the Baby Boomers, and the rise of Generations X, Y, and Z are causing major shifts in the US economy and markets. First, US population growth is not great but better than its developed market peers. Immigration is robust, though it is likely to be restricted somewhat by future administrations (Chart 12). Relatively strong labor force growth implies higher potential growth than developed market peers, assuming US productivity meets or exceeds that of Europe, as it should (Chart 13). As long as this growth is accompanied by decent policy, i.e. not too inflationary, it will produce relatively attractive real returns for investors. Chart 12US Population Growth And Immigration
Fourth Quarter US Political Outlook: Gridlock And Stagflation
Fourth Quarter US Political Outlook: Gridlock And Stagflation
Chart 13US Relative Labor Force And Potential Growth
Fourth Quarter US Political Outlook: Gridlock And Stagflation
Fourth Quarter US Political Outlook: Gridlock And Stagflation
Second, however, inflation will be a recurring problem because population aging is driving a vast redistribution of wealth from older to younger and from generations with a high propensity to save to those with a high propensity to consume. The impact is inflationary since there will be fewer savings to fund investments, according to our Global Investment Strategist Peter Berezin. This trend will drive up equilibrium real interest rates and bond yields (Chart 14). Thus America will witness a tug of war in which a new inflation tendency engenders periodic policy backlashes to keep inflation in check, as is likely in the 2022 midterms. Chart 14Major Redistribution Of Wealth
Fourth Quarter US Political Outlook: Gridlock And Stagflation
Fourth Quarter US Political Outlook: Gridlock And Stagflation
2. Peak Polarization: There is a large gap when it comes to identity and core values both within the Baby Boomer generation and between the Silent Generation and the younger generations. America has seen rapid change in the population’s ethnicity, religion, education, location, and industry. It is also a free country where self-expression is fully indulged, leading to wide extremes in individual and group behavior. Rapid pluralistic change combined with stark income and wealth inequality have fueled political polarization, which has made it increasingly difficult to generate nationwide policy consensus in recent decades (Chart 15). However, the rising electoral weight of the younger generations will resolve some of the most extreme policy differences in favor of the younger generations. Millennials and Generation Z will become more conservative over time but they will still lean to the left of their parents and grandparents on the economic policy spectrum (positive rights, progressive taxes, social spending, proactive regulation). Meaning that social spending and higher taxes will become more, not less, feasible over the long run (Chart 16). Meanwhile the revival of competition among the world’s great powers (multipolarity) is forcing the US population and policymakers to recognize common foreign challenges. This is leading to a new consensus around certain strategic and national interests having to do with trade protectionism, industrial guidance, and foreign policy realism. Chart 15Inequality As A Driver Of Polarization
Inequality As A Driver Of Polarization
Inequality As A Driver Of Polarization
Chart 16Younger Generations Less ‘Capitalist,’ More ‘Socialist’
Fourth Quarter US Political Outlook: Gridlock And Stagflation
Fourth Quarter US Political Outlook: Gridlock And Stagflation
This new consensus can be seen in the passage of bipartisan bills to build infrastructure, promote US manufacturing, shift supply chains to US-allied countries, and impose punitive measures against Russia, China, and Iran (Chart 17). Chart 17New Consensus: Nation Building At Home
New Consensus: Nation Building At Home
New Consensus: Nation Building At Home
3. Limited Big Government: The emerging policy consensus will be federalism but not authoritarianism – a larger but not overwhelming role for government in the economy. Popular opinion is demanding a larger role for the government to reduce domestic social grievances and political instability. It is also demanding greater protections from global trade. Elite opinion requires sustained high investment in national defense. All of this ostensibly points to a new era of Big Government but there are important caveats. The US constitution, private institutions, and popular opinion will continue to prevent the full adoption of a statist model, with its inefficient bureaucracy and excessive regulation. The cost of too much government has already appeared in this year’s surge of inflation, which is motivating a political backlash that will moderate the liberal spending trajectory. In short US governance is shifting from decentralization to centralization but it is a marginal not absolute change (Chart 18). The insurrection of 2021 failed but so did the cultural revolution of 2020. Chart 18New Consensus: Limited Big Government
Fourth Quarter US Political Outlook: Gridlock And Stagflation
Fourth Quarter US Political Outlook: Gridlock And Stagflation
Demographics, politics, and economics all point to a new US policy paradigm in which new generations take over and form a new policy consensus – and yet that consensus is not truly socialist. It is rather a continuation of the American combination of federalism, liberalism, and nationalism. Civil war is likely to be avoided because the economy is stable enough and the political system is flexible enough to prevent the inevitable violent movements and domestic terrorism from causing state fragmentation. Bottom Line: US currency and equity markets have greatly outperformed the rest of the world as financial markets priced the US’s structural advantages in the unstable world after the 2008 financial crisis. This trend is intact for now but could suffer setbacks whenever global growth rebounds and the new US policy consensus leads to higher wages, higher taxes, and lower corporate profitability. Investment Takeaways In our annual forecast we noted that US midterm election years tend to produce a flat stock market, rising bond yields, and the outperformance of defensive sectors. This year has been even worse than normal with the S&P500 down 23% to date and the 10-year Treasury up 243 basis points to date (down 17% in terms of total return). Note, however, that stocks typically rise and bond yields typically fall in the year after the midterm, which may bring some relief in 2023 (Chart 19). We expect this bounce in 2023 but it cannot happen until inflation rolls over decisively. Chart 19Worse Than Average Market Performance In Midterm Election Year
Worse Than Average Market Performance In Midterm Election Year
Worse Than Average Market Performance In Midterm Election Year
The dollar rally is in line with, but exceeding, the interest rate differential between US and European government bonds. This makes sense given the geopolitical risk premium. Dollar strength is not only about euro weakness but is broad-based, as becomes clear when looking at the trade-weighted dollar. We have long argued the dollar would rise in line with global policy uncertainty (Chart 20). While our long DXY trade is long in the tooth, momentum is strong. Defensive sectors will outperform in a strong dollar context. Cyclical sectors have more downside relative to defensives and small caps have more downside relative to large caps. But oil and gas equities have become defensive and have more upside relative to the broad market (Chart 21). Energy volatility will continue to be a driving macro force in the fourth quarter due to the crosswinds of geopolitical supply disruptions and global economic slowdown. We are re-initiating our recommendation to overweight oil and gas transportation and storage stocks relative to the S&P 500. Chart 20US Dollar Reaching Extremes, On Watch For Downgrade
US Dollar Reaching Extremes, On Watch For Downgrade
US Dollar Reaching Extremes, On Watch For Downgrade
Chart 21Energy Volatility To Continue In Q4
Energy Volatility To Continue In Q4
Energy Volatility To Continue In Q4
Renewable energy stocks should also remain an overweight given the new political impetus behind energy security. Tech stocks have more downside in the near term but should bounce back once inflation rolls over and bond yields start to fall. Cyber-security companies will generally trade in line with tech but will also benefit from geopolitical tailwinds. Renewables, cyber-security, and aerospace/defense remain our key overweights (Chart 22), in addition to infrastructure stocks as mentioned earlier in the report. Given the sharp selloff in bonds, the disinflationary aspects of gridlock and eventual recession, and today’s extraordinary geopolitical risks, we recommending buying 10-year treasuries on a tactical basis. Chart 22Stick With Cyber Security, Defense, Renewables Over Long Run
Stick With Cyber Security, Defense, Renewables Over Long Run
Stick With Cyber Security, Defense, Renewables Over Long Run
Matt Gertken Senior Vice President Chief US Political Strategy mattg@bcaresearch.com Jesse Anak Kuri Associate Editor Jesse.Kuri@bcaresearch.com Guy Russell Senior Analyst guyr@bcaresearch.com Yushu Ma Research Analyst yushu.ma@bcaresearch.com Alice Brocheux Research Associate alice.brocheux@bcaresearch.com Strategic View Open Tactical Positions (0-6 Months) Open Cyclical Recommendations (6-18 Months) Table A2Political Risk Matrix
Fourth Quarter US Political Outlook: Gridlock And Stagflation
Fourth Quarter US Political Outlook: Gridlock And Stagflation
Table A3US Political Capital Index
Fourth Quarter US Political Outlook: Gridlock And Stagflation
Fourth Quarter US Political Outlook: Gridlock And Stagflation
Chart A1Presidential Election Model
A Politicized Fed? Another Blue Sweep? And Other Risks
A Politicized Fed? Another Blue Sweep? And Other Risks
Chart A2Senate Election Model
A Politicized Fed? Another Blue Sweep? And Other Risks
A Politicized Fed? Another Blue Sweep? And Other Risks
Table A4House Election Model
A Politicized Fed? Another Blue Sweep? And Other Risks
A Politicized Fed? Another Blue Sweep? And Other Risks
Table A5APolitical Capital: White House And Congress
Fourth Quarter US Political Outlook: Gridlock And Stagflation
Fourth Quarter US Political Outlook: Gridlock And Stagflation
Table A5BPolitical Capital: Household And Business Sentiment
Fourth Quarter US Political Outlook: Gridlock And Stagflation
Fourth Quarter US Political Outlook: Gridlock And Stagflation
Table A5CPolitical Capital: The Economy And Markets
Fourth Quarter US Political Outlook: Gridlock And Stagflation
Fourth Quarter US Political Outlook: Gridlock And Stagflation
Footnotes
The US Conference Board’s Consumer Confidence index firmed in September, corroborating the signal from the University of Michigan measure that household sentiment is improving. The headline index climbed from 103.6 to 108 – the highest level since April – and…
The Commerce Department reported that US orders for durable goods fell 0.2% in August, slightly better than the consensus expectation of a 0.3% drop. An 18.5% decline in nondefense aircraft and parts orders led the decline. Meanwhile, core capital goods…
BCA Research’s US Bond Strategy service expects one more move higher in US Treasury yields before the end of the cyclical bear market. The Fed will continue to lift rates for the next few months, before pausing in Q1 or Q2 of next year. After that, our…