China

Highlights The near-term is fraught with risk for US equities and global risk assets. Investors concerned over uncertainty, a slow recovery, and economic aftershocks must also guard against geopolitics. COVID-19 is not a victory for dictatorship over democracies. Democracies face voters and will ultimately improve government effectiveness. President Trump is likely to lose the US election. As this becomes increasingly likely, his policy will turn more aggressive, increasing geopolitical risks – particularly in US-China relations. Stay short CNY-USD. Stay long defense stocks. Feature Chart 1Another Downdraft Is Likely
Geopolitics Is The Next Shoe To Drop
Geopolitics Is The Next Shoe To Drop
US equity prices have risen 26% since their March 23 low point, but our review of systemic global crises suggests that a re-test of the bottom would not be surprising (Chart 1). A range of mitigating health policies – plus still-growing policy stimulus – will most likely prevent a depression. But a longer than expected economic trough, due to some persistent level of social distancing pre-vaccine, and negative second-order effects, such as emerging market crises, could trigger another wave of selling. Moreover we expect another shoe to drop: geopolitics. A Light At The End Of The Tunnel Governments are starting to get a handle on the COVID-19 pandemic. The number of daily new cases in the European Union, which is most clearly correlated with global equities, has subsided (Chart 2). Chart 2Any Setbacks Will Hit Equity Market Hard
Any Setbacks Will Hit Equity Market Hard
Any Setbacks Will Hit Equity Market Hard
The US is also seeing new cases crest. To be safe one should count on a subsidiary spike that could easily set back US equities after a notable stock market rally (Chart 2, second panel). But Europe has shown that social distancing works, which US investors will recognize. Italy’s Prime Minister Giuseppe Conte is expected to begin the gradual loosening of social controls to restart the economy. Since Italy is the hardest hit of the western nations (second only to Spain), its leaders will not relax lockdown measures unless they are sure they can do so safely (Chart 2, bottom panel). Still, if governments loosen controls too soon, they may have to tighten them again. Uncertainty will therefore persist regarding the pace of economic normalization, which is bound to be slow due to the fact that discretionary spending will remain suppressed, as it is today in China, and the special precautions that at-risk populations like the elderly will have to take. Economic stimulus measures are still growing in size. Japan’s stimulus, which we count at 16% of GDP, is smaller than the headline 20% but still very large. We have long argued that Japan was on the forefront of the move toward debt monetization among developed markets, but COVID-19 has accelerated the paradigm shift. The United Kingdom has now explicitly stated that the Bank of England will directly finance government debt. The Spanish government is proposing Universal Basic Income (UBI), which it hopes to make permanent, rather than merely for the duration of the pandemic. The jury is still out on whether the weak Pedro Sanchez government will be able to pass it but the current is in favor of “whatever it takes.” Italy’s Five Star Movement has long advocated universal basic income and is part of a ruling coalition that has received a wave of popular support to combat the crisis. At present only a more limited “income of emergency” is being legislated, in keeping with the more centrist Democratic Party, a coalition partner. But Italy’s devastation creates the impetus for bolder moves, either by this government or a subsequent government in 2021 or after. The European institutions are backstopping these states, at least for now, so any deeper disagreements about climbing down from stimulus will have to wait until the coming years. The EU itself is likely to announce additional fiscal measures, via the European Stability Mechanism, whose austerity requirements will be waived, and the European Investment Bank. We can see a token agreement on “coronabonds” (joint debt issuance by the Euro Area), but investors should not fixate on the eurobond debate. These would require a new mechanism, which is inexpedient, whereas the existing mechanisms are already sufficient to bankroll the huge deficit spending plans that the member states are already rolling out. The United States is negotiating an additional “phase four” package that could range between $500 billion and $2 trillion, meaning anywhere from 2.5% to 10% of GDP in new measures (Chart 3). Our estimate would err on the high side because it will largely consist of the same key elements as the “phase three” $2.3 trillion package: unemployment benefits and cash to households, plus a larger dollop for local governments than in the last package. Chart 3Fiscal Tsunami Is Still Building
Geopolitics Is The Next Shoe To Drop
Geopolitics Is The Next Shoe To Drop
Congress is scheduled to return to vote the week of April 20, but an early return is entirely possible if the pandemic worsens. If the infection curve is flattening, then Republican Senators may hold out longer in negotiations. Squabbling would cause temporary agitation in equity markets. The Democrats and the Republicans still have a mutual interest in spending profusely: the Republicans to try to salvage their seats through economic improvement by November; the Democrats to prove their election proposition that a larger role for government is necessary. Finally, China is preparing to announce more stimulus. So far Chinese measures amount to only 3% of GDP but this is insufficient given the weakness in China’s economic rebound thus far. The expansion in quasi-fiscal spending (government-controlled credit expansion) is an open question, but we would guesstimate a minimum of 3% of GDP. Dramatic measures should be expected because China is undergoing the first recessionary environment since the Cultural Revolution and President Xi Jinping risks a monumental economic destabilization if he hesitates to shore up aggregate demand, which would ultimately threaten single-party rule. We see little chance of him making this mistake. The problem is that animal spirits and external demand will remain weak regardless, an occasion for disappointments among bullish equity investors. Moreover US-China geopolitical risks are rising again, as discussed below. Our updated list of fiscal measures for 25 countries can be found in the Appendix. Bottom Line: The pandemic is peaking in the US and EU, while more stimulus is coming. This is positive for equity investors with a 12-month time frame but the near-term remains vulnerable to another selloff. Democracies Are Not Less Effective Than Dictatorships The pandemic has given rise to wildly misleading narratives in the financial community and mainstream media about the political ramifications for different nations. Getting these narratives right is important for one’s investment strategy. The most popular is that China “won” – is expanding its global influence – while the United States “lost” – is failing at global leadership. More broadly the authoritarian eastern model is said to be triumphing over the western democratic model. The real distinction among states is whether they were familiar with pandemics emanating from China, the unreliability of China’s transparency and communications, and the need to track and trace infections from the beginning. Thus South Korea, Taiwan, Singapore, Vietnam, and Japan have all had relatively benign experiences and all but Vietnam are democracies, with varying degrees of representation and contestation. Nor is COVID-19 an “eastern” versus “western” thing. Germany did an effective job testing, tracking, and tracing infections as well. Germans are relatively law-abiding and trust Chancellor Angela Merkel and the state governments to “do the right thing.” Canada, with its experience of SARS, has also reacted effectively. Denmark, Austria, and the Czech Republic are already tentatively reopening their economies. Yet the number of new confirmed cases per million people shows that Germany is not wildly different from the US and Italy (Chart 4). The truth is that Italy’s bad fortune alerted the US and G7 states to take the threat more seriously – the US has had good outcomes in Washington State but bad outcomes in highly populated New York. Nor is it true that the American health care system is uniquely terrible in treating patients, as is so widely claimed. US deaths per million are worse than Germany but better than Italy (Chart 5) – and Italy’s health system is also not to blame. Failure of ruling parties to spring into decisive action is the main differentiator. Chart 4US In Line With Italy In New Cases …
Geopolitics Is The Next Shoe To Drop
Geopolitics Is The Next Shoe To Drop
Chart 5… But Better In Limiting Deaths
Geopolitics Is The Next Shoe To Drop
Geopolitics Is The Next Shoe To Drop
Chart 6Dictatorships Good At Halting Freedoms
Geopolitics Is The Next Shoe To Drop
Geopolitics Is The Next Shoe To Drop
Dictatorships have had fewer cases and deaths, if their statistics can be trusted – which is a big if.1 This does not suggest that their governance model is better, but rather that they are better at halting freedoms, such as free movement (Chart 6). North Korea has zero cases of COVID-19. People were already under lockdown. Variation within the dictatorships stems from their policy responses and experience fighting pandemics. China, the origin of several recent outbreaks, has extensive experience. It also has a functional health system, fiscal resources, and a heavily centralized power structure. Iran, however, has less experience and capability. The question now is Russia, which was slow to react and has a growing outbreak, yet has a heavily centralized power structure to flatten the curve. Incidentally domestic risk is an important reason for Russia to cooperate with OPEC on oil production cuts, as we have argued. These points can be demonstrated by comparing COVID-19 deaths per million to each nation’s health capabilities and underlying vulnerability to the disease. Note that our intention is to highlight the role of policy in outcomes, not to attempt a full explanation of an epidemiological phenomenon. In Chart 7A, we judge health capacity by health spending per head and life expectancy at the age of 60. Nations that spend a lot per person, and whose people live longer, have better health systems. Yet many of these states are seeing the highest number of deaths because they are European and Europe was the epicenter of the outbreak. Chart 7ARich, Healthy Countries Got Hit Hardest Because Unprepared
Geopolitics Is The Next Shoe To Drop
Geopolitics Is The Next Shoe To Drop
The US ranks right along with Germany and Sweden.2 Policy responses – early testing, tracking, and tracing – explain why South Korea has far fewer deaths than Italy and Spain on a population-weighted basis. However, the underlying conditions still matter, as the US’s health system, travel bans, and distance from the crisis produced better outcomes than its other policy responses would have implied. These data will be more accurate once the infection curve has flattened across the world. The situation is changing rapidly. If the US rises up in deaths per capita, it will be because of its slow responses, or subsequent policies. The same goes for emerging market economies that are ranking low in deaths but either have not seen the full effect of the pandemic, or had more time to adjust policy due to the crisis in Europe. Emerging market economies have lower health capacity, but also younger and hence healthier populations. The older the society, and the higher proportion of severe illnesses like heart and lung disease, the more susceptible to COVID-19 deaths, as Chart 7B shows. But yet again, the policy response still proves decisive. China has more deaths than some countries that are more vulnerable, because it got hit first. If Brazil and Turkey rise higher and higher above China in deaths, as is likely, it is because of policy failure, not basic vulnerability. Chart 7BEurope And US: Vulnerable Populations, Governments Slow To React
Geopolitics Is The Next Shoe To Drop
Geopolitics Is The Next Shoe To Drop
Russia stands out as especially vulnerable in this Chart 7B. Here is where authoritarian measures may pay off, as with China, but only in the short term – since Russia will still be left with an elderly population highly prone to severe illness and a creaking health system. As mentioned above, the risk to Russian stability is a factor pushing for geopolitical cooperation in oil market cartel behavior to push prices up and improve the fiscal outlook to enable better domestic stability management. Bottom Line: Government policy, particularly preparedness and rapid action, have been the decisive factors in containing COVID-19, not dictatorial or democratic government types. The richest countries have the most freedoms and the most vulnerable elderly demographics. Within the rich countries, southern Europe reacted slowly and got hit hardest, with some exceptions. The US’s incompetence has been overrated, based on deaths, probably because of President Trump’s general unpopularity. These results are preliminary but they suggest that the US and EU will experience political change to address their lack of rapid action. Non-democracies will still have to deal with the recession and the consequences on social stability. Democracies Face Voter Blowback Democracies will face the wrath of voters once the immediate crisis dies down. The crisis has driven people to rally around the flag, creating polling bounces for national leaders and ruling parties. In some cases the trough-to-peak increase in popular support is remarkable – President Trump's approval reached 10 percentage points briefly, and he rose over 50% approval in some polls for the first time in his presidency (Chart 8A). Yet these initial bounces are already subsiding, as in Trump’s case (Chart 8B). Chart 8ADemocracies Are Accountable To Voters
Geopolitics Is The Next Shoe To Drop
Geopolitics Is The Next Shoe To Drop
Chart 8BAnd Polling Bounces Are Fading
Geopolitics Is The Next Shoe To Drop
Geopolitics Is The Next Shoe To Drop
By this measure, the US, Italy, France, and Spain all face serious political reckonings going forward. Trump is the first in the firing line. Our quantitative election model relies on state-level leading economic indicators that are lagging and show him still winning with 273 Electoral College votes (Chart 9A). However, if we introduce a 2008-magnitude economic shock to these indexes, the Democrats flip Michigan, Wisconsin, Pennsylvania, and New Hampshire, yielding 334 Electoral College votes for former Vice President Joe Biden (Chart 9B). This is assuming Trump’s approval rating stays the same, which, at 46%, is strong relative to the whole term in office. Chart 9AOur Quant Election Model Will Turn Against Trump When Data Catches Up
Geopolitics Is The Next Shoe To Drop
Geopolitics Is The Next Shoe To Drop
Chart 9BA 2008-Style Shock To States Gives Democrats The White House
Geopolitics Is The Next Shoe To Drop
Geopolitics Is The Next Shoe To Drop
Our qualitative judgement reinforces our election model. Historically, US elections are referendums on the ruling party. An incumbent president helps the party win reelection. But a recession is usually insurmountable. George Bush Sr lost in 1992 despite a shallow recession that ended the year before. While Joe Biden is a flawed candidate in numerous ways, the question voters face in November is whether they are better off than they were four years ago. With thousands of deaths and an unemployment rate at or above 20%, it is hard to see swing state voters answering “yes.” Not impossible, but we subjectively put the odds at 35%, and that could easily be revised downward if Trump’s polling falls back down to the 42% range. Trump will also be responsible for the handling of the pandemic itself. His administration obviously made several policy mistakes. A paper trail will highlight intelligence warnings as early as November, and warnings from his inner circle as early as January, that will hurt him.3 Objectively, the Republican Party’s greatest policy flaw, prior to COVID-19, was health care – and this will connect with COVID-19 even if the Affordable Care Act (Obamacare) has little to do with crisis response. Bottom Line: The first and most important political casualty of the pandemic will be Trump’s presidency. Not because the US is uniquely incompetent in the face of the pandemic – although it obviously could have done better, judging by several of the other democracies – but because this year happens to be an election year and democracies hold governments accountable. Major Risk Of Clash With China Chart 10China Likely To Depreciate The Renminbi
China Likely To Depreciate The Renminbi
China Likely To Depreciate The Renminbi
There are two downside geopolitical risks that follow directly from the above. First, while the Democratic candidate Joe Biden is a “centrist,” his position will move to the left of the political spectrum. This is to energize the progressive faction of the party – which is already energized. The market will be taken aback if Biden produces major leftward shifts, in the direction of Senator Bernie Sanders, on taxes, regulation, health care, pharmaceuticals, banks, energy, or tech. This is not a problem when the market is down 36%, but as the market rallies, it becomes more relevant. While US taxes and regulation will go up, Biden will still have to win over the Midwestern Rust Belt voter through trade protectionism, a la Trump and Bernie. This will be exacerbated by the pandemic, which has supercharged American popular enmity toward China and fear of supply chain vulnerability toward China. When Biden reveals that he is protectionist too, US equities will react negatively. Second, more immediately, the clash with China may happen much sooner. As President Trump comes to realize he is losing his grip on power, he will have an incentive to retaliate against China for its mishandling of the pandemic, shift the blame, and achieve long-term strategic objectives as well. This makes Trump’s approval rating a critical indicator – not only of his reelection odds, but of whether he determines he has lost and therefore adopts more belligerent foreign or trade policy. We view the danger zone as anything less than 43%. If Trump becomes a lame duck, he could target China, or other countries, such as Venezuela. The advantage of the latter is that it could have the desired political effect without threatening the economic restart. A conflict with Iran would have bigger consequences – particularly negative for Europe. But in the COVID-19 context, Venezuela and Iran are not relevant to American voters. A conflict with North Korea, however, is part of the strategic conflict with China and would be hard to keep separate from broader tensions. This is only likely if Kim Jong Un stages a major provocation. At present, Washington and Beijing are keeping a lid on tensions. Presidents Trump and Xi are in communication. Beijing has rebuked the foreign minister who accused the US military of bringing COVID-19 to Wuhan. Trump has stopped using inflammatory rhetoric about the “Chinese virus.” China is not depreciating the renminbi, it is upholding other aspects of the trade deal, and it is sending face masks and ventilators to assist the US with the health crisis. But this could change. With its economy under extreme pressure, Beijing must take greater moves to stimulate. An obvious victim will be the renminbi, which is arguably stronger than it should be, especially if China cuts interest rates further, no doubt in great part because of the “phase one” trade deal with the United States (Chart 10). If and when Beijing decides that it must ease the downward pressure on exports and the economy, the renminbi will slide. This will provoke Trump. If he is convinced he cannot salvage the economy anyway, then he has an incentive to channel American anger toward China into new punitive measures over currency manipulation. Finally, the ingredients for our “Taiwan black swan” scenario are falling into place. Taiwan has long attempted to gain representation in the World Health Organization but has been blocked by Beijing’s assertion of the One China principle. However, Taiwan is now caught in an escalating tussle with the WHO leadership that involves both Washington and Beijing. Taipei warned the WHO as early as December that COVID-19 could be transmitted by humans and that the pandemic risk was high.4 Both China and the WHO leadership are simultaneously under pressure from the Trump administration for failing to share information and sound the alarm to prepare other nations. Bottom Line: If President Trump decides to prosecute China for its handling of the virus, and/or promote US-Taiwan relations in a way that aggravates China, then the trigger for a major geopolitical incident will have arrived. Investment Implications It is impossible to predict the precise catalyst or timing of such a crisis. We observe that the US and China are each experiencing historic economic dislocation, their strategic relationship has broken down over the past decade, and their populations are incensed at each other over grievances relating to the trade war, COVID-19, and various disinformation campaigns. Taiwan is at the epicenter of this conflict, due to its defense relationship with the United States and renewed political tensions with China under Xi Jinping. But the Chinese tech sector, North Korea, the South and East China Seas, Xinjiang, and Iran are also potential catalysts. Geopolitics is the other shoe to drop in the wake of COVID-19. Presidents Trump and Xi Jinping are the biggest sources of geopolitical risk, as we outlined in our 2020 forecast. They are cooperating in the immediate crisis, but in the aftermath there will be recriminations. A worsening domestic situation, a loss of prestige for either leader, or a foreign policy provocation could trigger punitive measures, saber rattling, or even military incidents. Risk assets are rallying on the light at the end of the tunnel. We are reaching and in some countries passing the peak intensity of the (first wave of the) pandemic. But the economic aftermath is extremely uncertain and the political fallout has hardly begun. In the US, the implication is clearly negative for Trump. But if that implication is realized, it points to much higher geopolitical risks within 2020 than are currently being considered as the world focuses on the virus. If President Trump chooses to wag the dog with Venezuela, that is obviously a much more positive outcome for global risk assets than if he attempts to achieve American strategic objectives of curbing China’s global assertiveness. Tactically, we remain defensive and recommend defensive US equity sectors and the Japanese yen. On a 12-month and beyond time frame we are more bullish on global growth and are long gold and oil. We remain strategically short CNY-USD and short Taiwanese equities relative to Korean. Matt Gertken Vice President Geopolitical Strategist mattg@bcaresearch.com Appendix Appendix TableThe Global Fiscal Stimulus Response To COVID-19
Geopolitics Is The Next Shoe To Drop
Geopolitics Is The Next Shoe To Drop
Footnotes 1 Given that one of Iran’s top health officials has criticized China for its questionable data and lack of transparency, one does not need to trust the US Intelligence Community’s assessment that China misled the world in the early days of the outbreak. See Matthew Petti, "Even Iran Doesn't Believe China's Coronavirus Stats," April 6, 2020. 2 Readers accustomed to the apocalyptic view of the US health system may wonder that the US comes out looking very well on health capacity. This is because we combine and standardize the scores for per capita spending and longevity. However our data also show that the US is inefficient on health: its life expectancy scores are slightly lower than those of the Europeans, yet it spends more per head. 3 See Josh Margolin and James Gordon Meek, "Intelligence report warned of coronavirus crisis as early as November: Sources," ABC News, April 8, 2020, and Maggie Haberman, "Trade Adviser Warned White House in January of Risks of a Pandemic," New York Times, April 6, 2020. 4 See "Taiwan says WHO failed to act on coronavirus transmission warning," Financial Times, March 19, 2020.
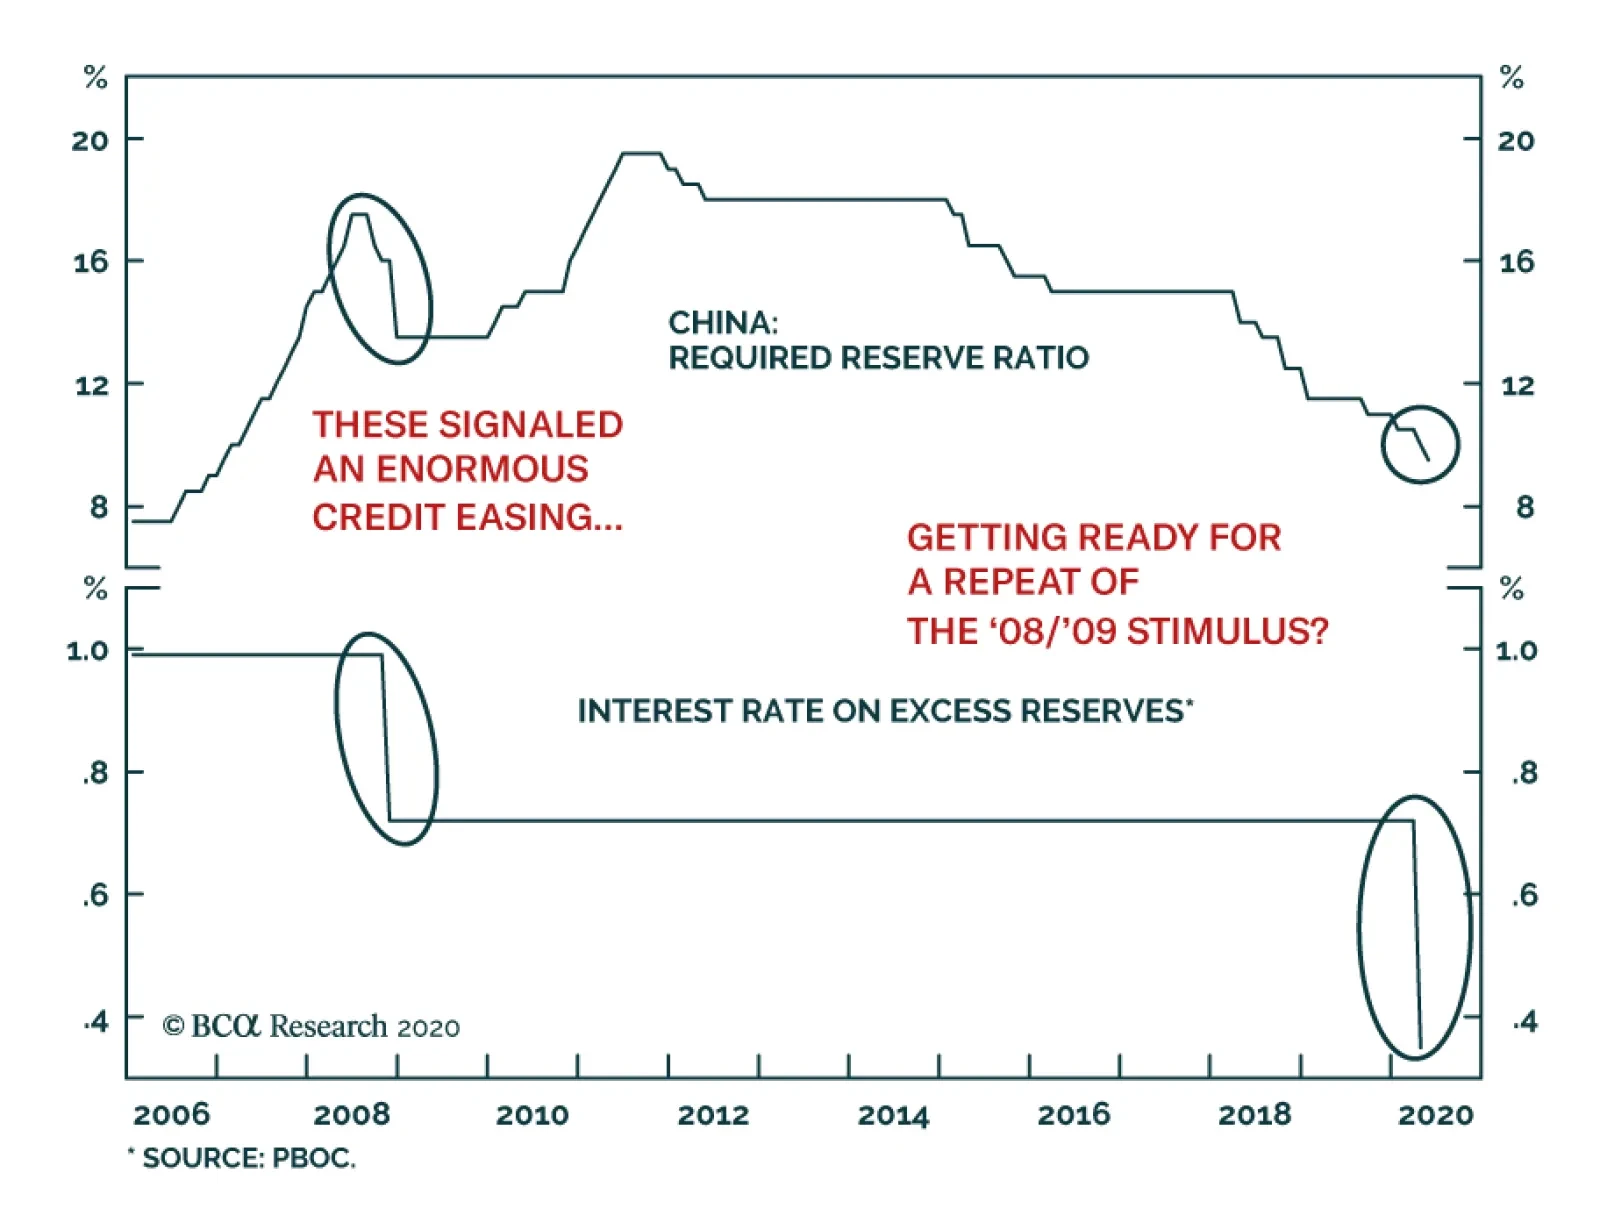
Despite the magnitude of the COVID-19 crisis, China’s stimulus has so far been tepid. However, this will soon change. Chinese policymakers are sending two clear signals that they will aggressively reflate their economy. They have pushed down the reserve…
Dear Client, Next week, we will send you a special report published by our Geopolitical Strategy service, authored by my colleague Roukaya Ibrahim. Roukaya will provide her insights on the global shortages of medical equipment as well as the risk of food shortages. A significant portion of the special report focuses on China. We trust you will find her report very useful. Additionally, I will be having three webcasts next week, discussing the economic and financial implications of the COVID-19 pandemic on China. The webcasts will be in both English and Mandarin. Please check out the dates and time on our website. Best regards, Jing Sima China Strategist Highlights China’s official and Caixin manufacturing PMIs in March were weak at best. The indexes underscore that a quick recovery of Chinese and global economic growth is unlikely. A recent re-lockdown of a Chinese county, along with tightened containment measures in other key Asian economies, illustrates the risk of a second wave of infections and a precarious economic “return to normalcy”. Further policy supports announced in the past week suggest that Chinese authorities may be willing to match the size of stimulus from other major economies. In the next three months, risks to Chinese stock prices are still elevated barring a peak in the global pandemic. We maintain a neutral position in both Chinese investable and domestic stocks. Feature Global financial markets are unlikely to sustainably move higher in an environment where it is uncertain whether the COVID-19 virus is abating and business activities can start resuming (Chart 1). China’s economy and stock prices are not insulated from a deep global recession. Price volatility will remain high in Chinese stocks in the next three months and, therefore, we maintain a neutral position in Chinese investable and domestic stocks. Chart 1Close To A Peak In New Cases?
China Macro And Market Review
China Macro And Market Review
In financial markets, cyclical stocks have underperformed defensives since early March. In particular, information technology, materials, industrials and consumer discretionary, all have underperformed the broad market. This reflects a delayed recovery in China’s economic fundamentals. Tables 1 and 2 highlight key developments in China’s economic and financial market performance in the past month. On the growth front, both the official and Caixin PMIs rebounded to above the 50% boom-bust threshold from historic lows in February. However, the indexes suggest that headwinds to China’s economic recovery are not yet subsiding. Table 1China Macro Data Summary
China Macro And Market Review
China Macro And Market Review
Table 2China Financial Market Performance Summary
China Macro And Market Review
China Macro And Market Review
Chart 2Supply Shock Meets A Collapse In Demand
Supply Shock Meets A Collapse In Demand
Supply Shock Meets A Collapse In Demand
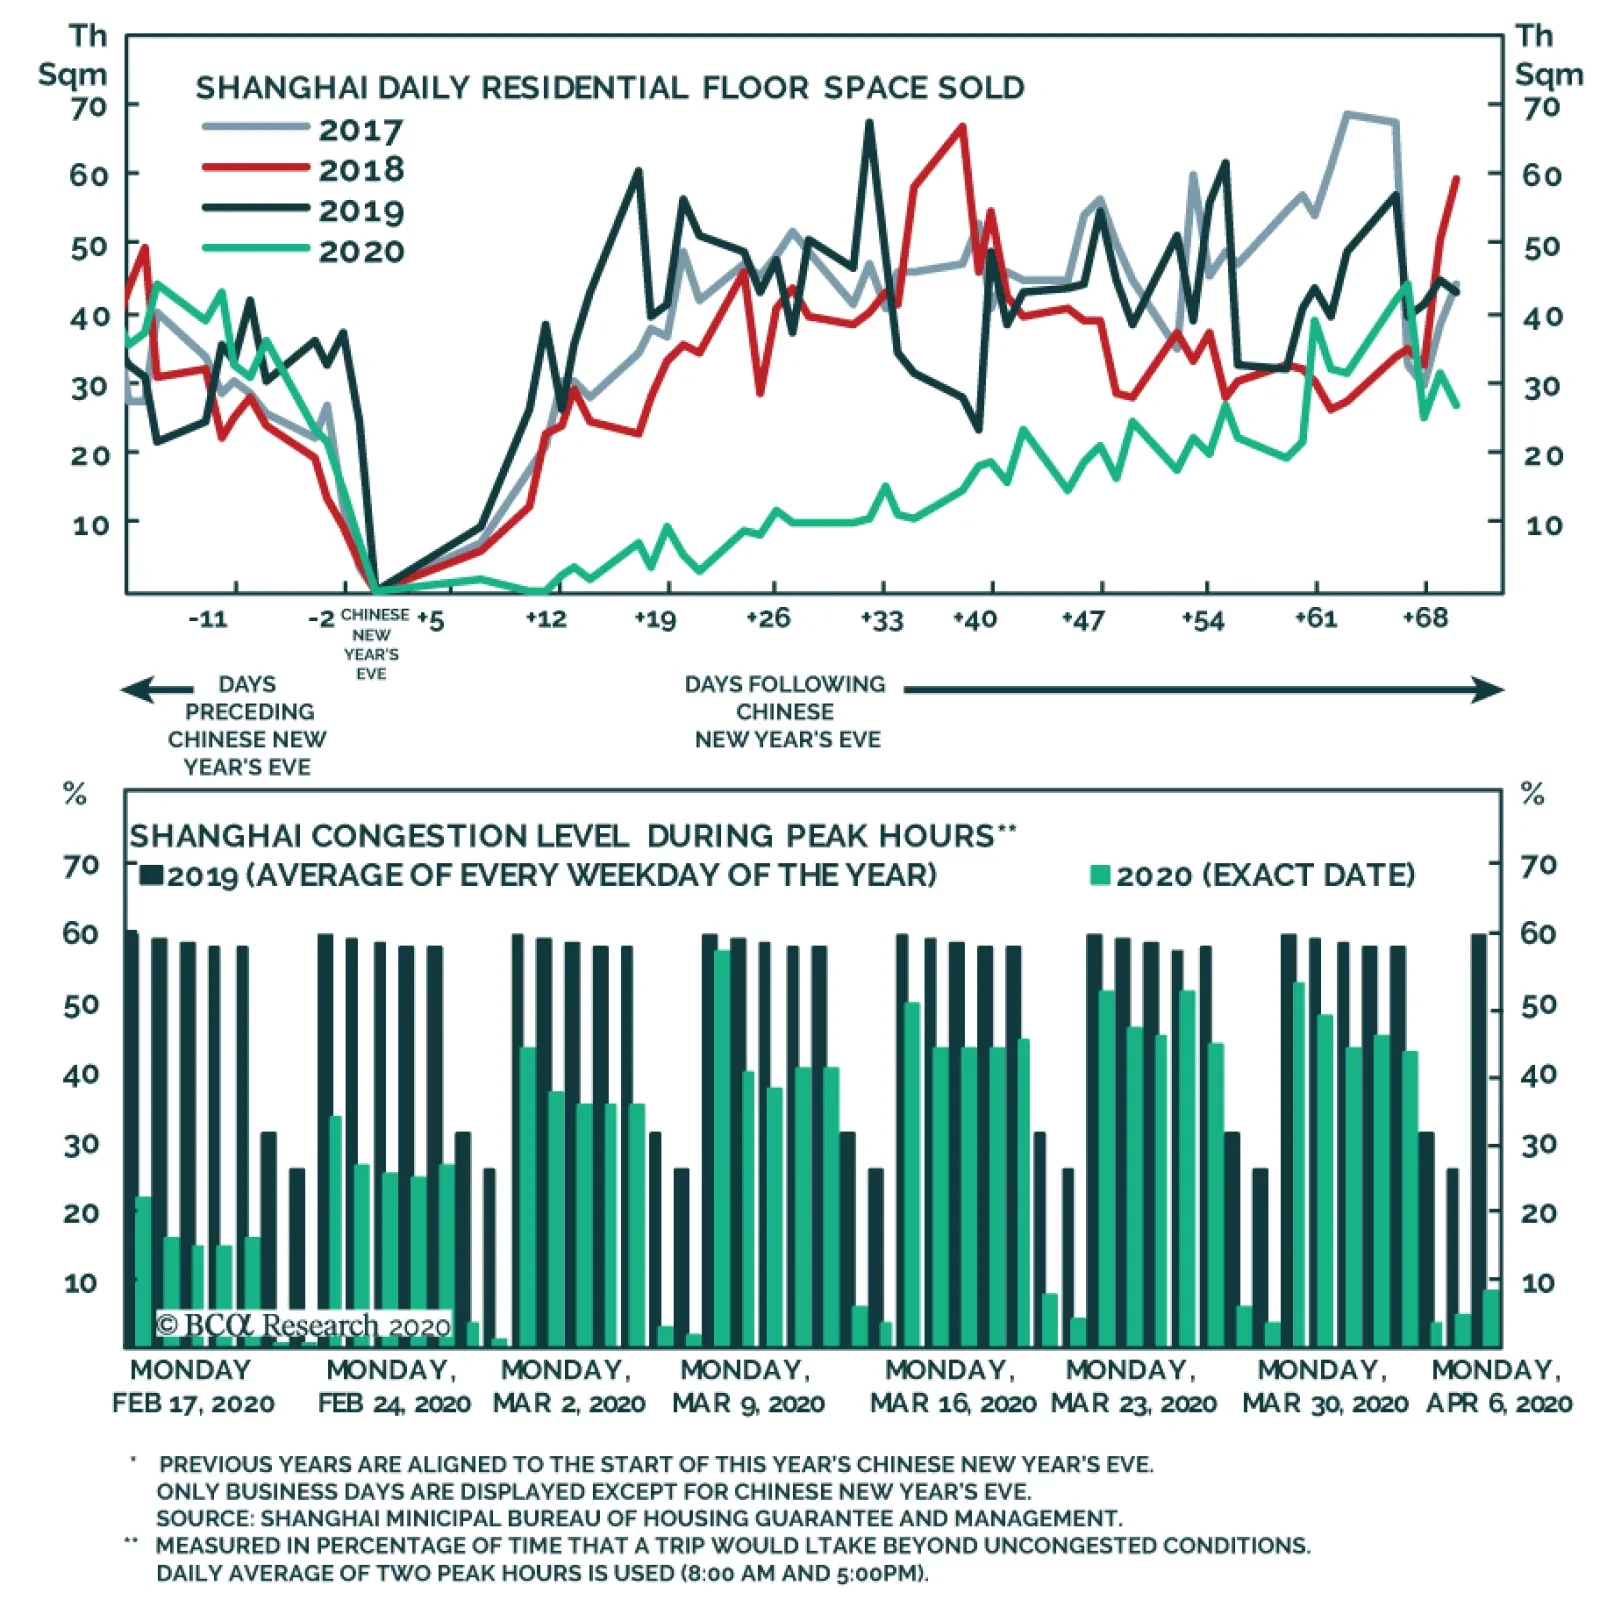
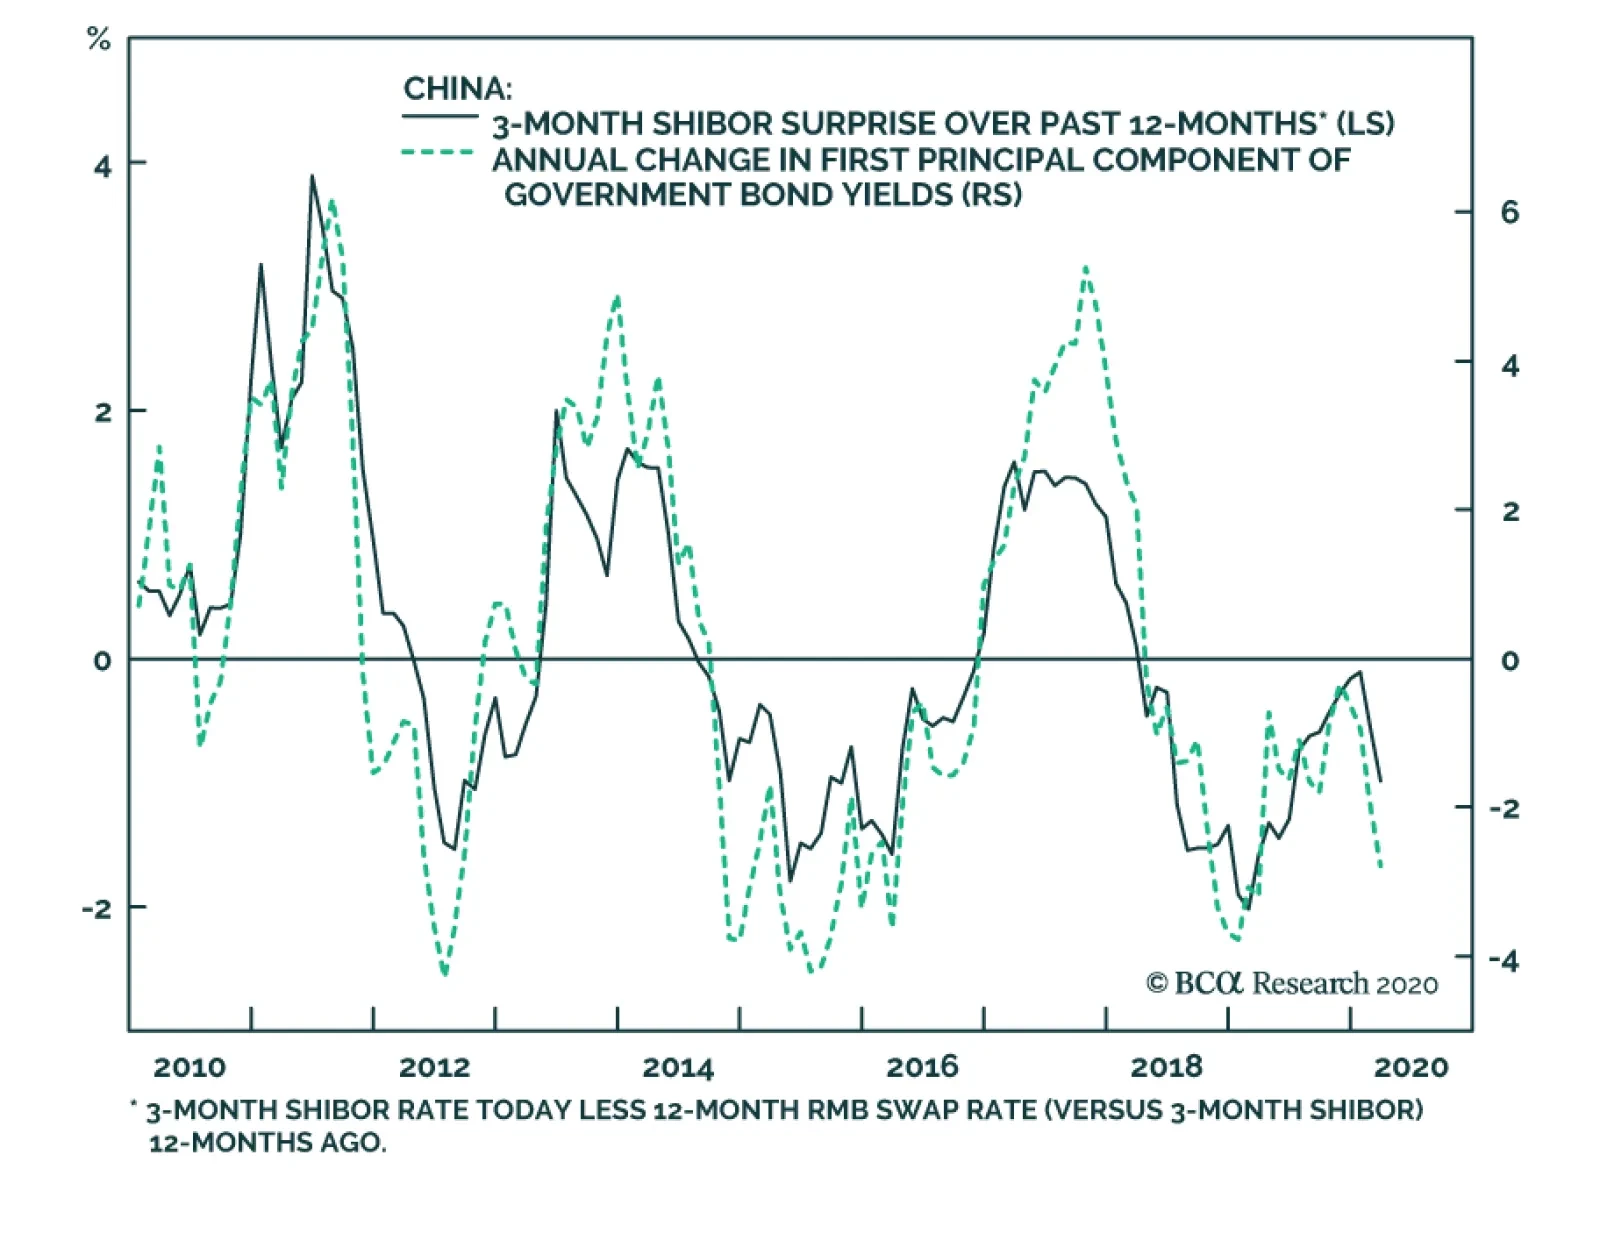
The methodology in calculating PMI indexes reflects the net reported improvement in activity relative to the previous month; a reading of 50 represents no month-over-month change. As such, a 52 reading in March’s official PMI suggests that manufacturing activity in China barely ticked up over February. This is concerning given the extremely depressed level of manufacturing activity in February (Chart 2). Furthermore, two important subcomponents of the PMI remained in contractionary territory even after February’s plunge. While the new orders subcomponent modestly improved in line with the overall index, new export orders and the imports index continued to contract (Chart 2, middle panel). The latter is particularly important for investors who focus on global growth because a modest improvement in Chinese domestic demand that does not translate into import growth is of limited benefit to China's trade partners and global economic activity. In our view, China's March PMI reflects a return to normalcy for the supply side, but it also indicates that domestic demand remains very weak (Chart 2, bottom panel). This is a discouraging result. While March’s economic data in the developed world will likely be uniformly negative, China’s weak PMI readings suggest that its economy may have been impacted by “second-round effects”. This aspect is an ominous sign for developed economies, particularly the US, where the number of new cases continues to escalate. A second wave of infections in China and other Asian nations also underlines the fragility of the rebound, both on the social and economic fronts. Although the pandemic in Asia was largely contained domestically by early March, there is now an increasing number of both imported and domestically transmitted cases. China recently locked down a county of about 600,000 residents and Singapore closed schools and workplaces last week due to a re-emergence of domestic cases.1 There are some encouraging signs in China’s housing market. The monthly real estate sector indicators in Table 1 show the severe impact of the pandemic on China’s property market in the first two months of the year. However, the seasonally adjusted daily data indicate that home sales in China’s 30 large- and medium-sized cities steadily picked up in March (Chart 3). By the end of March, the amount of floor space sold in those cities surpassed the same period of the previous year. A return to normal in housing demand and activity will be crucial for easing property developers’ cash constraints and a recovery in China’s construction sector. On the policy response front, monetary and fiscal stimulus measures continue to roll out. The PBoC chopped its 7-day reverse repo rate by 20bps on March 30, which was the third rate cut in 5 months. It helped to push the 3-month interbank repo rate back to its early-2010 low. We noted in a previous report2 that the 3-month repo rate is China's de facto short-term policy rate and that changes in the rate are strongly linked to average lending rates in the economy (Chart 4). A lowering in the repo rate will help to ease financial conditions and support an eventual rebound in China’s economic activity. Chart 3Signs Of A Gradual Revival In The Housing Market
China Macro And Market Review
China Macro And Market Review
Chart 4Lending Rates Bound To Drop Further
Lending Rates Bound To Drop Further
Lending Rates Bound To Drop Further
Further monetary and fiscal stimulus are also pending. The timing and magnitude of these measures suggest that Chinese policymakers may be willing to step up their efforts to match the size of stimulus from other major economies, such as the US.3 If so, it will support our cyclical (i.e. 6-12 months) overweight investment call on Chinese stocks relative to global benchmarks, even though we believe that the short-term risks to Chinese stock prices are still quite elevated. The PBoC adjusted down the interest rate on financial institutions’ central bank excess reserves from 0.72% to 0.35%, effective April 7. The move is significant: the last time that the PBoC reduced the excess reserve rate was in November 2008 during the global financial crisis. The excess reserve rate drop of 0.37% is also larger than the 0.27% dip in 2008. The cut in excess reserves will free up more liquidity for commercial banks and encourage them to lend to businesses. More importantly, the decrease will lower the floor of PBoC’s “interest rate corridor” and pave the way for further reduction in the MLF (the ceiling of the corridor), LPR, and even the benchmark deposit rate which has remained unchanged for the past five years (Chart 5). Last week’s Politburo meeting approved an increase in this year’s quota of local government special purpose bonds (SPBs) along with a bigger fiscal deficit, and the issuance of special treasury bonds (first time since 2007). We believe the fiscal support will help facilitate double-digit growth in infrastructure spending this year. The exact quantity of the SPB quota will be approved at the upcoming National People’s Congress (NPC), but we think the quota will be close to 4 trillion yuan. This amount, which is equivalent of 4% of China’s GDP, will almost double the 2.15 trillion yuan SPBs issued in 2019. Chart 5Lowering The Floor Opens The Door
Lowering The Floor Opens The Door
Lowering The Floor Opens The Door
Chinese stocks have lost more than 10% of their value year-to-date. In addition, cyclical stocks have underperformed defensives in the past month (Chart 6). We noted in our October 30 Special Report4 that historically these cyclical sectors have been positively correlated with pro-cyclical macroeconomic and equity market variables. Therefore, a return to outperformance in both the aggregate Chinese stocks and cyclical sectors will likely require strong evidence of an upturn in China’s business cycle. Chart 6Cyclicals Vs. Defensives Performance Has Reversed Course
Cyclicals Vs. Defensives Performance Has Reversed Course
Cyclicals Vs. Defensives Performance Has Reversed Course
Chart 7RMB Depreciated Due To A Dollar Rally...
RMB Depreciated Due To A Dollar Rally...
RMB Depreciated Due To A Dollar Rally...
The recent devaluation in the RMB against the USD is linked to the dollar’s strength. In the near term, the downward pressure on the RMB against the greenback will persist because the dollar will strengthen from signs that the global economy is entering a more protracted slowdown5 (Chart 7). We think it is unlikely that the PBoC will intervene in the exchange rate market to prop up the RMB; the weakness in the RMB has been benign and limited compared with a collapse in EM currencies (Chart 8). A strong RMB does not bode well either for China’s export price competitiveness or corporate profits (Chart 9). As such, we think that the PBoC will allow the RMB’s value to remain weak against the dollar. The ongoing race-to-the-bottom in interest rates and competitive currency devaluations have indeed provided a window for the PBoC to cut interest rates even more. Chart 8...But Appreciated Against EM Currencies
...But Appreciated Against EM Currencies
...But Appreciated Against EM Currencies
Chart 9A Strong RMB Is Not Desired In The Current Environment
A Strong RMB Is Not Desired In The Current Environment
A Strong RMB Is Not Desired In The Current Environment
Qingyun Xu, CFA Senior Analyst qingyunx@bcaresearch.com Jing Sima China Strategist jings@bcaresearch.com Footnotes 1 https://www.bloomberg.com/news/articles/2020-04-02/chinese-county-back-under-lockdown-after-infection-re-emerges?mc_cid=e33ef3872b&mc_eid=9da16a4859 https://www.scmp.com/week-asia/health-environment/article/3078297/singapore-close-schools-most-workplaces-next-week 2Please see China Investment Strategy Special Report "How To Analyze And Position Towards Chinese Government Bonds," dated January 29, 2020, available at cis.bcaresearch.com 3China has deployed bank re-lending programs and supplementary funds totaling about 1.5% of its 2019 GDP. A 4 trillion yuan local government SPBs will add more than 4% of GDP in fiscal spending. Fiscal deficit is likely to be augmented by 2% of GDP, and the issuance of special treasury bonds and local government general purpose bonds should amount to more than 2% of GDP. 4Please see China Investment Strategy Special Report "A Guide To Chinese Investable Equity Sector Performance," dated October 30, 2019, available at cis.bcaresearch.com 5Please see Foreign Exchange Strategy Weekly Report "Which Are The Most Attractive G10 Currencies?" dated March 27, 2020, available at fes.bcaresearch.com Cyclical Investment Stance Equity Sector Recommendations
We have been closely monitoring the dynamics of the COVID-19 outbreak in Italy. If the containment of the virus can gather momentum, it could fuel the prospect that other Western countries can also gain control of the epidemic. The data on new infections…
Highlights Global shortages of medical equipment – including medicines – are frontloaded until emergency production kicks in. As the crisis abates, political recriminations between the US and China will surge. The US will seek to minimize medical supply exposure to China going forward, a boon for India and Mexico. China has escaped the COVID-19 crisis with minimal impact on food supply. Pork prices are surging due to African Swine Flu, but meat is a luxury. Still, the “Misery Index” is spiking and this will increase social instability. Food insecurity, inflation, and large current account deficits suggest that emerging market currencies will remain under pressure. Turkey and South Africa stand to suffer while we remain overweight Malaysia. Feature Chart 1Collapse In Economic Activity
Collapse In Economic Activity
Collapse In Economic Activity
With a third of the world population under some form of lockdown, general activity in the world’s manufacturing powerhouses has collapsed (Chart 1). The breakdown is a double whammy on market fundamentals. On the supply side, government-mandated containment efforts force workers in non-essential services to stay home while, on the demand side, households confined to their homes are unable to spend. Acute demand for medical supplies is causing shortages, while supply disruptions threaten states that lack food security. While global monetary and fiscal stimulus will soften the blow (Chart 2), the economic shock is estimated to be a 2% contraction in real GDP for every month of strict isolation. If measures are extended beyond April, markets will sell and new stimulus will be applied. Already the US Congress is negotiating the $1-$2 trillion infrastructure package that we discussed in our March 4 report, and cash handouts will be ongoing. When the dust settles the political fallout will be massive. Authoritarian states like China and especially Iran will face greater challenges maintaining domestic stability. Democracies like Italy and the US, which lead the COVID-19 case count, are the most likely to experience a change in leadership (Chart 3). Initially the ruling parties of the democracies are receiving a bump in opinion polling, but this will fade as households will be worse off and will likely vent their grievances at the ballot box.
Chart 2
Chart 3
Until a vaccine or treatment is discovered, medical equipment and social distancing are the only weapons against the pandemic. National production is (rightly) being redirected from clothing and cars to masks and ventilators to meet the spike in demand. Will the supply shock cause shortages in food and medicine – essential goods for humankind? In this report we address the impact of COVID-19 on global supply security and assess the market implications. Medical Equipment Shortages Will Spur Protectionism
Chart
Policymakers are fighting today’s crisis with the tools of the 2008 crisis, but a lasting rebound in financial markets will depend on surmounting the pandemic, which is prerequisite to economic recovery (Table 1). As the US faces the peak of its COVID-19 outbreak, public health officials and doctors are raising the alarm on the shortage of medical supplies. A recent US Conference of Mayors survey reveals that out of the 38% of mayors who say they have received supplies from their state, 84.6% say they are inadequate (Chart 4). Italy serves as a warning: A reported 8% of the COVID-19 cases there are doctors and health professionals, often treating patients without gloves or with compromised protective gear. These workers are irreplaceable and when they succumb the virus cannot be contained. In the US, doctors and nurses are re-using masks and sometimes treating patients behind a mere curtain, highlighting the supply shortage. While the shortages are mainly driven by a surge in demand from both medical institutions and households, they also come from the supply side, particularly China. Factory closures and transportation disruptions in China earlier this year, coupled with Beijing’s government-mandated export curbs, reduced Chinese exports, a major source of US and global supplies (Chart 5).
Chart 4
Chart 5
Other countries have imposed restrictions on exports of products used in combating the spread of COVID-19. Following export restrictions by the French, German, and Czech governments in early March, the European Commission intervened on March 15 to ensure intra-EU trade. It also restricted exports of protective medical gear outside of the EU. At least 54 nations have imposed new export restrictions on medical supplies since the beginning of the year.1 Both European and Chinese measures will reduce supplies in the US, the top destination for most of these halted exports (Chart 6).
Chart 6
Thus it is no wonder that the Trump administration has rushed to cut import duties and boost domestic production. The administration has released strategic stockpiles and cut tariffs on Chinese medical equipment used to treat COVID-19. With the whole nation mobilized, supply kinks should improve greatly in April. After a debacle in rolling out test kits (Chart 7), the US is rapidly increasing its testing capabilities to manage the crisis, with over a million tests completed as of the end of March (Chart 8). Meanwhile a coalition of companies is taking shape to make face masks. The president has invoked the defense production act to force companies to make ventilators.
Chart 7
Chart 8
However, with the pandemic peaking in the US, the hardest-hit regions will continue experiencing shortages in the near term. Shortages are prompting public outcry against the US government for its failure to anticipate and redress supply chain vulnerabilities that were well known and warned against. A report in The New York Times tells how Mike Bowen, owner of Texas-based mask-maker Prestige Ameritech, has advised the past three presidents about the danger in the fact that the US imports 95% of its surgical masks. “Aside from sitting in front of the White House and lighting myself on fire, I feel like I’ve done everything I can,” he said. He is currently inundated with emergency orders from US hospitals. The same report tells of a company called Strong Manufacturers in North Carolina that had to cut production of masks because it depends on raw materials from Wuhan, China, where the virus originated.2 The Trump administration will suffer the initial public uproar, but the US government will also seek to reduce import dependency going forward, and it will likely deflect some of the blame by focusing on the supply risks posed by China. Beijing, for its part, is launching a propaganda campaign against the US to distract from its own failures at home (some officials have even blamed the US for the virus). Meanwhile it is cranking up production and shipping medical supplies to crisis hit areas like Italy to try to repair its global image after having given rise to the virus. In addition, the city of Shenzhen is sending 1.2 million N95 masks to the US on the New England Patriots’ team plane. Even Russia is sending small donations. But these moves work to propagandistic efforts in these countries and will ultimately shame the Americans into taking measures to improve self-sufficiency. Bottom Line: The most important supply shortage amid the global pandemic is that of medical equipment. While these shortages will abate sooner rather than later, the supply chain vulnerabilities they have exposed will trigger new policies of supply redundancy and import substitution. The US in particular will seek to reduce dependency on China. That COVID-19 is aggravating rather than reducing tensions between these states, despite China’s role as a key supplier in a time of need, highlights the secular nature of their rising tensions. The US-China Drug War Shortages of pharmaceuticals are also occurring, despite the fact that the primary pandemic response is necessarily “non-pharmaceutical” (e.g. social distancing). The US Food and Drug Administration (FDA) announced the first COVID-19 related drug shortage in the US on February 27. While the specific drug was not disclosed, the announcement notes that “the shortage is due to an issue with manufacturing of an active pharmaceutical ingredient used in the drug.”3 The FDA is monitoring 20 other (non-critical) drugs potentially at risk of shortages because the sole source is China. The global spread of the pandemic will increase these shortages. On March 3 India announced export restrictions on 26 drugs, including paracetamol and several antibiotics, due to supply disruptions caused by the Chinese shutdown. While Chinese economic activity has since picked up, India is now among the string of countries under a nationwide lockdown. Similar measures enforced across Europe will also hamper the production and transportation of these goods. The implication is that even if Chinese drugs return to market, supplies further down the chain and from alternative suppliers will take a hit. The risk that this will evolve into a drug shortage depends on the intensity of the outbreak. Drug companies generally hold 3-6 months’ worth of inventories. Consequently, while inventories are likely to draw as supplies are disrupted, consumers may not experience an outright shortage immediately. In the US, as with equipment and protective gear, the government’s strategic stockpile will buffer against shortfalls in supplies of critical drugs. COVID-19 is aggravating rather than reducing US-China tensions. Nevertheless the supply chain is getting caught up in the larger US-China strategic conflict. Even before the pandemic, the US-China trade war brought attention to the US’s vulnerabilities to China’s drug exports. This dispute is not limited to illicit drugs, as with China’s production of the opioid fentanyl, but also extends to mainstream medicines, as highlighted in the selection of public statements shown in Table 2.
Chart
Chart 9
How much does the US rely on China for medicine? According to FDA data, just over half of manufacturing facilities producing regulated drugs in finished dosage form for the US market are located abroad, with China’s share at 7% (Chart 9).4 The figures are higher for manufacturing facilities producing active pharmaceutical ingredients, though still not alarming – 72% of the facilities are located abroad, with 13% in China. Of course, high-level data understate China’s influence. The complex nature of global drug supply chains means that the source of finished dosage forms masks dependencies and dominance higher up the supply chain (Figure 1).
Chart
For instance, active pharmaceutical ingredients produced in Chinese facilities are used as intermediate goods by finished dosage facilities in India as well as China. The FDA reports that Indian finished dosage facilities rely on China for three-quarters of the active ingredients in their generic drug formulations, which are then exported to the US and the rest of the world. Any supply disruption in China – or any other major drug producer – will lead to shortages further down the supply chain.
Chart 10
Chinese influence becomes more apparent when the sample is restricted to generic prescription drugs. These are especially relevant because nearly 70% of Americans are on at least one prescription drug, of which more than 90% are dispensed in the generic form. In this case, 87% of ingredient manufacturers and 60% of finished dosage manufacturers are located outside the US, with 17% of ingredient facilities and 8% of dosage facilities in China (Chart 10). Of all the facilities that manufacture active ingredients that are listed on the World Health Organization’s Essential Medicines List – a compilation of drugs that are considered critical to the health system – 71% are located aboard with 15% located in China (Chart 11). Moreover, manufacturers are relatively inflexible when adapting to market conditions and shortages. Drug manufacturing facilities generally operate at above 80% of their capacity and are thus left with little immediate capacity to ramp up production in reaction to shortages elsewhere. In addition, manufacturers face challenges in changing ingredient suppliers – there is no centralized source of information on them, and additional FDA approvals are required. The US will look to reduce its dependency on China for its drug supplies regardless of 2020 election outcome. China also has overwhelming dominance in specific categories. The Council on Foreign Relations reports that China makes up 97% of the US antibiotics market.5 Other common drugs that are highly dependent on China for supplies include ibuprofen, acetaminophen, hydrocortisone, penicillin, and heparin (Chart 12).
Chart 11
Chart 12
Taking it all together, US vulnerability can be overstated. Consider the following: Of the 370 drugs on the Essential Medicines List that are marketed in the US, only three are produced solely in China. None of these three are used to treat top ten causes of death in the United States. Import substitution is uneconomical. Foreign companies, especially Chinese companies, are attractive due to their lower costs and lax regulations. While China’s influence extends higher up the supply chain, this is true for US markets as well as other consumer markets. While China can cut off the US from the finished dosages it supplies, it cannot do the same for the ingredients that are used by facilities in other countries and eventually make their way to the US in finished dosage form. Americans are demanding that drug prices be reduced and an obvious solution is looser controls on imports. The recent activation of the Defense Production Act shows that the US can take action to boost domestic production in emergencies. Nevertheless, China is growing conspicuous to the American public due to general trade tensions and COVID-19. As it moves up the value chain, it also threatens increasing competition for the US and its allies. Hence the US government will have a strategic reason to cap China’s influence that is also supported by corporate interests and popular opinion. This will lead to tense trade negotiations with China and meanwhile the US will seek alternative suppliers. China will not want to lose market share or leverage over the United States, so it may offer trade concessions at some point to keep the US engaged. Ultimately, however, strategic tensions will catalyze US policy moves to reduce the cost differential with China and promote its rivals. Pressure on China over its currency, regulatory standards, and scientific-technological acquisition will continue regardless of which party wins the White House in 2020. The Democrats would increase focus on China’s transparency and adherence to international standards, including labor and environmental standards. Both Republicans and Democrats will try to boost trade with allies. The key beneficiaries will be India, Southeast Asia, and the Americas. Taiwan’s importance will grow as a middle-man, but so will its vulnerability to strategic tensions. Bottom Line: The US and the rest of the world are suffering shortfalls of equipment necessary to combat COVID-19. There is also a risk of drug shortages stemming from supply disruptions and emergency protectionist policies. These shortages look to be manageable, but they have exposed national vulnerabilities that will be reduced in future via interventionist trade policies. While the US and Europe will ultimately manage the outbreak, the political fallout will be immense. The US will look to reduce its dependency on China. This will increase investment in non-China producers of active pharmaceutical ingredients, such as India and Mexico. The US tactics against China will vary according to the election result, but the strategic direction of diversifying away from China is clear and will have popular impetus in the wake of COVID-19. Food Security In addition to the challenges posed by COVID-19 on medical supplies, food – another essential good – also faces risk of shortages. China is a case in point. Food prices there were on the rise well before the COVID-19 outbreak, averaging 17.3% in the final quarter of 2019. However inflation was limited to pork and its substitutes – beef, lamb and poultry – and reflected a reduction in pork supplies on the back of the African Swine Flu outbreak. While year-on-year increases in the prices of pork and beef averaged 102.8% and 21.0%, respectively, grain, fresh vegetable, and fresh fruit prices averaged 0.6%, 1.5%, and -5.0% in Q42019 (Chart 13). Chart 13Chinese Inflation Has (Thus far) Been Contained To Pork
Chinese Inflation Has (Thus far) Been Contained To Pork
Chinese Inflation Has (Thus far) Been Contained To Pork
Chart 14China's Misery Index Is Spiking - A Political Liability
China's Misery Index Is Spiking - A Political Liability
China's Misery Index Is Spiking - A Political Liability
However China’s COVID-19 containment measures had a more broad-based impact on food supplies, threatening to push up China’s Misery Index (Chart 14). Travel restrictions, roadblocks, quarantined farm laborers, and risk-averse truck drivers introduced challenges not only in ensuring supplies were delivered to consumers, but also to daily farm activity and planting. The absence of farm inputs needed for planting such as seeds and fertilizer, and animal feed for livestock, was especially damaging in regions hardest hit by the pandemic. Livestock farmers already struggling with swine flu-related reductions in herd sizes were forced to prematurely cull starving animals, cutting the stock of chicken and hogs. Now as the country transitions out of its COVID-19 containment phase and moves toward normalizing activity (Chart 15), food security is top of the mind. Authorities are emphasizing the need to ensure sufficient food supplies and adopt policies to encourage production.6 This is especially important for crops due to be planted in the spring. Delayed or reduced plantings would weight on the quality and quantity of the crops, pushing prices up.
Chart 15
With food estimated to account for 19.9% of China’s CPI basket – 12.8% of which goes towards pork (Chart 16) – a prolonged food shortage, or a full-blown food crisis, would be extremely damaging to Chinese families and their pocketbooks.
Chart 16
However, apart from soybeans and to a lesser extent livestock, China’s inventories are well stocked (Chart 17) and are significantly higher than levels amid the 2006-2008 and 2010-2012 food crises. Inventories have been built up specifically to provide ammunition precisely in times of crisis. Corn and rice stocks are capable of covering consumption for nearly three quarters of a year, and wheat stocks exceeding a year’s worth of consumption. Thus, while not completely immune, China today is better able to weather a supply shock. Moreover, with the exception of soybeans, China is not overly dependent on imports for agricultural supplies (Chart 18).
Chart 17
Chart 18
As the COVID-19 epicenter shifts to the US and Europe, farmers there are beginning to face the same challenges. Reports of delays in the arrival of shipments of inputs such as fertilizer and seeds have prompted American farmers to prepare for the worst and order these goods ahead of time.
Chart 19
While these proactive measures will help reduce risks to supply, farmers in Europe and parts of the US who typically rely on migrant laborers will need to search for alternative laborers as the planting season nears. Just last week France’s agriculture minister asked hairdressers, waiters, florists, and others that find themselves unemployed to take up work in farms to ensure food security. As countries become increasingly aware of the risks to food supplies, some have already introduced protectionist measures, especially in the former Soviet Union: The Russian agriculture ministry proposed setting up a quota for Russian grain exports and has already announced that it is suspending exports of processed grains from March 20 for 10 days. Kazakhstan suspended exports of several agricultural goods including wheat flour and sugar until at least April 15. On March 27, Ukraine’s economy ministry announced that it was monitoring wheat export and would take measures necessary to ensure domestic supplies are adequate. Vietnam temporarily suspended rice contracts until March 28 as it checked if it had sufficient domestic supplies. The challenge is that, unlike China, inventories in the rest of the world are not any higher than during the previous food crisis and do not provide much of a buffer against supply shortfalls (Chart 19). Higher food prices would be especially painful to lower income countries where food makes up a larger share of household spending (Chart 20). In addition to using their strategic food stockpiles, governments will attempt to mitigate the impact of higher food prices by implementing a slew of policies:
Chart 20
Trade policies: Producing countries will want to protect domestic supplies by restricting exports – either through complete bans or export quotas. Importing countries will attempt to reduce the burden of higher prices on consumers by cutting tariffs on the affected goods. Consumer-oriented policies: Importing countries will provide direct support to consumers in the form of food subsidies, social safety nets, tax reductions, and price controls. Producer-oriented policies: Governments will provide support to farmers to encourage greater production using measures such as input subsidies, producer price support, or tax exemptions on goods used in production. While these policies will help alleviate the pressure on consumers, they also result in greater government expenditures and lower revenues. Thus, subsidizing the import bill of a food price shock can weigh on public finances, debt levels, and FX reserves. Currencies already facing pressure due to the recessionary environment, such as Turkey, South Africa and Chile will come under even greater downward pressure. Food inventories ex-China are insufficient to protect against supply shortages. Bottom Line: COVID-19’s logistical disruptions are challenging farm output. This is especially true when transporting goods and individuals across borders rather than within countries. This will be especially challenging for food importing countries, as some producers have already started erecting protectionist measures and this will result in an added burden on government budgets that are already extended in efforts to contain the economic repercussions of the pandemic. Investment Implications Chart 21Ag Prices Inversely Correlated With USD
Ag Prices Inversely Correlated With USD
Ag Prices Inversely Correlated With USD
China will continue trying to maximize its market share and move up the value chain in drug production. At the same time, the US is likely to diversify away from China and try to cap China’s market share. This will result in tense trade negotiations regardless of the outcome of the US election. The COVID-19 experience with medical shortages and newfound public awareness of potential medical supply chain vulnerabilities means that another round of the trade war is likely. Stay long USD-CNY. Regarding agriculture, demand for agricultural commodities is relatively inelastic. This inelasticity should prevent a complete collapse in prices even amid a weak demand environment. Thus given the risk on supplies, prices face upward pressure. However, not all crops are facing these same market dynamics. While wheat and rice prices have started to move in line with the dynamics described above, soybeans and to a greater extent corn prices have not reacted as such (Chart 21). In the case of soybeans, we expect demand to be relatively muted. China accounts for a third of the world’s soybean consumption. 80% of Chinese soybeans are crushed to produce meal to feed China’s massive pork industry. However, the 21% y/y decline in pork output in 2019 on the back of the African Swine Flu outbreak will weigh on demand and mute upward pressures on supplies. Demand for corn will also likely come in weak. The COVID-19 containment measures and the resulting halt in economic activity reduce demand for gasoline and, as a consequence, reduce demand for corn-based ethanol, which is blended with gasoline. In addition to the above fundamentals, ag prices have been weighed down by a strong USD which makes ex-US exporters relatively better off, incentivizing them to raise exports and increase global supplies. A weaker USD – which we do not see in the near term – would help support ag prices. It is worth noting that if there is broad enforcement of protectionist measures, then producers will not be able to benefit from a stronger dollar. In that case we may witness a breakdown in the relationship between ag prices and the dollar. In light of these supply/demand dynamics, we expect rice and wheat prices to be well supported going forward and to outperform corn and soybeans. Roukaya Ibrahim Editor/Strategist Geopolitical Strategy RoukayaI@bcaresearch.com Matt Gertken Vice President Geopolitical Strategist mattg@bcaresearch.com Footnotes 1 See "Tackling COVID-19 Together: The Trade Policy Dimension," Global Trade Alert, University of St. Gallen, Switzerland, March 23, 2020. 2 See Rachel Abrams et al, "Governments and Companies Race to Make Masks Vital to Virus Fight," The New York Times, March 21, 2020. 3 The announcement also notes that there are other alternatives that can be used by patients. See "Coronavirus (COVID-19) Supply Chain Update," US FDA, February 27, 2020. 4 All regulated drugs include prescription (brand and generic), over the counter, and compounded drugs. 5 Please see Huang, Yanzhong, "The Coronavirus Outbreak Could Disrupt The US Drug Supply," Council on Foreign Relations, March 5, 2020. 6 The central government ordered local authorities to allow animal feed to pass through checkpoints amid the lockdowns. In addition, Beijing has relaxed import restrictions by lifting a ban on US poultry products and announcing that importers could apply for waivers on goods tariffed during the trade war such as pork and soybeans. The lifting of these restrictions also serves to help China meet its phase one trade deal commitments. Please see "Coronavirus hits China’s farms and food supply chain, with further spike in meat prices ahead," South China Morning Post, dated February 21, 2020.
Highlights Chinese stocks have outperformed global benchmarks by a wide margin. We are taking profits on our overweight position, and downgrading our tactical call on Chinese stocks to neutral. In absolute terms, Chinese stocks have failed to buck the trend in a global selloff of risk assets. This suggests Chinese stocks are not immune to worldwide panics. Investors should wait for a peak in the global pandemic before going long on Chinese equities. Chinese stocks have become less cheap relative to global benchmarks. The size of Chinese stimulus is also less impressive compared with other major economies such as the US. Therefore, in order to maintain an overweight stance on Chinese risk assets in a global portfolio, Chinese stocks need to either offer a better price entry point, or a more upside potential in earnings outlook relative to their global peers. Feature Chart I-1Chinese Stocks Have Significantly Outperformed Global Benchmarks...
Chinese Stocks Have Significantly Outperformed Global Benchmarks...
Chinese Stocks Have Significantly Outperformed Global Benchmarks...
In the current pandemic environment, economic fundamentals mean little to panicked investors who have mostly ignored the unprecedented degree of monetary and fiscal stimulus pouring into the global economy. Investors are looking for clear signs that the COVID-19 crisis can be brought under control, but medical experts have been unable to predict the timing of a peak in the pandemic. Policymakers around the world are beginning to address investors’ concerns that substantial and timely fiscal policy supports are needed to offset the knock-on effects on businesses and individuals.1 However, until the number of new infections in major economies peaks, the erratic trading behavior among global investors will persist. Given the lack of near-term certainty, we are downgrading our tactical stance on Chinese stocks from overweight to neutral. Chart 1 highlights since we upgraded our tactical call to overweight in end-2019, Chinese stocks have significantly outperformed global stocks. This outperformance has been passive in nature; Chinese stocks are down about 10% year-to-date in US$ terms, versus a 23% decline in global stocks. We are also closing 7 of our 10 high-conviction investment calls from our trade book, for reasons cited here and then detailed in the next sections. Of the 10 active trades in our book, 7 have generated a positive return since their inceptions, including 3 that have recorded double-digit gains.2 Investors should wait for clarity on the peak of the global pandemic before going long on risk assets. Investors should wait for more signs of an upside potential in earnings and/or a better price entry point to go long on Chinese stocks. China Is Not Immune To A Global Pandemic Chart I-2...But Their Prices Have Also Plunged In Absolute Terms
...But Their Prices Have Also Plunged In Absolute Terms
...But Their Prices Have Also Plunged In Absolute Terms
Chinese equities have not been immune from the gyrations in the global financial markets, which have not responded to monetary and fiscal stimulus measures in either a customary or predictive manner. Unlike the 2008 global recession triggered by a financial crisis, public health crises damage the economy by reducing human activity and, therefore, erode both supply and demand. A return to normalcy depends almost entirely on whether the pandemic can be contained. Even though Chinese business activities are gradually resuming, Chinese stocks failed to buck the worldwide trend of a liquidation in risk assets. While Chinese stocks have outperformed global benchmarks by a wide margin, the relative gains have mostly been passive since early March. In absolute terms, Chinese domestic stocks have lost all their gains from February and investable stock prices have fallen back to their November 2018 level (Chart 2). Chart I-3Number Of Imported Cases Now On The Rise
Investing During A Global Pandemic
Investing During A Global Pandemic
China is not immune to a second COVID-19 wave. China has been reporting zero-to-low single-digit numbers of locally transmitted cases since mid-March, but it is now experiencing an increase in imported cases from overseas travelers (Chart 3). The mounting numbers have led the Chinese government to shut its borders to non-Chinese citizens.3 This indicates that it is still too early to claim a victory in China’s virus containment efforts. Given that China’s domestic businesses are open, the trajectory of new cases also remains unknown. These lingering doubts will slow the pace in the resumption of Chinese production (Chart 4). Chart I-4Chinese Companies Operating At 80% Capacity
Investing During A Global Pandemic
Investing During A Global Pandemic
Moreover, China is not immune to qualms about the depth and duration of a global recession. China has the political will and policy room to stimulate its economy, and the country’s dominant domestic demand makes the economy relatively insulated from a global recession. However, when more than 40% of China’s trading partners (including Europe and the US) remain under lockdown, a collapse of external demand will weigh on China’s economic and corporate profit recovery in the next quarter or two. Therefore, short-term risks on Chinese stocks are tilted to the downside. Bottom Line: Chinese stocks have failed to buck the trend in the global pandemic and the tsunami selloff in risk assets. Investors should wait for a peak in the outbreak before going long on Chinese equities. Chinese Stocks Have Become Less Cheap Relative To Global Benchmarks Chart I-5Outperformance In Chinese Stocks Seems Quite Extended
Outperformance In Chinese Stocks Seems Quite Extended
Outperformance In Chinese Stocks Seems Quite Extended
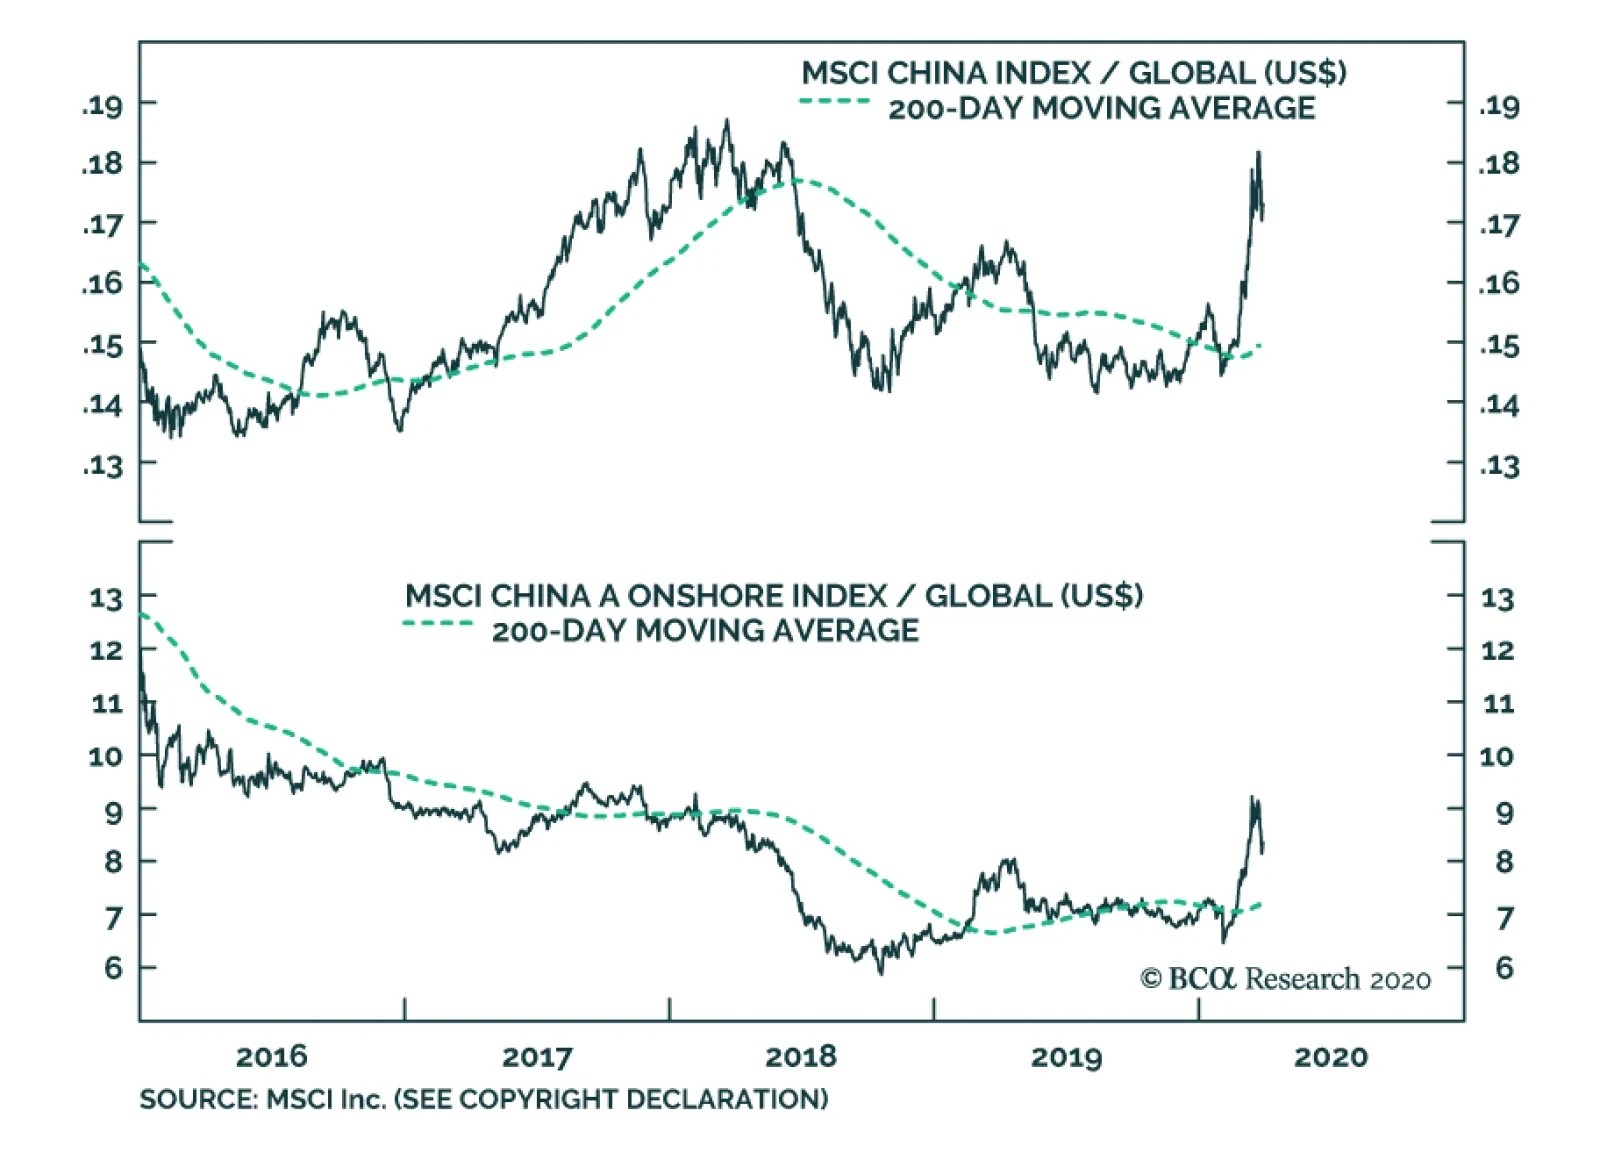
Chinese stocks, particularly in the domestic market, are no longer priced at deep discounts compared with global equities (Chart 5). The recent outperformance of Chinese stocks has brought the relative performance trend in both investable and domestic stocks back close to late-2017/early-2018 levels. That was before the US-China trade war began, and at a point where China’s economy was close to peak strength for the cycle. Although a passive outperformance does not automatically warrant an underweight stance on Chinese stocks, investors will demand a higher upside potential in Chinese corporate earnings to justify an overweight position in Chinese equities. Therefore, we will watch for the following signs before buying Chinese stocks: a strengthening in China’s economy and corporate profits outpacing recoveries in other major economies, and/or a near-term drop in Chinese stock prices outsizing the decline in global stock prices. Given the exceedingly strong policy responses from G20 economies (particularly the US), China’s stimulus will need to be amplified so that investors are confident that the rate of Chinese corporate profit recovery will surpass their global counterparts.4 In a recent Politburo meeting, Chinese policymakers signaled their willingness to expand stimulus, including much larger fiscal deficits and local-government special bond issuance quotas in 2020, along with further interest rate cuts.5 An escalation in policy support will probably bring China’s stimulus in line with that extended in the 2008-2009 global financial crisis. However, the size of the stimulus package will be determined at the National People’s Congress (NPC) meeting, which is delayed to end-April or early May. In the near term, the selloff in Chinese stocks will likely persist as financial markets continue to price in bad news in the global economy. Chinese investable stock prices continue to be priced at a discount relative to global benchmarks, although the discount is much smaller than it was three months ago. In absolute terms, Chinese investable stock prices have not reached their technical support levels. The offshore market historically rebounds when prices approach a major defense line, measured by a 12-year moving average. This technical support for the MSCI China Index is currently 65, still about 13% below the March 30 close (Chart 6). Chart I-6Investable Stock Prices Not Yet At Their Long-Term Support
Investable Stock Prices Not Yet At Their Long-Term Support
Investable Stock Prices Not Yet At Their Long-Term Support
The prices in Chinese domestic stocks have reached their 12-year moving average, although A-share prices are not decisively in a structural “cheap” territory yet (Chart 7). Investors should wait on the sidelines for now, since the full effects of any enhanced stimulus in China will be felt in the real economy with a time lag. China’s production supply side is only operating at about 80% of normal capacity, and demand has yet to catch up (Chart 4 and Chart 8). This suggests the rebound in economic activities in Q2 will likely be gradual, and corporate profits are likely to remain depressed. Chart I-7Domestic Stock Prices Approaching A Structural "Cheap" Territory
Domestic Stock Prices Approaching A Structural "Cheap" Territory
Domestic Stock Prices Approaching A Structural "Cheap" Territory
Chart I-8Demand In Manufacturing Remains Sluggish
Demand In Manufacturing Remains Sluggish
Demand In Manufacturing Remains Sluggish
Bottom Line: Chinese stocks have become less cheap against the backdrop of a massive liquidation of global equities. Chinese existing stimulus also appears moderate compared with other major economies. Therefore, in order for investors to overweight Chinese risk assets in a global portfolio, Chinese stocks either will have to offer a better entry price point or more upside corporate earnings potential. Both are currently missing. Investment Conclusions Investors should stay neutral on Chinese stocks in the next 3 months, and we are closing 7 out of the 10 active positions in our trade book. These trades are especially vulnerable to a protracted global recession and more selloffs in the domestic stock market. We will look for opportunities to incrementally add new trades to our book in the coming months. Here are our reasons for retaining or closing some of our positions: Long China Onshore Corporate Bonds (Maintain): The trade has yielded a handsome return of 16% since its inception in June 2017, (Chart 9). Although the spread in Chinese onshore corporate bond yields has widened sharply in the past few weeks, it has been the result of an indiscriminate global selloff of financial assets rather than the market pricing in any China-centric credit risks (Chart 10). In the next 6 to 12 months, corporate credit spreads should normalize as we expect monetary policies in major economies to remain ultra-loose, the global economy to recover and investors’ risk sentiment to improve. Chinese onshore corporate bonds will likely continue to offer a better risk-reward profile relative to other economies, with a higher risk premium and relatively stable default rate. Chart I-9Chinese Onshore Corporate Bonds Remain Attractive
Chinese Onshore Corporate Bonds Remain Attractive
Chinese Onshore Corporate Bonds Remain Attractive
Chart I-10Corporate Credit Spreads Should Narrow Over A 12-Month Horizon
Corporate Credit Spreads Should Narrow Over A 12-Month Horizon
Corporate Credit Spreads Should Narrow Over A 12-Month Horizon
Long MSCI China Energy Stocks (Close): This trade has had the worst performance among our positions due to consistently falling oil prices since October 2018 (Chart 11). Although BCA’s commodity strategists expect Brent prices to average $36/barrel in 2020, $3 higher than the average oil prices in March, it is still at a 50% discount from the $70 price tag just 3 months ago. Such a minor improvement in the price outlook does not offer enough upside potentials to offset downside risks in earnings in the next 9 months. Therefore, we would rather cut the losses. Long China Domestic Consumer Discretionary Equities Versus Benchmark and Long China Domestic Consumer Discretionary Equities/Short China Domestic Consumer Staples Equities (Close): As explained in the previous sections, we think there will be better entry price points for Chinese stocks as well as cyclical stocks. Besides, discretionary consumption in China has yet to show signs of a meaningful rebound. In the near term, we will also look for opportunities to go long position in domestic consumer staple stocks because we think that food and beverage price inflation will persist well into the second half of this year (Chart 12). Chart I-11Depressed Oil Prices Lead To Significant Underperformance In Energy Stocks
Depressed Oil Prices Lead To Significant Underperformance In Energy Stocks
Depressed Oil Prices Lead To Significant Underperformance In Energy Stocks
Chart I-12Consumer Staple Stocks Should Benefit From Stubbornly High Food Prices
Consumer Staple Stocks Should Benefit From Stubbornly High Food Prices
Consumer Staple Stocks Should Benefit From Stubbornly High Food Prices
Long MSCI China Index, Long MSCI China Onshore Index, Long MSCI China Growth Index/ Short MSCI All Country World (Close): We will need to see more stable sentiment in the global financial markets, a better entry price point for Chinese stocks and a sure sign of outsized Chinese stimulus before reinitiating a long position on Chinese stocks. Jing Sima China Strategist jings@bcaresearch.com Appendix Table 1Massive Stimulus In Response To Pandemic
Investing During A Global Pandemic
Investing During A Global Pandemic
Footnotes 1 Please see Table 1 in the Appendix. 2 Please see the trade table at the end of the report. 3 https://www.bloomberg.com/news/articles/2020-03-26/china-to-suspend-foreigners-entry-starting-saturday?mc_cid=1bdcd29ddd&mc_eid=9da16a4859 4 The stimulus package announced in the US amounts to 9% of the country’s 2019 GDP, whereas China’s stimulus would be about 3% of its 2019 GDP. 5 http://www.xinhuanet.com/politics/leaders/2020-03/27/c_1125778940.htm Cyclical Investment Stance Equity Sector Recommendations
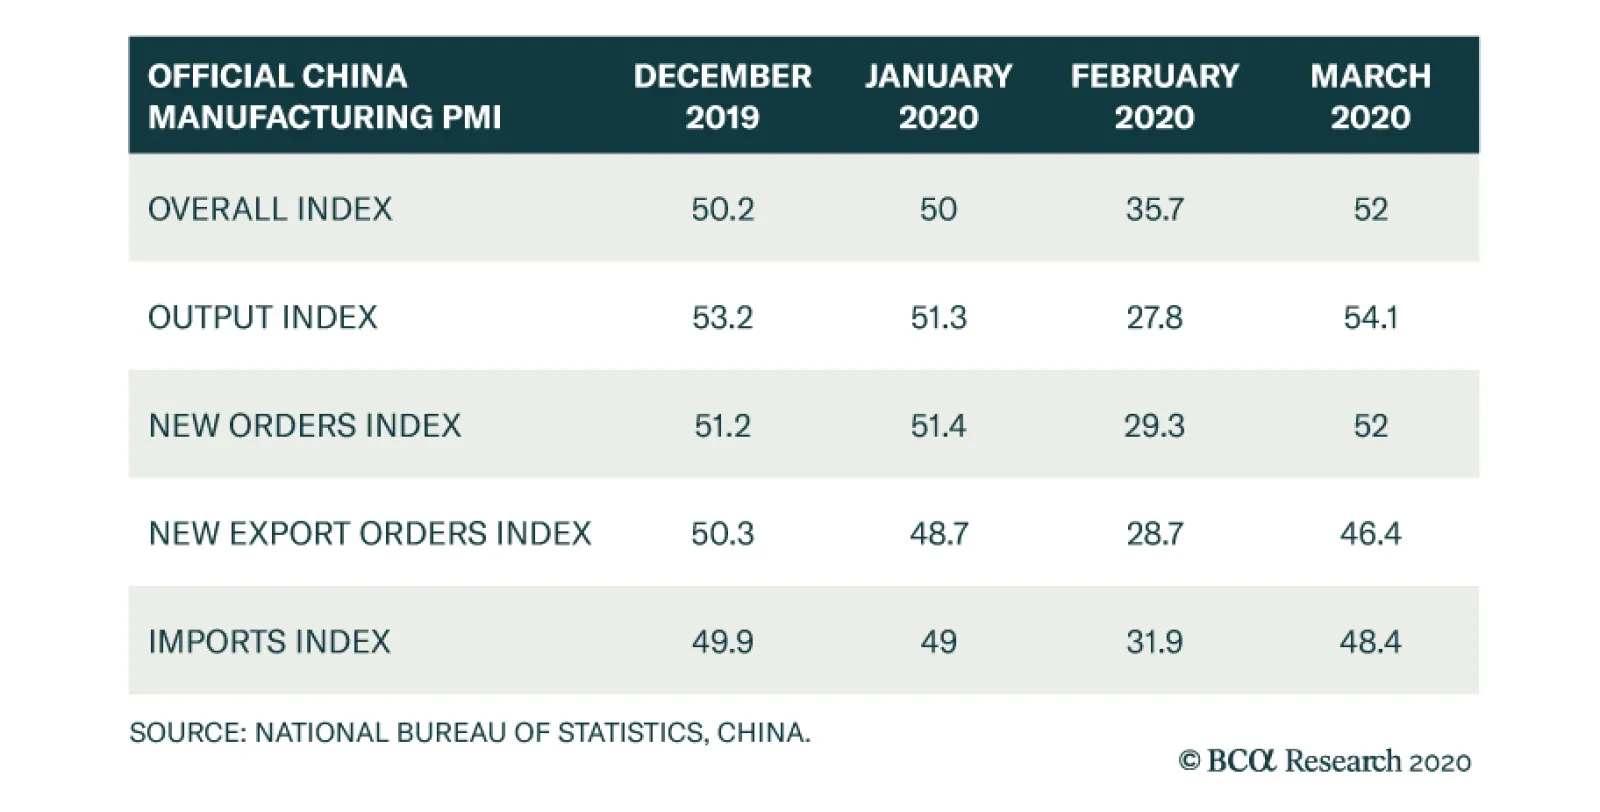
At first blush, China’s official manufacturing PMI release was encouraging. After having fallen from 50 in January to 35.7 in February, the PMI rebounded to 52 in March. The rise was led by the output subcomponent, which rose from 27.8 to 54.1. However, it…
The PBOC cut its 7-day reverse repo rate on Monday, as part of an injection of liquidity into the Chinese banking system. Ma Jun, an advisor to the PBOC, guided expectations towards additional cuts by stating that the PBOC had entered “a stage with stronger…
The COVID-19 pandemic began in China, but it has become the world’s problem. China’s aggressive response to the disease, particularly in Hubei province, means that it is now “outperforming” the world in terms of new cases of the disease, and this…
Highlights The pandemic has a negative impact on households and has not peaked in the US. But a depression is likely to be averted. Our market-based geopolitical risk indicators point toward a period of rising political turbulence across the world. We are selectively adding risk to our strategic portfolio, but remain tactically defensive. Stay long gold on a strategic time horizon. Feature I'm going where there's no depression, To the lovely land that's free from care. I'll leave this world of toil and trouble My home's in Heaven, I'm going there. - “No Depression In Heaven,” The Carter Family (1936) Chart 1The Pandemic Stimulus Versus The Great Recession Stimulus
GeoRisk Update: No Depression
GeoRisk Update: No Depression
Markets bounced this week on the back of a gargantuan rollout of government spending that is the long-awaited counterpart to the already ultra-dovish monetary policy of global central banks (Chart 1). Just when the investment community began to worry about a full-fledged economic depression and the prospect for bank runs, food shortages, and martial law in the United States, the market rallied. Yet extreme uncertainty persists over how long one third of the world’s population will remain hidden away in their homes for fear of a dangerous virus (Chart 2). Chart 2Crisis Has Not Verifiably Peaked, Uncertainty Over Timing Of Lockdowns
GeoRisk Update: No Depression
GeoRisk Update: No Depression
Chart 3The Pandemic Shock To The Labor Market
The Pandemic Shock To The Labor Market
The Pandemic Shock To The Labor Market
While an important and growing trickle of expert opinion suggests that COVID-19 is not as deadly as once thought, especially for those under the age of 50, consumer activity will not return to normal anytime soon.1 Moreover political and geopolitical risks are skyrocketing and have yet to register in investors’ psyche. Consider: American initial unemployment claims came in at a record-breaking 3.3 million (Chart 3), while China International Capital Corporation estimates that China’s GDP will grow by 2.6% for the year. These are powerful blows against global political as well as economic stability. This should convince investors to exercise caution even as they re-enter the equity market. We are selectively putting some cash to work on a strategic time frame (12 months and beyond) to take advantage of some extraordinary opportunities in equities and commodities. But we maintain the cautious and defensive tactical posture that we initiated on January 24. No Depression In Heaven The US Congress agreed with the White House on an eye-popping $2.2 trillion or 10% of GDP fiscal stimulus. At least 46% of the package consists of direct funds for households and small businesses (Chart 4). This includes $290 billion in direct cash handouts to every middle-class household – essentially “helicopter money,” as it is financed by bonds purchased by the central bank (Table 1). The purpose is to plug the gap left by the near complete halt to daily life and business as isolation measures are taken. A depression is averted, but we still have a recession. Go long consumer staples. Chart 4The US Stimulus Package Breakdown
GeoRisk Update: No Depression
GeoRisk Update: No Depression
Table 1Distribution Of Cash Handouts Under US Coronavirus Response Act
GeoRisk Update: No Depression
GeoRisk Update: No Depression
China, the origin of the virus that triggered the global pandemic and recession, is resorting to its time-tried playbook of infrastructure spending, with 3% of GDP in new spending projected. This number is probably heavily understated. It does not include the increase in new credit that will accompany official fiscal measures, which could easily amount to 3% of GDP or more, putting the total new spending at 6%. Germany and the EU have also launched a total fiscal response. The traditionally tight-fisted Berlin has launched an 11% of GDP stimulus, opening the way for other member states to surge their own spending. The EU Commission has announced it will suspend deficit restrictions for all member states. The ECB’s Pandemic Emergency Purchase Program (PEPP) enables direct lending without having to tap the European Stability Mechanism (ESM) or negotiate the loosening of its requirements. It also enables the ECB to bypass the debate over issuing Eurobonds (though incidentally Germany is softening its stance on the latter idea). The cumulative impact of all this fiscal stimulus is 5% of global GDP – and rising (Table 2). Governments will be forced to provide more cash on a rolling basis to households and businesses as long as the pandemic is raging and isolation measures are in place. Table 2The Global Fiscal Stimulus In Response To COVID-19
GeoRisk Update: No Depression
GeoRisk Update: No Depression
President Trump has signaled that he wants economic life to begin resuming after Easter Sunday, April 12. But he also said that he will listen to the advice of the White House’s public health advisors. State governors are the ones who implement tough “shelter in place” orders and other restrictions, so the hardest hit states will not resume activity until their governors believe that the impact on their medical systems can be managed. Authorities will likely extend the social distancing measures in April until they have a better handle on the best ways to enable economic activity while preserving the health system. Needless to say, economic activity will have to resume gradually as the government cannot replace activity forever and the working age population can operate even with the threat of contracting the disease (social distancing policies would become more fine-tuned for types of activity, age groups, and health risk profiles). The tipping point from recession to depression would be the point at which the government’s promises of total fiscal and monetary support for households and businesses become incapable of reassuring either the financial markets or citizens. The largest deficit the US government has ever run was 30% of GDP during World War II (Chart 5). Today’s deficit is likely to go well beyond 15% (5% existing plus 10% stimulus package plus falling revenue). If authorities were forced to triple the lockdown period and hence the fiscal response the country would be in uncharted territory. But this is unlikely as the incubation period of the virus is two weeks and China has already shown that a total lockdown can sharply reduce transmission. Chart 5The US's Largest Peacetime Budget Deficit
The US's Largest Peacetime Budget Deficit
The US's Largest Peacetime Budget Deficit
Any tipping point into depression would become evident in behavior: e.g. a return to panic selling, followed by the closure of financial market trading by authorities, bank runs, shortages of staples across regions, and possibly the use of martial law and curfews. While near-term selloffs can occur, the rest seems very unlikely – if only because, again, the much simpler solution is to reduce the restrictions on economic activity gradually for the low-risk, healthy, working age population. Bottom Line: Granting that the healthy working age population can and will eventually return to work due to its lower risk profile, unlimited policy support suggests that a depression or “L-shaped” recovery is unlikely. The Dark Hour Of Midnight Nearing While the US looks to avoid a depression, there will still be a recession with an unprecedented Q2 contraction. The recovery could be a lot slower than bullish investors expect. Global manufacturing was contracting well before households got hit with a sickness that will suppress consumption for the rest of the year. There is another disease to worry about: the dollar disease. The world is heavily indebted and holds $12 trillion in US dollar-denominated debt. Yet the dollar is hitting the highest levels in years and global dollar liquidity is drying up. The greenback has rallied even against major safe haven currencies like the Japanese yen and Swiss franc (Chart 6). Of course, the Fed is intervening to ensure highly indebted US corporates have access to loans and extending emergency dollar swap lines to a total of 14 central banks. But in the near term global growth is collapsing and the dollar is overshooting. This can create a self-reinforcing dynamic. The same goes for any relapse in Chinese growth. Unlike in 2008 – but like 2015 – China is the epicenter of the global slowdown. China has much larger economic and financial imbalances today than it did in 2003 when the SARS outbreak occurred, and it will increase these imbalances going forward as it abandons its attempt to deleverage the corporate sector (Chart 7). Chart 6The Greenback Surge Deprives The World Of Liquidity
The Greenback Surge Deprives The World Of Liquidity
The Greenback Surge Deprives The World Of Liquidity
Chart 7China's Financial Imbalances Are A Worry
China's Financial Imbalances Are A Worry
China's Financial Imbalances Are A Worry
The rest of emerging markets face their own problems, including poor governance and productivity, as well as the dollar disease and the China fallout. They are unlikely to lift themselves out of this crisis, but they could become the source for credit events and market riots that prolong the global risk-off phase. Bottom Line: It is too soon to sound the all-clear. If the dollar continues on its rampage, then the gigantic stimulus will not be enough, markets will relapse, and fears of deflation will grow. World Of Toil And Trouble Political risk is the next shoe to drop. The pandemic and recession are setting in motion a political earthquake that will unfold over the next decade. Almost all of our 12 market-based geopolitical risk indicators have exploded upward since the beginning of the year. Chart 8China's Political Risk Is Rising
China's Political Risk Is Rising
China's Political Risk Is Rising
These indicators show that developed market equities and emerging market currencies are collapsing far more than is justified by underlying fundamentals. This risk premium reflects the uncertainty of the pandemic, but the recession will destabilize regimes and fuel fears about national security. So the risk premium will not immediately decline in several important cases. China’s political risk is shooting up, as one would expect given that the pandemic began in Hubei (Chart 8). The stress within the Communist Party can be measured by the shrill tone of the Chinese propaganda machine, which is firing on all cylinders to convince the world that Chinese President Xi Jinping did a great job handling the virus while the western nations are failing states that cannot handle it. The western nations are indeed mishandling it, but that does not solve China’s domestic economic and social troubles, which will grow from here. Of course, our political risk indicator will fall if Chinese equities rally more enthusiastically than Chinese state banks expand credit as the economy normalizes. But this would suggest that markets have gotten ahead of themselves. By contrast, if China surges credit, yet equity investors are unenthusiastic, then the market will be correctly responding to the fact that a credit surge will increase economic imbalances and intensify the tug-of-war between authorities and the financial system, particularly over the effort to prevent the property sector bubble from ballooning. China needs to stimulate to recover from the downturn. Obviously it does not want instability for the 100th birthday of the Communist Party in 2021. An even more important reason for stimulus is the 2022 leadership reshuffle – the twentieth National Party Congress. This is the date when Xi Jinping would originally have stepped down and the leading member of the rival faction (Hu Chunhua?) would have taken over the party, the presidency, and the military commission. Today Xi is not at risk of losing power, but with a trade war and recession to his name, he will have to work hard to tighten control over the party and secure his ability to stay in power. An ongoing domestic political crackdown will frighten local governments and private businesses, who are already scarred by the past decade and whose animal spirits are important to the overall economic rebound. It is still possible that Beijing will have to depreciate the renminbi against the dollar. This is the linchpin of the trade deal with President Trump – especially since other aspects of the deal will be set back by the recession. As long as Trump’s approval rating continues to benefit from his crisis response and stimulus deals, he is more likely to cut tariffs on China than to reignite the trade war. This approach will be reinforced by the bump in his approval rating upon signing the $2 trillion Families First Coronavirus Response Act into law (Chart 9). He will try to salvage the economy and his displays of strength will be reserved for market-irrelevant players like Venezuela. But if the virus outbreak and the surge in unemployment turn him into a “lame duck” later this year, then he may adopt aggressive trade policy and seek the domestic political upside of confronting China. He may need to look tough on trade on the campaign trail. Diplomacy with North Korea could also break down. This is not our base case, but we note that investors are pricing crisis levels into the South Korean won despite its successful handling of the coronavirus (Chart 10). Pyongyang has an incentive to play nice to assist the government in the South while avoiding antagonizing President Trump. But Kim Jong Un may also feel that he has an opportunity to demonstrate strength. This would be relevant not because of North Korea’s bad behavior but because a lame duck President Trump could respond belligerently. Chart 9Trump’s Approval Gets Bump From Crisis Response And Stimulus
GeoRisk Update: No Depression
GeoRisk Update: No Depression
Chart 10South Korean Political Risk Rising
South Korean Political Risk Rising
South Korean Political Risk Rising
We highlighted Russia as a “black swan” candidate for 2020. This view stemmed from President Vladimir Putin’s domestic machinations to stay in power and tamp down on domestic instability in the wake of domestic economic austerity policies. For the same reason we did not expect Moscow to engage in a market share war with Saudi Arabia that devastated oil prices, the Russian ruble, and economy. At any rate, Russia will remain a source of political surprises going forward (Chart 11). Go long oil. Putin cannot add an oil collapse to a plague and recession and expect a popular referendum to keep him in power till 2036. The coronavirus is hitting Russia, forcing Putin to delay the April 22 nationwide referendum that would allow him to rule until 2036. It is also likely forcing a rethink on a budget-busting oil market share war, since more than the $4 billion anti-crisis fund (0.2% of GDP) will be needed to stimulate the economy and boost the health system. Russia faces a budget shortfall of 3 trillion rubles ($39 billion) this year from the oil price collapse. It is no good compounding the economic shock if one intends to hold a popular referendum – even if one is Putin. For all these reasons we agree with BCA Research Commodity & Energy Strategy that a return to negotiations is likely sooner rather than later. Chart 11Russia: A Lake Of Black Swans
Russia: A Lake Of Black Swans
Russia: A Lake Of Black Swans
However, we would not recommend buying the ruble, as tensions with the US are set to escalate. Instead we recommend going long Brent crude oil. Political risk in the European states is hitting highs unseen since the peak of the European sovereign debt crisis (Chart 12). Some of this risk will subside as the European authorities did not delay this time around in instituting dramatic emergency measures. Chart 12Europe: No Delay In Offering 'Whatever It Takes'
Europe: No Delay In Offering 'Whatever It Takes'
Europe: No Delay In Offering 'Whatever It Takes'
Chart 13Political Risk Understated In Taiwan And Turkey
Political Risk Understated In Taiwan And Turkey
Political Risk Understated In Taiwan And Turkey
However, we do not expect political risk to fall back to the low levels seen at the end of last year because the recession will affect important elections between now and 2022 in Italy, the Netherlands, Germany, and France. Only the UK has the advantage of a single-party parliamentary majority with a five-year term in office – this implies policy coherence, notwithstanding the fact that Prime Minister Boris Johnson has contracted the coronavirus. The revolution in German and EU fiscal policy is an essential step in cementing the peripheral countries’ adherence to the monetary union over the long run. But it may not prevent a clash in the coming years between Italy and Germany and Brussels. Italy is one of the countries most likely to see a change in government as a result of the pandemic. It is hard to see voters rewarding this government, ultimately, for its handling of the crisis, even though at the moment popular opinion is tentatively having that effect. The Italian opposition consists of the most popular party, the right-wing League, and the party with the fastest rising popular support, which is the right-wing Brothers of Italy. So the likely anti-incumbent effect stemming from large unemployment would favor the rise of an anti-establishment government over the next year or two. The result would be a clash with Brussels even in the context of Brussels taking on a more permissive attitude toward budget deficits. This will be all the worse if Brussels tries to climb down from stimulus too abruptly. Our political risk indicators have fallen for two countries over the past month: Taiwan and Turkey (Chart 13). This is not because political risk is falling in reality, but because these two markets have not seen their currencies depreciate as much as one would expect relative to underlying drivers of their economy: In Taiwan’s case the reason is the US dollar’s unusual strength relative to the Japanese yen amidst the crisis. Ultimately the yen is a safe-haven currency and it will eventually strengthen if global growth continues to weaken. Moreover we continue to believe that real world politics will lead to a higher risk premium in the Taiwanese dollar and equities. Taiwan faces conflicts with mainland China that will increase with China’s recession and domestic instability. In Turkey’s case, the Turkish lira has depreciated but not as much as one would expect relative to European equities, which have utterly collapsed. Therefore Turkey’s risk indicator shows its domestic political risk falling rather than rising. Turkey’s populist mismanagement will ensure that the lira continues depreciating after European equities recover, and then our risk indicator will shoot up. Chart 14Brazilian Political Risk Is No Longer Contained
Brazilian Political Risk Is No Longer Contained
Brazilian Political Risk Is No Longer Contained
Prior to the pandemic, Brazilian political risk had remained contained, despite Brazilian President Jair Bolsonaro’s extreme and unorthodox leadership. Since the outbreak, however, this indicator has skyrocketed as the currency has collapsed (Chart 14). To make matters worse, Bolsonaro is taking a page from President Trump and diminishing the danger of the coronavirus in his public comments to try to prevent a sharp economic slowdown. This lackadaisical attitude will backfire since, unlike the US, Brazil does not have anywhere near the capacity to manage a major outbreak, as government ministers have warned. This autumn’s local elections present an opportunity for the opposition to stage a comeback. Brazilian stocks won’t be driven by politics in the near term – the effectiveness of China’s stimulus is critical for Brazil and other emerging markets – but political risk will remain elevated for the foreseeable future. Bottom Line: Geopolitical risk is exploding everywhere. This marks the beginning of a period of political turbulence for most of the major nation-states. Domestic economic stresses can be dealt with in various ways but in the event that China’s instability conflicts with President Trump’s election, the result could be a historic geopolitical incident and more downside in equity markets. In Russia’s case this has already occurred, via the oil shock’s effect on US shale producers, so there is potential for relations to heat up – and that is even more true if Joe Biden wins the presidency and initiates Democratic Party revenge for Russian election meddling. The confluence of volatile political elements informs our cautious tactical positioning. Investment Conclusions If the historic, worldwide monetary and fiscal stimulus taking place today is successful in rebooting global growth, then there will be “no depression.” The world will learn to cope with COVID-19 while the “dollar disease” will subside on the back of massive injections of liquidity from central banks and governments. Gold: The above is ultimately inflationary and therefore our strategic long gold trade will be reinforced. The geopolitical instability we expect to emerge from the pandemic and recession will add to the demand for gold in such a reflationary environment. No depression means stay long gold! US Equities: Equities will ultimately outperform government bonds in this environment as well. Our chief US equity strategist Anastasios Avgeriou has tallied up the reasons to go long US stocks in an excellent recent report, “20 Reasons To Buy Equities.” We agree with this view assuming investors are thinking in terms of 12 months and beyond. Chart 15Oil/Gold Ratio Extreme But Wait To Go Long
Oil/Gold Ratio Extreme But Wait To Go Long
Oil/Gold Ratio Extreme But Wait To Go Long
Tactically, however, we maintain the cautious positioning that we adopted on January 24. We have misgivings about the past week’s equity rally. Investors need a clear sense of when the US and European households will start resuming activity. The COVID-19 outbreak is still capable of bringing negative surprises, extending lockdowns, and frightening consumers. Hence we recommend defensive plays that have suffered from indiscriminate selling, rather than cyclical sectors. Go tactically long S&P consumer staples. US Bonds: Over the long run, the Fed’s decision to backstop investment grade corporate bonds also presents a major opportunity to go long on a strategic basis relative to long-dated Treasuries, following our US bond strategists. Global Equities: We prefer global ex-US equities on the basis of relative valuations and US election uncertainty. Shifting policy winds in the United States favor higher taxes and regulation in the coming years. This is true unless President Trump is reelected, which we assess as a 35% chance. Emerging Markets: We are booking gains on our short TRY-USD trade for a gain of 6%. This is a tactical trade that remains fundamentally supported. Book 6% gain on short TRY-USD. Oil: For a more contrarian trade, we recommend going long oil. Our tactical long oil / short gold trade was stopped out at 5% last week. While we expect mean reversion in this relationship, the basis for gold to rally is strong. Therefore we are going long Brent crude spot prices on Russia’s and Saudi Arabia’s political constraints and global stimulus (Chart 15). We will reconsider the oil/gold ratio at a later date. Matt Gertken Vice President Geopolitical Strategist mattg@bcaresearch.com Footnotes 1 See Joseph T. Wu et al, "Estimating clinical severity of COVID-19 from the transmission dynamics in Wuhan, China," Nature Medicine, March 19, 2020, and Wei-jie Guan et al, "Clinical Characteristics of Coronavirus Disease 2019 in China," The New England Journal Of Medicine, February 28, 2020. Section II: Appendix : GeoRisk Indicator China
China: GeoRisk Indicator
China: GeoRisk Indicator
Russia
Russia: GeoRisk Indicator
Russia: GeoRisk Indicator
UK
UK: GeoRisk Indicator
UK: GeoRisk Indicator
Germany
Germany: GeoRisk Indicator
Germany: GeoRisk Indicator
France
France: GeoRisk Indicator
France: GeoRisk Indicator
Italy
Italy: GeoRisk Indicator
Italy: GeoRisk Indicator
Canada
Canada: GeoRisk Indicator
Canada: GeoRisk Indicator
Spain
Spain: GeoRisk Indicator
Spain: GeoRisk Indicator
Taiwan
Taiwan: GeoRisk Indicator
Taiwan: GeoRisk Indicator
Korea
Korea: GeoRisk Indicator
Korea: GeoRisk Indicator
Turkey
Turkey: GeoRisk Indicator
Turkey: GeoRisk Indicator
Brazil
Brazil: GeoRisk Indicator
Brazil: GeoRisk Indicator
Section III: Geopolitical Calendar