China

Highlights US-China relations in 2020 consist of a gentleman’s agreement to keep the Phase One trade deal in place and aggressive maneuvering in every other policy area. Stimulus is unlikely to be curtailed in the US or China yet, which means brinkmanship will eventually lead to a negative surprise for markets. But it is just as unlikely to come after the election as before. Joe Biden would only initially benefit Chinese equities – trade and tech conflict is a secular trend. North Korea is not a red herring, but South Korea is still a geopolitical investment opportunity more than a risk, especially relative to Taiwan. Feature Chart 1US Power Struggle Raises Risk To Rally
US Power Struggle Raises Risk To Rally
US Power Struggle Raises Risk To Rally
The “everything is awesome” rally continues, with US tech stocks unfazed by rising domestic and international risks. However, according to The Lego Movie 2, everything is not that awesome. The Treasury market smells trouble and long-dated yields remain subdued, despite a substantial new dose of monetary policy dovishness (Chart 1, top panel). In the near term we agree with the bears and remain tactically long 10-year Treasuries. Global policy uncertainty remains extremely elevated despite dropping off a bit from the heights of the pandemic lockdowns. US uncertainty, which is now rising relative to global, will climb through November and possibly all the way through Inauguration Day on January 20 (Chart 1, bottom panels). A contested election is not a low-probability event now that President Trump is making a comeback in the election race. President Trump’s comeback could generate a counter-trend bounce in the US dollar (Chart 2A). His comeback is not based in online betting odds but in battleground opinion polls (Chart 2B). Former Vice President Joe Biden is currently polling the same against Trump as Hillary Clinton did in 2016. Chart 2ATrump Staging A Comeback, But US Consumers Flagging
Trump Staging A Comeback, But US Consumers Flagging
Trump Staging A Comeback, But US Consumers Flagging
Chart 2BTrump Staging A Comeback, But US Consumers Flagging
The Trump-Xi Gentleman’s Agreement - GeoRisk Update
The Trump-Xi Gentleman’s Agreement - GeoRisk Update
Why should Trump be less negative for the greenback than Biden? First, Trump is a protectionist who would turn to aggressive foreign and trade policy when it became clear that most of his other legislative priorities would not make it past the Democratic House of Representatives. Unilateral, sweeping tariffs against China, and possibly the EU and various other nations, would weigh on global trade and economic recovery and hence support the dollar. Second, Trump’s populism means he would pursue growth at all costs, which means that US growth would increase relative to that of the rest of the world. Democrats, by contrast, would raise taxes and regulations that would have to be offset by new spending, weighing on growth at least at first. Thus Trump would inject animal spirits into the US economy while dampening those spirits abroad; Biden would do the opposite. The dollar may not rally sustainably, but it would be flat or fall less rapidly than if Biden and the Democrats reduced trade risks abroad while deterring domestic private investment. It is not yet clear that Trump’s comeback will have legs. The nation is still in thrall to the pandemic, recession, and social unrest, which undermine a sitting president. US consumer confidence has fallen, as anticipated (Chart 2, bottom panel). Trump should still be seen as an underdog despite his incumbent status. A Trump comeback could precipitate a counter-trend bounce in the US dollar. Nevertheless, our quantitative election model gives Trump a 45% chance of victory, up from 42% last month. Florida has shifted back into the Republican column – albeit as a “toss up” state with a roughly even chance of going either way (Chart 3). The shift reflects improvement in state leading economic indexes as a result of the V-shaped recovery in the economy thus far. Chart 3Trump Nearly Regains Florida In Our Quantitative Election Model, Odds Of Victory 45%
The Trump-Xi Gentleman’s Agreement - GeoRisk Update
The Trump-Xi Gentleman’s Agreement - GeoRisk Update
Assuming Trump signs a new relief bill in September, which is working its way through Congress as we speak, we will upgrade our subjective odds from 35% to something closer to our quantitative model (and the market consensus). While Trump is less negative for the dollar than Biden, the dollar may fall anyway, at least beyond any near-term bounce. First, monetary policy is ultra-dovish. As we go to press, Fed Chairman Jerome Powell has given a sneak preview of the Fed’s strategic review of monetary policy at the Kansas City Fed’s annual Jackson Hole summit (this time hosted in cyberspace instead of Wyoming). Powell met expectations that the Fed will adopt average inflation targeting. Inflation will be allowed to overshoot the 2% inflation target to compensate for periods of undershooting. Maximum employment will be the goal rather than an attempt to prevent excessive deviation from the Fed’s estimates of neutral unemployment. This means US growth and inflation will push real rates lower and weaken the dollar. Moreover, as mentioned, Trump’s big spending would eventually drive investors away from the dollar, especially in the context of global economic recovery. Trump, like Biden, would refuse to impose fiscal austerity amid high unemployment. The one area where he would be able to compromise with House Democrats would be spending bills, as in his first term. The US budget deficit and trade deficit would remain very large, showering the world with dollar liquidity. Risk-on currencies will attract buyers in a new global business cycle. Republicans and Democrats have released their policy platforms following their national conventions. We will revisit these platforms in detail in a future report. The Democratic platform is the one that matters most because the Democrats are more likely to win full control of Congress and thus be capable of enacting their preferred policies. Their platform is reflationary, but in seeking to rebalance the economy to reduce financial and social disparities through more progressive tax policy it would offset some of the fiscal spending. Biden would also moderate foreign policy and trade policy, launching a new dialogue with China to manage tensions. The dollar would fall faster in this environment. Bottom Line: President Trump is staging a comeback in the election campaign. If the comeback receives a boost from fiscal stimulus, Trump could pull off a Harry Truman-style surprise victory. This would precipitate a bounce in the US dollar in the near term. Over the medium term, the dollar should continue falling due to US debt monetization and global recovery. The Trump-Xi Gentleman’s Agreement Has Two Months Left Financial markets have largely ignored US-China strategic tensions this year because the two countries are puffing themselves up with monetary and fiscal stimulus. Going forward, either the stimulus will falter, or the US-China conflict will escalate to the point of triggering a negative surprise for markets. Chart 4US-China: Embracing While Struggling
US-China: Embracing While Struggling
US-China: Embracing While Struggling
China is unlikely to pull back on stimulus measures. It cannot do so when unemployment has spiked and the economy is experiencing the weakest growth in over 40 years. Authorities said as much during the annual July Politburo meeting on the economy (a meeting that has often marked turning points in policy), when they pledged to maintain accommodative policy and to speed up local government issuance of special bonds. Money supply is growing briskly. The market is validating the signal from China’s easy monetary policies and robust credit expansion. Our China Play Index – which consists of the Australian dollar, iron ore prices, Brazilian equities, and Swedish equities – continues to rally smartly, breaking above its 2019 peaks (Chart 4, top panel). The risk to this view is that the People’s Bank of China may not provide additional monetary easing in the near term, as the Politburo signaled that monetary policy would be more flexible and targeted in the second half of the year. The three-month Shanghai interbank rate has been rising since April. Politically, Chinese authorities would benefit from releasing negative news or statements that would undermine President Trump’s reelection campaign. However, Beijing would not make consequential moves merely to spite Trump. Its primary interest lies in its own stability. Credit growth will continue growing at its current clip through most of the rest of the year and fiscal spending will expand, particularly to support infrastructure projects. The US Congress is also likely to add more stimulus before the election, as noted above. Thus with both countries stimulating, the risk is that they escalate their strategic confrontation to the point that it causes a negative surprise in financial markets. Will this occur? The US-China relationship in 2020 has been characterized by (1) a gentleman’s agreement to adhere to the Phase One trade deal, which was reaffirmed by top negotiators this week; (2) an aggressive pursuit of national interest in every other policy area. Beijing accelerated its power grab in Hong Kong; the US accelerated up its ban on Chinese tech. Chinese imports of US commodities are naturally much weaker than projected due to economic reality but neither side has an interest in exiting the deal. The renminbi continues to appreciate against the dollar on the back of Chinese and global recovery (Chart 4, second and third panels). Nevertheless a new burst of stimulus will lower the hurdle to President Trump taking additional punitive measures against China. The administration could have paused after its major decision to finalize its ban on business with Huawei and other tech firms, which ostensibly even extends to foreign firms that use US-designed parts in sales to China. It did not. Trump is maintaining the pressure with new sanctions over China’s militarization of the South China Sea. Washington is also likely to kick Chinese companies off US stock exchanges if they fail to meet transparency and accounting standards. Trump is not only burnishing his “tough on China” credentials against Democratic candidate Joe Biden – the US’s recent measures are unlikely to be repealed under either president in the coming years. Chart 5China Faces Internal And External Political Pressures
China Faces Internal And External Political Pressures
China Faces Internal And External Political Pressures
Therefore stimulus will enable US actions and Chinese reactions that will eventually trigger a pullback in financial markets. Chinese tech equities are reflecting this headwind. Equities ex-tech are likely to outperform (Chart 5, top panel). A Biden victory does not prevent Trump from taking punitive measures against China on his way out of office, to solidify his legacy as the Man Who Confronted China, so Chinese tech will remain at risk. Biden would be more favorable for emerging market equities because his administration would speed the dollar’s decline. A change of government in the US would temporarily disrupt the US’s overall policy assault against China. Biden’s foreign and trade policies would be more predictable and orthodox than Trump’s. Over a twelve month period, after a shot across the bow to warn that he is not a lightweight, Biden would probably attempt a diplomatic reset with China – a new round of engagement and dialogue that would support the Chinese equity rally. Eventually this reset would fail, however, and Biden would all the while be working up a coalition of democracies to pressure China to change its behavior – not only on trade but also on unions, carbon emissions, and human rights. Externally focused Chinese companies will remain exposed to the harmful secular trend of US-China power struggle regardless of the US election outcome. Coming out of the secretive leaders’ conclave at the Beidaihe resort in August, it is clear once again that Chinese domestic politics is not conducive to smooth US-China relations. Chinese political risk remains underrated. Our GeoRisk indicator is gradually picking up on this trend, and so are other quantitative political risk indicators such as that provided by GeoQuant (Chart 5, second panel). President Xi Jinping has been dubbed the “Chairman of Everything” due to his tendency to promote a neo-Maoist personality cult and thus shift Chinese governance from consensus-rule to personal rule. He is once again reportedly considering taking on the title of “Chairman” of the Communist Party, a position that only Mao Zedong has held.1 More importantly he is re-energizing his domestic anti-corruption campaign, i.e. political purge, this time against law enforcement. Xi had already seized control of China’s domestic security forces but controlling the police is even more critical in a period of high unemployment, slow growth, and social unrest (Chart 5, third panel). Xi’s attempt to re-consolidate power ahead of the Communist Party centennial in 2021 and especially the twentieth national party congress in 2022 is already under way. China’s domestic and international political environment is a risk for the renminbi, which we noted is rallying forcefully on the global rebound. We will not join this rally until the US election is decided at minimum. With the US posing a long-term threat, Beijing is speeding up its attempts to diversify away from the US dollar, both in trade settlements and foreign exchange reserves. Reliance on the dollar leaves Chinese banks and companies vulnerable to US financial sanctions, which have harmed US rivals like Russia and Iran. Over the long run there is a lot of upside for the yuan given its very low level of global penetration (about 2% of both SWIFT transactions and global foreign exchange reserves) and yet China’s very high share of global trade (about 15%). Cross-border settlements in RMB are recovering gradually after the steep drop-off following 2016. Beijing is also allowing foreign investors greater access to onshore financial markets where they will hold more and more RMB-denominated assets. However, the yuan will not become a reserve currency anytime soon given China’s state-controlled economy and closed capital account. We favor the euro, yen, and other G7 currencies as alternatives to the dollar. Hong Kong equities have suffered from the combination of Xi Jinping’s centralization of power and the US-China strategic conflict. The above analysis suggests that while they may get a temporary reprieve, the secular outlook is uninspiring. However, the Hong Kong monetary authorities are capable of managing the dollar peg. They have been able to manage dollar strength over the past decade, including the COVID-19 dollar run-up, and foreign exchange reserves are more than ample. By contrast, a sharp drop in the dollar can be handled even more easily by printing additional HKD. Eventually shifting to a trade basket, or a renminbi peg, is to be expected. The US election may support the Chinese equity rally if Biden wins, but tech equities should continue to underperform the rest of the bourse due to US grand strategy. Bottom Line: We prefer to play China’s growth recovery via outside countries that export into China, such as Sweden, Australia, and Brazil. The US election may support the Chinese equity rally if Biden wins, but tech equities should continue to underperform the rest of the bourse due to US grand strategy which will remain focused on constraining China’s tech ambitions. North Korea Is Not A Red Herring – But Taiwan Is Entirely Underrated The Taiwan Strait remains the chief geopolitical risk. Xi Jinping’s reassertion of Beijing’s supremacy within China’s sphere of influence has led to a backlash in Taiwanese politics and a confrontational posture across the Strait that is being expressed in saber-rattling and low-level economic sanctions that could easily escalate. Chart 6Taiwan Remains #1 Geopolitical Risk
Taiwan Remains #1 Geopolitical Risk
Taiwan Remains #1 Geopolitical Risk
Military exercises and jingoistic rhetoric are also heating up, not only directly relating to Taiwan but also in the neighboring South China Sea, which is critical to national security for all geopolitical actors in Northeast Asia. On August 26 Beijing testing two anti-ship ballistic missiles known as “aircraft carrier killers” in the South China Sea (the DF-21D and the DF-26B). We have long argued that the lack of clarity over whether the US would uphold its defense obligations to Taiwan makes the situation ripe for misunderstandings. The US Naval Institute has recently confirmed the validity of fears about a full-scale conflict in the near term.2 Neither Beijing nor Taipei nor Washington has crossed a red line. But China’s imposition of legislative dependency on Hong Kong highlights the incompatibility of the Communist Party’s governing model with western liberalism. The “one country, two systems” formulation has become unacceptable to the Taiwanese people, who want to preserve their autonomy indefinitely. The US ban on doing business with Huawei extends to foreign companies that use US parts or designs, squeezing Taiwanese companies (Chart 6, top panel). War is possible, but our base case still holds that the mainland will first use economic means. In particular it will impose economic sanctions, either precipitating or in response to a Fourth Taiwan Strait Crisis. The market continues to underrate the enormous risk to the Taiwanese dollar, as captured by the low level of our risk indicators (Chart 6, second panel). We continue to recommend shorting Taiwan relative to emerging markets. Taiwan is a short relative to South Korea, in particular, which stands to benefit from any negative turn of events in cross-strait relations. Korean equities are finally perking up, though the US tech war with China is weighing on the South Korean tech sector (Chart 7, top panel). We see this as a geopolitical opportunity given that both China and the US will need South Korean companies as they divorce each other. Korean political risk, however, may also be shifting from adequately priced to underrated. The risk premium has trended upward since President Trump’s diplomatic overture to leader Kim Jong Un stopped making progress (Chart 7, second and third panels). We have largely dismissed concerns about North Korea since the reduction of tensions in late 2017 due to our assessment that diplomacy would remain on track throughout Trump’s first term. This has proved to be the case, but it is still possible that North Korea could prove globally relevant before the US election. Chart 7North Korea A Non-Negligible Risk
North Korea A Non-Negligible Risk
North Korea A Non-Negligible Risk
The reason stems from rumors of Kim Jong Un’s health problems earlier this year. We noted at the time that it was suspicious that preparations for Kim’s sister, Kim Yo Jong, to take on greater responsibilities within the Politburo of the Worker’s Party seemed to predate reports of Kim Jong Un’s illness. For the North Korean state to continue to promote her implies that something may indeed be amiss. In fact, she has missed two Politburo meetings after her aggressive public relations campaign against South Korea was called off this summer. It is possible she got too much attention as the Number Two person in the regime. The South Korean National Intelligence Service is debating her status with the Defense Ministry and Unification Ministry. What is clear is that Kim Jong Un is preparing a new five-year economic plan, to be launched in January 2021, and that he is eager to share any blame for disastrous internal conditions in the country amid the global pandemic and recession. The market is typically correct not to hyperventilate over North Korean risks, but after 2016 North Korea is no longer a “red herring.” First, any domestic power struggle would occur at an immensely inconvenient time given the breakdown in US-China trust. Second, as the North manages any internal problems through its opaque and untested political process, it could be pressed into making a show of force that would either embarrass and antagonize President Trump, or provoke a forceful response from a future President Biden, given that North Korea in theory has the raw capability to deliver a crude nuclear weapon to the continental United States. If any US president makes a show of force, it will antagonize China and could lead to a major standoff. This would upset the markets at least temporarily. We are long Korean equities and would also look favorably on Korean tech. A geopolitical risk premium could temporarily undercut these stocks if North Korean diplomacy fails around the US election. But the risk is globally relevant only if Pyongyang somehow sparks a standoff between the US and China. Otherwise a major Korean peninsula crisis is far less of a concern than that of a crisis in the Taiwan Strait. Matt Gertken Vice President Geopolitical Strategy mattg@bcaresearch.com Footnotes 1Financial Times. 2 See Admiral James A. Winnefeld and Michael J. Morell, "The War That Never Was?" US Naval Institute Proceedings 146: 8 (August 2020), usni.org. Section II: GeoRisk Indicator China
China: GeoRisk Indicator
China: GeoRisk Indicator
Russia
Russia: GeoRisk Indicator
Russia: GeoRisk Indicator
UK
UK: GeoRisk Indicator
UK: GeoRisk Indicator
Germany
Germany: GeoRisk Indicator
Germany: GeoRisk Indicator
France
France: GeoRisk Indicator
France: GeoRisk Indicator
Italy
Italy: GeoRisk Indicator
Italy: GeoRisk Indicator
Canada
Canada: GeoRisk Indicator
Canada: GeoRisk Indicator
Spain
Spain: GeoRisk Indicator
Spain: GeoRisk Indicator
Taiwan
Taiwan: GeoRisk Indicator
Taiwan: GeoRisk Indicator
Korea
Korea: GeoRisk Indicator
Korea: GeoRisk Indicator
Turkey
Turkey: GeoRisk Indicator
Turkey: GeoRisk Indicator
Brazil
Brazil: GeoRisk Indicator
Brazil: GeoRisk Indicator
Section III: Geopolitical Calendar
Highlights Historically, soft-budget constraints have typically been followed by periods of poor equity market performance. Soft-budget constraints could produce two distinct economic scenarios: malinvestment or inflation. Both are negative for equity investors. Odds are that the US will continue to pursue easy money policies, sowing the seeds of US equity underperformance in the years ahead. In contrast to the US, EM (ex-China, Korea and Taiwan) are presently facing hard-budget constraints, which will weigh on their growth in the near term. However, forced restructuring could boost efficiency and productivity leading to their equity and currency outperformance in the coming years. Unlike other developing economies, China is not currently facing hard-budget constraints. However, the structural overhang from the past 10 years of soft-budget constraints is lingering on and in some cases is increasing. The Thesis The consensus in the investment industry is that cheap money and ample stimulus are good for share prices. We do not disagree with this thesis when it is applied to the near and medium-term equity strategy. However, excessive stimulus and easy money policies — we refer to these as soft-budget constraints — bode ill for share prices in the long run. The investment relevance of this thesis is as follows. Since March, the US has implemented the largest fiscal and central bank stimulus in the world and will likely continue doing so in the coming years (Chart I-1). Such soft-budget constraints will likely support the US economy for now. Nevertheless, they will also sow seeds of future US equity underperformance and currency depreciation. Conversely, many emerging economies (excluding China) have failed to provide sufficient fiscal and credit support to their economies (Chart I-2). The resulting hard-budget constraints will foreshadow their economic underperformance vis-à-vis the US in the coming months. Chart I-1Soft-Budget Policies Will Likely Become Structural In The US
Soft-Budget Policies Will Likely Become Structural In The US
Soft-Budget Policies Will Likely Become Structural In The US
Chart I-2EM Ex-China, Korea And Taiwan Are Facing Hard-Budget Constraints
EM Ex-China, Korea And Taiwan Are Facing Hard-Budget Constraints
EM Ex-China, Korea And Taiwan Are Facing Hard-Budget Constraints
That said, hard-budget constraints will force companies in these EM economies into deleveraging, restructuring and improving efficiency. Ultimately, such hard-budget constraints will benefit EM shareholders in the long run. This thesis has been a key rationale behind our decision to close the short EM / long S&P 500 strategy on July 30, and to turn negative on the US dollar on July 9. In the months ahead, we will be looking for an opportunity to upgrade EM equities to overweight versus the S&P500. BOX 1 Gauging Budget Constraints In our opinion, the best way to gauge budget constraints for the real economy is by monitoring changes in the money supply. This is due to the following reasons: First, net changes in the money supply account for all net loan origination. Second, the money supply also reflects the monetization of public and private debt by the central bank and commercial banks. When a central bank and commercial banks acquire a security from or lend to a non-bank entity, they create new money “out of thin air”. No one needs to save for the central bank and commercial banks to lend to or purchase a security from a non-bank. In short, savings versus spending decisions by economic agents (non-banks) do not change the stock of money supply. We have deliberated on these topics at length in past reports. Securities transactions among non-banks do not create new or destroy existing deposits, i.e., they have no impact on the money supply. Rather, these constitute an exchange of securities and existing deposits between sellers and buyers. Provided these types of transactions do not expand the money supply, they do not, according to our framework, alter budget constraints. Finally, the broad money supply, not central bank assets, is the ultimate liquidity available to economic agents to purchase goods and services as well as invest in both real and financial assets. Commercial banks’ excess reserves at the central bank – a large item on the central bank balance sheet - do not constitute a part of the broad money supply. Empirical Evidence The following are examples of soft-budget constraints that were followed by periods of weakening productivity growth, diminishing return on capital and poor equity market performance: 1. China’s soft budget constraints in 2009-10 Due to the post-Lehman crisis stimulus, the change in broad money exploded above 40% of GDP (Chart I-3, top panel). The economy boomed from early 2009 until early 2011 as cheap and abundant money super-charged investment and consumption. Chart I-3China: Easy Money Presaged Falling Return On Assets And Equity Underperformance
China: Easy Money Presaged Falling Return On Assets And Equity Underperformance
China: Easy Money Presaged Falling Return On Assets And Equity Underperformance
However, Chinese share prices — the MSCI China Investable equity index excluding technology, media and telecom (TMT) — peaked in H1 2011 in absolute terms (Chart I-3, second panel). Relative to the global equity index excluding TMT, the Chinese investable stocks index began underperforming in late 2010 (Chart I-3, third panel). The basis for this equity underperformance was falling return on assets for non-financial companies due to capital misallocation, breeding inefficiencies and diminishing productivity gains (Chart I-3, bottom two panels). In China, the excessive stimulus of 2009 and 2010 and ensuing recurring rounds of soft-budget constraints put a floor under the economy but have destroyed shareholder value. 2. Money overflow in EM ex-China in 2009-10. China’s boom in 2009-10 produced a bonanza for other emerging economies. Not only Chinese imports from developing economies boosted the latter’s balance of payments and income but also international investors rushed into EM equity and fixed income. EM companies and banks took advantage of easy financing and their international borrowing skyrocketed. Finally, EM policy makers stimulated and domestic bank credit boomed. This period of soft-budget constraints led to complacency, lower productivity, falling return on capital and/or inflation in the following years (Chart I-4). Their financial markets performance in the 10 years that followed the soft-budget constraints in 2009-10 has been dismal. The share price index of EM ex-China, Korea and Taiwan as well as the total return on their currencies (including the carry) versus the US dollar have been in a bear market (Chart I-4, bottom two panels). 3. The credit and equity bubbles in Japan, Korea and Taiwan of the late 1980s Money and credit bubbles proliferated in Japan, Korea and Taiwan in the late 1980s (Chart I-5, Chart I-6 and Chart I-7). Chart I-4EM Ex-China, Korea And Taiwan: Easy Money In 2009-10 Sowed Seeds Of Bear Market
EM Ex-China, Korea And Taiwan: Easy Money In 2009-10 Sowed Seeds Of Bear Market
EM Ex-China, Korea And Taiwan: Easy Money In 2009-10 Sowed Seeds Of Bear Market
Chart I-5Japan: Easy Money Produced Equity Bubble And Lower Productivity Growth
Japan: Easy Money Produced Equity Bubble And Lower Productivity Growth
Japan: Easy Money Produced Equity Bubble And Lower Productivity Growth
Chart I-6Korea: Easy Money Produced Equity Bubble And Lower Productivity Growth
Korea: Easy Money Produced Equity Bubble And Lower Productivity Growth
Korea: Easy Money Produced Equity Bubble And Lower Productivity Growth
Chart I-7Taiwan: Easy Money Produced Equity Bubble And Lower Productivity Growth
Taiwan: Easy Money Produced Equity Bubble And Lower Productivity Growth
Taiwan: Easy Money Produced Equity Bubble And Lower Productivity Growth
Their productivity growth rolled over in the late 1980s amid easy money policies. Share prices deflated in Japan, Korea and Taiwan in the 1990s (please refer to the middle and bottom panels of Charts I-5, I-6 and I-7). Chart I-8ASEAN In 1990s: Soft-Budget Constraints Heralded Productivity Demise
ASEAN In 1990s: Soft-Budget Constraints Heralded Productivity Demise
ASEAN In 1990s: Soft-Budget Constraints Heralded Productivity Demise
4. The boom-bust cycle in emerging Asia ex-China in the 1990s Soft-budget constraints prevailed in many emerging Asian economies in the first half of the 1990s. Foreign money inflows and domestic bank credit produced an economic boom. The consequences of such soft-budget constraints were debt-financed malinvestment, falling return on assets and massive current account deficits (Chart I-8). All of these culminated in epic currency and banking crises. 5. The credit bubbles in the US and Europe leading to the 2008 crash Lax credit standards propelled credit and property booms in the US and Southern Europe in the period of 2002-2007. Broad money ballooned in the euro area and swelled in the US (please refer to Chart I-1 on page 2). These property bubbles unraveled in 2007-08. These are well known, and we will not delve into the details. Soft-Budget Constraints Lead To Malinvestment Or Inflation Soft-budget constraints could produce two distinctive economic scenarios – malinvestment or inflation. Both are negative for equity investors. The malinvestment scenario occurs when easy money propels undisciplined capital spending. Easy and abundant money boosts medium-term growth and, thereby, creates the illusion of an economic miracle. The latter renders companies, creditors, investors and government officials complacent. Creditors lend a lot and do so based on optimistic assumptions while companies expand hastily and invest carelessly. The result is capital misallocation, i.e., companies pour money into projects that do not ultimately produce sufficient cash flow. Equity investors project high growth expectations into the future and bid up share prices. Government officials preside over an unsustainable growth trajectory overlooking lurking systemic risks and deteriorating economic fundamentals. Easy money and unlimited financing typically bode ill for efficiency and productivity— this is simply due to human nature. Companies neglect efficiency considerations and, as a result, productivity stagnates. Consequently, cost overruns and unprofitable investments suffocate corporate profits. Declining corporate earnings at a time of expanded capital base culminate in a collapse of return on capital. This is the crucial reason why share prices drop. As profits and return on capital decline, companies retrench by cutting costs and halting investment spending. Defaults mushroom, leading creditors to cut new financing. The inflation scenario transpires when easy money boosts consumption more than investment. Easy money and unlimited financing lift household income and consumption. This can arise from a large fiscal stimulus or private sector's borrowing and spending. On the one hand, robust household income growth inevitably leads to higher wage growth expectations. On the other hand, limited investment brings about productivity stagnation. Mounting wages and languishing productivity growth lead to rising unit labor costs and, ultimately, result in a corporate profit margin squeeze. Faced with corporate profit margin shrinkage, companies either raise prices, i.e., pass through higher costs, or retrench by shedding labor and shrinking capital spending even further. The latter produces a widespread economic downturn, and stifles business profits and share prices. A symptom of higher inflation is a wider current account deficit. With an economy’s productive capacity lagging behind demand, the gap between the two can be filled in by imports. In addition, escalating domestic costs make a country less competitive, which inhibits exports and bloats imports. When a central bank is unwilling to tighten monetary policy meaningfully amid high and rising inflation and/or a widening current account deficit, it falls behind the inflation curve. This constitutes a very bearish backdrop for the exchange rate. Currency depreciation erodes the country’s equity returns in common currency terms versus other bourses. Can an economy with soft-budget constraints, i.e., booming money growth, avoid both malinvestment and inflation? Yes, it can if it is able to boost productivity growth so that it avoids systemic capital misallocation (i.e., investments produce reasonable returns to pay off to creditors and shareholders) and escapes higher inflation by expanding output faster to meet growing demand. However, achieving higher productivity growth amid soft-budget constraints is easier said than done. Bottom Line: The scenario of malinvestment has been playing out in China since 2009. Capital misallocation also occurred in the US and parts of Europe during the 2002-2007 credit boom, and took place in Japan, Korea and Taiwan in the late 1980s. Malinvestment, with some elements of inflation, occurred in emerging Asian countries prior the 1997-98 crises as well as in many EM economies like India, Indonesia and Brazil in 2009-2012. Investment Implications It is fair to say that the unprecedented economic downturn in the US warranted an exceptionally large stimulus. The question for the next several months and years is whether US authorities will: overstay easy policies and make soft-budget constraints a permanent feature of the US economy, or tighten policy earlier than warranted, or navigate policy perfectly so that the economy is neither too hot nor too cold. Our sense is that US authorities will overstay their easy money policies. If the US continues to pursue macro policies in the form of soft-budget constraints, will the nation experience malinvestment or inflation? Our sense is that the US will likely experience asset bubbles and inflation. As the Federal Reserve stays behind the inflation curve in the coming years, the US dollar will be in a multi-year downtrend. Hence, the strategy should be selling the greenback into rebounds. We switched our short positions in select EM currencies— such as BRL, CLP, ZAR, TRY, KRW, IDR and PHP —away from the US dollar to an equal-weighted basket of the euro, CHF and JPY on July 9. For now, EM currencies will lag DM currencies. US equity outperformance versus the rest of the world is in the late innings (Chart I-9). The pillars of US equity underperformance in common currency terms will be excessive US equity valuations, a potential new era of US return on capital underperforming the rest of the world and greenback depreciation. Chart I-9US Equity Outperformance Is In Very Late Stages
US Equity Outperformance Is In Very Late Stages
US Equity Outperformance Is In Very Late Stages
The top panel of Chart I-10 illustrates that the difference between US investors owning international stocks and non-US investors holdings of US equities is at a record low. This reveals that both US and foreign investors currently "over-own" US stocks versus non-US equities. Perfect timing of a structural trend reversal is impossible, but we believe US equity outperformance will discontinue before year-end. That was the rationale behind terminating our short EM / long S&P 500 strategy and upgrading EM equity allocation from underweight to neutral. In contrast to the US, EM (ex-China, Korea and Taiwan) are presently facing hard-budget constraints which will weigh on their economic performance in the near term. This is why we are not rushing to upgrade EM stocks and currencies to overweight. However, the lack of cheap money will force these EM countries and their companies to do the right things: deleverage households and companies, clean up and recapitalize their banking systems and undertake corporate restructuring. Ultimately, hard-budget constraints will likely sow the seeds of high productivity and, with it, equity and currency outperformance in the years to come. China is a tricky case. On a positive note, it has not stimulated as much during the pandemic as it did in 2009. Besides, policymakers are now aware of the ills that come with soft-budget constraints and have been working hard to address these. Critically, the Chinese population, businesses and the authorities are all united in the nation’s confrontation with the US. Complacency in this context is not a major risk and the focus on efficiency and productivity will be razor sharp. On the negative side, the credit, money and property bubbles that had not been dealt with before the pandemic are now increasing with the stimulus. Continued malinvestment and falling return on capital in China’s old economy sectors is signified by the very poor performance of China’s cyclical “old economy” stocks (Chart I-11, top panel). In turn, bank share prices are making new cyclical lows underscoring their worsening structural outlook (Chart I-11, bottom panel). Chart I-10Global Equity Investors Over-Own US Stocks Versus International Ones
Global Equity Investors Over-Own US Stocks Versus International Ones
Global Equity Investors Over-Own US Stocks Versus International Ones
Chart I-11Chinese Equities: "Old Economy" Cyclicals And Banks Are Dismayed By Structural Malaises
Chinese Equities: "Old Economy" Cyclicals And Banks Are Dismayed By Structural Malaises
Chinese Equities: "Old Economy" Cyclicals And Banks Are Dismayed By Structural Malaises
Weighing the pros and cons, we infer that the cyclical recovery in China has further to run. This will support China’s growth and equity outperformance for now. That is why we continue to recommend overweighting China within an EM equity portfolio. However, as the credit and fiscal impulses fade starting in H1 next year, structural malaises will resurface posing risks to China’s equity outperformance. Arthur Budaghyan Chief Emerging Markets Strategist arthurb@bcaresearch.com Footnotes Equities Recommendations Currencies, Credit And Fixed-Income Recommendations
Dear clients, China Investment Strategy will take a summer break next week. We will resume our publication on September 9th. Best regards, Jing Sima, China Strategist Highlights The threat of US sanctions has sparked fears of disconnecting Chinese financial institutions from US dollar access, driving urgency to accelerate the RMB internationalization process. China’s RMB internationalization process suffered from a sizable setback in 2016, but the trend has reversed in 2018. Since then China has shifted the strategy to broaden and enhance the RMB’s market demand and functions, as well as to establish systems to facilitate the strategy. In the foreseeable future, the RMB’s role in the global economy is far from challenging the US dollar as the world's dominant reserve currency; China's near-term goal to promote the use of the RMB beyond its borders is to minimize disruptions to China’s trade and investment activities threatened by US financial sanctions. Feature Since 2018 and in the wake of intensifying confrontations between the US and China, the Chinese government has shifted its strategy in promoting the internationalization of the RMB. Authorities have moved from a symbolic international recognition of the RMB to a more pragmatic approach of creating real market demand for the currency. Chart 1China Has Been Shedding USD Assets
China Has Been Shedding USD Assets
China Has Been Shedding USD Assets
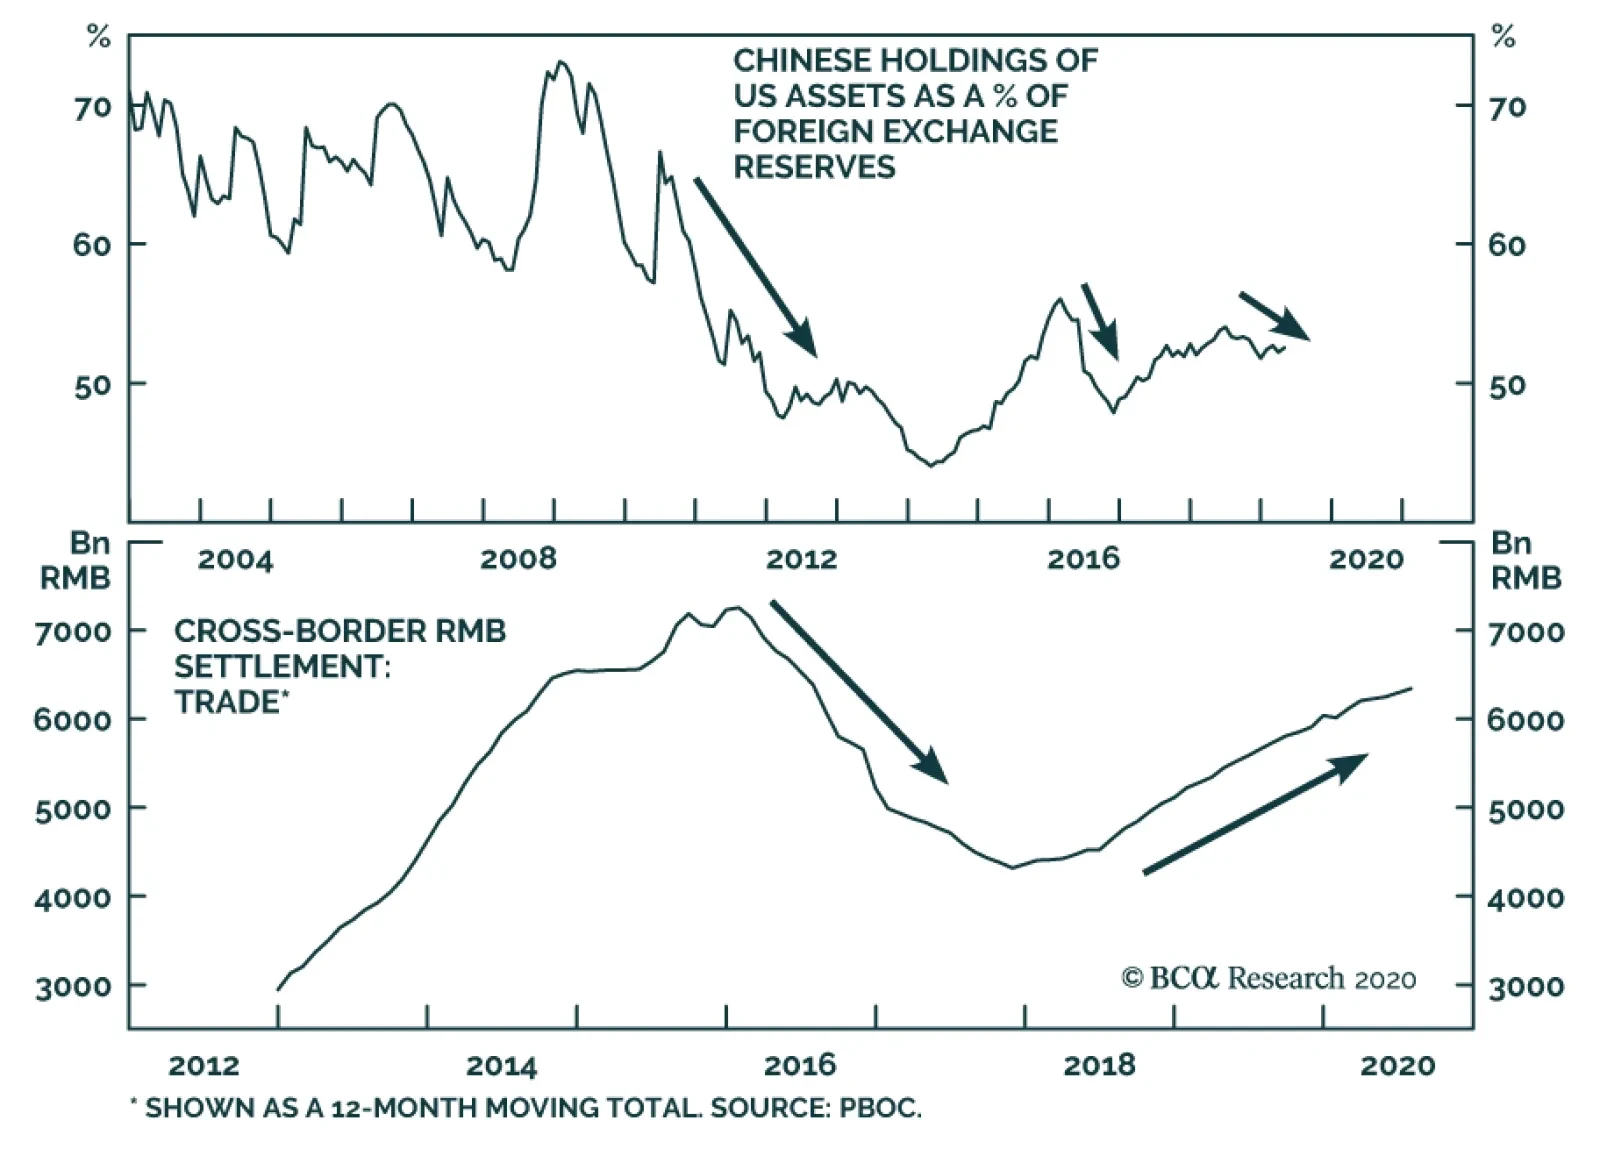
It is not our baseline view that the US will take extreme measures and entirely cut off Chinese banks’ access to the US Clearing House Interbank Payments System (CHIPS) and the Society for Worldwide Interbank Financial Telecommunication (SWIFT). However, Beijing’s decoupling from the US dollar (USD) has been in process, diversifying its forex reserves away from the US dollar (USD) and increasing the use of the RMB in cross-border trade and investment (Chart 1). In the foreseeable future, it is neither possible nor is Chinese policymakers’ intention for the RMB to challenge the USD as the world's dominant reserve currency. Rather, we think that under the threat of US sanctions, the near-term goal is to minimize disruptions to China’s trade and investment activities. At the same time, the approach will make China “too big, too connected to fail” in the medium-to-long run and, therefore, minimize the potential for future threats of financial sanctions. China’s new approach to internationalize the RMB involves enhancing the currency’s three functions in the global market, and establishing and strengthening domestic systems to facilitate the enhancements: The RMB as an international settlement currency; The RMB as a commodity pricing currency; and The RMB as an international reserve currency. Most of these strategies still have a long way to go before having significant global market implications. However, these developments bear structural importance and investors should closely monitor them. RMB - An International Settlement Currency Chart 2Cross-Border RMB Settlement Is Picking Up
Cross-Border RMB Settlement Is Picking Up
Cross-Border RMB Settlement Is Picking Up
The RMB’s role in cross-border trade settlement suffered a major setback in 2016 when investor confidence plummeted following a rapid devaluation in China’s currency and equities. The trend has reversed since 2018, partially due to the vigorous promotion of China’s domestic cross-border interbank settlement system (CIPS) (Chart 2). China established CIPS in 2015 after the US proposed to disconnect Russia from the SWIFT payment system.1 As of July 2020, the CIPS system had a total of 33 direct participants and 951 indirect participants, a 35% increase from 2018 with more than half of the participants outside China.2 According to the recently released PBoC RMB internationalization report, the CIPS system processed a total of 34 trillion yuan worth of cross-border RMB transactions in 2019, a 28% improvement from 2018 (Chart 3). Chart 3CIPS Has Been Steadily Expanding
The RMB Internationalization Scorecard
The RMB Internationalization Scorecard
Nevertheless, the RMB’s share of international payments remains far behind the USD, euro and yen, and the RMB's role in cross-border settlement is well below its 2016 peak (Chart 4A and 4B). The dollar's dominant status is not only supported by the US’ strong and open economy, but also by its deep, liquid and highly efficient financial markets, which are impossible for any currencies or payment systems to replicate in the near future. However, establishing domestic financial payment and information exchange systems will likely be a main countermeasure countries will rush to take, if the US launches sanctions to cut off large economies like Russia and China from the USD and/or global financial system. Chart 4AThe RMB’s Share Of International Payments Has Been Disproportional Compared To Its Share In Global Trade…
The RMB Internationalization Scorecard
The RMB Internationalization Scorecard
Chart 4B...And Well Below Its 2016 Peak
...And Well Below Its 2016 Peak
...And Well Below Its 2016 Peak
Chart 5Russia Has Largely Replaced USD Treasury Holdings With Gold
Russia Has Largely Replaced USD Treasury Holdings With Gold
Russia Has Largely Replaced USD Treasury Holdings With Gold
Russia is by far the largest and most globally integrated country that came close to being cut off from SWIFT, and Beijing has clearly learned from Russia’s experience and countermeasure strategies. The proposal to disconnect Russia from SWIFT following the 2014 Crimea crisis never materialized, but in light of the threats and US financial sanctions, Russia established the SPFS, a domestic financial information exchange system to facilitate bank payments. The SPFS is far from the complete emancipation of SWIFT and payments through the SPFS are mostly intra-Russian settlements. However, this active counter-sanction measure, coupled with the Russian central bank’s aggressive reduction of USD-denominated assets in its forex reserves, seems to have achieved positive results (Chart 5). Three years after the establishment of SPFS, the US and Europe no longer target Russian bank payment functions in their further financial sanctions against Russia.3 In response to a US threat to impose economic sanctions against companies and banks dealing with Iran, Europe created a special financial settlement platform called Instrument in Support of Trade Exchanges (INSTEX) in 2019. Although none of the alternative systems can challenge the role of the US CHIPS or SWIFT systems, the trend of establishing and accelerating alternatives will incrementally diminish the effectiveness of such harsh financial actions by the US. RMB - An International Commodity Pricing Currency Table 1China Dominates Global Demand For Many Commodities
The RMB Internationalization Scorecard
The RMB Internationalization Scorecard
We believe that the most important breakthrough in the RMB internationalization process in the past five years has been the strategic shift to promote the RMB’s pricing function. China is the largest trading partner of a growing number of countries with tightly linked supply chains. This generates a natural demand for RMB settlement in bilateral trade. More importantly, China’s dominance in global demand for bulk commodities gives the country an advantage in pricing power (Table 1). In March 2018, China established a RMB-denominated crude oil futures market in Shanghai, which has grown into the third-largest oil exchange market after WTI and Brent. Its cumulative turnover in two years reached nearly 30 trillion yuan with overseas customers in 19 countries and regions.4 Given the success of the Shanghai crude oil futures market, the Chinese government has been vigorously promoting the expansion of the RMB pricing function from crude oil to natural gas, iron ore, soybeans, corn and other bulk commodities. Going forward, we expect the RMB internationalization process to continue to develop through pricing and trading bulk commodities in Chinese currency. This will lead to a higher correlation between the RMB and the currencies of some of China's Asian neighbors and commodity trade partners, and thus expand and strengthen the "RMB currency bloc" (Chart 6A and 6B). Chart 6AThe RMB Currency Bloc May Expand From Manufacturing Ecosystem...
The RMB Currency Bloc May Expand From Manufacturing Ecosystem...
The RMB Currency Bloc May Expand From Manufacturing Ecosystem...
Chart 6B...To Commodity Supply Chain
...To Commodity Supply Chain
...To Commodity Supply Chain
RMB - An International Reserve Currency The role of the RMB among official reserve managers, although still dismal compared to the USD and Euro, has accelerated since 2018. Its global share has doubled from Q4 2016 when the IMF began to include holdings of RMB in its currency composition of official foreign exchange reserves (COFER) (Chart 7). Shares of the USD- and Euro-denominated reserves have remained unchanged or declined during the same period. Among private investors, foreign investment in RMB-denominated assets has been the main source of China’s financial account surplus (Chart 8). China has hastened the opening of its onshore financial market to foreign institutional investors. In the past two years, major global stock and bond indexers –including MSCI, the S&P Dow Jones Indices, the FTSE Russell, and the Bloomberg Barclays Global Aggregate Index – have added A-shares and onshore bonds to their flagship benchmarks. This means that foreign institutional investors have significantly boosted their allocation of RMB-denominated stocks and bonds (Chart 8, bottom panel). Financial assets, such as domestic RMB stocks, bonds, and loans and deposits held by foreign entities, climbed by 26.7% in 2019 over 2018. At the same time, China's domestic financial markets have gradually liberalized and even removed investment quotas for overseas institutional investors. Foreign investors currently account for 5.5% and 2.6% of the market value in Chinese equities and bonds, up from 3% and 2% in 2018, respectively. Chart 7The RMB Share In Global Reserves Remains Dismal, But Has Nearly Doubled Since 2016
The RMB Internationalization Scorecard
The RMB Internationalization Scorecard
Chart 8China Has Been Rapidly Expanding The Scope Of Foreign Participants In Its Onshore Financial Markets
China Has Been Rapidly Expanding The Scope Of Foreign Participants In Its Onshore Financial Markets
China Has Been Rapidly Expanding The Scope Of Foreign Participants In Its Onshore Financial Markets
Bottom Line: The internationalization of the RMB will likely continue to accelerate in the face of decoupling from the US. It is a long process, but China will take advantage of its dominance in global demand to foster the RMB's role in both pricing and settlement in cross-border commodity trade. At the same time, China is rapidly expanding the scope of foreign participants in the country's onshore financial markets, by allowing more foreign banks and financial institutions to enter the market, and broadening the channels for the RMB’s international circulation. Jing Sima China Strategist jings@bcaresearch.com Footnotes 1SWIFT is a system that provides information on international payments and calculations. The system unites more than 11,000 banking and financial institutions in 210 countries and the bank card payment function supported by the SWIFT system reflects a country's financial security. 2China Cross-Border Interbank Payment System release, July 31st, 2020. 3Xu Wenhong, The SWIFT System: A Focus on the U.S.–Russia Financial Confrontation, Russian International Affairs Council, February 3, 2020. 4Based on data from Shanghai International Energy Exchange. Cyclical Investment Stance Equity Sector Recommendations
Since 2018, China has been promoting its own domestic cross-border interbank settlement system (CIPS). It is not BCA Research's baseline view that the US will cut off Chinese banks entirely from access to the US Clearing House Interbank Payments System…
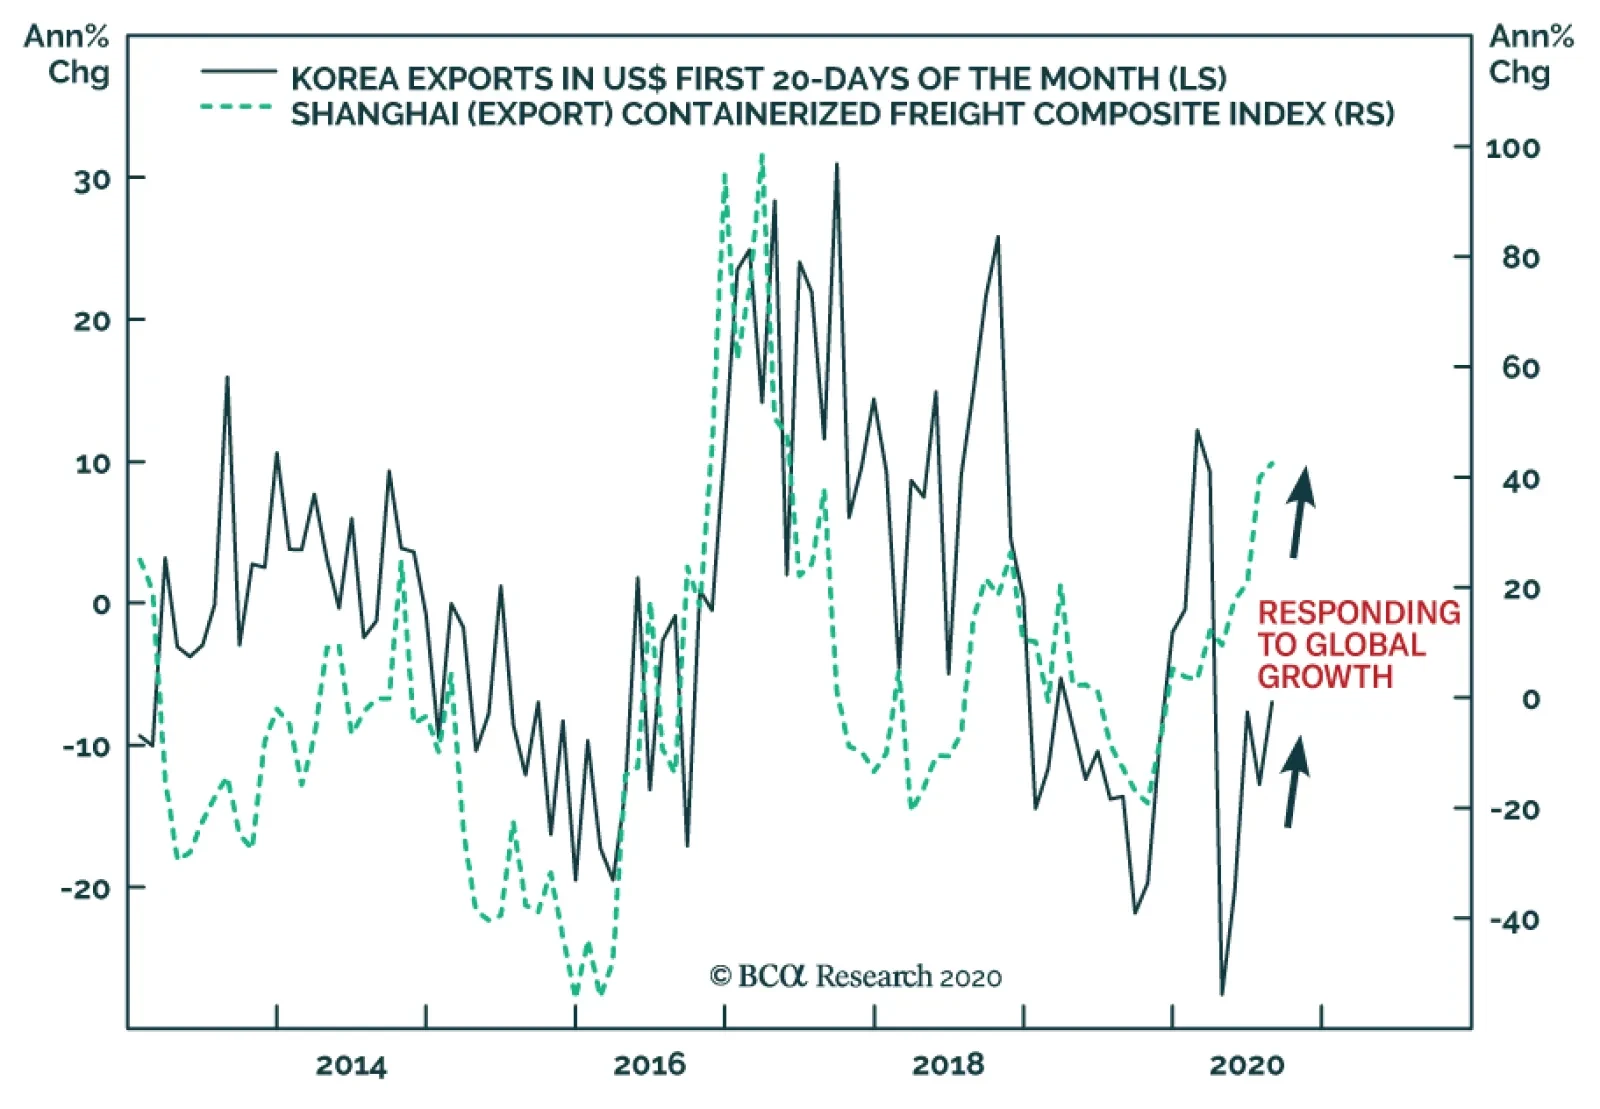
The Shanghai Container Freight Index reached its highest level in 6 years. Some of the strength in China’s container trade can be assigned to idiosyncratic factors. For example, household goods demand in the US and EU is strong, and retailers in those markets…
Highlights The stock market can apparently ignore the intensifying US-China conflict as long as massive monetary and fiscal stimulus continues. Hence the ongoing “stimulus hiccup” is a big problem. Ultimately a stimulus bill will pass, but risks are rising that it will come too late or fall short in size. The longer the negotiations drag on, the more likely that the absence of fiscal support, the spiraling US-China conflict, US political instability, and other risks will take center stage and upset the equity rally. Assuming a new stimulus package will ultimately pass, it will fuel Trump’s tentative comeback in opinion polls, increasing the risk that the revolution in the global trading system gets a new lease on life. Thus volatility is likely to rise from here until the US succession is settled. Stay long JPY-USD and health stocks in the near term and bullion in the long term. Feature Two of the key views we have hammered since May are coming to fruition: Stimulus Hiccup: The White House and Congress are struggling to get a new relief bill passed. We have argued that the next round of fiscal stimulus would face execution risks that would cause equity volatility to rise again, which is now occurring (Chart 1). Ultimately we expect the Republican Senate to capitulate to a major new stimulus bill. But the very near term is murky and the negotiations pose a clear and present danger to an equity market that has now surpassed its pre-COVID-19 highs (Chart 2). Chart 1Volatility Is Bottoming, Will Rise Ahead Of US Election
Volatility Is Bottoming, Will Rise Ahead Of US Election
Volatility Is Bottoming, Will Rise Ahead Of US Election
Chart 2Markets Recovered, Near-Term Risk To Downside
Markets Recovered, Near-Term Risk To Downside
Markets Recovered, Near-Term Risk To Downside
US-China Conflict: The White House has revoked Chinese tech giant Huawei’s general license, leaving the company in thrall to periodic Commerce Department allowances that will impede business. It has also expanded punitive measures to a slew of subsidiaries and Chinese software companies like TikTok (ByteDance) and WeChat (Tencent). We have argued that President Trump’s electoral vulnerability and economic stimulus in both countries lowered the bar to conflict and decoupling. Both countries have an interest in reducing their interdependency and the COVID-19 crisis has given them an opportunity to make structural changes that were previously more difficult. Neither the US tech sector, nor China-exposed US stocks, nor Taiwanese equities are pricing this monumental geopolitical risk at present (Chart 3). Combining these two views results in a dangerous outlook for global risk assets in the near term. The reason we argued that US-China tensions would escalate to the point of disrupting markets this year was that we viewed domestic stimulus as lowering the economic and financial bar that prevented conflict. Hence US and Chinese confrontational steps could go farther than the market expected and eventually something would snap (Chart 4). Chart 3Market Ignores US-China Escalation
Market Ignores US-China Escalation
Market Ignores US-China Escalation
Chart 4US And Global Stimulus Enable US-China Fight
Trade War Sans Stimulus Is Unsustainable
Trade War Sans Stimulus Is Unsustainable
Yet today tensions are escalating despite the failure to arrange a new jolt of domestic stimulus. This is true on both sides, as China is also seeing a deceleration in stimulus provision, mainly on the monetary side, that we also expect to be temporary but nevertheless has negative implications in the near term. The longer fresh stimulus is delayed, the more likely that markets will respond to the historic breakdown in US-China relations, US political instability, and other risks to corporate earnings and the economic recovery. Constraints On Politicians Support Cyclical Recovery To be sure, there is evidence that politicians are aware of their limits and already heading back to the negotiating table. Even with talks ongoing, the risks of delayed stimulus or Chinese retaliation are substantial. First, the White House, House Democrats, and Senate Republicans are continuing to negotiate despite being on recess while hosting national party conventions this week and next. House members are rushing back to Washington to vote on measures to boost the US postal service amid a controversy over how to handle mail-in voting for the election amid the pandemic. This has opened a pathway for stimulus talks to get back on track. It could result in a “skinny” stimulus bill quickly, or otherwise new developments could lead to the roughly $2.5 trillion blowout that we expect based on the two sides splitting the difference on most issues (Table 1). Table 1Stimulus Bill Will Hit $2.5 Trillion If Democrats And Republicans Split The Difference
Trade War Sans Stimulus Is Unsustainable
Trade War Sans Stimulus Is Unsustainable
Chart 5Trump’s Reelection Bid Stands On The Economy
Trade War Sans Stimulus Is Unsustainable
Trade War Sans Stimulus Is Unsustainable
Second, the US and China are arranging to keep talking. Ostensibly they are checking up on the status of the Phase One trade deal. The Trump administration cannot easily walk away from this deal– unless Trump irredeemably becomes a lame duck making a desperate bid to turn the tables on the Democrats. To do so would hurt Trump’s credibility on renegotiating US trade deals and likely trigger a selloff in the stock market that could set back the economic recovery and remove the last leg that his reelection bid stands on (Chart 5). The Chinese, for their part, have stuck with the deal despite US punitive measures because they do not want to provoke Trump, lest he attempt to inflict maximum damage on their economy in his final months or in a second presidential term. The renminbi is not depreciating relative to the dollar, suggesting that the tenuous truce is intact for now (Chart 6). Chart 6Renminbi Signals Phase One Trade Deal Intact ... For Now
Renminbi Signals Phase One Trade Deal Intact ... For Now
Renminbi Signals Phase One Trade Deal Intact ... For Now
Yet The Market May Sell Before Politicians Soften Their Line Nevertheless in the very near term investors have very low visibility on what happens next. Congress could still fumble and cause greater doubts. It could easily fail to reach a new stimulus deal until after September 8 when the Senate returns or September 14 when the House returns. President Trump’s executive orders, and negotiating gestures from Republicans, are a tenuous bridge for markets as they fall far short of even the Republicans’ $1 trillion asking price. The stock market will plunge if the talks collapse, but it will also drop if the stimulus falls short. The market may have to sell off to force politicians to provide stimulus and temper strategic competition. Trump’s complicated attempt to extend relief via executive orders, and/or a skinny deal that does not include direct rebates to households and funding for state and local governments, would be inadequate for the needs of the economy (Chart 7). It is imperative for Senate Republicans to capitulate and come closer to the Democrats $2.4 trillion standing offer (down from $3.4 trillion) – but it is possible they could miscalculate and fail to compromise. Democrats will not cave because they ultimately benefit at the ballot box if stimulus flops and financial turmoil returns. Chart 7US Economy Needs Extended Period Of Fiscal Support
US Economy Needs Extended Period Of Fiscal Support
US Economy Needs Extended Period Of Fiscal Support
On the China front, it is not guaranteed that China will refrain from retaliation against tech companies like Apple that depend on China for their operations. The market is betting that a rally entirely based on the tech sector can be sustained even in the face of an expanding tech war between the world’s biggest economies (Chart 8). Yet China suffers an economic and strategic blow from the US imposition of a technological cordon and Xi Jinping could decide to retaliate immediately. He could come to believe that the risk of not retaliating – which would entail continuing economic recovery and possibly Trump’s reelection on an anti-China platform – is greater than the risk of retaliation and financial turmoil. He has the ability to stimulate the domestic economy and benefits if he sets a precedent that American presidents lose if they attack China. China may not turn to Taiwan immediately, but since 2016 we have highlighted that Taiwan, not Hong Kong, is the major geopolitical risk stemming from the US-China crisis. Saber-rattling, cyber-rattling, and punitive economic measures are picking up in the Taiwan Strait and could lead to a global geopolitical crisis at any time. Here, too, the base case is that China will remain in a holding pattern until after the US election. It also should use economic sanctions long before it resorts to the final military option (Chart 9). But there is a large risk of miscalculation as the US seeks to cut off Taiwan semiconductor trade with China while Taiwan reduces its economic dependency on the mainland and tightens its defense relations with the United States. The Trump administration presents a window of opportunity so the risks are elevated in the lead up to and aftermath of the US election. Chart 8Tech Bubble Amid Tech War An Obvious Danger
Tech Bubble Amid Tech War An Obvious Danger
Tech Bubble Amid Tech War An Obvious Danger
Chart 9China's Economic Card May Be Only Thing Preventing War
China's Economic Card May Be Only Thing Preventing War
China's Economic Card May Be Only Thing Preventing War
We do not view Chinese economic sanctions on Taiwan as a tail risk but rather as our base case. Of course, we eschew conspiracy theories and usually seek to curb enthusiasm over war risks, as with Sino-Indian saber-rattling. But Taiwan is the epicenter of the political, military, and technological struggle between Washington and Beijing. War is a tail-risk, but even minor clashes would have a major impact on global financial markets. Other Risks Come To Forefront Amid Stimulus Hiccup Chart 10Trump’s Comeback Substantial If Stimulus Passes, Pandemic Subsides
Trade War Sans Stimulus Is Unsustainable
Trade War Sans Stimulus Is Unsustainable
The longer stimulus is delayed, the more likely that other risks will rise to the forefront and trouble the equity market. The US election does not offer much upside for markets at this point. Other risks stem from Iran and Russia. In the US election, President Trump is beginning to make a comeback in the opinion polling (Chart 10). Trump’s approval rating benefits from signing off on deals, so a final stimulus bill from Congress is essential. But a stimulus bill, a continued rollover in new cases of COVID-19, and a revival of support among his base would improve his odds of winning. Former Vice President Joe Biden is not polling much better against Trump than former Secretary of State Hillary Clinton did back in 2016 (Chart 11). Biden’s momentum in national opinion polling has been arrested, especially in battleground states, and the lower end of the “band of uncertainty” around the polling also suggests that Trump is within striking distance (Chart 12). Chart 11Biden Polling About Same As Hillary Versus Trump
Trade War Sans Stimulus Is Unsustainable
Trade War Sans Stimulus Is Unsustainable
Chart 12Trump Still Within Striking Distance Of Biden
Trade War Sans Stimulus Is Unsustainable
Trade War Sans Stimulus Is Unsustainable
Our election model suggests that Trump has a 42% chance of winning, which is higher than our subjective 35% (Chart 13). We will upgrade if a stimulus bill is agreed. A Trump comeback may be received well by US equity markets – as it prevents tax hikes, re-regulation, higher minimum wages, and a federal push to revive labor unions, all promoted by Biden and the Democrats. But then again, Biden’s agenda is more reflationary, whereas Trump faces obstacles in a still-Democratic House, leaving global trade as the path of least resistance – which is market-negative. The dollar may bounce on the prospect of a Trump second term (Chart 14). Tech stocks, Chinese currency, and other cyclicals, such as the euro and European stocks, will suffer a setback if Trump is reelected. Chart 13We Give Trump 35% Odds, Quant Model Shows Upside At 42%
Trade War Sans Stimulus Is Unsustainable
Trade War Sans Stimulus Is Unsustainable
Lesser risks, still notable, include Iran and Russia. Chart 14Trump Could Trigger Near-Term Dollar Bounce
Trump Could Trigger Near-Term Dollar Bounce
Trump Could Trigger Near-Term Dollar Bounce
We have maintained that the US and Iran are in a bull market of geopolitical tensions and that this could result in crisis around the election. The US’s decision on August 20 unilaterally to maintain the expiring international conventional arms embargo on Iran is a clear trigger for a military incident. The macro and market implications are different and less dire than with a US-China crisis. But oil price volatility would rise due to regional instability, President Trump’s reelection bid could benefit, and that would carry the implication of expanding trade war with China. Meanwhile our expectation of sharply rising Russian geopolitical risk is materializing both within Russia and in relations with Europe, which is preparing sanctions over the suppression of dissent within both Russia and its satellite state Belarus. Russia is capable of interfering in the US election while a Democratic victory would likely lead to a US policy offensive against Russia. Investors must look beyond the short term. If stimulus is passed, the stock market will go up, but the US and China will be further enabled and ultimately their strategic showdown will cap the gains by harming the tech sector. Meanwhile, if the stimulus fails, then the market will plunge. Investment Takeaways At present the stock market seems prepared for Trump to remain in the White House – or for Republicans to retain the Senate. The market’s YTD profile matches that of past elections that result in gridlock, as opposed to the Democratic “clean sweep” scenario that we have flagged as the likeliest outcome (Chart 15). However, this profile will change, the market will correct, if Trump does not sign a new relief act. Assuming stimulus ultimately passes, markets will cheer and Trump’s comeback in the polls will get a boost. He could still lose the election, given fundamental political and economic weaknesses captured in our state-by-state quantitative model above. But the election itself would be more closely fought – with a contested outcome more likely to occur and roil markets. Finally a Trump victory would give a new mandate to the US-China breakdown and the revolution in the global trading system, which is ultimately negative for risk assets and the cyclical recovery. Hence our confidence that the next few months will be marked by volatility. Ultimately geopolitical and macro fundamentals are negative for the dollar even if Trump provides the occasion for a last gasp in the past decade’s dollar bull market. The US is monetizing its debt and flooding the world with dollar liquidity. Meanwhile China and other powers are diversifying away from the dollar and into gold, the euro, the yen, and other reserve currencies over the long run (Chart 16). Chart 15Dollar Outlook Bearish In Medium Term
Dollar Outlook Bearish In Medium Term
Dollar Outlook Bearish In Medium Term
Chart 16Stock Market Preparing For Trump Win And More Gridlock?
Stock Market Preparing For Trump Win And More Gridlock?
Stock Market Preparing For Trump Win And More Gridlock?
The great US fiscal debate is over, regardless of Trump or Biden, as populism has made austerity impracticable and massive twin deficits will ensue. Thus we remain long gold and the Japanese yen. We have refrained from re-initiating our long EUR-USD trade given our expectation of stimulus hiccups and US-China tensions, but will reconsider if and when these hurdles are cleared. Our strategic portfolio continues to expect a global recovery over the next twelve months and beyond but tactically we are positioned against downside risks. Matt Gertken Vice President Geopolitical Strategy mattg@bcaresearch.com
Highlights The strength in global semiconductor sales in recent months has been due to one-off factors stemming from pandemic-related lockdowns. As the one-off demand surge subsides, global semiconductor sales will decline modestly toward the end of this year. In the near term, global semiconductor stock prices are vulnerable due to overbought conditions, excessive valuations and demand disappointment. The global semiconductor industry is at the epicenter of the US-China confrontation, and more US restrictions on chips sales to China are probable. This is another risk for this sector's share prices. Nevertheless, the structural outlook for global semiconductor demand is constructive. Its CAGR may rise from 3% during 2014-2019 to 5% during 2020-2024. Feature Investor euphoria has taken hold of semiconductor stocks. Global semiconductor stock prices have skyrocketed by 68% from March lows and 96% from December 2018 lows. Meanwhile, global semiconductor sales during March-June rose only by 5% from a year ago. As a result, the ratio of market cap for global semiconductor stocks relative to global semiconductor sales has reached its highest level since at least the inception of data in 2003 (Chart 1). Chart 1Global Semiconductor Sector: Market Cap-To-Sales Ratio Has Surged
Global Semiconductor Sector: Market Cap-To-Sales Ratio Has Surged
Global Semiconductor Sector: Market Cap-To-Sales Ratio Has Surged
With semi equity multiples very elevated, their share prices have become even more sensitive to global semiconductor demand growth. Hence, the focus of this report is to try to gauge the strength of global semiconductor demand, both in the near term and structurally. Near-term semiconductor stock prices could disappoint due to weak chip demand from the smartphone sector and diminishing purchases of personal computers (PCs) and servers. However, structurally, we are positive on global semiconductor demand, which is underpinned by the continuing rollout of 5G networks and phones, a wider adoption of data centers, and further technological advancements in artificial intelligence (AI), cloud computing, edge computing and smaller nodes for chip manufacturing (Box 1). Box 1 Key Technologies Underpinning Potential Global Semiconductor Demand AI refers to the simulation of human intelligence in machines, for example, computers that play chess and self-driving cars. The goals of AI include learning, reasoning and perception. Cloud computing is the delivery of computing services – including servers, storage, databases, networking, software, analytics and intelligence – over the Internet (“the cloud”) to offer faster innovation, flexible resources and economies of scale. Edge computing is a form of distributed computing, which brings computation and data storage closer to where it is needed, to improve response times and save bandwidth. Technology node refers to the width of line that can be processed with a minimum width in the semiconductor manufacturing industry, such as technology nodes of 10 nanometers (nm), 7nm, 5nm and 3nm. The smaller the nodes are, the more advanced they are. Near-Term Headwinds Chart 2World Semiconductor Sales Diverged From The Global Business Cycle
World Semiconductor Sales Diverged From The Global Business Cycle
World Semiconductor Sales Diverged From The Global Business Cycle
Semiconductor demand worldwide grew by 6% year-on-year in the first half of this year. There has been a remarkable divergence between world semiconductor sales and the global business cycle (Chart 2). The divergence between semiconductor sales and economic activity was most striking in the US and China. Semiconductor sales in China rose by 5% year-on-year in Q12020, and in the US they grew by 29% year-on-year in Q22020, despite a contraction in their aggregate demand during the same period. By contrast, Q2 annual growth of semiconductors sales was -2.2% for Japan, -17% for Europe and 1.8% for Asia ex. China and Japan (Chart 3). The reasons why the US and China posted a surge in semiconductor demand while Europe and Japan experienced a contraction in domestic semiconductor sales are as follows: Most data center investment is occurring in the US and China. Chart 4 shows that 40% of global hyperscale data centers are operating in the US, much larger than any other countries/regions. China, in turn, ranked second, with a global share of 8%. Chart 3Strong Semiconductor Sales In The US And China, But Not Elsewhere
Strong Semiconductor Sales In The US And China, But Not Elsewhere
Strong Semiconductor Sales In The US And China, But Not Elsewhere
Chart 4The US Has The Most Global Hyperscale Data Centers
Global Semiconductor Stocks: A Hiatus Is Overdue In A Structural Bull Market
Global Semiconductor Stocks: A Hiatus Is Overdue In A Structural Bull Market
Demand contraction in Europe and Japan is due to semiconductor demand in these regions mainly originating from the automobile sector, where production was severely hit by the global pandemic. About 37% of European semiconductor sales were from last year’s automotive market. We believe the divergence between global economic activity and semiconductor sales, as demonstrated by Chart 2 on page 3, has been due to one-off factors, as the global pandemic lockdowns have spurred semiconductor demand. Such a one-off demand boost will likely dissipate in the coming months. Traditional PCs and tablets: There has been a surge in demand for traditional PCs1 and tablets in the past six months. This was due to the significant increase in online activities, such as working from home, education, e-commerce, gaming and entertainment. Data from the International Data Corporation (IDC) has revealed that shipments of traditional PCs and tablets in volume terms had a strong year-on-year growth of 11.2% and 18.6%, respectively, in the period of April-June (Chart 5). Looking forward, even renewed lockdowns will not lead to a similar rush to buy these products. Many households are already equipped to work from home and for other online activities. With many countries gradually opening their economies, such demand will diminish. The traditional PC and tablet sectors together account for about 13% of global chip demand (Chart 6). Chart 5Personal Computers Sales Have Surged Amid Lockdowns
Personal Computers Sales Have Surged Amid Lockdowns
Personal Computers Sales Have Surged Amid Lockdowns
Chart 6The Breakdown Of Global Semiconductor Sales By Type Of Usage
Global Semiconductor Stocks: A Hiatus Is Overdue In A Structural Bull Market
Global Semiconductor Stocks: A Hiatus Is Overdue In A Structural Bull Market
Chart 7Server Sales Have Surged Amid Lockdowns
Server Sales Have Surged Amid Lockdowns
Server Sales Have Surged Amid Lockdowns
Server demand: Another major semiconductor demand contribution in Q2020 was from the server sector, which spiked by 21% year-on-year (Chart 7). The surge in online activities triggered a strong demand for cloud services and remote work applications, both of which require computer servers to run on. However, demand from the server sector is also set to diminish in 2H2020 and Q1 2021. Provided the inventories at major data center operators, including Microsoft, Google and Amazon, remain at high levels,2 global cloud service providers will likely reduce their orders of servers next quarter.3 Enterprises will also likely cut their investment in computer servers in 2H2020, as many of them had already increased their purchases of servers to prepare employees and business processes for remote working. We expect global server demand growth to soften in 2H2020. The Digitimes Research forecasted a 5.6% quarter-on-quarter contraction in 3Q2020 and a further cut in global sever shipment in the 4Q2020.2 The global server sector accounts for about 10% of global chip demand and, together with PCs and tablets, they make for 23% (please refer to Chart 6 on page 5). Further, the smartphone sector – accounting for 27% of global semiconductor demand – will continue struggling in H2 this year. The global total smartphone demand has been hit severely, as households delayed their new smartphone purchases. According to Canalys’ data, global smartphone shipments dropped by 13% and 14% year-on-year in Q1 and Q2, respectively. The strength in global semiconductor sales in recent months has been due to one-off factors stemming from the lockdowns. Chart 8Global Smartphone Shipments Will Likely Remain Weak In 2020H2
Global Smartphone Shipments Will Likely Remain Weak In 2020H2
Global Smartphone Shipments Will Likely Remain Weak In 2020H2
We expect smartphone shipments to continue contracting over the next three-to-six months (Chart 8). We believe global consumers will remain cautious in their spending on discretionary goods, such as smartphones, due to lowered incomes and increased job uncertainty. The IDC also forecasted that global smartphone shipments would not grow until 1Q2021.4 The Chinese smartphone sales showed a considerable weakness in July, with a 35% year-on-year contraction, which is much deeper than the 20% decline in H1 this year. 5G smartphone shipments also slowed last month, with a 21% drop from the previous month. Bottom Line: The strength in global semiconductor sales in recent months has been due to one-off factors stemming from the lockdowns. As this one-off demand subsides, global semiconductor sales will decline modestly toward the end of this year. Given the overbought conditions and the elevated equity valuations, global semiconductor stocks are currently vulnerable to near-term disappointments in semiconductor demand. At The Epicenter Of The US-China Rivalry Semiconductors are at the epicenter of the US-China confrontation. Ultimately, the US-China contention is about future technological dominance. That is access to technology and the capability to develop new technologies. The global semiconductor industry is at the epicenter of the US-China confrontation. China currently accounts for about 35% of the global semiconductor demand. US restrictions on semi producers worldwide to supply semiconductors to Chinese buyers constitute a major risk to semiconductor stock prices. On August 17, the US announced fresh sanctions that restrict all US and foreign semiconductor companies from selling chips developed or produced using US software or technology to Huawei, without first obtaining a license. In May, the US had already limited companies, such as the Taiwan Semiconductor Manufacturing Company (TSMC), from making and supplying Huawei with its self-designed chips. In addition, the US recently threatened bans on Chinese-owned apps TikTok and WeChat, and signaled that it could soon restrict Alibaba’s operations in the US. Chart 9Global Semi Companies' Sales To China Are Substantial
Global Semiconductor Stocks: A Hiatus Is Overdue In A Structural Bull Market
Global Semiconductor Stocks: A Hiatus Is Overdue In A Structural Bull Market
The global semiconductor sector is highly vulnerable to further escalation in the tension between these two superpowers. Major global semiconductor companies’ sales are heavily exposed to China, and their revenue from China ranges from 16% to 50% of total (Chart 9). We have been puzzled why global semi share prices have been rallying in spite of US limitations on semiconductor shipments to Huawei and its affiliated entities. One explanation could be that the Chinese companies that are not affiliated with Huawei are able to import semiconductors and then supply them to Huawei. If this is true, the US will have no other choice but to limit all semiconductor sales to China. This will be devastating for global semi producers given their large exposure to China. In anticipation of US punitive policies limiting its access to semiconductors, China had boosted its semiconductor imports over the past 12 months (Chart 10, top panel). Chinese imports of integrated circuits rose by 12% year-on-year in 1H2020, which is much higher than the 5% year-on-year increase in Chinese semiconductor demand during the same period (Chart 10, bottom panel). This gap suggests the country had restocked its semiconductor inventories. China has particularly restocked its imports of non-memory chips with imports of processor & controller and other non-memory chips in H1, surging by 30% and 20%, respectively, in US dollar terms (Chart 11). For memory chips, the contraction in Chinese imports was mainly due to a decline in global memory chip prices. Chart 10China Had Likely Restocked Its Semi Inventories
China Had Likely Restocked Its Semi Inventories
China Had Likely Restocked Its Semi Inventories
Chart 11Strong Chinese Imports In Non-Memory Chips
Strong Chinese Imports In Non-Memory Chips
Strong Chinese Imports In Non-Memory Chips
Bottom Line: The global semiconductor industry is at the epicenter of the US-China confrontation, and more restrictions on sales to China are probable. In turn, the restocked semiconductor inventory in China raises the odds of weakening mainland semiconductor import demand in H2 of this year. Structural Tailwinds Table 1Global Semiconductor Demand CAGR Forecast Over 2020-2024 By Device
Global Semiconductor Stocks: A Hiatus Is Overdue In A Structural Bull Market
Global Semiconductor Stocks: A Hiatus Is Overdue In A Structural Bull Market
We are optimistic on structural global semiconductor demand. Its nominal CAGR may rise from 3% during 2014-2019 to 5% during 2020-2024 in US dollar terms. Table 1 shows our demand growth forecasts for global chips in the main consuming sectors over the next five years. The major contributing sectors during 2020-2024 will be 5G smartphones, servers, industrials, electronics and automotive manufacturing. The underlying driving forces are the continuing rollout of 5G networks and phones, the development of data centers, and further technological advancements in AI, cloud computing and edge computing. Currently, the world is still in the early stages of 5G network development. AI, cloud computing and edge computing are constantly evolving. With increasing adoption of 5G smartphones, computer servers and IoT devices, global semiconductor demand is in a structural uptrend (Box 2). Box 2 Key Components For The Virtual World In Development Data centers and cloud computing allow data to be stored and applications to be running off-premises and to be accessed remotely through the internet. Edge computing allows data from Internet of things (IoT) devices to be analyzed at the edge of the network before being sent to a data center or cloud. IoT devices contain sensors and mini-computer processors that act on the data collected by the sensors via machine learning. The IoT is a growing system of billions of devices — or things — worldwide that connect to the internet and to each other through wireless networks. AI technology empowers cloud computing, edge computing and IoT devices. 5G is at the heart of the IoT industry transformation, making a world of everything connected possible. 5G Smartphone Currently, China is the world’s largest 5G-smartphone consumer and the leading 5G-adopter in the world. According to Digitimes Research, global 5G smartphone shipments will reach over 250 million units in 2020, with 170 million (68%) in China and only 80 million units in the world ex. China. Looking forward, 5G smartphone shipments are set to accelerate worldwide over the coming years. Chart 125G Phone Shipments In China Will Continue To Rise
5G Phone Shipments In China Will Continue To Rise
5G Phone Shipments In China Will Continue To Rise
The 5G phone shipments in China will continue to rise. The 5G phone sales penetration rate in China is likely to rise from 60% in July to 95% by the end of 2022. In such a case, we estimate that the monthly Chinese 5G phone shipments will increase from the current 16 million units to about 25-30 million units in 2022 (Chart 12). In the rest of the world, the 5G smartphone adoption pace will also likely speed up over the next five years. The 5G phone selling prices in the world outside China will drop, as more models are introduced and become more affordable. 5G smartphone prices have already fallen in China and will inevitably fall elsewhere. Chinese 5G smartphone producers will ship their low-priced 5G phones overseas, putting pressure on other producers to lower their prices. The 5G infrastructure development is accelerating in China and will accelerate in the rest of the world. Both China and South Korea have been very aggressive in their respective 5G network development. As of the end of June, China's top three carriers: China Mobile, China Unicom, and China Telecom – which together serve more than 1.6 billion mobile users in the country – had installed 400,000 5G base stations against an annual target of 500,000. In comparison, as of April 2020, American carriers had only put up about 10,000 5G base stations.5 As the US is competing with China on the 5G front, the country will likely boost its investment in 5G network development aggressively over the next five years in order to catch up to, or even exceed, China. Importantly, the 5G smartphone has more silicon content than 4G smartphones. More silicon content means higher semiconductor value. Rising 5G smartphone sales and higher silicon content together will more than offset the loss in semiconductor sales due to falling global 4G smartphone shipments. Based on our analysis, we expect a CAGR growth of 4% in semiconductor demand from the global smartphone sector over the next five years, slightly lower than the 5% in previous five years (Table 1 on page 10). This also takes into consideration that the 5G network will be more difficult and more expensive to develop than the 4G network. Servers Global server shipment growth will be highly dependent on both the pace and the scale of data center development (Box 3). Data centers account for over 60% of global server demand. The future growth of data centers is promising. The global trend of data localization6 due to the concerns of data privacy and national security will also bolster a boom of data centers over the next five years. A growing number of countries are adopting data localization requirements, such as China, Russia, Indonesia, Nigeria, Vietnam and some EU countries. While the Chinese data center market is expected to expand by a CAGR of about 28% over 2020-2022,7 a report recently released by Technavio forecasted the global data center industry’s CAGR at over 17% during 2019-2023. We forecast that the global semiconductor demand from servers will grow at a CAGR of 12% over 2020-2024. Box 3 Data Centers There are four main types of data centers – enterprise data centers, managed services data centers, colocation data centers, and cloud data centers. Data centers can have a wide range of number of servers. Corporate data centers tend to have either 200 (small companies), or 1000 servers (large companies). In comparison, a hyperscale data center usually has a minimum of 5,000 servers linked with an ultra-high speed, high fiber count network. Outsourcing and a move towards the cloud are driving the growth of the hyperscale data center. Instead of companies investing in physical hardware, they can rent server space from a cloud provider to both save their data and reduce costs. Amazon, Microsoft, Google, Apple and Alibaba are all top global cloud service providers. The more hyperscales to be built up, the higher the demand for servers. In 2019, about 13% of the total number of data centers in China were of the hyperscale and large-scale varieties. The plan of new infrastructure development announced earlier this year by Beijing was aiming to increase the number of hyperscale and large-scale data centers in China. Among current data centers either under construction or to be developed in the near future, 36% of them are hyperscale and large-scale data centers. IoTs Technological advancements in AI, cloud computing and edge computing, in combination with 5G network development, will facilitate the IoTs adoption. According to the GSMA,8 46 operators in 24 markets had launched commercially available 5G networks by 30 January 2020. It forecasted that global IoT connections will be increased from 12 billion mobile devices in 2019 to 25 billion in 2025 with a CAGR at 13%.9 IoTs chips include the Artificial Intelligence of Things (AIoT) – a powerful convergence of AI and the IoT. IoTs is an interconnected network of physical devices. Every device in the IoT is capable of collecting and transferring data through the network. Looking forward, global demand of AI chips and IoT chips will have significant potential to grow with creation of “smarter manufacturing”, “smarter buildings”, “smarter cities”, etc. AI applications can be used in manufacturing processes to render them smarter and more automated. Productivity will be enhanced as machines achieve significantly improved uptime while also reducing labor costs. There are plenty of upsides in industrial semiconductor demand (Chart 13). We expect the CAGR of industrial electronics to increase from 3.4% during 2014-2019 to 8% during 2020-2024. AI applications can create smart buildings by increasing connectivity across enterprise assets, enabling home network infrastructure (e.g., routers and extenders) and employing home-security devices (e.g., cameras, alarms and locks). AI applications can be used to create smart cities. A smart city is an urban area that uses different types of IoT electronic sensors to collect data. Insights gained from that data are used to manage assets, resources and services efficiently; in return, that data is used improve operations across the city. China has already developed about 750 trial sites of smart cities with different degrees of smartness in the past decade. As AI and 5G technology advances, the existing smart cities’ “smartness” will be upgraded and new trial smart cities will be implemented. Based on IDC data, China’s investment in smart cities will rise at a CAGR of 13.5% over 2020-2023 (Chart 14). Globally, the U.S., Japan, European countries and other nations are also actively developing smart cities. According to a new study conducted by Grand View Research, the global smart cities market size is expected to grow at a CAGR of 24.7% from 2020 to 2027.10 Chart 13Plenty Of Upside In Industrial Semiconductor Demand
Plenty Of Upside In Industrial Semiconductor Demand
Plenty Of Upside In Industrial Semiconductor Demand
Chart 14China’s Investment In Smart Cities Will Continue To Grow
Global Semiconductor Stocks: A Hiatus Is Overdue In A Structural Bull Market
Global Semiconductor Stocks: A Hiatus Is Overdue In A Structural Bull Market
Automotive We expect the global automotive chip market to grow at a CAGR of 9% during 2020-2024, as in 2014-2019. The increase in consumption of semiconductors by the auto industry will continue to be driven by the market evolution toward autonomous, connected, electric and shared mobility. Most new vehicles now include some level of advanced driver assist systems (ADAS), such as adaptive cruise control, automatic brakes, blind spot monitoring, and parallel parking. The whole industry is progressing toward fully autonomous vehicles in the coming years. Increasing adoption of automotive chips and recovering car sales will revive automotive chip sales. In addition, rising penetration of new energy vehicles (NEVs) is beneficial to semiconductor sales, as NEVs contain higher semiconductor content than conventional vehicles. Conventional vehicles contain an average of a $330 value of semiconductor content while hybrid electric vehicles can contain up to $1,000 and $3,500 worth of semiconductors.11 Regarding other sectors, we are also positive on structural demand of storage and consumer electronics. AI applications generate vast volumes of data—about 80 exabytes per year, which is expected to increase by about tenfold to 845 exabytes by 2025.12 In addition, developers are now using more data in AI and deep learning (DL) training, which also increases storage requirements. With massive potential demand for storage, we estimate a CAGR of 7% over 2020-2024 (Table 1 on page 10). A recent report from ABI Research predicts that the COVID-19 pandemic will increase global sales of wearables (such as a Fitbit or Apple Watch) by 29% to 30 million shipments of the devices this year. With contribution from wearables, we expect global semiconductor demand from the consumer sector to grow at a CAGR of 3% over 2020-2024, the same rate as in the previous five years. Bottom Line: Continuing rollout of 5G networks and phones, development of data centers, and further technological advancements in AI and cloud computing will provide tailwinds to structural global semiconductor demand, accelerating its CAGR growth from 3% during 2014-2019 to 5% during 2020-2024. Valuations And Investment Conclusions Most global semiconductor stocks are currently over-hyped. Critically, both DRAM and NAND prices have been deflating since January, reflecting weak demand for memory chips. Yet, share prices of memory producers have rallied (Chart 15). Overall, global semiconductor stock prices have diverged from their sales and profits. Overall, global semiconductor stock prices have diverged from their sales and profits (Chart 16). Chart 15Falling Memory Prices Pose Risk To Memory Stocks
Falling Memory Prices Pose Risk To Memory Stocks
Falling Memory Prices Pose Risk To Memory Stocks
Chart 16Global Semiconductor Stocks Have Deviated From Profits
Global Semiconductor Stocks Have Deviated From Its Profits
Global Semiconductor Stocks Have Deviated From Its Profits
Consequently, the multiples of semiconductor stocks have spiked to multi-year highs (Chart 17). Even after adjusting for negative US real bond yields, valuations of semiconductor stocks are not cheap. Chart 18 illustrates the equity risk premium for global semiconductor stocks is at the lower end of its range of the past 10 years. The ERP is calculated as forward earnings yield minus 10-year US TIPS yields. It is impossible to time a correction or know what the trigger would be (US-China tensions have been our best guess). Nevertheless, we do not recommend chasing semiconductor stocks higher due to their overstretched technicals and valuations on the one hand and potential weakening demand in H2 on the other. Chart 17Global Semiconductor Stocks: Elevated Valuations
Global Semiconductor Stocks: Elevated Valuations
Global Semiconductor Stocks: Elevated Valuations
Chart 18Equity Risk Premium For Global Semi Stocks Is Historically Low
Equity Risk Premium For Global Semi Stocks Is Historically Low
Equity Risk Premium For Global Semi Stocks Is Historically Low
In addition, the ratio of global semi equipment stock prices relative to the semi equity index correlates with absolute share prices of global semi companies. This is because equipment producers are higher-beta as they outperform during growth accelerations and underperform during growth slumps. The basis is that semi manufacturers have to purchase equipment if there is actual strong demand coming up and vice versa. The recent underperformance by global semi equipment stocks relative to the semi equity index might be an early sign of a potential reversal in semi share prices in absolute terms (Chart 19). Chart 19A Signal Of A Potential Reversal In Semi Share Prices
A Signal Of A Potential Reversal In Semi Share Prices
A Signal Of A Potential Reversal In Semi Share Prices
Meanwhile, we believe the subsector- memory chip stocks - will outperform the overall semiconductor index amidst the potential correction, because they have lagged and are less over-extended. Finally, we remain neutral on Taiwanese and Korean bourses within the EM equity space for now. Escalation in US-China confrontation, as well as their exposure to semiconductors, put these bourses at near-term risk. That said, we are reluctant to underweight these markets because fundamentals in EM outside North Asia remain challenging. Ellen JingYuan He Associate Vice President ellenj@bcaresearch.com Footnotes 1Traditional PCs are comprised of desktops, notebooks, and workstations. 2Global server shipments to contract 5.6% sequentially in 3Q2020, says Digitimes Research 3Global server shipments forecast to increase by 5% this year: TrendForce 4IDC Expects Worldwide Smartphone Shipments to Plummet 11.9% in 2020 Fueled by Ongoing COVID-19 Challenges 5America does not want China to dominate 5G mobile networks 6“Data localization” can be defined as the act of storing data on a device that is physically located within the country where the data was created. Data localization requirements are governmental obligations that explicitly mandate local storage of personal information or strongly encourage local storage through data protection laws that erect stringent legal compliance obligations on cross-border data transfers. 7The big data center industry ushered in another outbreak 8The GSMA represents the interests of mobile operators worldwide, uniting more than 750 operators with almost 400 companies in the broader mobile ecosystem, including handset and device makers, software companies, equipment providers and internet companies, as well as organizations in adjacent industry sectors. 9GSMA: 5G Moves from Hype to Reality – but 4G Still King 10Smart Cities Market Size Worth $463.9 billion By 2027 11The Automotive Semiconductor Market – Key Determinants of U.S. Firm Competitiveness 12AI is data Pac-Man. Winning requires a flashy new storage strategy.
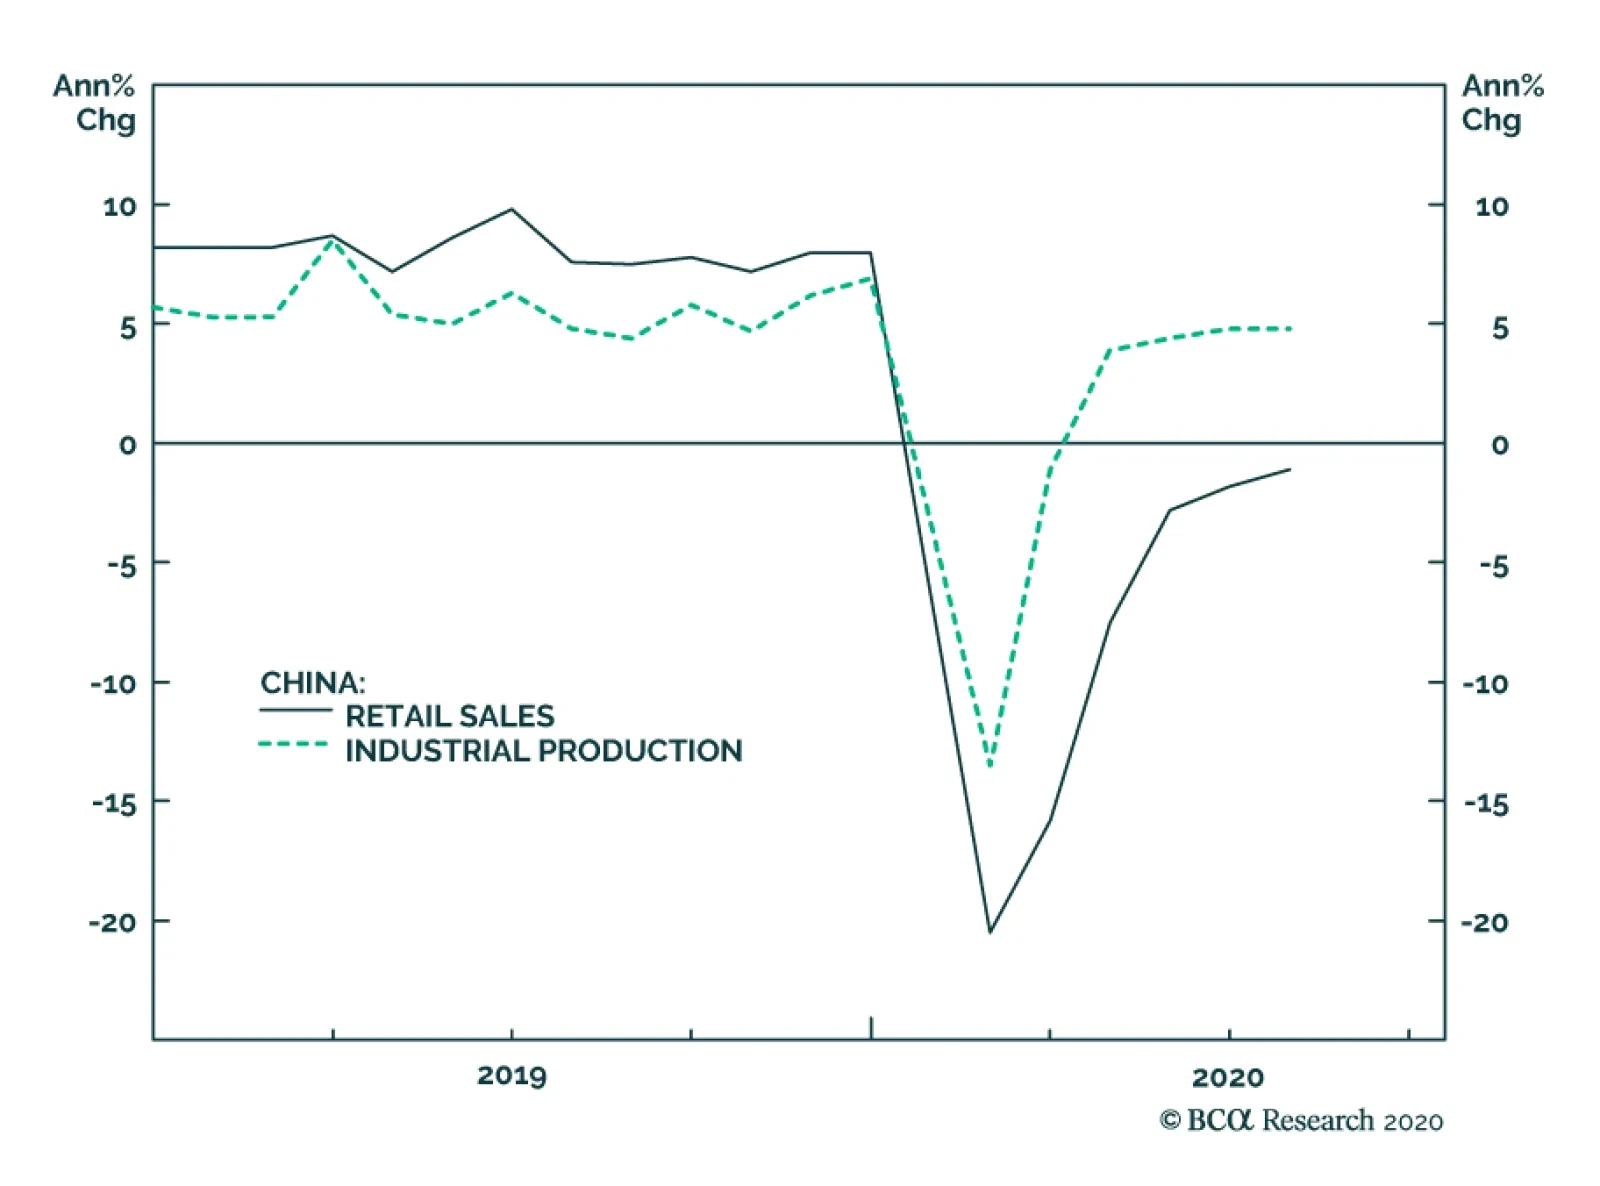
Chinese investment and retail sales data surprised slightly on the downside in July. Retail sales, for example, fell by 1.1% year-on-year, better than the 1.8% decline in June, but below the consensus expectation of +0.1%. The unemployment rate -– which the…
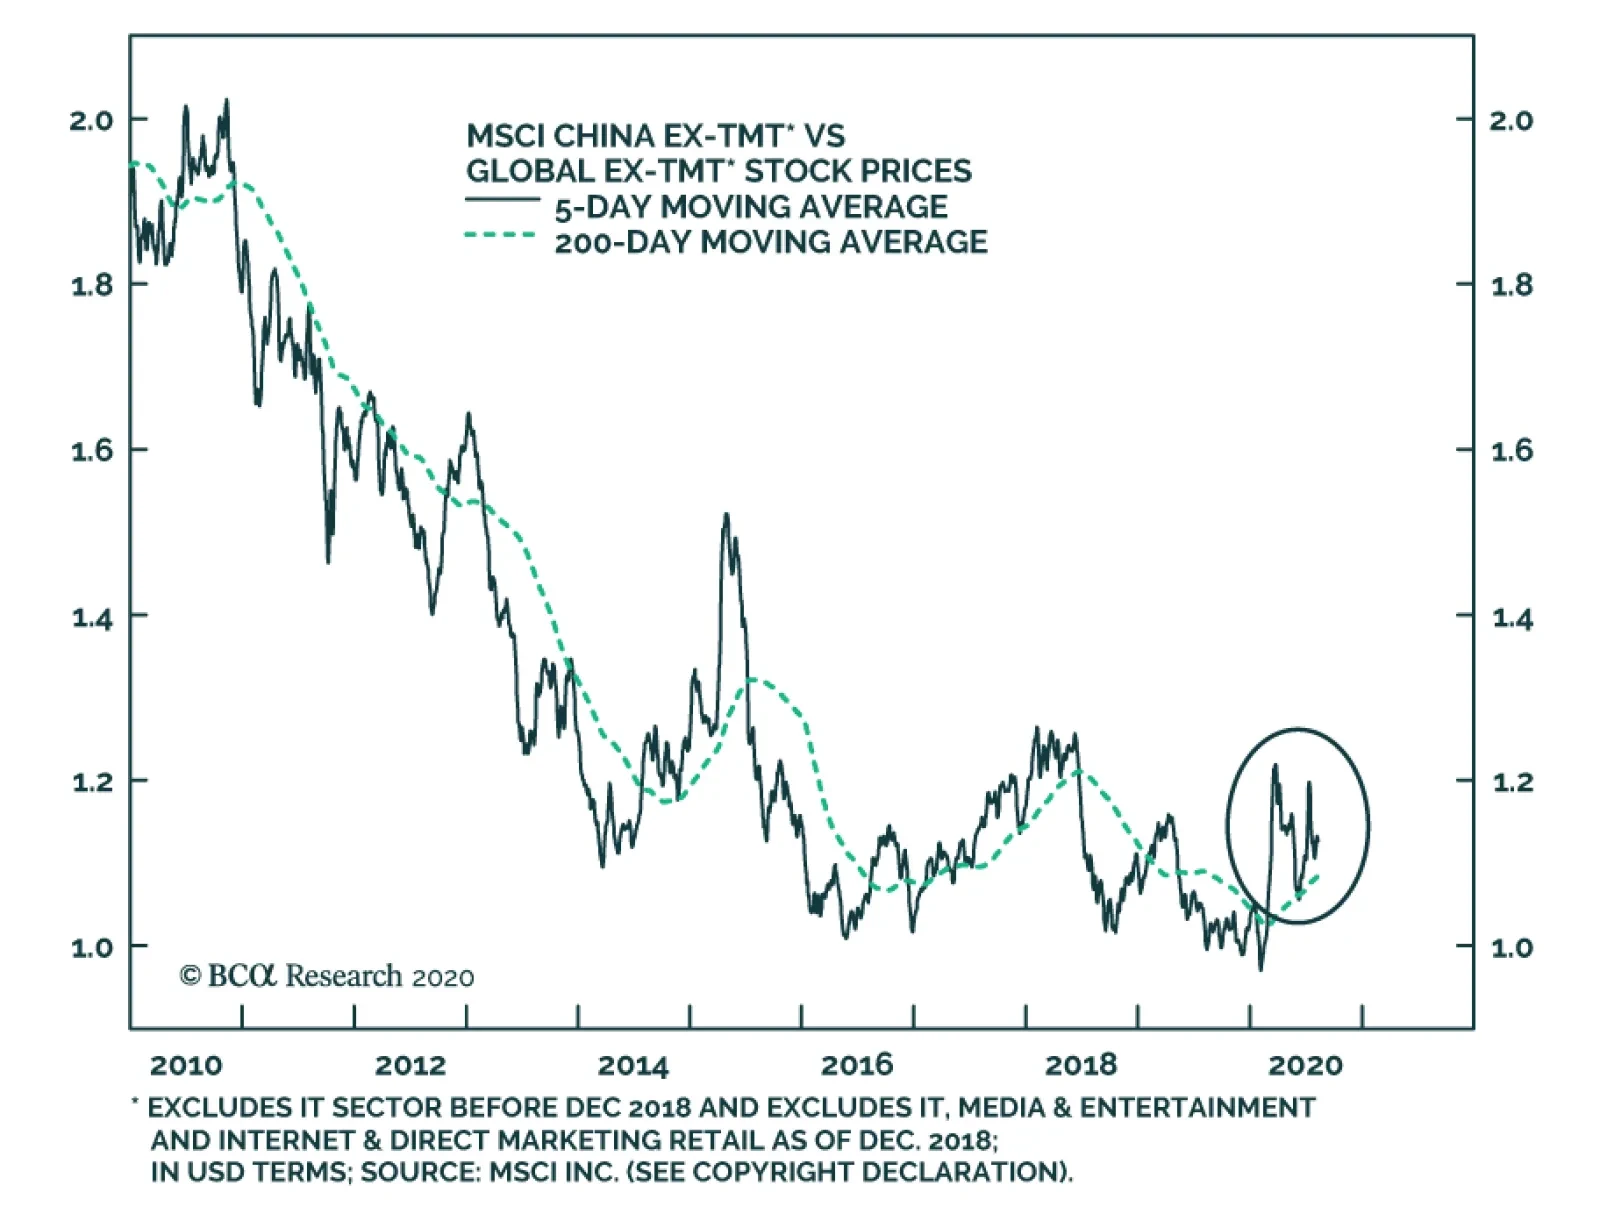
BCA Research's China Investment Strategy service is sticking to its strategic and cyclical overweight view on Chinese equities despite President Trump's opening a new front in the Sino-US tech war by banning China-based apps like TikTok. The impact on both…