AI
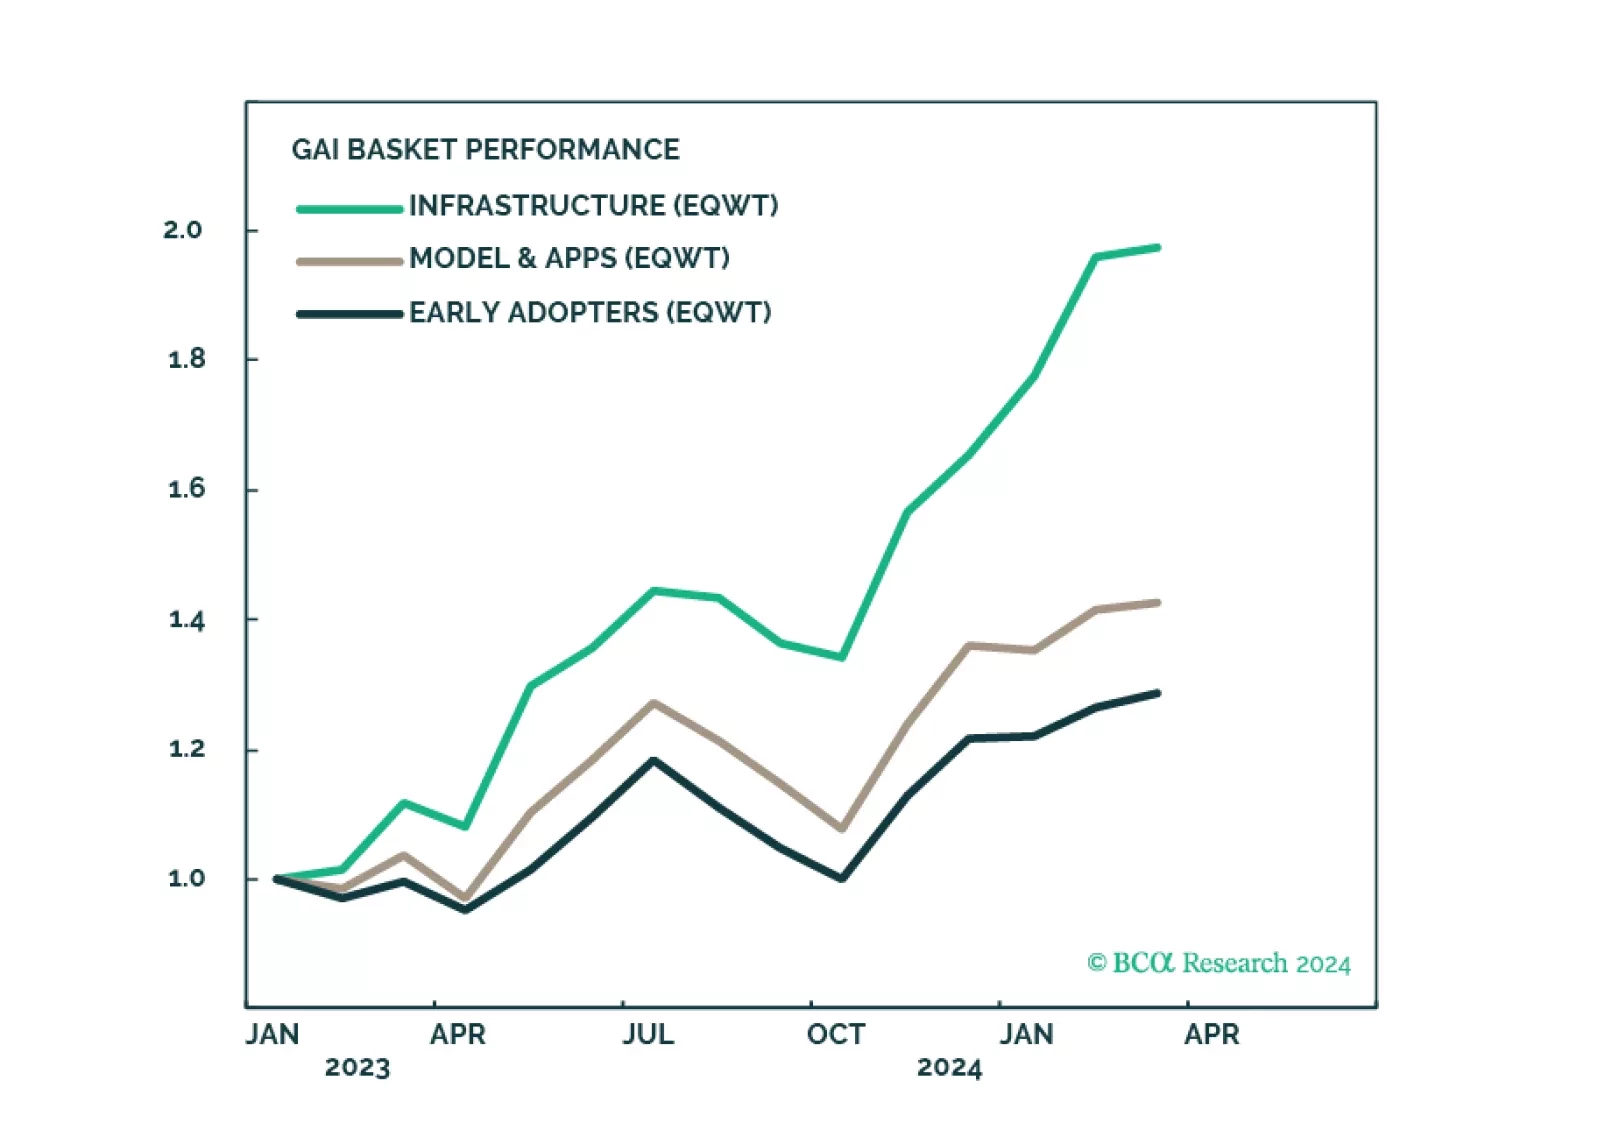
GAI is a powerful force that will revolutionize the global economy and we are sold on this long-term investment theme. To partake in the upward momentum, we recommend a nuanced approach. The GAI infrastructure cohort is now overbought - there should be a better entry point. The models and applications companies and early adopters are less of a crowded trade and offer more opportunities.
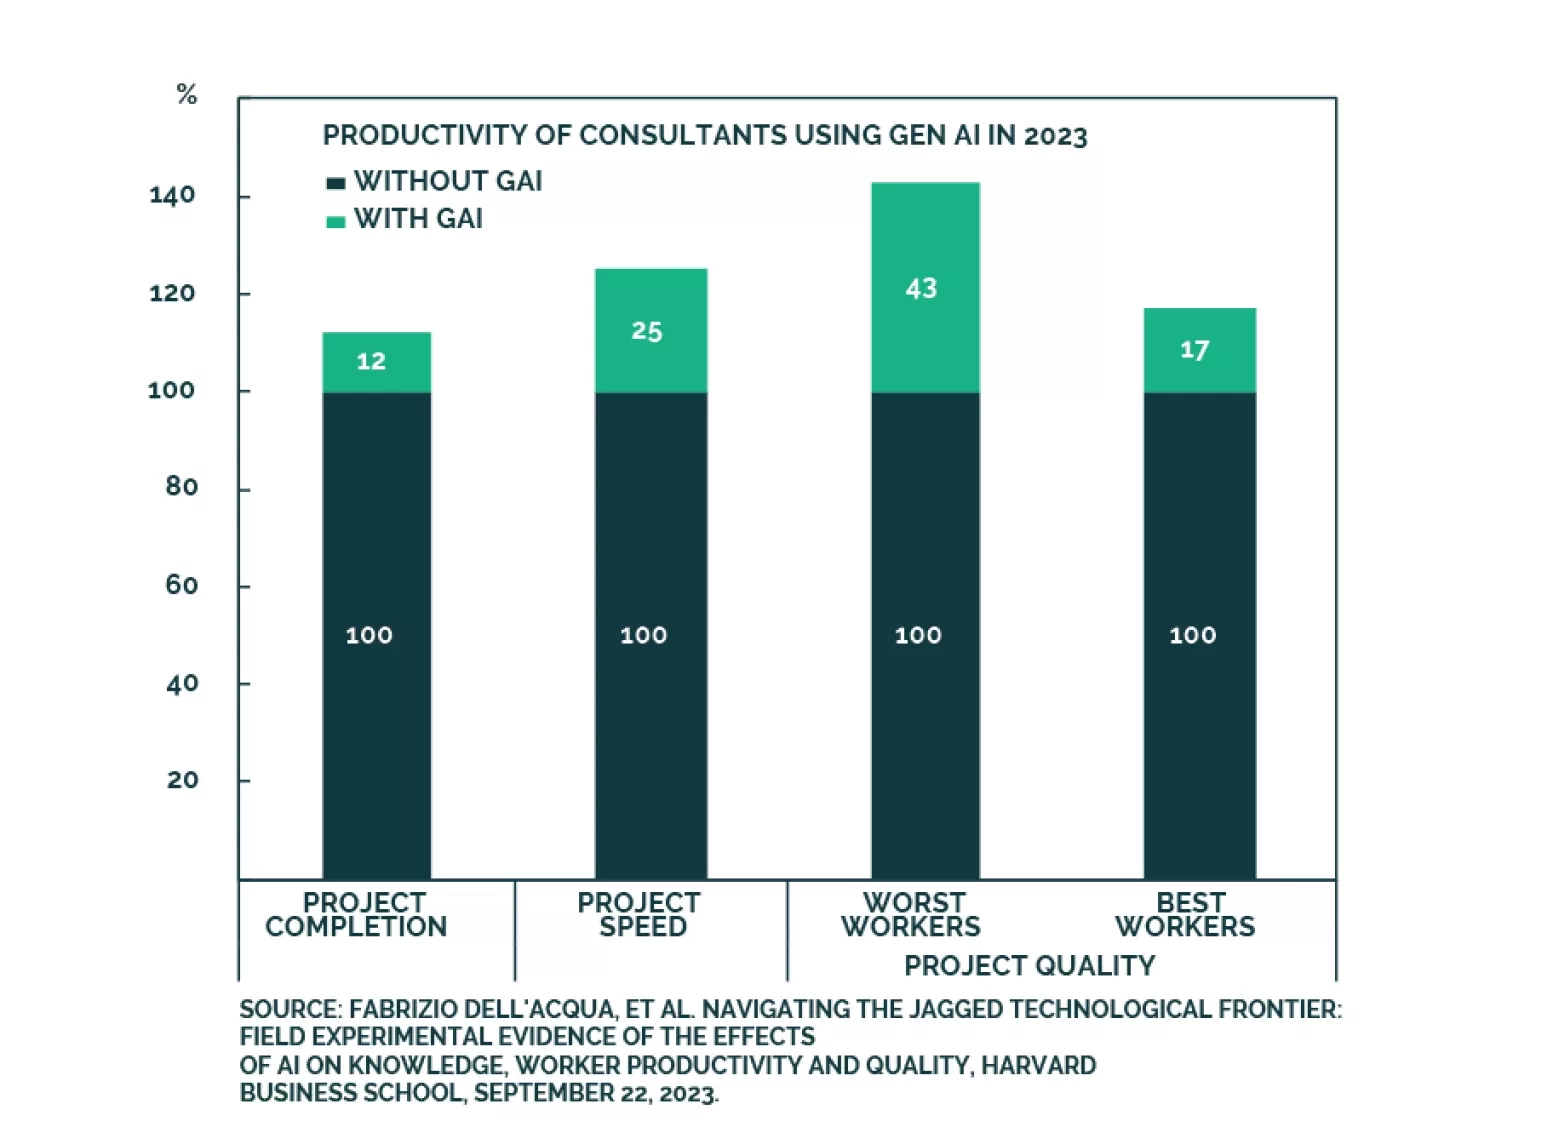
GAI technology has made tremendous gains over the past year. It has advanced from being a mere “curiosity” to becoming an everyday helper. While the promise of GAI is enormous, its effects are still limited: Companies are still struggling with monetization while productivity improvement is still at least a year away. In terms of evolution, the focus is shifting away from “picks and shovels” infrastructure companies toward model and application developers.
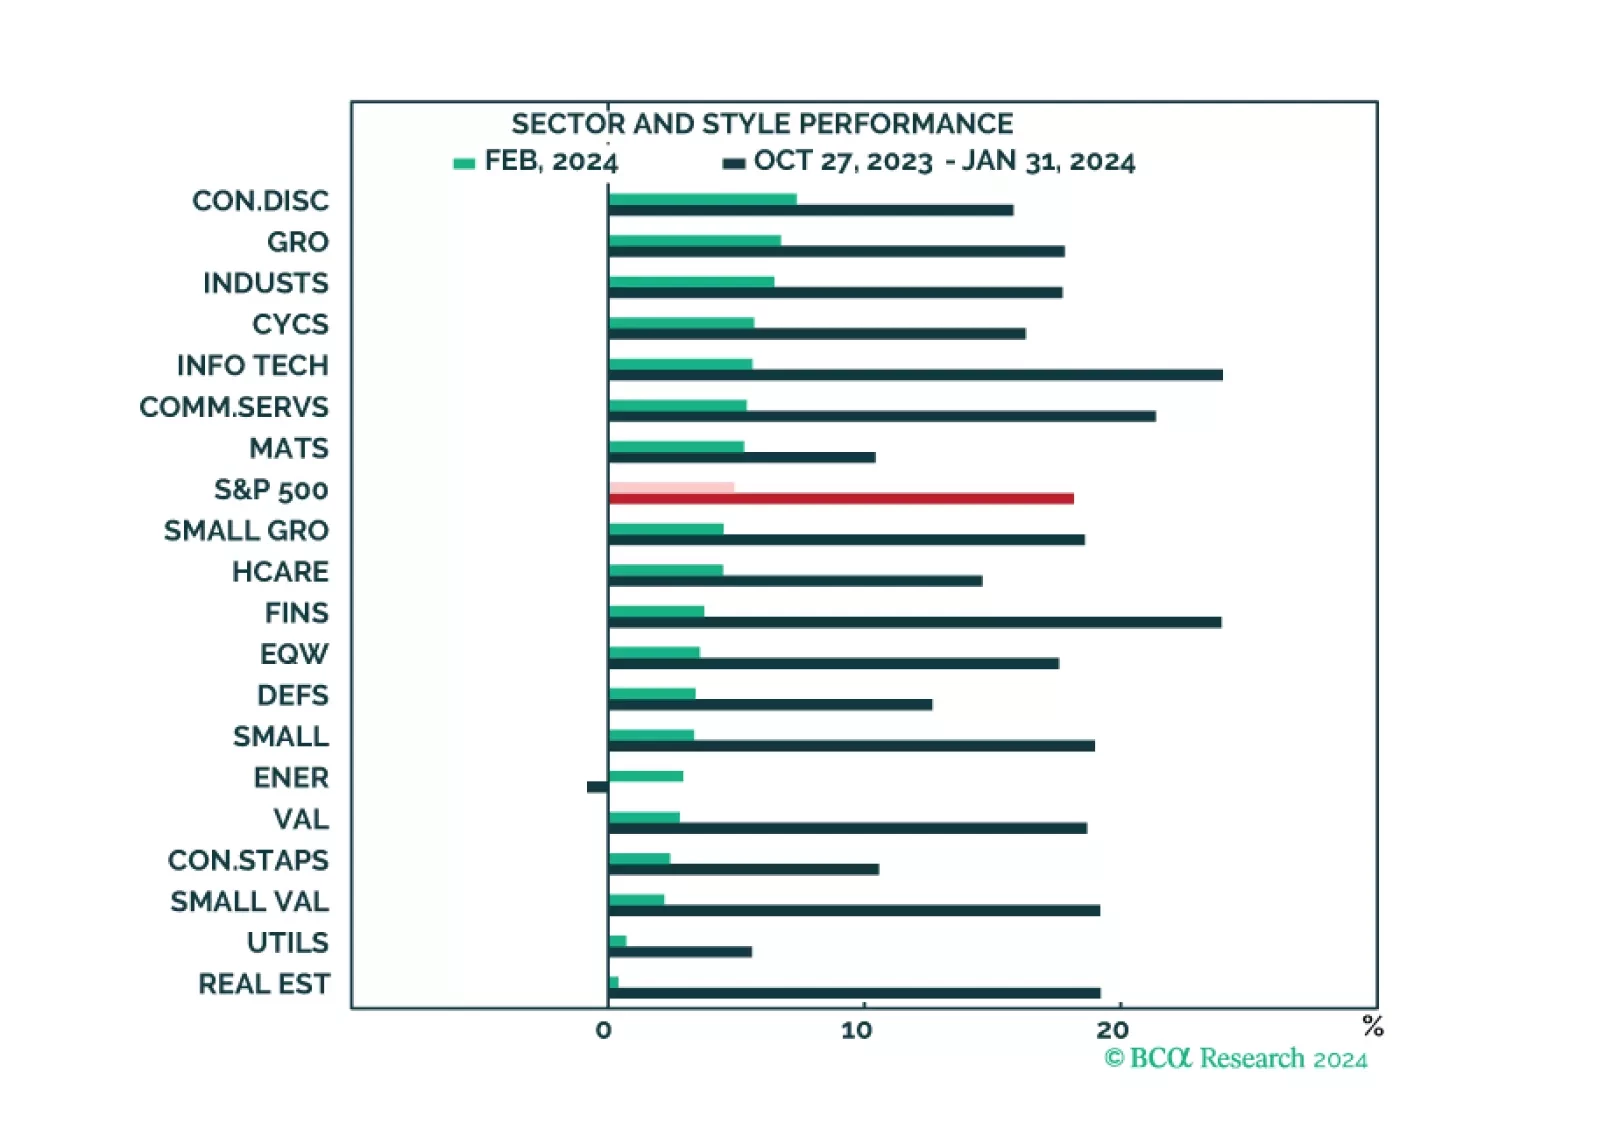
The market narrative continues to be dominated by the Magnificent Six, which drove both market performance and strong Q4 earnings results. While all sectors and styles have recently turned green, the rally is still mostly narrow. Earnings growth appears to be strong, but outside of the Magnificent Six, many companies are struggling. The market appears expensive and overbought, but that is mostly down to the high valuations and the popularity of the Magnificent Six.
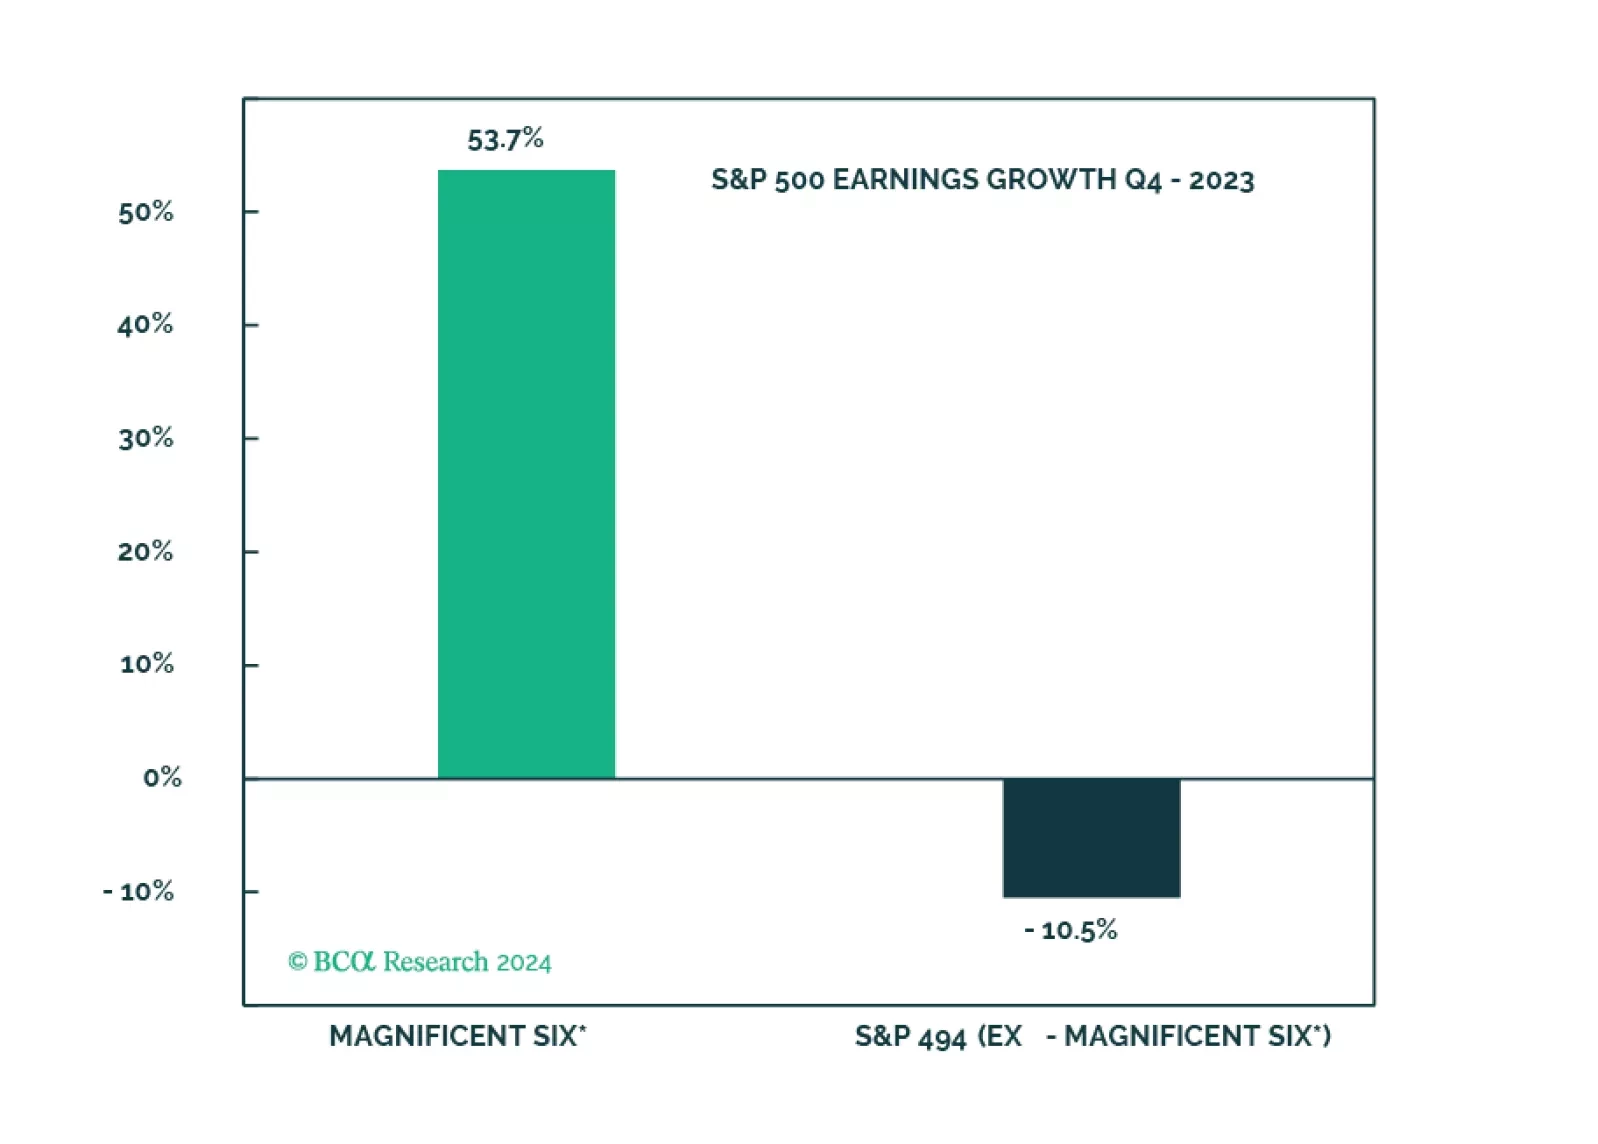
The soft landing and rate cuts narrative is being priced out, and the S&P 500 is overvalued and getting overbought. The Magnificent Seven are about to get a new moniker on the back of performance dispersion. However, without the cohort, S&P 500 earnings would have been even deeper in the red.
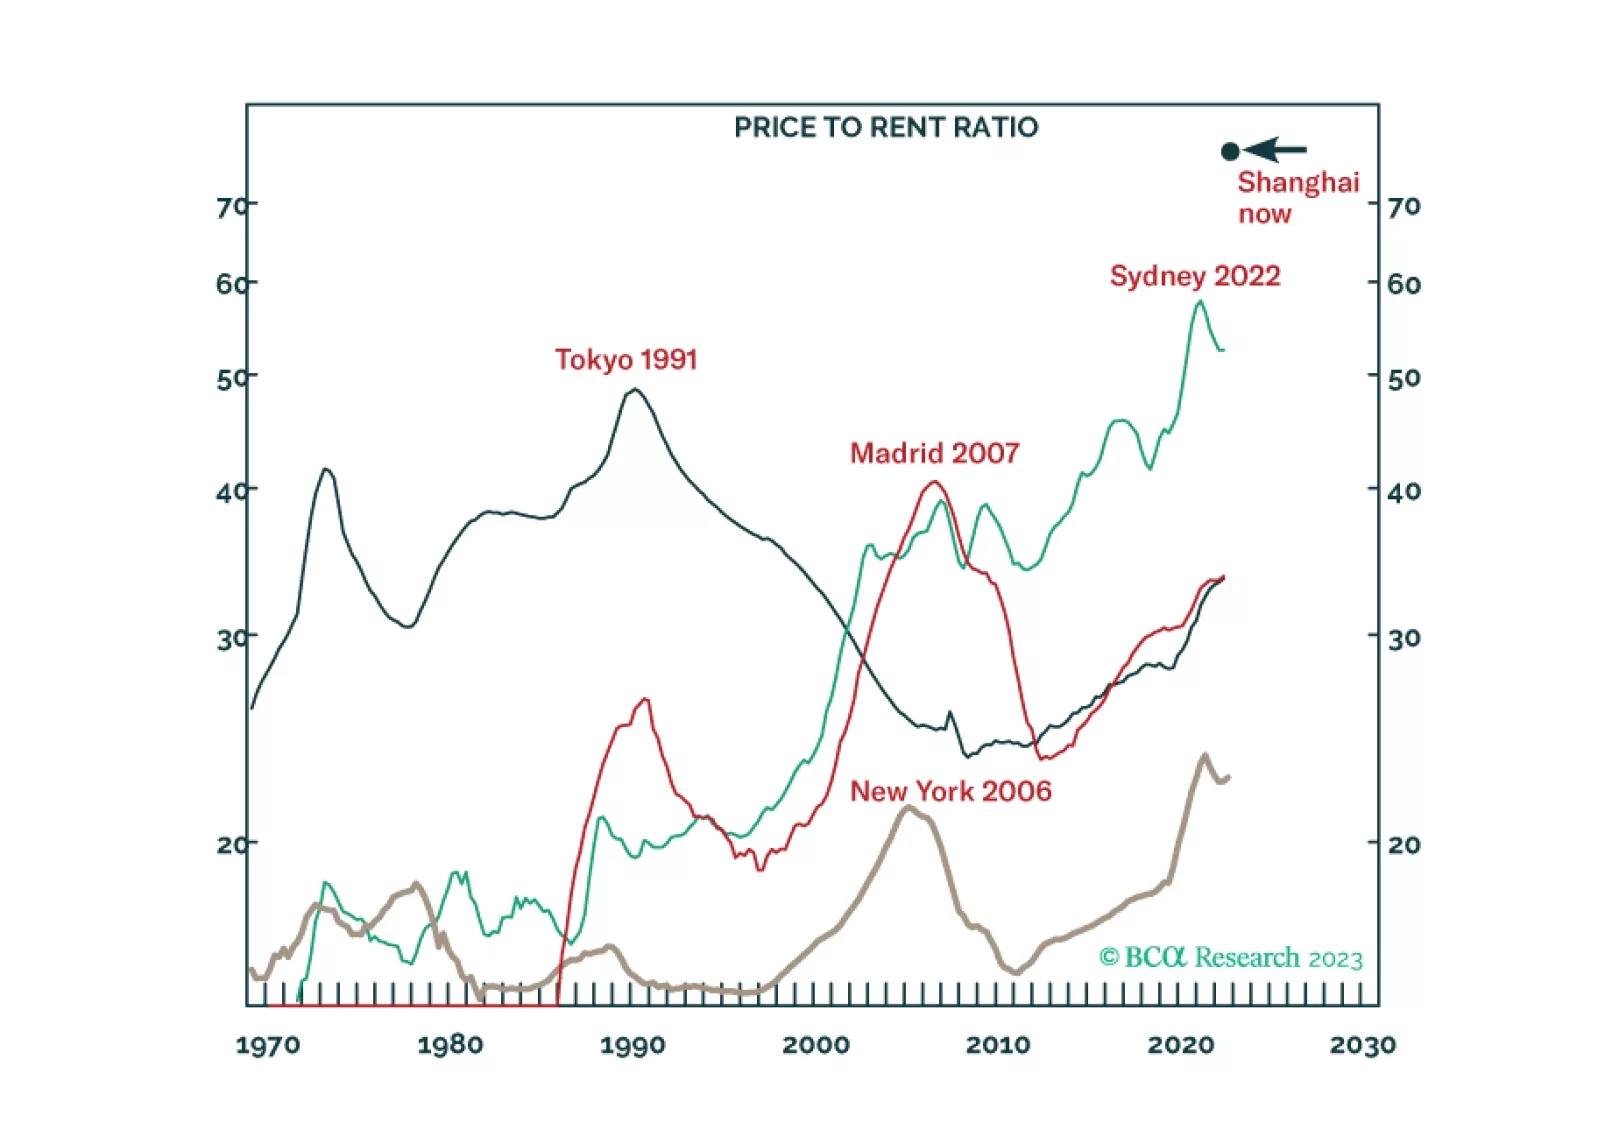
Our 2024 outlook can be encapsulated into just 39 words and three key views. Key view 1: The end of China’s housing boom means the end of the world’s main growth engine. Key view 2: If the Fed and ECB don’t kill the economy, they won’t kill inflation. Key view 3: The AI gold rush will struggle to find any gold. We go through the investment implications for the year ahead.
Global Investment Strategy predicted the surge of inflation in 2021/22 and the immaculate disinflation of 2023. Now their unique framework is predicting a recession in the second half of 2024.
Today, we are sending you the BCA annual outlook for 2024. The report is an edited transcript of our recent conversation with Mr. X and his daughter, Ms. X, who are long-time BCA clients with whom we discuss the economic and financial market outlook for the next twelve months toward the end of each year.
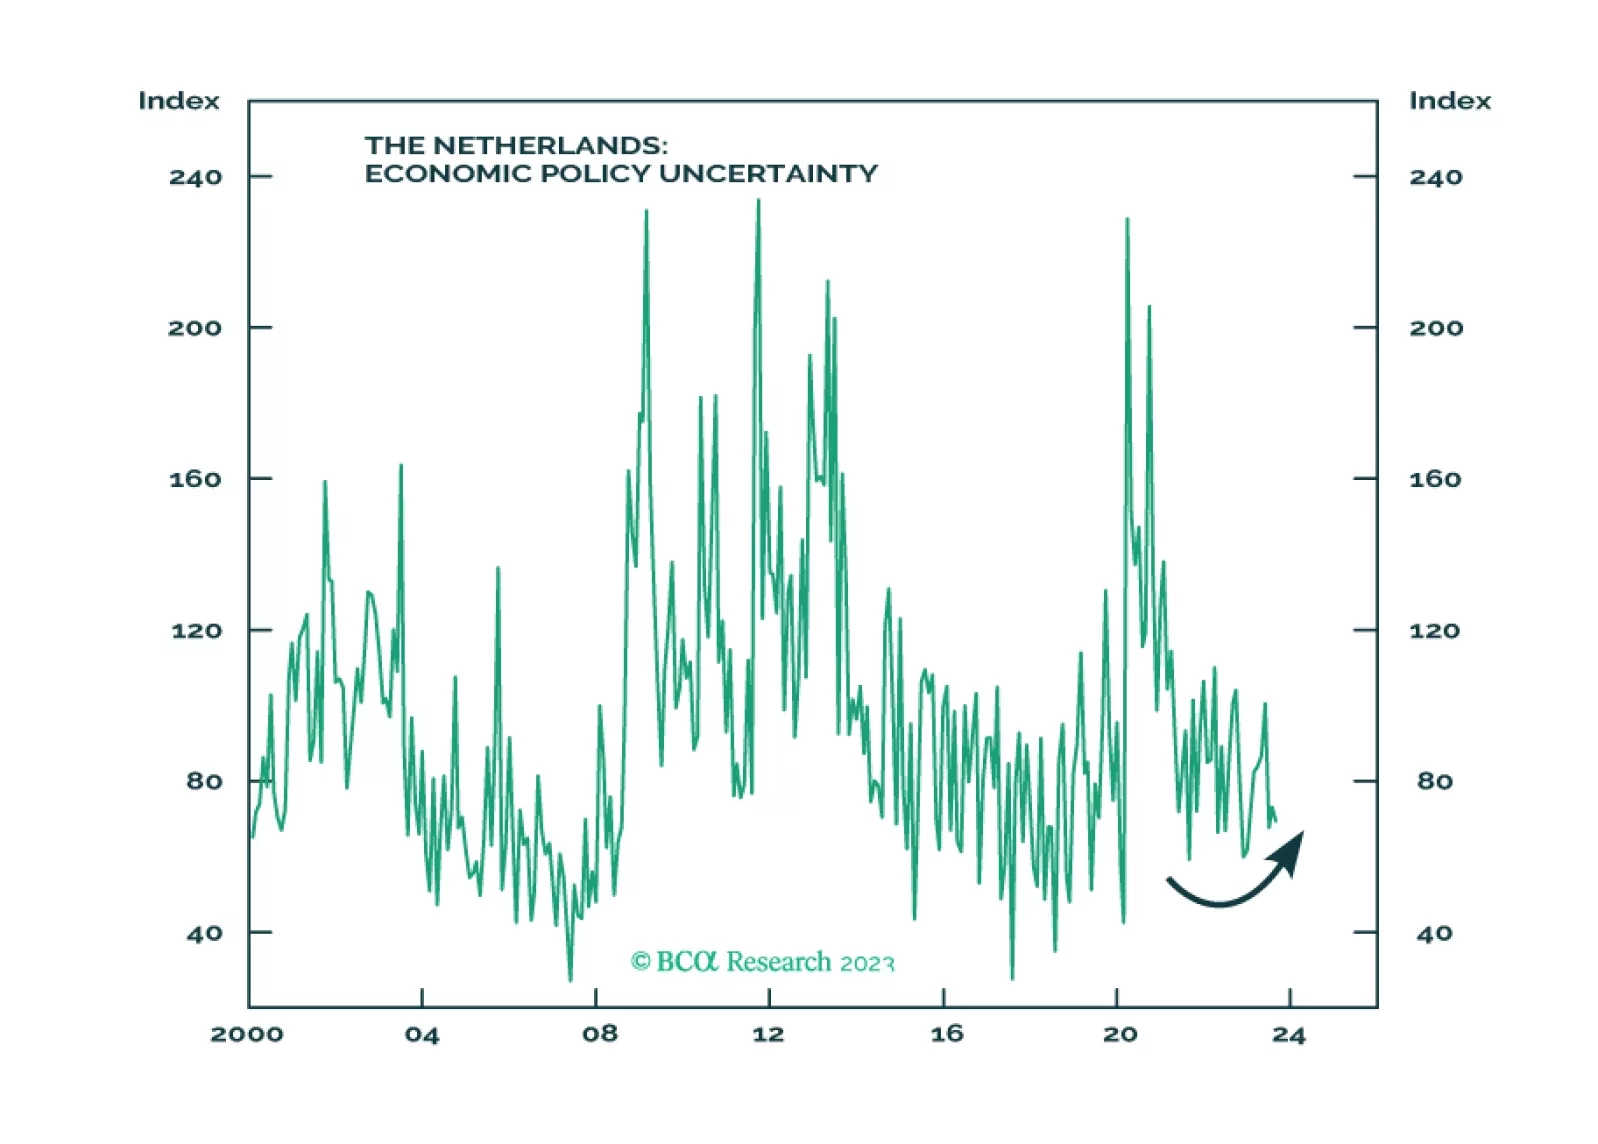
The Netherlands has a healthier and more stable economy and demography than its European peers. Investors should stay overweight developed European equities, including Dutch equities, relative to emerging European equities.

This Special Report is a timely reprise of a speech that I gave at the London School of Economics on our understanding and misunderstanding of generative AI. In neurological terms, generative AI has a ‘super-neocortex’ which means that it can thrash humans in abstract thinking, or IQ. But crucially, generative AI does not have a ‘limbic system’ which means that it will lag well behind humans in emotional intelligence, or EQ. I hope you find the speech insightful and provocative, especially on how we might have completely misunderstood human intelligence and super-intelligence, and the economic and societal implications for the coming decade.
Outperformance of Growth sectors most likely has run its course. It is time to shift Growth vs. Value allocation to neutral, downgrade Semis, and upgrade Energy to overweight.