Sorry, you need to enable JavaScript to visit this website.
Skip to main content

Coal

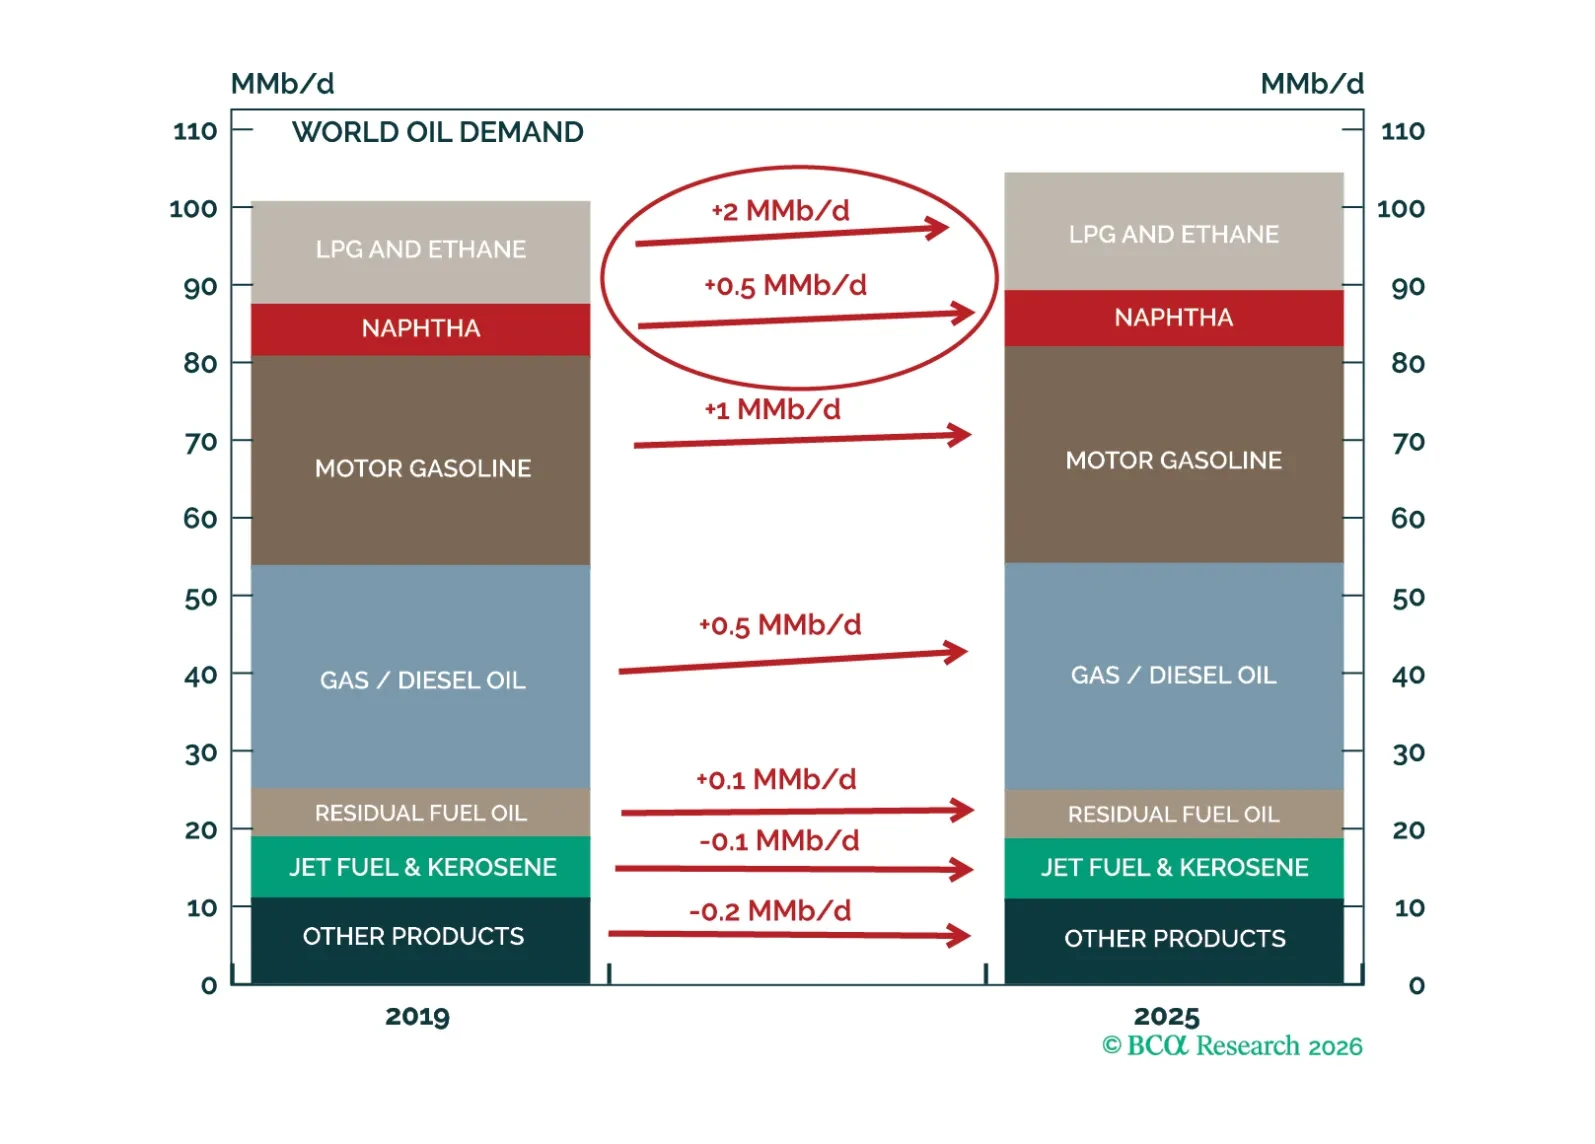
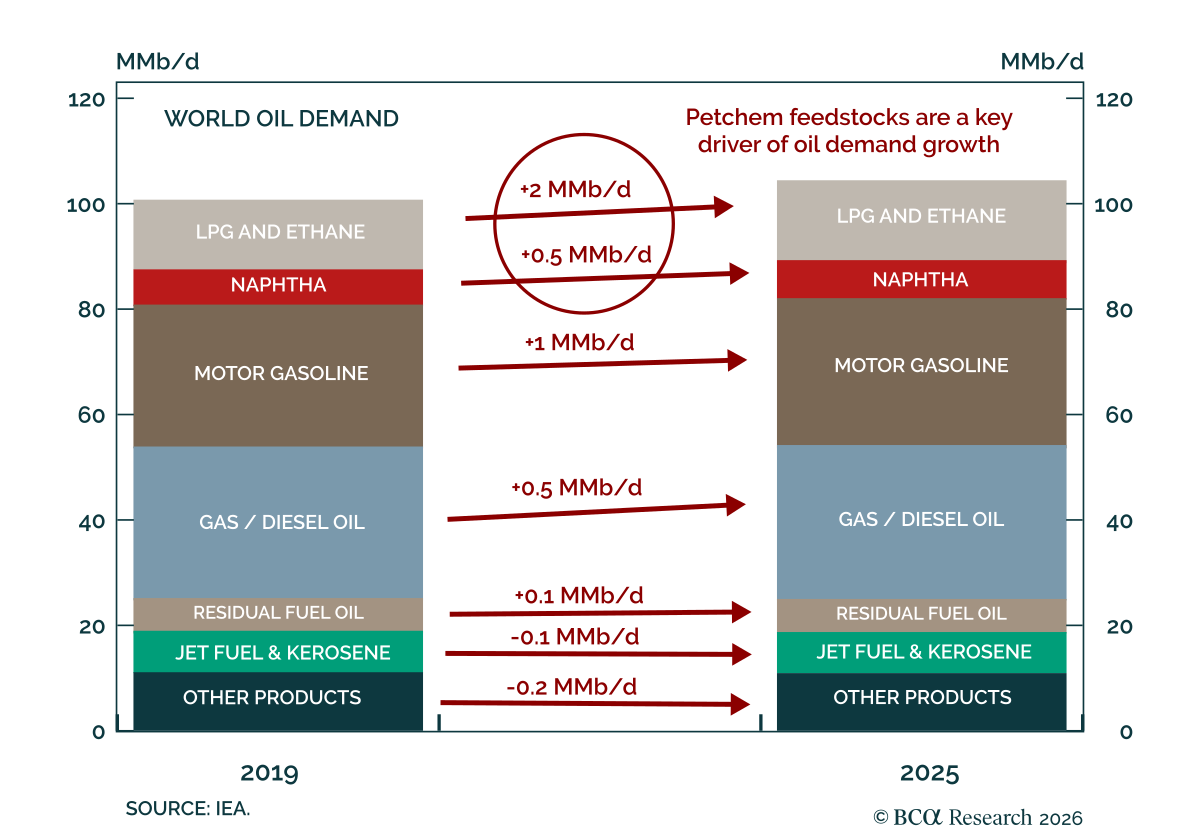
Our Commodity strategists see China's pivot to coal-derived petrochemical feedstock as a long-term tailwind for Chinese coal prices, and a structural headwind for global oil demand growth. Petrochemicals account for most of the net increase in oil demand in…
Special Report

The Hormuz crisis has exposed a structural vulnerability in China's petrochemical value chain. Going forward, Beijing will look to build greater supply security by scaling up coal-to-olefins capacity — a shift that creates a structural tailwind for coal prices and a structural headwind for oil.

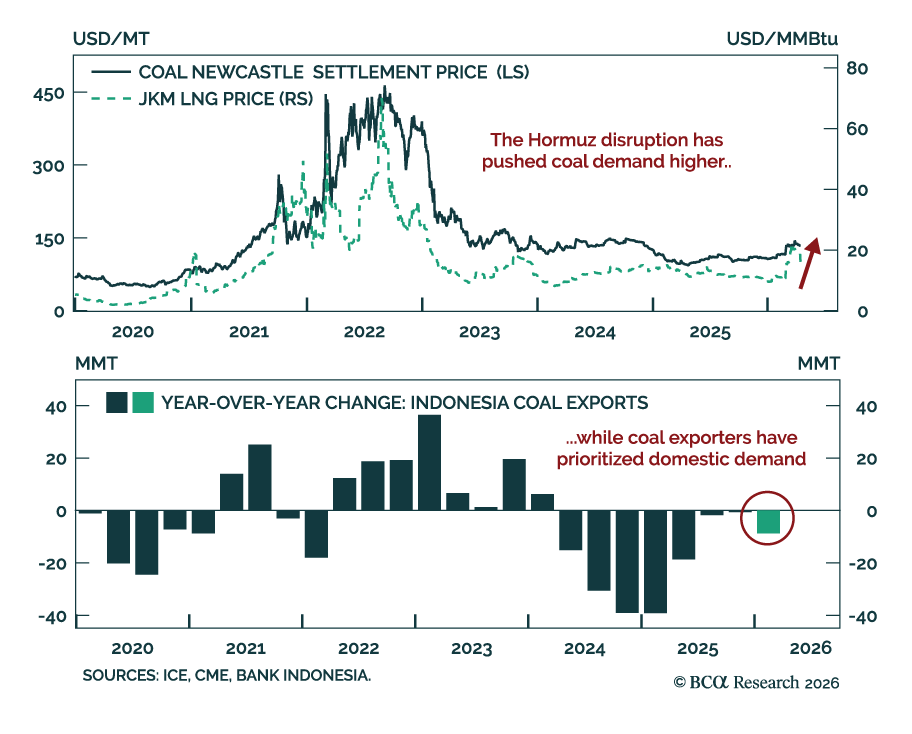
The Strait of Hormuz disruption forced a substitution away from LNG and toward coal across Asia. India has delayed the maintenance shutdown of 10,000 MW of coal-fired capacity to July and will lean more on its coal capacity for peak summer demand; South Korea…
European regulatory carbon credits (EUAs) are becoming increasingly investable as an asset class. In a Special Report published last September, our Global Investment strategists agreed to the strategic bull case for EUAs, but highlighted a bearish view on…
According to BCA Research's Commodity & Energy Strategy service, Qatar will be the winner as it takes advantage of the global energy transition towards renewables and the world fragments under economic and military competition. Qatar recently…
Special Report

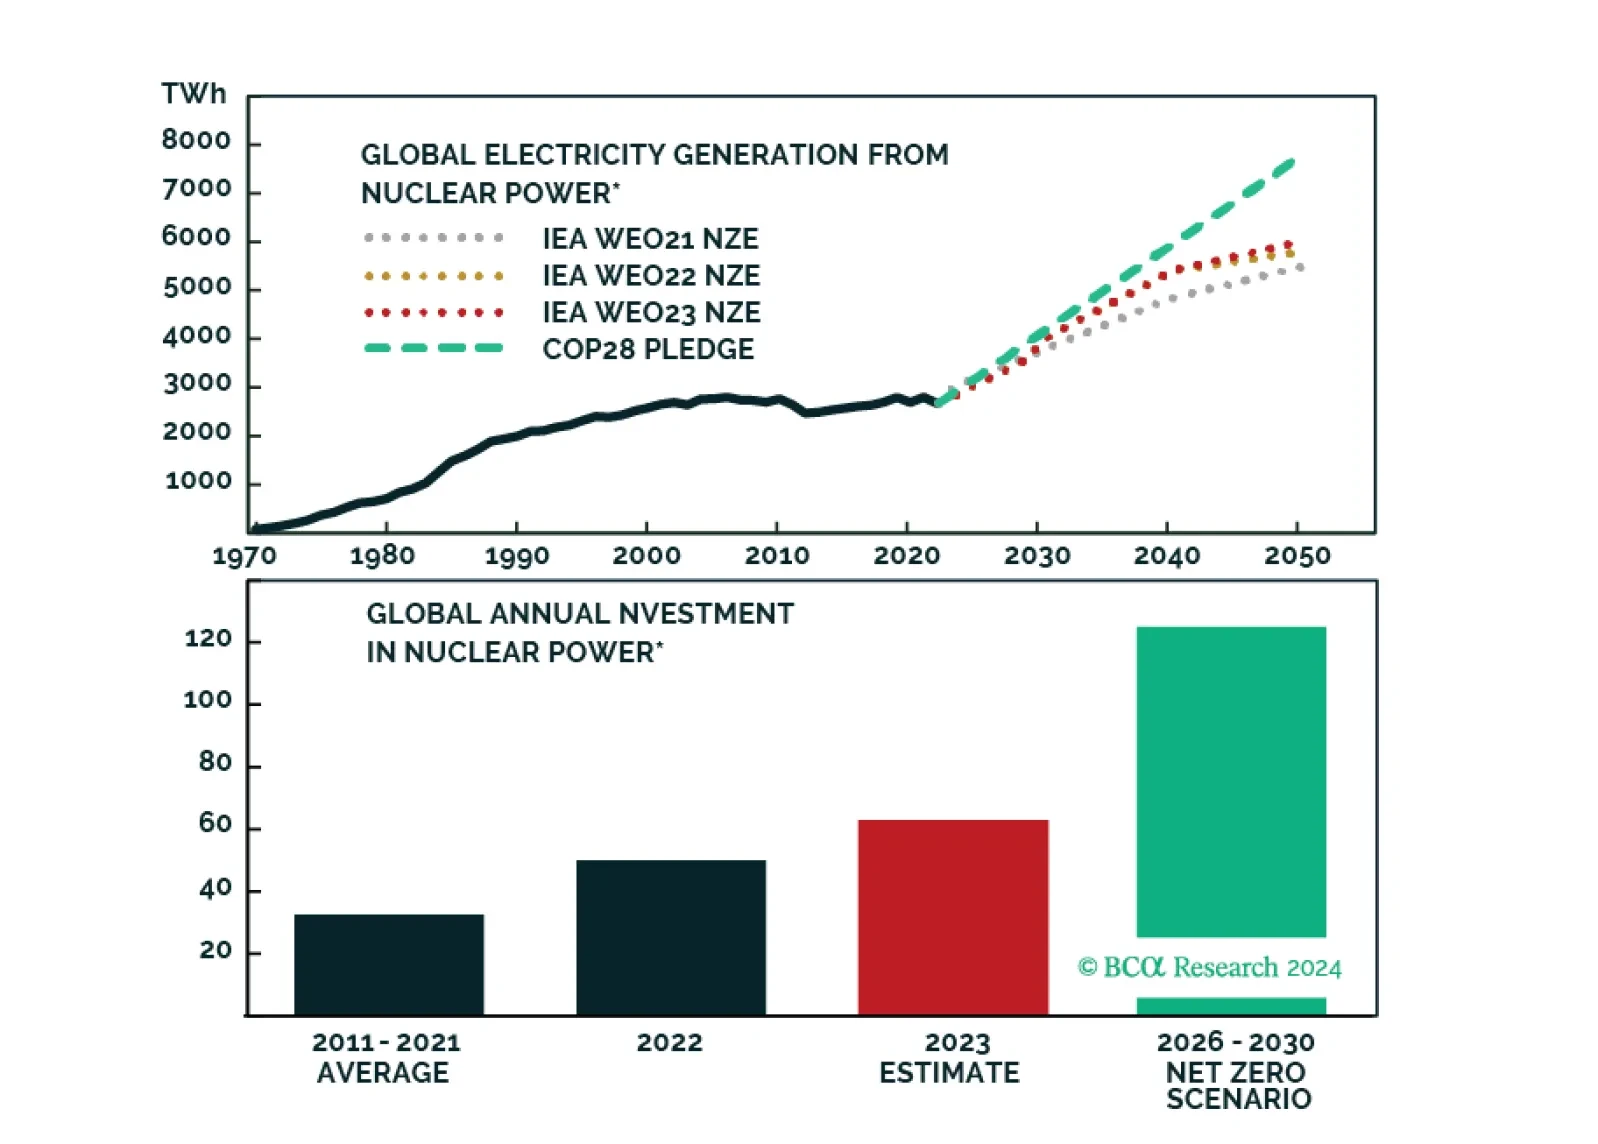
BCA Research presents a limited monthly special series about the Nuclear Renaissance.

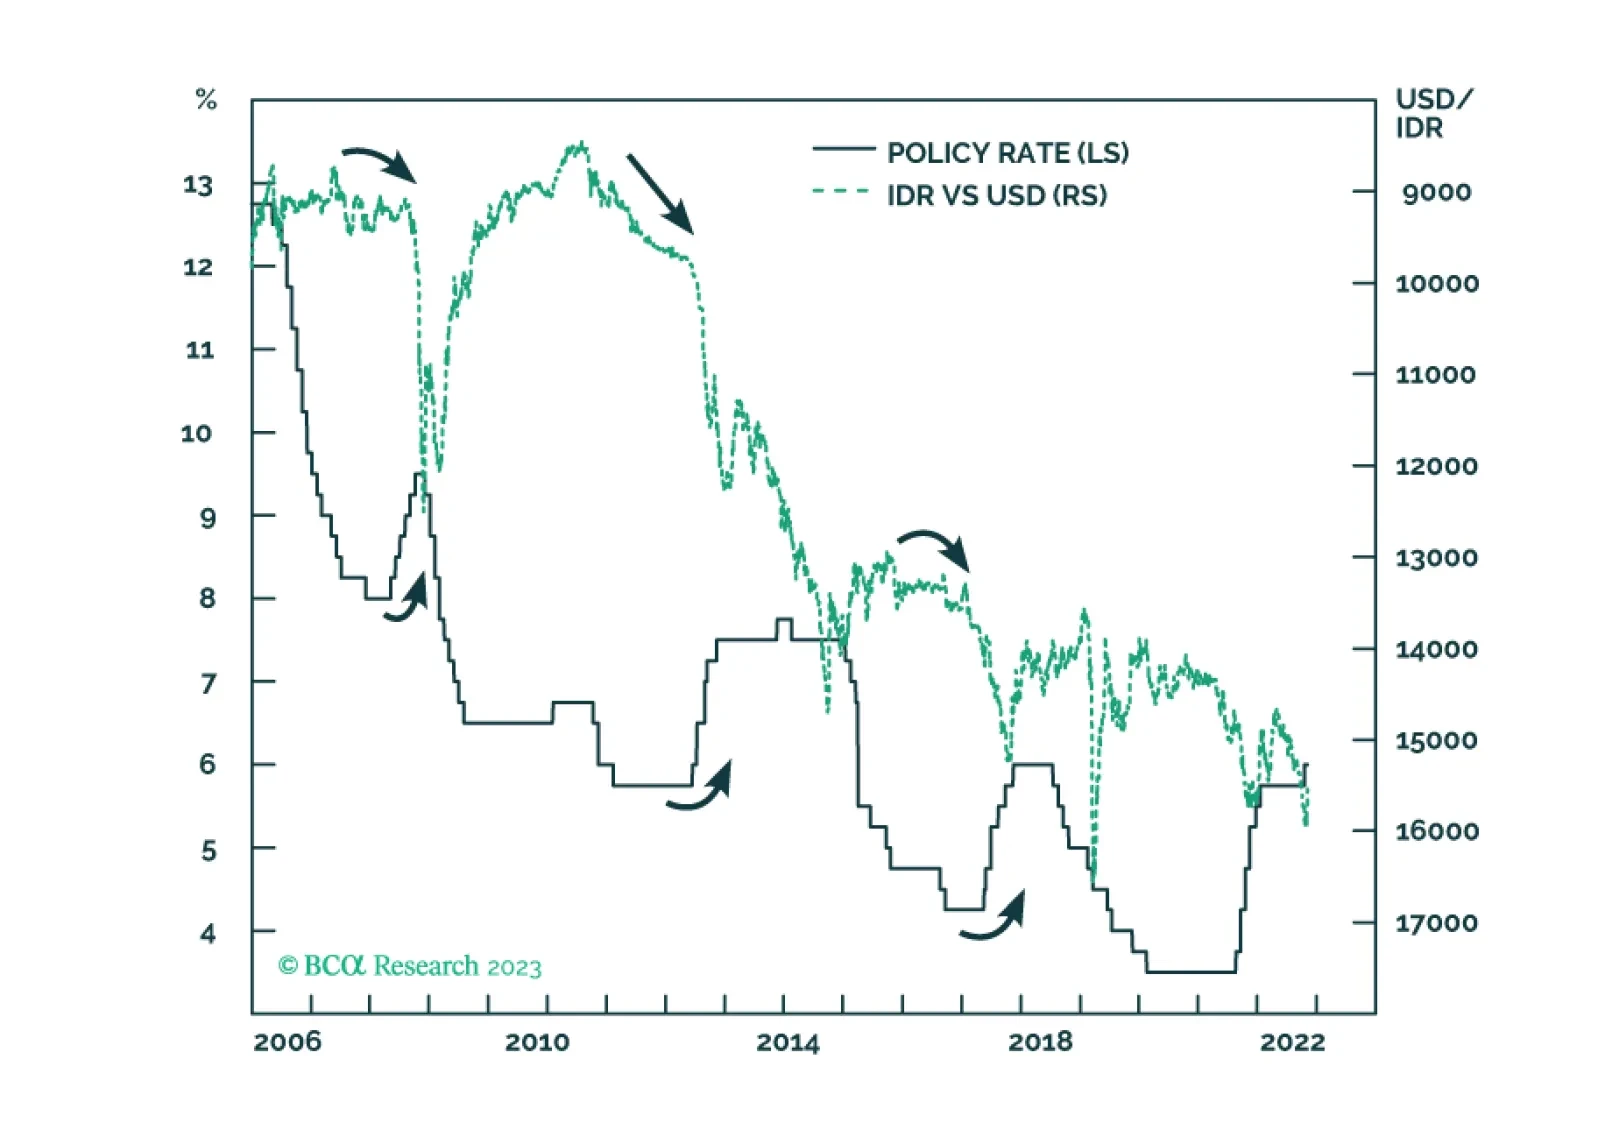
Despite very low inflation, Bank Indonesia raised its policy rates last month to support the currency. The strategy did not work before and will not work now. Stay short the rupiah.

Special Report

There has been an unprecedented divergence between global and Chinese thermal coal ("coal") prices since the Russia-Ukraine war commenced in February 2022. Such a wide price gap is unsustainable. This price convergence will continue, with international prices falling faster than Chinese ones.

Listen to a short summary of this report.     Executive Summary Euro Bulls Are Evaporating The euro is likely to undershoot in the near term, as the winter months approach and economic volatility in Europe rises. However, much of the euro’s troubles are well understood and discounted by financial markets. This suggests a floor closer to parity for the EUR/USD. Unlike many other developed economies, the fiscal drag in the eurozone is likely to be minimal for the rest of this year and early next year. The forces pressuring equilibrium rates lower in the periphery are slowly dissipating. That should lift the neutral rate of interest in the entire eurozone. China’s zero Covid-19 policy along with property market troubles has weighed heavily on the euro, but that could change. RECOMMENDATIONS INCEPTION LEVEL inception date RETURN Long EUR/GBP 0.846 2021-10-15 -0.13 Short EUR/JPY 141.20 2022-07-07 2.46 Bottom Line: The euro tends to be largely driven by pro-cyclical flows, which will be a positive when risk sentiment picks up. Meanwhile, making a structural case for the euro is easy when it comes to valuation. According to our in-house PPP models, an investor who buys the euro today can expect to make 6% a year over the next decade, should the euro mean revert to fair value and beyond. Our current stance is more measured because investors could see capitulation selling in the coming months. Feature Chart 1Two Decades After The Creation Of The Euro The creation of the euro was an ambitious project. It began with a simple idea – let’s create the biggest monetary union and everything else will follow, not least, economic might. Over the last two decades, the euro has survived, but its ambitions have been jolted by various crises. Today, the euro is sitting around where it was at the initiation of the project (Chart 1). That has been a tremendous loss in real purchasing power for many of its citizens. Given that we are back to square one, this report examines the prospects for the euro from the lens of its original ambitions, while navigating the economic and geopolitical landscape today. Surviving The Winter Chart 2A European Recession Is Well Priced In Winter will be tough for eurozone citizens. But how tough? In our view, less than what the euro is pricing in. According to the ZEW sentiment index, the eurozone manufacturing PMI should be around 45 today, but sits at 49.8. The euro, which has been tracking the ZEW index tick-for-tick has already priced in a deep recession, worse than the 2020 episode (Chart 2). Bloomberg GDP growth consensus forecasts for the eurozone are still penciling in 2.8% growth for 2022, down from a high of 4%. For 2023, forecasts have hit a low of 0.8%. It is certainly possible that euro area growth undershoots this level, which will cause a knee jerk sell off in the euro. However, much of the euro’s troubles are well understood and discounted by financial markets. Natural gas storage is already close to 80%, the EU’s target, to help the eurozone navigate the winter. Coal plants are firing on all cylinders, and Germany has decided to delay the closure of its nuclear power plants. It is true that electricity prices are soaring, but part of the story has been weather-related, notably a heat wave across Europe, falling water levels along the Rhine that has delayed coal shipments, and lower wind speeds that have affected renewable energy generation. France is also having problems with nuclear power generation, due to little availability of water for cooling reactors. Looking ahead, energy markets are already discounting a steep fall in prices from the winter energy cliff (Chart 3). If that turns out to be true, it will be a welcome fillip for eurozone growth. First, it will ease the need for the ECB to tighten policy aggressively, and second, it will boost real incomes, which will support spending. This is not being discussed in financial markets today. Chart 3AFutures Markets Suggest The Energy Crunch Will Ebb Chart 3CFutures Markets Suggest The Energy Crunch Will Ebb Chart 3BFutures Markets Suggest The Energy Crunch Will Ebb Fiscal Policy To The Rescue? Unlike many other developed economies, the fiscal drag in the eurozone is likely to be minimal for the rest of this year and early next year (Chart 4). As funds from the next generation EU plan are being disbursed into strategic sectors, including renewable energy, Europe’s productive capital base will also improve. This is likely to have a huge multiplier effect on European growth. Chart 4AThe Fiscal Drag In The Eurozone Could Be Minimal Chart 4BThe Fiscal Drag In The Eurozone Could Be Minimal Taking a bigger-picture view, what has become evident in recent years is stronger solidarity among eurozone countries, both economically and politically. Related Report  Foreign Exchange StrategyMonth In Review: Inflation Is Still Accelerating Globally Economically, the standard dilemma for the eurozone was that interest rates were too low for the most productive nation, Germany, but too expensive for others, such as Spain and Italy. As such, the euro was often caught in a tug of war between a rising equilibrium rate of interest for Germany, but a very low neutral rate for the peripheral countries. The good news is that for the eurozone, a lot of this internal rupture has been partly resolved. Labor market reforms have seen unit labor costs in Greece, Ireland, Portugal and Spain collectively contract since 2008. This has effectively eliminated the competitiveness gap with Germany, accumulated over the last two decades (Chart 5). Italy remains saddled with a rigid and less productive workforce, but the overall adjustments have still come a long way to close a key fissure plaguing the common currency area. The result has been a collapse in peripheral borrowing spreads, relative to Germany (Chart 6). Ergo, interest payments as a share of GDP are now manageable. It is true that Italy remains a basket case but the ECB’s Transmission Protection Instrument (TPI) will ensure that peripheral spreads remain well contained and a liquidity crisis (in Italy) does not morph into a solvency one. Chart 5The Periphery Is Now Competitive Chart 6Peripheral Spreads Are Still Contained In Real Terms Beyond the adjustment in competitiveness, productivity among eurozone countries might also converge. Our European Investment Strategy colleagues suggest that the neutral rate is still wide between Germany and the periphery. That said, gross fixed capital formation in the periphery has been surging relative to core eurozone members (Chart 7). If this capital is deployed in the right sectors, it will have two profound impacts. First, the neutral rate of interest in the eurozone will be lifted from artificially low levels. The proverbial saying is that a chain is only as strong as its weakest link. This means that if the forces pressuring equilibrium rates lower in the periphery are slowly dissipating, that should lift the neutral rate of interest in the entire eurozone. Over a cyclical horizon, this should be unequivocally bullish for the euro. Second, and more importantly, economic solidarity among eurozone members will help ensure the survival of the euro, over the next decade and beyond. Chart 7The Periphery Could Become More Productive Trading The Euro The above analysis suggests long-term investors should be buying the euro today. However, the long run can be a very long time to be offside. Our trading strategy is as follows: Over the next 6 months, stay neutral to short the euro. The economic landscape for the eurozone remains fraught with risk. This is a typical recipe for a currency to undershoot. Eurozone banks are very sensitive to economic conditions in the eurozone, and ultimately the performance of the euro, and the signal from bank shares remains negative (Chart 8). Chart 8European Banks Are Not Part Of The Agenda Watch Eurozone Banks Investors have been cutting their forecasts for the euro but have not yet capitulated. Bets are that the euro will be at 1.10 by the end of next year, and 14% higher in two years. A bottom will be established when investors cut their forecasts below current spot prices (Chart 9). This corroborates with data from net speculative positions that have yet to hit rock bottom.  Chart 9Euro Bulls Are Evaporating Real interest rates in the euro area are still plunging across the curve, relative to the US. The two-year real yield has hit a cyclical low. Five-year, 10-year and 30-year real yields are also falling. Historically, the euro tends to trend higher when interest rate differentials are moving in favor of the eurozone (Chart 10). Chart 10AReal Rates Are Dropping In The Euro Area Chart 10BReal Rates Are Dropping In The Euro Area Hedging costs have risen tremendously, as the forward market (like investors) is already pricing in an appreciation in the euro. The embedded two-year return for EUR investors is circa 4%, in line with the carry costs (Chart 11). In real terms, the returns are closer to 9% to compensate for much higher inflation expectations in the eurozone. Higher hedging costs will dissuade foreign investors from gobbling up European assets on a hedged basis. Chart 11A 5% Rally In The Euro Is Already Anticipated In short, the euro is likely to enter a capitulation phase. Our sense is that that it will push EUR/USD below parity, towards 0.98. Below that level, we believe the risk/reward profile will become much more attractive for both short- and longer-term investors. Signals From External Demand Chart 12The Euro Is Increasingly Dependant On Chinese Data The eurozone is a very open economy. Exports of goods and services represented 51% of euro area GDP in 2021. This means that what happens with external demand, especially in the US, the UK and China, matters for European growth (Chart 12). Of all its major export partners, China is the biggest question mark. China’s zero Covid-19 policy along with property market troubles has weighed heavily on the euro. Historically, the Chinese credit impulse has been a good coincident indicator for EUR/USD. Lately, that relationship has decoupled (Chart 13A). We favor the view that the credit transmission mechanism in China is merely delayed, rather than broken. For one, a rising Chinese credit impulse usually leads European exports, and this time should be no different. Chinese bond markets are also becoming more liberalized, and as such are a key signal for financial conditions in China. For over a decade, easing financial conditions have usually been a good signal that import demand is about to improve (Chart 13B). This is good news for European export demand. The bottom line is that investors are currently too pessimistic on Europe’s growth prospects at a time when a few green shoots are emerging for external demand. That may not save the euro in the near term but will be a welcome fillip for euro bulls when it does undershoot. Chart 13AThe Muse For The Euro Is Chinese Data Chart 13BThe Muse For The Euro Is Chinese Data Concluding Thoughts Chart 14The Goldilocks Case For The Euro The euro tends to be largely driven by pro-cyclical flows. Fortunately for investors, European equities remain unloved, given that they are trading at some of the cheapest cyclically adjusted price-to-earnings multiples in the developed world. Analysts are aggressively revising up their earnings estimates for eurozone equities, relative to the US. They might be wrong in the near term, but over a 9-to-12-month horizon, this has been a good leading indicator for the euro.  Making a structural case for the euro is easy when it comes to valuation. According to our in-house PPP models, an investor who buys the euro today can expect to make 6% a year over the next decade, should the euro mean revert to fair value and beyond (Chart 14). Meanwhile, beyond the winter months, inflation could come crashing back to earth in the eurozone, which will provide underlying support for the fair value of the currency. Our near-term stance is more measured because investors are only neutral the euro, and risk reversals are not yet at a nadir. This is particularly relevant given that Europe still has a war in its backyard, with the potential of generating more market volatility ahead. Given this confluence of factors, we have chosen to play euro via two channels: Long EUR/GBP: As we argued last week, the UK has a bigger stagflation problem compared to the eurozone. This trade is also a bet on improving economic fundamentals between the eurozone and the UK, as well as a bet on policy convergence between the two economies. Short EUR/JPY: The yen is even cheaper than the euro. In a risk-off environment, EUR/JPY will sell off. In a risk-on environment, the yen can still benefit since it is oversold. Meanwhile, investors remain bullish EUR/JPY. Long EUR/USD: We will go long the euro if it breaks below 0.98.   Chester Ntonifor Foreign Exchange Strategist chestern@bcaresearch.com Trades & Forecasts Strategic View Cyclical Holdings (6-18 months) Tactical Holdings (0-6 months) Limit Orders Forecast Summary
Executive Summary Europe Is Russia's Key Gas Customer Full-on rationing of natural gas by Germany took a step closer to reality, as the standoff with Russia over its insistence on being paid in roubles for gas plays out. News that Germany initiated its first step toward rationing spiked European and UK natgas prices by more than 12% on Wednesday. Higher prices for coal, oil and renewable energy will follow, as these energy sources compete at the margin with natgas in Europe. Inflation and inflation expectations will move higher if Germany ultimately rations scarce natgas supplies. We are watching to see who blinks first – Germany or Russia. The risk of aluminum-smelter shut-downs in Europe once again is elevated. Other metals-refining operations also are at risk of shutdown if rationing is invoked. Trade difficulties arising from Russia's invasion of Ukraine and related sanctions will lead to further bottlenecks on base-metal exports from Russia, as Rusal warned this week. This will further confound the energy transition. Western governments will be forced to accelerate investments and subsidies in carbon-capture technology as fossil-fuel usage and prospects revive. Bottom Line: Fast-changing EU natural gas supply-demand dynamics are impacting competing energy and base metals markets.  This is throwing up confusion around the global renewable-energy transition and extending its timetable.  Fossil fuels fortunes are being revived, as a result. We remain long commodity index exposure and the equities of oil-and-gas producers and base-metals miners.   Feature Events in the EU natural gas markets are changing rapidly in the wake of fast-changing developments in the Russia-Ukraine war.  In the wake of these changes, economic prospects for Europe and Russia are rapidly evolving – both potentially negatively over the short run. Full-on rationing of natural gas by Germany took a step closer to reality, as its standoff with Russia over payment for gas in roubles plays out.  News Germany is preparing its citizens for rationing spiked European and UK natgas prices by more than 12% Wednesday. It's not clear whether Russia or Germany are bluffing on this score.  Russia's oil and gas exports last year accounted for close to 40% of the government's budget. According to Russia's central bank, crude and product revenue last year amounted to just under $180 billion, while pipeline and LNG shipments of natgas generated close to $62 billion last year.  Europe is Russia's biggest natgas market, accounting for ~ 40% of its exports.  However, as the relative shares of revenues indicate, natgas exports are less important to Russia than crude and liquids exports.  Losing this revenue stream for a year would amount to losing ~ $25 billion of revenue, all else equal.  In the event, however, the net loss might be lower, since this would put a bid under the natgas market ex-Europe, which would offset part or most of the lost natgas sales to Europe.  If Russia is able to re-market those lost volumes, it could offset the loss of European sales. Knock-On Effects The immediate knock-on effect of this news turns out to be higher prices for oil, UK and European natgas.  This is not unexpected, as gasoil competes at the margin with natgas in space heating markets, while competition across regions also can be expected to increase.  Once again, the risk of aluminum-smelter shut-downs in Europe is elevated if rationing is imposed by Germany.  Other metals-refining operations also are at risk of shutdown if rationing is invoked.  Lastly, fertilizer production in Europe would be materially impacted, given some 70% of fertilizer costs are accounted for by natgas. In addition to these endogenous EU effects, trade difficulties arising from Russia's invasion of Ukraine and related sanctions will lead to further bottlenecks on base-metal exports from Russia, as Rusal warned this week.1 This will further confound the energy transition as the world's third-largest aluminum smelter faces sanctions – official and self-imposed – and the loss of inputs from Western suppliers, along with reduced access to capital and funding from the West. If, over time, Russia's base metals industries are degraded by the lack of access to capital and technology as oil and gas will be, the global renewable-energy transition will be slowed considerably.   We already expect Russia's oil and gas production to fall over time due to the economic isolation created by Russia's invasion of Ukraine, rendering it a diminished member of OPEC 2.0.  Russia accounts for ~ 10% of global crude oil supplies, and is the second largest producer of crude oil in the coalition.  A long-term degradation of its production profile will exacerbate the persistent imbalance between demand relative to supply globally, which continues to force oil inventories lower (Chart 1). On the metals side, Russia accounts for 6%, 5% and 4% of global primary aluminum, refined nickel and copper production.  Persistent supply deficits have left inventories in these markets – particularly nickel and copper – tight and getting tighter (Chart 2).2 Chart 1Oil Inventories Remain Tight... Chart 2… As Do Metals Inventories Europe's Radical Pivot In a little over a month's time, the EU has been forced to abandon once-immutable post-Cold War beliefs shared by the electorate and politicians of all stripes.  Ever-deepening commercial ties with Russia did not ensure EU energy security, nor did they obviate what arguably is any state's primary responsibility: Protecting and defending its citizens.  Because of its failed engagement policy with Russia over the post-Cold War interval, the EU is forced to scramble to restore its energy production and expand its sources of energy imports.  In addition, it is repeatedly asserting its intent to "double down" of the speed of its renewable-energy transition.  And, last but certainly not least, it is forced to rapidly rearm itself in industrial commodity markets that are in the midst of prolonged physical deficits and inventory drawdowns.3 The Russian invasion of Ukraine spurred the EU to action on both the energy and defense fronts.  It is rushing head-long into eliminating its dependence on Russia for fuel, particularly natural gas, and will pursue re-arming its member states forthwith (Chart 3).  Chart 3Weaning EU Off Russian Gas Will Prove Difficult On the energy front, the EU adopted a two-prong approach to cleave itself from Russian natgas: 1) Diversify its sources of natural gas, which largely will be in the form of liquified natural gas (LNG), and 2) doubling down on renewable energy generation. EU officials are aiming to replace two-thirds of their Russian gas imports by the end of this year, which is an ambitious target.  Over the next two years or so, EU officials hope to fully wean themselves from Russian natgas via a combination of infrastructure buildouts and a renewed push to increase domestic production, which was being throttled back by earlier attempts to secure increased Russian supplies, and a strong focus on renewables. EU's US LNG Deal The EU signed a deal with the US to receive an additional 15 Bcm of natural gas in 2022, and 50 Bcm annually by 2030, which is equal to ~ 30% of the EU’s 2020 Russian gas imports.  How exactly this will be done is unknown. In 2021, the EU imported 155 bcm of natgas from Russia, or more than 3x the amount being discussed with the US; 14 bcm of that was LNG.4 Just exactly what meeting of the minds was achieved between the EU and US government is totally unclear at this point.  The US is not an LNG supplier, nor can it order private companies to renege on existing contacts.  The US government likely will use its good offices to attempt to persuade Asian buyers to allow their contracted volumes to be diverted to European buyers, but that would, in all likelihood, mean they would switch to another fuel (e.g., coal) as an alternative if they take that deal.  This would, we believe, require some sort of financial incentive to induce such behavior. US liquefaction capacity is also running at near full capacity (Chart 4). While there are projects in the pipeline, in the medium-term (2 – 5 years) the lack of export capacity will act as a constraint to the amount of LNG that can be shipped to the EU. Chart 4Europe Critical To Russia's Gas Industry For Russia, its shipments of gas to OECD-Europe represent more than 70% of its exports (Chart 5). Arguably, Europe is just as important to Russia as Russia is to Europe.  With the EU set on a course to sever ties completely, Russia will be forced to invest in pipeline capacity to take more of its gas to China via the Power of Siberia 2 pipeline. In the short-term, US LNG exports to the EU will face headwinds since much of Central and Eastern Europe rely on piped gas from Russia. As a result, many countries within Europe are not equipped with sufficient regasification facilities and are running at near peak utilization rates (Chart 6).  Germany does not have any such capacity.  Chart 5Not Much Room For US LNG Exports To Grow… Chart 6…Or For Additional European LNG Imports LNG import facilities that have additional intake capacity in the Iberian Peninsula and Eastern Europe do not have sufficient pipeline capacity to move gas inland.  This will require additional infrastructure investment as well.  To deal with this lack of infrastructure, Germany, Italy and the Netherlands are moving quickly to procure Floating Storage and Regasification (FSRUs) to convert LNG back to its gaseous state.  While not the five-year proposition a dedicated LNG train requires to bring on line, setting up FSRUs still could be a years-long process.5 How quickly these assets can be mobilized, and the volumes they can deliver remain to be seen. Investment Implications Fast-changing EU natural gas supply-demand dynamics are impacting competing energy and base metals markets.  This is throwing up confusion around the global renewable-energy transition and extending its timetable.  Fossil fuels fortunes are being revived, as a result. At this point it is impossible to handicap the odds of a cut-off of Russian natgas to Europe, or its duration if it does occur.  Either way, competitive suppliers to Russia – particularly US shale-gas producers selling into the LNG market and the vessels that transport it – will benefit regardless of the course taken by Germany and Russia on rationing. We remain long commodity index via the S&P GSCI and COMT ETF, and the equities of oil-and-gas producers and base-metals miners via the PICK, XME and XOP ETFs.   Commodity Round-Up Energy: Bullish Oil prices were whipsawed by new reports suggesting Russia would substantially reduce its military operations in Kyiv ahead of ceasefire talks with Ukraine, only to have that speculation dashed by US officials indicating nothing had changed in the status quo to warrant such a view.  Markets restored the risk premium that fell out of prices on the unwarranted speculation, with Brent prices once again above $110/bbl this week.  At present, the fundamental oil picture remains tight.  In the run-up to a decision from OPEC 2.0's March meeting today, we continued to expect  KSA, the UAE and Kuwait to increase production by up to 1.6mm b/d this year, and another 600k b/d next year.  To date, OPEC 2.0 has fallen short by ~ 1.2mm b/d since it started returning production taken off line during the pandemic.  In return for higher output, we continue to expect the US to deepen its commitment to defending the Gulf Co-operation Council (GCC) states making up core-OPEC 2.0.  If we do not see an increase in core-OPEC 2.0 production, we will have to re-assess our fundamental outlook on KSA's, the UAE's and Kuwait's ability to increase production.  We also will have to determine whether – even if the supply is available to return to the market – these states have embraced a revenue-maximization strategy, given the fiscal breakeven price for these states now averages ~ $64/bbl.  It also is possible that heavily discounted Russian crude oil – trading more than $30/bbl below Brent (vs. the standard $2.50/bbl Urals normally commands) – convinces core-OPEC 2.0 states that oil prices are not so high for large EM buyers like India and China as to create demand destruction.  We believe the latter view likely is prevailing at present.  We continue to expect Brent to average $93/bbl this year and next (Chart 7). Base Metals: Bullish BHP Group Ltd. will invest more than $10 billion to expand metals production over the next 50 years in Chile.  The metals giant aims to stay ESG compliant, provided there is a supportive investment environment provided by the Chilean government. Resource-rich Latin American countries such as Chile and Peru have elected left-leaning governments intent on redistributing mining profits and ensuring companies comply with the ESG framework. As Chile considers raising mining royalties and redrafts its constitution, mining investment in the country has stalled. Political uncertainty in these countries has coincided with low global copper inventories (Chart 8) and high demand. Chart 7 Chart 8     Robert P. Ryan Chief Commodity & Energy Strategist rryan@bcaresearch.com     Footnotes 1     Please see Aluminum Giant Rusal Flags Stark Risks Triggered by War in Ukraine published by Bloomberg on March 30, 2022. 2     Please see our Special Report entitled Commodities' Watershed Moment, published on March 10, 2022.  It is available at ces.bcaresearch.com. 3    Please see footnote 2. 4    Please see How Deep Is Europe's Dependence on Russian Oil? published by the Columbia Climate School on March 14, 2022. 5    Please see Europe battles to secure specialised ships to boost LNG imports published by ft.com 28 March 2022.  Germany appears to be most advanced in its procurement of FSRU capacity, and is close to concluding a deal that would allow it to regasify 27 bcm annually.   Investment Views and Themes Strategic Recommendations Trades Closed in 2021