プラチナ
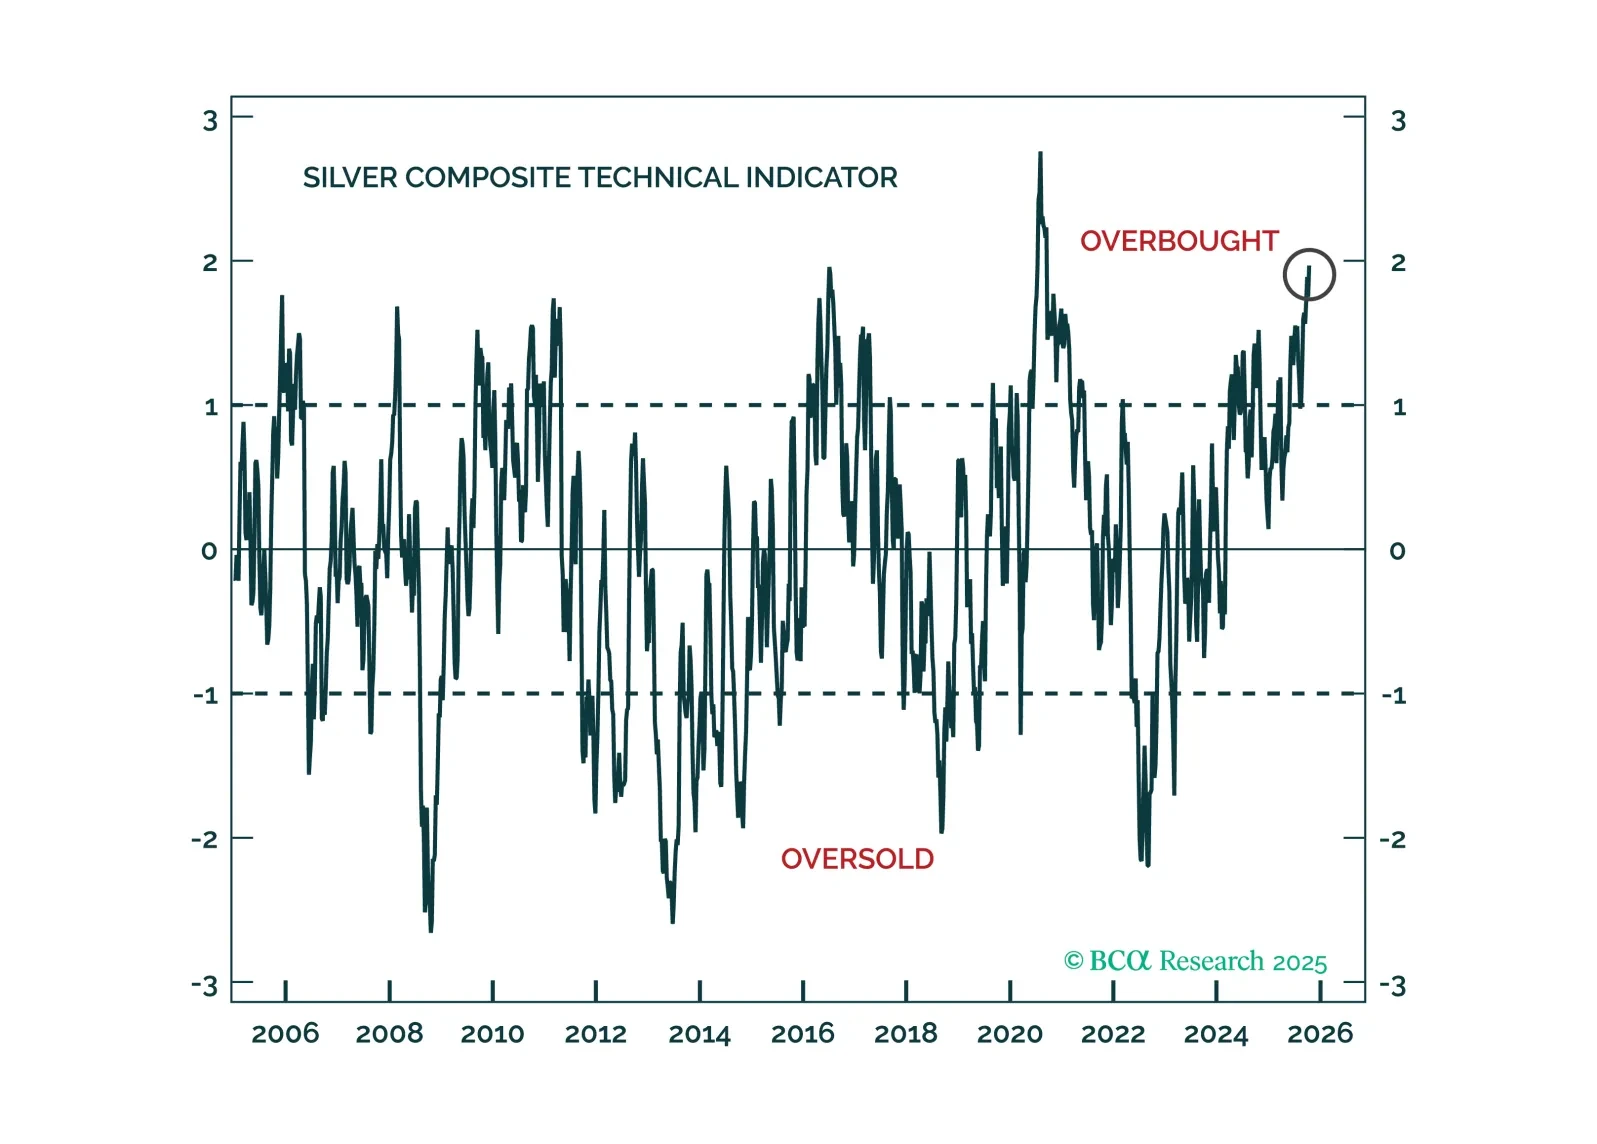
全ての貴金属市場に投機的な熱狂が広がっていますが、金は構造的な追い風のおかげで他の貴金属よりも調整局面をうまく乗り切ることができるでしょう。
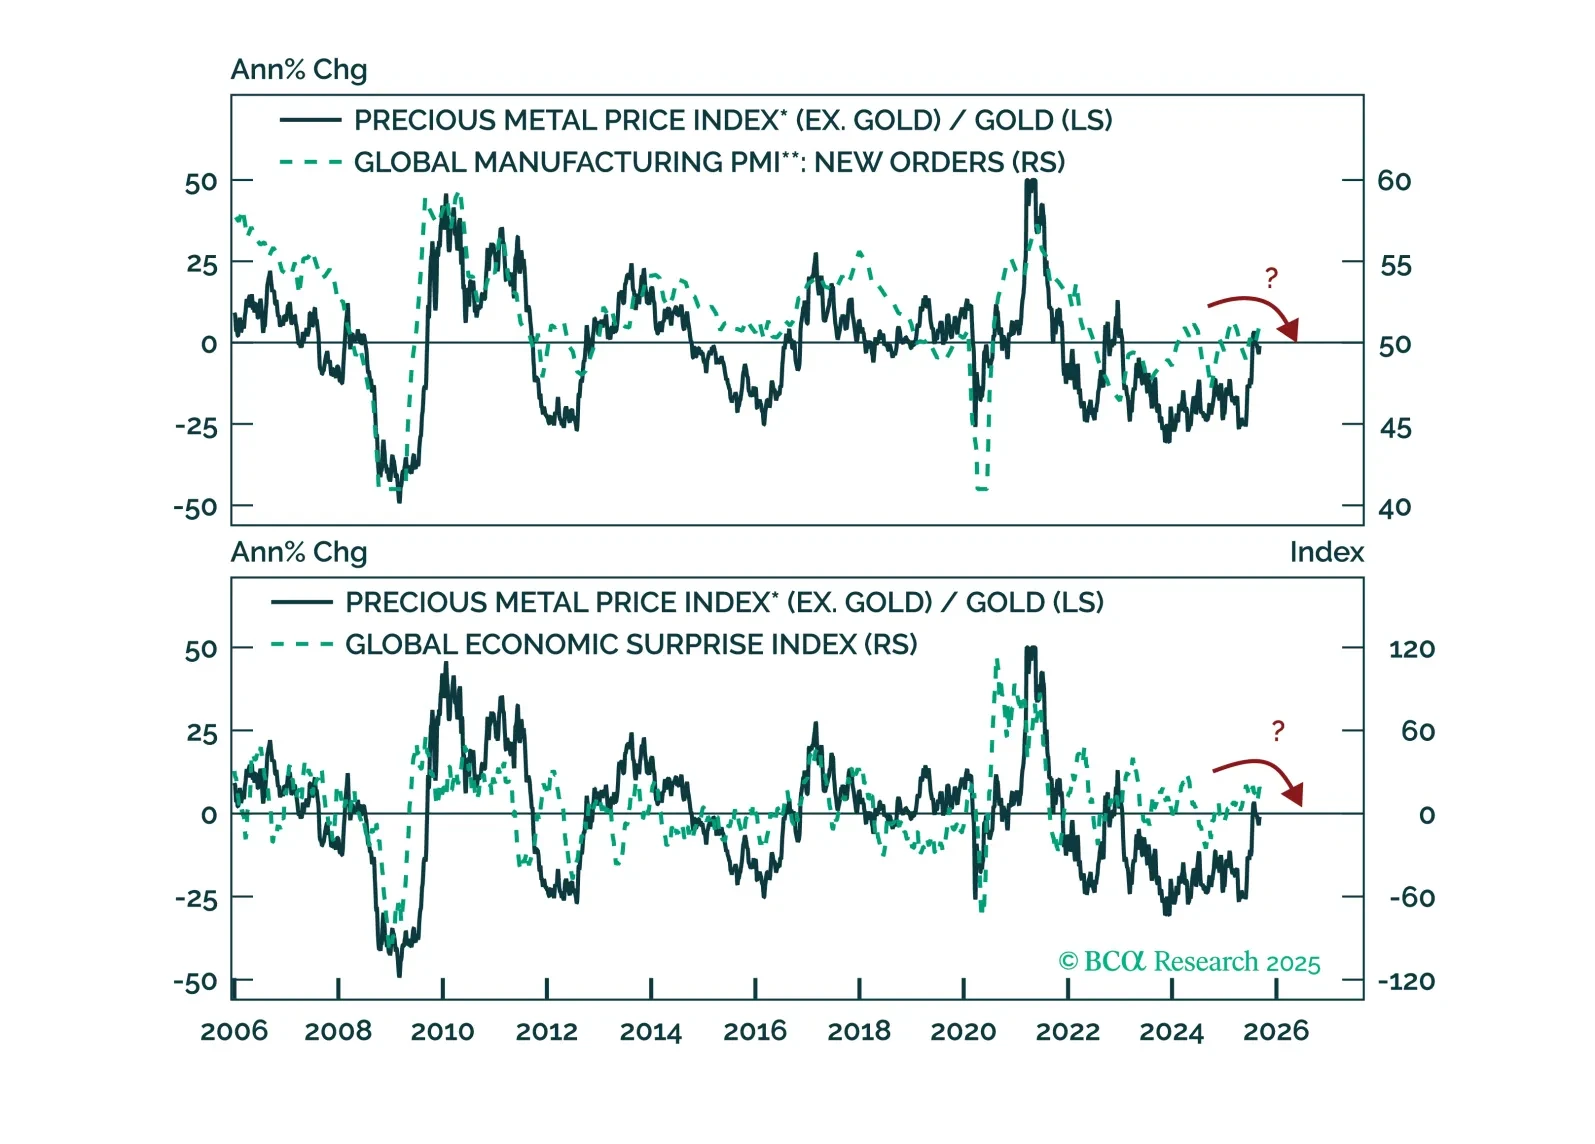
銀、プラチナ、パラジウムは、今後数ヶ月にわたり金と同様の循環的な追い風を受ける可能性があります。しかし、4つの重要なリスクがイエローメタルに対するそれらの相対的なパフォーマンスを脅かしています。
ドルは下落していますが、資本が米国から流出しているためです。投資家が答えるべき重要な質問は、ドルに残された下落の余地がどれほどあるのか、そして減価が今後数ヶ月間にわたり直線的に続くのか、それとも一時停止し(さらには逆行して反発を示すのか)です。戦術的には、私たちはドルを買います。これは、私たちのテクニカル指標がドルが非常に売られ過ぎており、逆行的な反発が予測されることを示しているためです。トレードアイデア#1: DXYを購入グリーンバックは2008年、金融危機の最深部で底を打ち、それ以来上昇トレンドにあります。DXYでは、そのトレンドは金融危機以降の一貫した高値と低値の更新によって定義されています(チャート1)。そのブルマーケットは現在、脅威にさらされています。年初来、DXYは約10.4%下落しました。米ドルが非常に長いサイクルで動く歴史を考慮すると、多くの投資家が今日直面する問題はこうです:さらなる弱さが続くのか、それとも逆張りする時期なのか?純粋にテクニカルな視点から、独立記念日にDXYを買う理由は3つあります。DXYは重要なサポートレベルに近づいています。このサポートレベルは、2008年の安値から引かれた上向きのトレンドラインによって定義されており、現在約96でサポートを示しています。このレベルでは、短期ショートポジションを解消する動きの結果、少なくとも戦術的な反発が予期されます。当社の包括的なモメンタムおよびポジショニング指標によると、ドルはかなり売られすぎの状態となっています。過去の履歴では、これがドルの逆トレンドの反発につながることが多かったことが示されています(チャート2)。この指標は平均値から標準偏差1未満の位置にあります。過去にこれらのレベルに達した際には、急激な反転が頻繁に発生しました。高頻度モメンタムコンポーネントが平均値から標準偏差2未満にほぼ到達したことは注目に値します。5%~10%のDXYの上昇は、長期的な弱気市場の文脈内で一般的に見られます。特に、世界経済が景気後退に陥った場合にはその可能性が高まります。2000年から2008年までのドルの弱気市場では、多くの逆方向の上昇が見られ、特に2005年が注目されます。同様に、2008年以降の強気市場でも多くの調整が見られ、一部は10%もの大幅なものもありました。これらはすべて戦術的なトレーディングの機会でした。DXYは重要なサポートレベルに近づいています。これは2008年の安値から描かれた上向きのトレンドラインによって定義されており、現在では96付近でサポートされています。この水準では、売りポジションを解消する動きが見られるため、少なくとも戦術的反発を予想します。私たちの包括的なモメンタムおよびポジショニング指標によると、ドルは非常に売られすぎの状態です。歴史的に、この状況はグリーンバックの反転反発を引き起こす傾向がありました (チャート2)。この指標は平均値から標準偏差1つ分下に位置しています。過去にこれらの水準に達した際には、急激な反転がしばしば発生しました。高頻度モメンタムのコンポーネントが平均値からほぼ標準偏差2つ分下に達したことは注目に値します。DXYが5%から10%程度の反発を示すことは、長期的な弱気市場の文脈においてよく見られることです。特に世界経済が景気後退に入った場合、この傾向が顕著になるでしょう。2000年から2008年のドルの弱気市場では、2005年をはじめとして多くの逆トレンドの反発が見られました。同様に、2008年以降の強気市場でも10%程度の深い調整を含む反発が何度も見られました。これらはすべて戦術的な取引機会でした。重要なポイントは、ドルが体制の転換期を迎えている可能性があるということです。この体制転換はより国際収支に焦点を当てたものになり、ドルの準備通貨としての地位がドナルド・トランプ大統領の政策の中で注目されている状況下で進むでしょう。これはUSDにとって長期的に弱気材料となります。とはいえ、現時点ではドルの下落が、逆トレンドの動きを通常示唆するレベルに戦術的に近づいています。それはDXYが96の水準付近に達する頃となるでしょう。トレードアイデア #2: 石油生産者対消費者ドルは、すべてのその他のFX市場の動きを自然に牽引する主要な要素です。これは、私たちの予測通り戦術的にドルが反発する場合、他のG10および新興国通貨に圧力をかけることを意味します。良いニュースとして、ドルの全体的なトレンドと密接に相関していないクロスではいくつかの魅力的な取引が存在します。その中で最も明確なものは、石油消費国に対して石油生産国の通貨バスケットを購入することです。この取引が有益である可能性がある理由は以下の3つです:まず、ほとんどの石油生産国は経常収支の黒字を持つ傾向がある一方、エネルギー輸入国は赤字国である傾向があります。したがって、国際収支にますます注目が集まる世界では、石油生産国の通貨バスケットを保有するのが自然です (チャート3)。第二に、米国が世界最大の原油生産国であることから、ドルは事実上のペトロカレンシーとなっています。これは、原油価格の上昇がサウジアラビア、カナダ、ノルウェー、ナイジェリア、アンゴラ、さらにはイランにとって恩恵となるように、米国にとっても利益をもたらすことを意味します(チャート4)。したがって、原油価格の上昇を予想する場合、USDに対してペトロカレンシーを買い持ちするというトレーディング・ストラテジーはうまくいきません。第二に、米国が世界最大の原油生産国であることから、ドルは事実上のペトロカレンシーとなっています。これは、原油価格の上昇がサウジアラビア、カナダ、ノルウェー、ナイジェリア、アンゴラ、さらにはイランにとって恩恵となるように、米国にとっても利益をもたらすことを意味します(チャート4)。したがって、原油価格の上昇を予想する場合、USDに対してペトロカレンシーを買い持ちするというトレーディング・ストラテジーはうまくいきません。
チャート3
米ドルはペトロ通貨である
米ドルはペトロ通貨である
チャート4
選択された石油生産者のバスケットを購入
選択された石油生産者のバスケットを購入
チャート3
米ドルはペトロ通貨である
米ドルはペトロ通貨である
チャート4
選択された石油生産者のバスケットを購入
選択された石油生産者のバスケットを購入
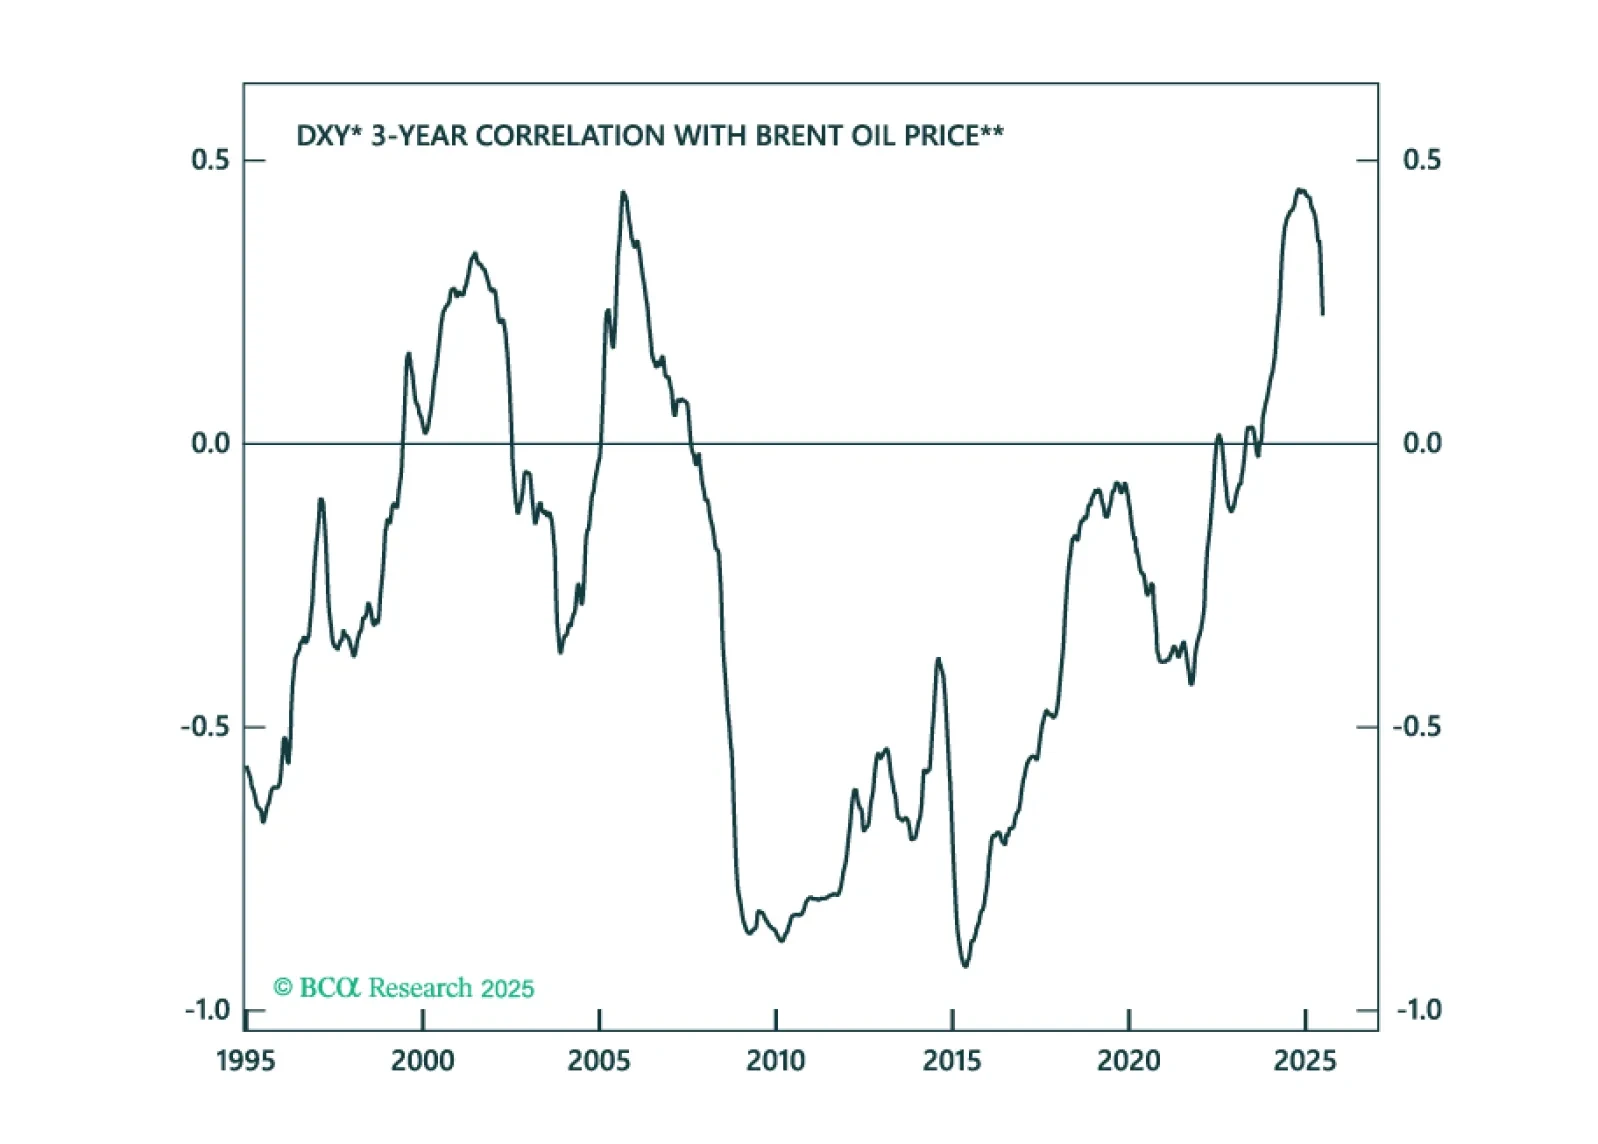
最後に、現在の原油価格である68ドルには、非常に少ない地政学的リスクのプレミアムが含まれています。この価格は、カンザス連邦準備銀行が米国生産者の限界生産コストとして推定しているものです。 最後に、現在の原油価格である68ドルには、非常に少ない地政学的リスクのプレミアムが含まれています。この価格は、カンザス連邦準備銀行が米国生産者の限界生産コストとして推定しているものです。 結論: ドルと原油価格の相関性は構造的にポジティブに転じています (チャート5)。原油に対する弱気な賭けは、この場合ドルが安くなることを意味します。とはいえ、市場を動かしているダイナミクスが国際収支である場合、経常収支が黒字である傾向がある原油生産国のバスケットを買い持ちし、原油消費国に対するポジションを取ることが有益です。このトレードはまた、原油価格の地政学的リスクプレミアム上昇から利益を得る可能性があります。
チャート5
原油価格の上昇はドルを押し上げる
原油価格の上昇はドルを押し上げる
チャート6
貴金属を買う
貴金属を買う
チャート5
原油価格の上昇はドルを押し上げる
原油価格の上昇はドルを押し上げる
チャート6
貴金属を買う
貴金属を買う
トレードアイディア3: 貴金属を買う世界的に取引のほぼ90%が未だに米ドルで行われています。脱ドル化について多くが語られる中、その割合は過去10年間で増加しています。今年明確だったのは、外国人がこのドル依存から多様化を図る意欲を示したことです。これは例えばロシアのような石油輸出国や、中国のような米国と地政学的に対立する国々にも当てはまります。発展途上国にとって、明確な選択肢は米ドルを金に置き換えることです。2010年には、金は中央銀行準備金の約10%を占めていました。本日は、米ドルとユーロを除いた中央銀行の最大保有資産となっています。ドルは長期的な周期で動く傾向があるため、それは貴金属にも同様に当てはまります。このドルからの脱却が続く中で、金は依然として恩恵を受けるでしょうが、より安価な貴金属がその勢いの中で注目を集めることになるでしょう。それはすでに銀やプラチナ価格で見られています。次の候補はパラジウムです(チャート6)。 チェスター・ントニフォー外国為替/グローバル・フィクスト・インカム・ストラテジストchestern@bcaresearch.comフォローはこちらLinkedIn & X
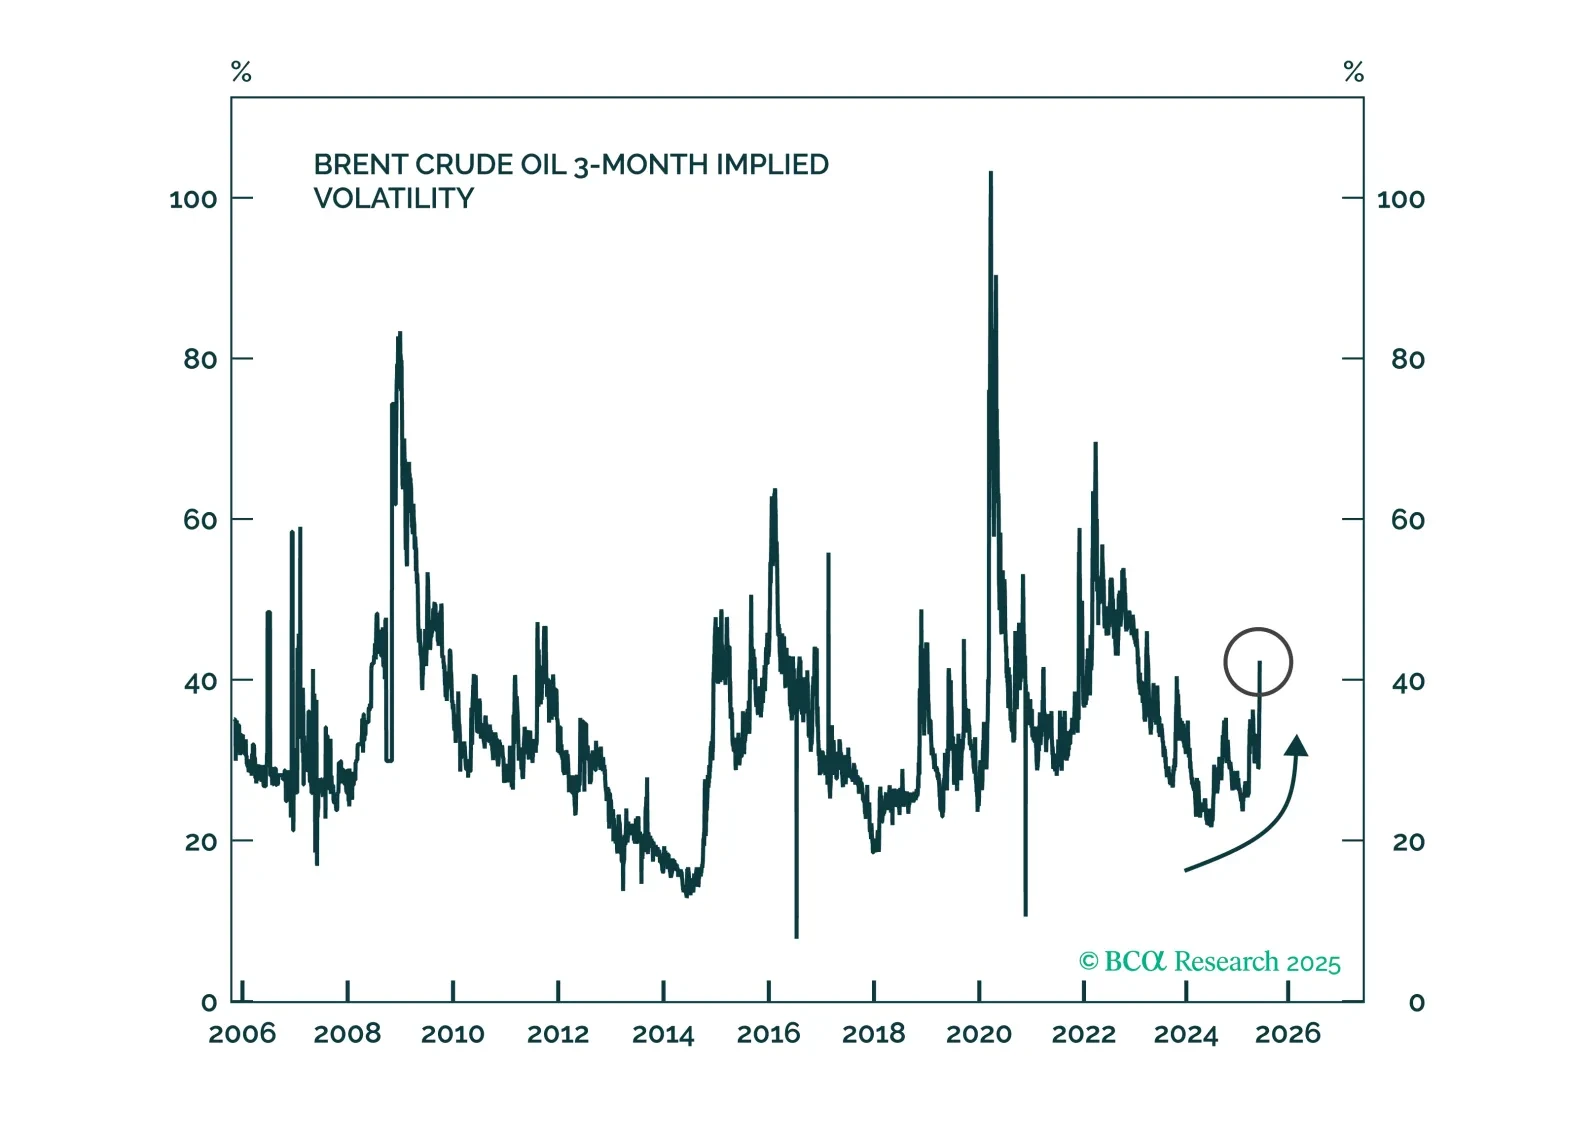
イスラエルとイランの紛争が激化し、原油価格が上昇しています。我々は、さらなる地政学的緊張、不確実性、および経済への影響に備え、短期的および長期的な上昇に対応できる2つのストラテジーを通じてポジショニングを行っています。
このインサイトでは、イングランド銀行、ノルウェー銀行、スイス国立銀行、リクスバンクによる中央銀行会合に基づく強い確信を持つ取引を取り上げます。

As we anticipated in an Insight we published in May, palladium continues to underperform platinum. Last week, platinum's discount to palladium shrunk to its smallest since August 2018. While the prices of both metals have fallen so far this year, palladium's…
Palladium is by far the worst performing precious metal so far this year. The 30% year-to-date price decline is significantly worse than platinum’s 10% loss and contrasts with higher gold (+8%) and silver (+4%) prices. Interestingly, palladium’s dismal…

Highlights Gold prices will continue to be challenged by conflicting information flows regarding US monetary policy; higher inflationary impulses from commodity prices and supply-chain bottlenecks; global economic policy uncertainty, and risks to EM economic growth (Chart of the Week). Concern over the likely tapering of the Fed's asset-purchase program this year, rate hikes next year and fiscal-policy uncertainty will support rising interest-rate risk premia and a stronger USD. These will remain headwinds for gold. Going into the Northern Hemisphere's winter, risk premia in fossil-fuel prices are at or close to their zeniths, as is the Bloomberg commodity index. This will keep short-term inflation elevated. Heightened geopolitical tensions – particularly between Western democracies and China – will keep the USD well bid by risk-averse investors. The commodity-induced element of PCEPI inflation will be transitory. Uncertainty over US monetary policy and rising geopolitical tensions, however, will remain part and parcel of gold fundamentals indefinitely. The trailing stop on our long 1Q22 natural gas call spread – long $5.00/MMBtu call vs. short $5.50/MMBtu call – was elected, leaving us with a 20% gain. We will not be re-setting the spread at tonight's close, due to the difficulty in taking a price view in markets with extremely high weather-related uncertainty. Feature The quality of information informing the analysis of gold markets is highly uncertain at present. US monetary policy uncertainty and the future of Fed chairman Jerome Powell keep expectations twitchy when it comes issues like the tapering of the Fed's asset-purchase program. Our colleagues at BCA's US Bond Strategy expect the Fed will announce a taper in asset purchases by November 2021 which will end in June 2022.1 But the tapering really is not, in our estimation, as big a deal as inflation and inflation expectations, which will drive the Fed's rate-hiking timetable. Chart of the WeekUncertainty Weighs On Gold The first Fed rate hike expected by our bond desk likely will come at the end of next year. Our colleagues expect the Fed will want to check off three criteria before increasing interest rates (Table 1). The inflation targets – actual and expected – already have been checked off, leaving the labor market's recovery as the only outstanding issue on our internal checklist. By December 2022, once the maximum employment criterion has been met, the Fed will commence with rate hike.2 Subsequent rate hikes will depend on inflation expectations. Table 1A Checklist For Liftoff Uncertain Inflation Expectations The higher inflation that checks off our bond desk's list resulted from COVID-19-impacted services and tight auto markets (Chart 2). We also find evidence commodities feed into inflation expectations and realized inflation, both of which are key variables for the Fed (Chart 3). Transitory effects – chiefly supply-chain bottlenecks and a global scramble for coal, gas and oil – have lifted realized inflation in 2H21, and have taken the Bloomberg commodity index to record levels (Chart 4). Nonetheless, given the fundamental backdrop for the key industrial commodities – chiefly oil, gas, coal and base metals – the inflationary impulse from commodity markets could persist indefinitely into the future, in our estimation. In order to incentivize the investment in base metals needed to literally build out the renewable energy infrastructure, the grids that support it and the electric vehicles that will supplant internal-combustion-engine technology, higher energy and metals prices will be required for years.3 This will be occurring as the production of traditional energy sources – i.e., fossil fuels – winds down due to lower investment over the next 10-20 years. This also will result in higher and more volatile oil and gas prices. Chart 2Inflation Meets Fed Targets Chart 3Commodities Feed Into Inflation Expectations All of these real-economy factors will feed into higher inflation over time, which will present the Fed with difficult choices regarding monetary policy and interest rates. Chart 4Record Commodity Index Levels USD Strength Suppresses Inflation And Gold Prices It is worthwhile noting the current USD strength is suppressing inflation. However, it is not suppressing commodity prices entirely, as Chart 4 shows. The transitory weather-related price increases in energy commodities will pass, either when winter ends or if a less severe winter hits the Northern Hemisphere. We continue to expect a lower dollar, as the Fed's accommodative monetary policy remains in place. Even after the Fed tapers its asset-purchase program, policy will remain loose. The large fiscal packages that most likely will be approved by the US Congress will swell the US debt and budget deficits, which likely will weaken the USD over time. On a purchasing-power-parity basis (PPP) we also expect a weaker dollar (Chart 5). We also are expecting the availability of more efficacious vaccines in EM economies to boost economic activity, which will strengthen incomes and local currencies vis-à-vis the USD. Chart 5Weaker USD Expected On A PPP Basis The risk to this USD view – which would support gold prices – remains the heightened geopolitical tensions between Western democracies and China, which will keep political uncertainty elevated and will keep the USD well bid by risk-averse investors. Persistent USD strength would restrain inflation, and weaken the case for owning gold. Investment Implications We remain bullish gold over the medium- and long-term, expecting higher inflation and inflation expectations to lift demand for this safe haven. However, persistent commodity-induced inflation could force the Fed to tighten monetary policy more than is currently expected to get out ahead of higher inflation and inflation expectations. This could lead to stagflation, wherein inflation runs high but growth stalls as interest rates move higher. Persistent geopolitical risk also will keep risk-averse investors well bid for the USD. Commodities Round-Up Energy: Bullish First-line US natural gas prices were down ~ 9% as we went to press, following reports Russia would make more gas available to European buyers. This report apparently was later contradicted by a Gazprom official, who said Russian inventories still were being filled ahead of winter.4 WTI crude oil prices came close to hitting a seven-year high early in the trading day Wednesday, then promptly retreated (Chart 6). The news flow is indicative of the extreme sensitivity of gas and oil buyers going into the coming winter. Base Metals: Bullish Earlier this week, the Peruvian government struck an deal with MMG Ltd, owner of the Las Bambas mine, and the local community around the site, which reportedly will involve hiring local residents to provide services to the mine, including helping transport minerals and maintaining key transit roads. The community had been protesting to seek more of the income from the mine, and created blockades en route to the site, which threatened ~ 2% of global copper supply. Peru's newly elected president, TK Castillo, rose to power on the promise to redistribute mining wealth to Peruvian citizens. This was his first negotiation with a mining company since his election in July. MMG’s major shareholder is China Minmetals Corp. The Leftist president will need to balance the interests of local stakeholders on the one hand, while ensuring the world’s second largest copper producing nation is still attractive to international miners. Precious Metals: Bullish In 2021, the World Platinum Investment Council expects the platinum to swing to a physical surplus of 190k oz, which reverses an earlier forecast for a deficit made in the Council's 1Q21 report (Chart 7). Demand is forecast to increase year-over-year, spurred by increases in automotive, industrial and jewelry demand. On the supply side, growth in South Africa's mined output growth will keep markets in a surplus for 2021. According to SFA Oxford, gross palladium demand and refined supply for 2021 are expected to be at 10.03mm oz, and 6.77mm, respectively. Palladium balances (ex-ETFs) are projected to remain in a physical deficit of 495k ounces for 2021. Chart 6 Chart 7 Robert P. Ryan Chief Commodity & Energy Strategist rryan@bcaresearch.com Ashwin Shyam Research Associate Commodity & Energy Strategy ashwin.shyam@bcaresearch.com Footnotes 1 Please see Damage Assessment, published by BCA Research's US Bond Strategy on September 28, 2021. 2 Please see 2022 Will Be All About Inflation, published by BCA Research's US Bond Strategy on September 14, 2021, which notes the concept of maximum employment is not a well-defined term. 3 Please see La Niña And The Energy Transition, which we published last week. 4 Please see Energy price surge sends shivers through markets as Europe looks to Russia published by reuters.com on September 6, 2021. Investment Views and Themes Recommendations Strategic Recommendations
Highlights The dollar is fighting a tug of war between two diverging forces: an economic slowdown around the world but plunging real interest rates in the US. The litmus test for determining which force will gain the upper hand is if the DXY fails to break above the 93-94 level that marked the March highs. So far that appears to be the case. In the interim, investors can capitalize on a few themes that will ultimately unfold: an end to the China slowdown, a bet on real rates staying low for longer, and a play on the Olympics. The expressions of these themes are long AUD/MXN, long silver and long the yen, respectively. Natural disasters are also rising in frequency globally. Historically, this has coincided with rising currency volatility. Long CHF/NZD positions can be a potent play on this trend. We ultimately expect the dollar lower 9-12 months from now. The best currencies to express this view today are NOK and SEK. Feature We are a month into the second half of year, and it is instructive to revisit the dollar view and our roadmap towards year-end. As a starting point, two key themes are propping the dollar on a tactical basis: The first is a global economic slowdown, one that could be exacerbated by increased infections of the COVID-19 Delta variant. The dollar tends to rise in an environment where global growth is weak. This is especially the case when US growth is relatively resilient, like now (Chart I-1). The second is the resilience of the US equity market, not only due to superior earnings, but also as regulatory crackdowns hit shares in China specifically, and emerging markets in general. Equity inflows into the US were a key reason the dollar did not collapse in 2020. Renewed inflows into US equities will be particularly beneficial for the dollar (Chart I-2). This will especially be the case if technology and healthcare earnings keep surprising to the upside. Chart I-1The Dollar And Relative Economic Momentum Chart I-2The US Is Leading The Earnings ##br##Cycle At the same time, real interest rates in the US are very depressed. In its latest meeting, the Federal Reserve reiterated that it will keep running the economy hot, a thesis central to our bearish dollar view. This puts the dollar in a tug of war between two diverging forces: an economic slowdown around the world but plunging real interest rates in the US. Arbitrating The Tug Of War Historically, unless the world economy experiences a recession, the interest rate story has dominated currency market action. Our report last week showed that real interest rates matter for currencies both short term and longer term. Given our bias that global growth will moderate rather than contract, the future path of interest rates will once again become important for currency market action. In this light, lower real rates are negative for the US dollar. How long the outperformance of US equities will last is a tougher call. What we do know is that in a rising interest rate environment, the US equity market has tended to derate relative to the rest of the world. Our base case is that bond yields will be higher globally on a cyclical horizon, suggesting investors should fade the current outperformance of US equities. Scandinavian Currencies As A Strategic Dollar Play The best currencies to express a cyclically lower dollar are the NOK and SEK, for a few reasons other than the strong correlation with the DXY index (Chart I-3): Chart I-3NOK And SEK Are A Play On DXY Economic momentum in both Norway and Sweden is picking up steam. In Norway, high oil prices will be a cyclical boost to the currency, as has been the case historically. Meanwhile, Sweden is benefiting from a strong manufacturing landscape, especially in autos where pricing has skyrocketed due to shortages. While the Swedish manufacturing PMI has moderated recently, it still sits at 65.8, the highest level since the mid-1990s. Both currencies remain very cheap according to our models. Our favored PPP model shows that NOK and SEK are trading at a discount of 20% and 17% respectively, amongst the cheapest in the G10 (Chart I-4). Chart I-4The Dollar Is Expensive Norway, Sweden and Canada are among the countries whose output gaps are expected to close relatively fast (Chart I-5). In the case of Norway (and Canada), the central bank has been vocal about curtailing monetary accommodation, as market conditions improve. The upside surprise in Swedish GDP this week lowers the odds of more monetary accommodation from the Riksbank. This will boost real rates in these countries, supporting their currencies. Chart I-5Output Gaps Across The G10 In a nutshell, if the dollar heads lower 9-12 months from now, this will benefit most procyclical currencies, with the NOK and SEK as winners. The Yen As An Olympian Chart I-6Currencies And The Olympics We made the case last month that the yen was the most underappreciated G10 currency, and that certainly remains true. Since then, there has been improvement in the Japanese economy: The vaccination campaign is progressing smoothly, with 27% of the population having been inoculated from almost nil earlier this year. Meanwhile, about 38% have received at least one dose. This should curtail hospitalizations, despite the increase in new cases. Economic momentum remains tepid, but there are green shoots. Real cash earnings are inflecting higher, which is boosting household spending. There was also remarkable improvement in the Eco Watchers Survey, a sign of optimism among small and medium-sized businesses. Global trade remains strong, which is a boost to the Japanese external sector. While this may slow going forward, it will be a benign headwind. Japan is less exposed to China, a key market for exports, compared to its developed market peers like Australia and New Zealand. Meanwhile, China is already easing policy at the margin. The true catalyst for the yen could be the Olympics. Since the 1970s, the median performance of a currency hosting the Olympics is 4% over a year. The performance of the yen today falls well below the 25th percentile of this performance gap (Chart I-6). This year’s games have obviously been unique given the pandemic but given that the yen is the most shorted G10 currency, this is probably already in the price. It also it does raise the prospect that the yen rises from being an underdog to staging a powerful mean reversion rally. While Japan will not get a tourism boost this summer that will buffet discretionary spending, foreigners are likely to return as the pandemic is put behind us. It is remarkable that Japanese shares, even construction and material companies, that should have benefited from the leadup to the Olympics, have massively underperformed (Chart I-7). This suggests that at the margin, many investors have folded hands and sold Japanese equities indiscriminately. Chart I-7Japanese Shares Have Underperformed Finally, real rates in Japan are among the highest in the G10. This will not only prevent Japanese concerns from deploying yen cash on foreign paper, but could also lead to some repatriation of funds, boosting the yen. Low Real Rates: Buy Silver (And Platinum) The case for buying silver has become compelling, at least on a tactical basis. First, the runup in prices from under $12/oz in March to almost $30/oz in August ushered silver into a well-defined wedge formation, with a series of higher lows. We are now sitting close to the lower bound of this wedge. Given our expectation that any DXY rally will be capped at 93-94, this puts a solid floor under silver prices around the $22-$23/oz level (Chart I-8). This makes for an attractive risk/reward since silver could overtake its 2011 highs near $50/oz, once strong resistance at $30/oz is breached. Second, similar to gold, silver benefits from low interest rates, plentiful liquidity, and the incentive for fiat money debasement. But unlike gold or even cryptocurrencies, physical use for silver is quite elevated. Silver fabrication demand benefits from electronic production (whereby there is a shortage, so it is bound to eventually increase), as well as new green industries such as solar power that are dominating the manufacturing landscape (Chart I-9). Meanwhile, our Commodity & Energy Strategists have flagged that the surplus of silver is expected to shrink significantly this year, driven by both industrial and investment demand (Chart I-10). Chart I-8Buy Some Silver Chart I-9Silver Demand Is Picking Up Chart I-10The Silver Surplus Is Shrinking Third, silver is also a more potent play on a lower dollar. This is because the silver market is thinner and more volatile, with futures open interest at about one-third that of gold. Put another way, volatility in silver has always been historically higher than gold, which is why silver tends to outperform gold when the dollar is falling (Chart I-11). Chart I-11Silver Is A More Potent Play On The Dollar It is worth pointing out that the velocity of money between the US and China is slowing again, suggesting growth is likely to start outperforming outside the US, beyond the current slowdown. The US benefits less from a pickup in Chinese growth, compared to other countries. This has generally pushed the dollar lower and set fire under the silver/gold ratio (Chart I-12). Finally, there is also a case to be made for platinum. It has lagged both gold and palladium prices (Chart I-13). Meanwhile, breakthroughs are being made in substituting palladium for platinum in gasoline catalytic converters. Chart I-12Money Velocity And The GSR Chart I-13Platinum And Silver Have Lagged Gold China Slowdown Almost Over: Buy AUD/MXN Soon We highlighted in February that a tactical opportunity had opened to go short the AUD/MXN cross. With the cross down 11% from its recent highs, an opportunity to go long will soon open up. China has started easing policy at the margin. The AUD/MXN cross correlates quite strongly with the Chinese credit cycle, as Australia is economically tied to China while Mexico depends more on the US (Chart I-14). The Australian PMI has remained quite firm, despite a slowdown in the Chinese credit impulse. Strong commodity prices have been a factor, but it also points to endogenous strength in the Aussie economy. Relative terms of trade favor the Aussie. We had expected terms of trade between Australia and Mexico to relapse on the basis of destocking in China, but that has not been the case (Chart I-15). With oil prices structurally challenged by EVs, while metal prices benefit from the buildout of green infrastructure, terms of trade will remain favorable for the cross longer term. Australian stocks have been underperforming the more defensive Mexican bourse (Chart I-16). This should reverse as cyclicals start to regain the upper hand. Chart I-14AUD/MXN Tracks Chinese Credit Chart I-15AUD/MXN And Terms Of Trade Chart I-16AUD/MXN And Relative Equity Prices The timing for a long position is tricky as Chinese economic activity is likely to slow in the coming months, and cyclical equities could remain under pressure. Meanwhile, as value investors, we are also uncomfortable with AUD/MXN valuations. This suggests that in the very near term, short positions still make sense. That said, the 13-14 zone should provide formidable support to go long, an opportunity likely to unfold in the next 3 months (Chart 17). Chart I-17AUD/MXN And Momentum A Final Thought On Rising Catastrophes We have been watching with obvious trepidation the rising incidence of catastrophes globally. The occurrence of weather events such as droughts, floods, storms, cyclones, and wildfires has been skyrocketing (Chart I-18). Chart I-18Disasters And Volatility The direct play is to buy global construction and machinery stocks that are likely to benefit from increased reconstruction activity. It also favors agricultural futures. As for currency markets, the one observation is rising volatility with the VIX having spiked significantly in the years with numerous weather events. We are already long CHF/NZD and the yen as a play on rising currency volatility, and we will be exploring this thesis more deeply in future publications. Chester Ntonifor Foreign Exchange Strategist chestern@bcaresearch.com Currencies U.S. Dollar Chart II-1USD Technicals 1 Chart II-2USD Technicals 2 Data out of the US this week was relatively robust: The Markit manufacturing PMI for July edged up from 62.1 to 63.1. That said, the services PMI fell from 64.6 to 59.8. Durable goods orders were rather weak, rising 0.8% year on year in June, versus a consensus of a 2.2% increase. Admittedly, the core non-defense measure, excluding aircraft and parts, rose by 0.5% from 0.1%. Consumer confidence remains resilient, rising from 127.3 to 129.1 in July, well above expectations. Q2 GDP came in at 6.5% quarter on quarter, versus an 8.4% consensus. The US dollar DXY index fell this week. The Fed meeting highlighted that the authorities are in no rush to tighten monetary policy, despite what has been a robust recovery in labor market conditions and inflation. The aftermath of the meeting saw a drop in US real yields and the dollar. The Fed’s dovish stance has been a central theme to our bearish dollar view. Report Links: Arbitrating Between Dollar Bulls And Bears - March 19, 2021 The Dollar Bull Case Will Soon Fade - March 5, 2021 Are Rising Bond Yields Bullish For The Dollar? - February 19, 2021 The Euro Chart II-3EUR Technicals 1 Chart II-4EUR Technicals 2 Data out of the eurozone this week softened: The manufacturing PMI fell to 62.6 in July from 63.4. The services PMI surprisingly improved, rising from 58.3 to 60.4 in July. Economic confidence rose from 117.9 to 119 in July. The German IFO survey was below consensus in July, but the expectations component did rise from 99.6 to 100.4. The euro rose by 1% this week. We went long the euro at 1.18 on expectations that at the margin, monetary policy in the euro area will shift in a more hawkish fashion. Since then, the ECB has adopted a symmetric inflation target, promising to keep interest rates low for longer. The euro’s indifference to this dovish development suggests a strong floor under the currency, and upside should euro area growth beat consensus. Report Links: Relative Growth, The Euro, And The Loonie - April 16, 2021 The Euro Dance: One Step Back, Two Steps Forward - April 2, 2021 On Japanese Inflation And The Yen - January 29, 2021 The Japanese Yen Chart II-5JPY Technicals 1 Chart II-6JPY Technicals 2 Japanese data was rather mixed this week: The Jibun manufacturing PMI eased slightly in July, to 52.2 from 52.4. The services component also fell to 46.4. Department store sales came in at 3.7% year on year in June. We highlighted last week that supermarket sales also remain strong. The yen was up 0.4% against the dollar this week. In the history of the Olympics, the incumbent currency has tended to rise over the course of the year. Given the yen is the most shorted developed-market currency currently, this sets it up for a coiled spring rebound. Report Links: The Case For Japan - June 11, 2021 The Dollar Bull Case Will Soon Fade - March 5, 2021 On Japanese Inflation And The Yen - January 29, 2021 British Pound Chart II-7GBP Technicals 1 Chart II-8GBP Technicals 2 There were some mixed data out of the UK this week: Retail sales in the UK were in line with expectations. The measure excluding automobiles and fuel rose by 7.4% year on year in June. The PMIs generally slowed from very strong levels. The manufacturing print for July was 60.4, while the services component came in at 57.8. House price inflation remains strong, with the nationwide measure coming in at 10.5% year on year in July. Mortgage approvals fell slightly in June but remain at a robust 81.3K. The pound rose by 1.5% this week. The big surprise in the UK has been a reversal in the COVID-19 infection rate, despite an economy that is reopening quite briskly. This sets cable up for a volatile few weeks and months, given a poor technical picture (speculations are cutting long positions from very aggressive levels). We like GBP long term but will stand aside for now. Report Links: Why Are UK Interest Rates Still So Low? - March 10, 2021 Portfolio And Model Review - February 5, 2021 Thoughts On The British Pound - December 18, 2020 Australian Dollar Chart II-9AUD Technicals 1 Chart II-10AUD Technicals 2 The inflation report in Australia was in line with expectations for Q2: Headline CPI rose from 1.1% to 3.8%. The trimmed mean and median measure came in at 1.6% and 1.7% respectively. The AUD was flat this week, the worst performing G10 currency. The dominant story remains the renewed restrictions from a resurgence in COVID-19, particularly in Sydney. That said, weakness in AUD is starting to create an attractive reward/risk profile. Speculators are net short the Australian dollar, and our bias is that there has been spillover pressure from the recent turmoil in Asian/Chinese markets. In the end, this only makes for a coiled spring rebound in the AUD. Report Links: The Dollar Bull Case Will Soon Fade - March 5, 2021 Portfolio And Model Review - February 5, 2021 Australia: Regime Change For Bond Yields & The Currency? - January 20, 2021 New Zealand Dollar Chart II-11NZD Technicals 1 Chart II-12NZD Technicals 2 The was scant data out of New Zealand this week: The trade balance came in at NZ$261 million, even with stronger imports in June. The ANZ activity outlook index fell in July, to 26.3 from 31.6. The NZD was up 0.5% this week. The strong rally in NZD after a hawkish RBNZ a fortnight ago continues to fade. This week, we highlighted a new theme, which is the rising incidence of natural disasters. Historically, this has been great for agricultural prices, benefiting NZD. But it has also been accompanied by a tremendous rise in currency volatility, which hurts the NZD vis-à-vis safe-haven currencies. We are currently long CHF/NZD and will be exploring this theme in future publications. Report Links: How High Can The Kiwi Rise? - April 30, 2021 Portfolio And Model Review - February 5, 2021 Currencies And The Value-Versus-Growth Debate - July 10, 2020 Canadian Dollar Chart II-13CAD Technicals 1 Chart II-14CAD Technicals 2 Data out of Canada this week has been mixed: Retail sales fell month on month in May by 2.1% but this was above expectations. Inflation remains robust. Headline CPI was 3.1%, while the core trim, median and common measures came in at 2.6%, 2.4% and 1.7% respectively. The CAD rose by 0.8% this week. The backdrop for the loonie remains positive as the Bank of Canada is leaning against monetary accommodation by tapering asset purchases, and signaling interest rate increases, while the Fed remains on hold. These pin real interest rate differentials in favor of the loonie. Report Links: Relative Growth, The Euro, And The Loonie - April 16, 2021 Will The Canadian Recovery Lead Or Lag The Global Cycle? - February 12, 2021 The Outlook For The Canadian Dollar - October 9, 2020 Swiss Franc Chart II-15CHF Technicals 1 Chart II-16CHF Technicals 2 There was scant data out of Switzerland this week: Investor confidence from the Credit Suisse survey fell in July, from 51.3 to 42.8. Total sight deposits were unchanged at CHF 712 bn for the week of July 23. The Swiss franc was up 1.3% this week. Incoming Swiss inflation data next week will dictate whether the SNB steps up the pace of FX intervention. So far, there have been no big moves in the CHF exchange rate to implore central bank attention. A rebound in global bond yields will be a welcome relief since the franc tends to weaken in that environment. For the time being, we believe volatility can continue to rise. As such, the franc will benefit, justifying long CHF/NZD bets. Report Links: An Update On The Swiss Franc - April 9, 2021 Portfolio And Model Review - February 5, 2021 The Dollar Conundrum And Protection - November 6, 2020 Norwegian Krone Chart II-17NOK Technicals 1 Chart II-18NOK Technicals 2 There was scant data out of Norway this week: Retail sales were flat month on month in June. The NOK was up 1% this week. Our limit buy on Scandinavian currencies was triggered a fortnight ago, nudging us in the money with this week’s currency moves. We are not fighting the Norges Bank, which has signaled they will increase interest rates this year, ahead of both the Federal Reserve and the ECB. As such, we are short EUR/NOK and USD/NOK. Report Links: The Norwegian Method - June 4, 2021 Portfolio And Model Review - February 5, 2021 Revisiting Our High-Conviction Trades - September 11, 2020 Swedish Krona Chart II-19SEK Technicals 1 Chart II-20SEK Technicals 2 Recent data from Sweden have been improving: The PPI for July came in at 9.6%, up from 7.9%. The June trade balance showed a healthy surplus of SEK 10.3 billion. The economic tendency survey for July came in at 122.4 from 119.8. Manufacturing confidence continues to inflect higher, rising from 125.2 to 129.2 in July. The SEK was the strongest performing G10 currency this week, rising 1.5%. Swedish Q2 GDP was a welcome positive surprise, up by 10.5% year on year and 0.9% quarter on quarter. This is paring back expectations of more stimulus from the Riksbank. We have been highlighting that SEK remains one of our most potent plays on a global growth recovery. As such, we are short EUR/SEK and USD/SEK. Report Links: Revisiting Our High-Conviction Trades - September 11, 2020 More On Competitive Devaluations, The CAD And The SEK - May 1, 2020 Sweden Beyond The Pandemic: Poised To Re-leverage - March 19, 2020 Trades & Forecasts Forecast Summary Core Portfolio Tactical Trades Limit Orders Closed Trades
Highlights Global oil markets will remain balanced this year with OPEC 2.0's production-management strategy geared toward maintaining the level of supply just below demand. This will keep inventories on a downward trajectory, despite short-term upticks due to COVID-19-induced demand hits in EM economies and marginal supply additions from Iran and Libya over the near term. Our 2021 oil demand growth is lower – ~ 5.3mm b/d y/y, down ~ 800k from last month's estimate – given persistent weakness in realized consumption. We have lifted our demand expectation for 2022 and 2023, however, expecting wider global vaccine distribution and increased travel toward year-end. The next few months are critical for OPEC 2.0: The trajectory for EM demand recovery will remain uncertain until vaccines are more widely distributed, and supply from Iran and Libya likely will increase this year. This will lead to a slight bump in inventories this year, incentivizing KSA and Russia to maintain the status quo on the supply side. We are raising our 2021 Brent forecast back to $63/bbl from $60/bbl, and lifting our 2022 and 2023 forecasts to $75 and $78/bbl, respectively, given our expectation for a wider global recovery (Chart of the Week). Feature A number of evolving fundamental factors on both sides of the oil market – i.e., lingering uncertainty over the return of Iranian and Libyan exports and the strength of the global demand recovery – will test what we believe to be OPEC 2.0's production-management strategy in the next few months. Briefly, our maintained hypothesis views OPEC 2.0 as the dominant supplier in the global oil market. This is due to the low-cost production of its core members (i.e., those states able to attract capital and grow production), and its overwhelming advantage in spare capacity, which we reckon will average in excess of 7mm b/d this year, owing to the massive production cuts undertaken to drain inventories during the COVID-19 pandemic. Formidable storage assets globally – positioned in or near refining centers – and well-developed transportation infrastructures also support this position. We estimate core OPEC 2.0 production will average 26.58mm b/d this year and 29.43mm b/d in 2022 (Chart 2). Chart of the WeekBrent Prices Likely Correct Then Move Higher in 2022-23 Chart 2OPEC 2.0 Will Maintain Status Quo The putative leaders of the OPEC 2.0 coalition – the Kingdom of Saudi Arabia (KSA) and Russia – have distinctly different goals. KSA's preference is for higher prices – ~ $70-$75/bbl (basis Brent) to the end of 2022. Higher prices are needed to fund the Kingdom's diversification away from oil. Russia's goal is to keep prices closer to the marginal cost of the US shale-oil producers, who we characterize as the exemplar of the price-taking cohort outside OPEC 2.0, which produces whatever the market allows. This range is ~ $50-$55/bbl. The sweet spot that accommodates these divergent goals is on either side of $65/bbl for this year. OPEC 2.0 June 1 Meeting Will Maintain Status Quo With Brent trading close to $70/bbl, discussions in the run-up to OPEC 2.0's June 1 meeting likely are focused on the necessity to increase the 2.1mm b/d being returned to the market over the May-July period. At present, we do not believe this will be necessary: Iran likely will be returning to the market beginning in 3Q21, and will top up its production from ~ 2.4mm b/d in April to ~ 3.85mm b/d by year-end, in our estimation. Any volumes returned to the market by core OPEC 2.0 in excess of what's already been agreed going into the June 1 meeting likely will come out of storage on an as-needed basis. Libya will likely lift its current production of ~ 1.3mm b/d close to 1.5mm b/d by year end as well. We are expecting the price-taking cohort ex-OPEC 2.0 to increase production from 53.78mm b/d in April to 53.86mm b/d in December, led by a 860k b/d increase in US output, which will take average Lower 48 output in the US (ex-GOM) to 9.15mm b/d by the end of this year (Chart 3). When we model shale output, our expectation is driven by the level of prompt WTI prices and the shape of the forward curve. The backwardation in the WTI forward curve will limit hedged revenues at the margin, which will limit the volume growth of the marginal producer. We expect global production to slowly increase next year, and the year after that, with supply averaging 101.07mm b/d in 2022 and 103mm b/d in 2023. Chart 3US Crude Output Recovers, Then Tapers in 2023 Demand Should Lift, But Uncertainties Persist We expect the slowdown in realized DM demand to reverse in 2H21, and for oil demand to continue to recover in 2H21 as the US and EU re-open and travel picks up. This can be seen in our expectation for DM demand, which we proxy with OECD oil consumption (Chart 4). EM demand – proxied by non-OECD oil consumption – is expected to revive over 2022-23 as vaccine distribution globally picks up. As a result, demand growth shifts to EM, while DM levels off. China's refinery throughput in April came within 100k b/d of the record 14.2mm b/d posted in November 2020 (Chart 5). The marginal draw in April stockpiles could also signify that as crude prices have risen higher, the world’s largest oil importer may have hit the brakes on bringing oil in. In the chart, oil stored or drawn is calculated as the difference between what is imported and produced with what is processed in refineries. With refinery maintenance in high gear until the end of this month, we expect product-stock draws to remain strong on the back of domestic and export demand. This will draw inventories while maintenance continues. Chart 4EM Demand Will Recovery Accelerates in 2022-23 Chart 8China Refinery Runs Remain Strong COVID-19-induced demand destruction remains a persistent risk, particularly in India, Brazil and Japan. This is visible in the continued shortfall in realized demand vs our expectation so far this year. We lowered our 2021 oil demand growth estimate to ~ 5.3mm b/d y/y, which is down ~ 800k from last month's estimate, given persistent weakness in realized consumption. Our demand forecast for 2022 and 2023 is higher, however, based on our expectation for stronger GDP growth in EM economies, following the DM's outperformance this year, on the back of wider global vaccine distribution year-end (Table 1). Table 1BCA Global Oil Supply - Demand Balances (MMb/d, Base Case Balances) Our supply-demand estimates continue to point to a balanced market this year and into 2022-23 (Chart 6). Given our expectation OPEC 2.0's production-management strategy will remain effective, we expect inventories to continue to draw (Chart 7). Chart 6Markets Remained Balanced Chart 7Inventories Continue To Draw CAPEX Cuts Bite In 2023 In 2023, we are expecting Brent to end the year closer to $80/bbl than not, which will put prices outside the current range we believe OPEC 2.0 is managing its production around (Chart 8). We have noted in the past continued weakness in capex over the 2015-2022 period threatens to leave the global market exposed to higher prices (Chart 9). Over time, a reluctance to invest in oil and gas exploration and production prices in 2024 and beyond could begin to take off as demand – which does not have to grow more than 1% p.a. – continues to expand and supply remains flat or declines. Chart 8By 2023 Brent Trades to /bbl Chart 9Low Capex Likely Results In Higher Prices After 2023 Bottom Line: We are raising our 2021 forecast back to an average of $63/bbl, and our forecasts for 2022 and 2023 to $75 and $78/bbl. We expect DM demand to lead the recovery this year, and for EM to take over next year, and resume its role as the growth engine for oil demand. Longer term, parsimonious capex allocations likely result in tighter supply meeting slowly growing demand. At present, markets appear to be placing a large bet on the buildout of renewable electricity generation and electric vehicles (EVs). If this does not occur along the trajectory of rapid expansion apparently being priced by markets – i.e., the demand for oil continues to expand, however slowly – oil prices likely would push through $80/bbl in 2024 and beyond. Robert P. Ryan Chief Commodity & Energy Strategist rryan@bcaresearch.com Ashwin Shyam Research Associate Commodity & Energy Strategy ashwin.shyam@bcaresearch.com Commodities Round-Up Energy: Bullish The Colonial Pipeline outage pushed average retail gasoline prices in the US to $3.03/gal earlier this week, according to the EIA. This was the highest level for regular-grade gasoline in the US since 27 October 2014. According to reuters.com, the cyberattack that shut down the 5,500-mile pipeline was the most disruptive on record, shutting down thousands of retail service stations in the US southeast. Millions of barrels of refined products – gasoline, diesel and jet fuel – were unable to flow between the US Gulf and the NY Harbor because of the attack, which was launched 7 May 2021 (Chart 10). While most of the system is up and running, problems with the pipeline's scheduling system earlier this week prevented a return to full operation. Base Metals: Bullish Spot copper prices remained on either side of $4.55/lb (~ $10,000/MT) by mid-week following a dip from the $4.80/lb level (Chart 11). We remain bullish copper, particularly as political risk in Chile rises going into a constitutional convention. According to press reports, the country's constitution will be re-written, a process that likely will pave the way for higher taxes and royalties on copper producers.1 In addition, unions in BHP mines rejected a proposed labor agreement, with close to 100% of members voting to strike. In Peru, a socialist presidential candidate is campaigning on a platform to raise taxes and royalties. Precious Metals: Bullish According to the World Platinum Investment Council, platinum is expected to run a deficit for the third consecutive year in 2021, which will amount to 158k oz, on the back of strong demand. Refined production is projected to increase this year, with South Africa driving this growth as mines return to full operational capacity after COVID-19 related shutdowns. Automotive demand is leading the charge in higher metal consumption, as car makers switch out more expensive palladium for platinum to make autocatalysts in internal-combustion vehicles. Ags/Softs: Neutral Corn prices continued to be better-offered following last week's WASDE report, which contained the department's first look at the 2021-22 crop year. Corn production is expected to be up close to 6% over the 2020-21 crop year, at just under 15 billion bushels. On the week, corn prices are down ~ 15.3%. Chart 10 Chart 11 Footnotes 1 Please see Copper price rises as Chile fuels long-term supply concerns published 18 May 2021 by mining.com. Investment Views and Themes Strategic Recommendations Tactical Trades Commodity Prices and Plays Reference Table Trades Closed in 2021 Summary of Closed Trades