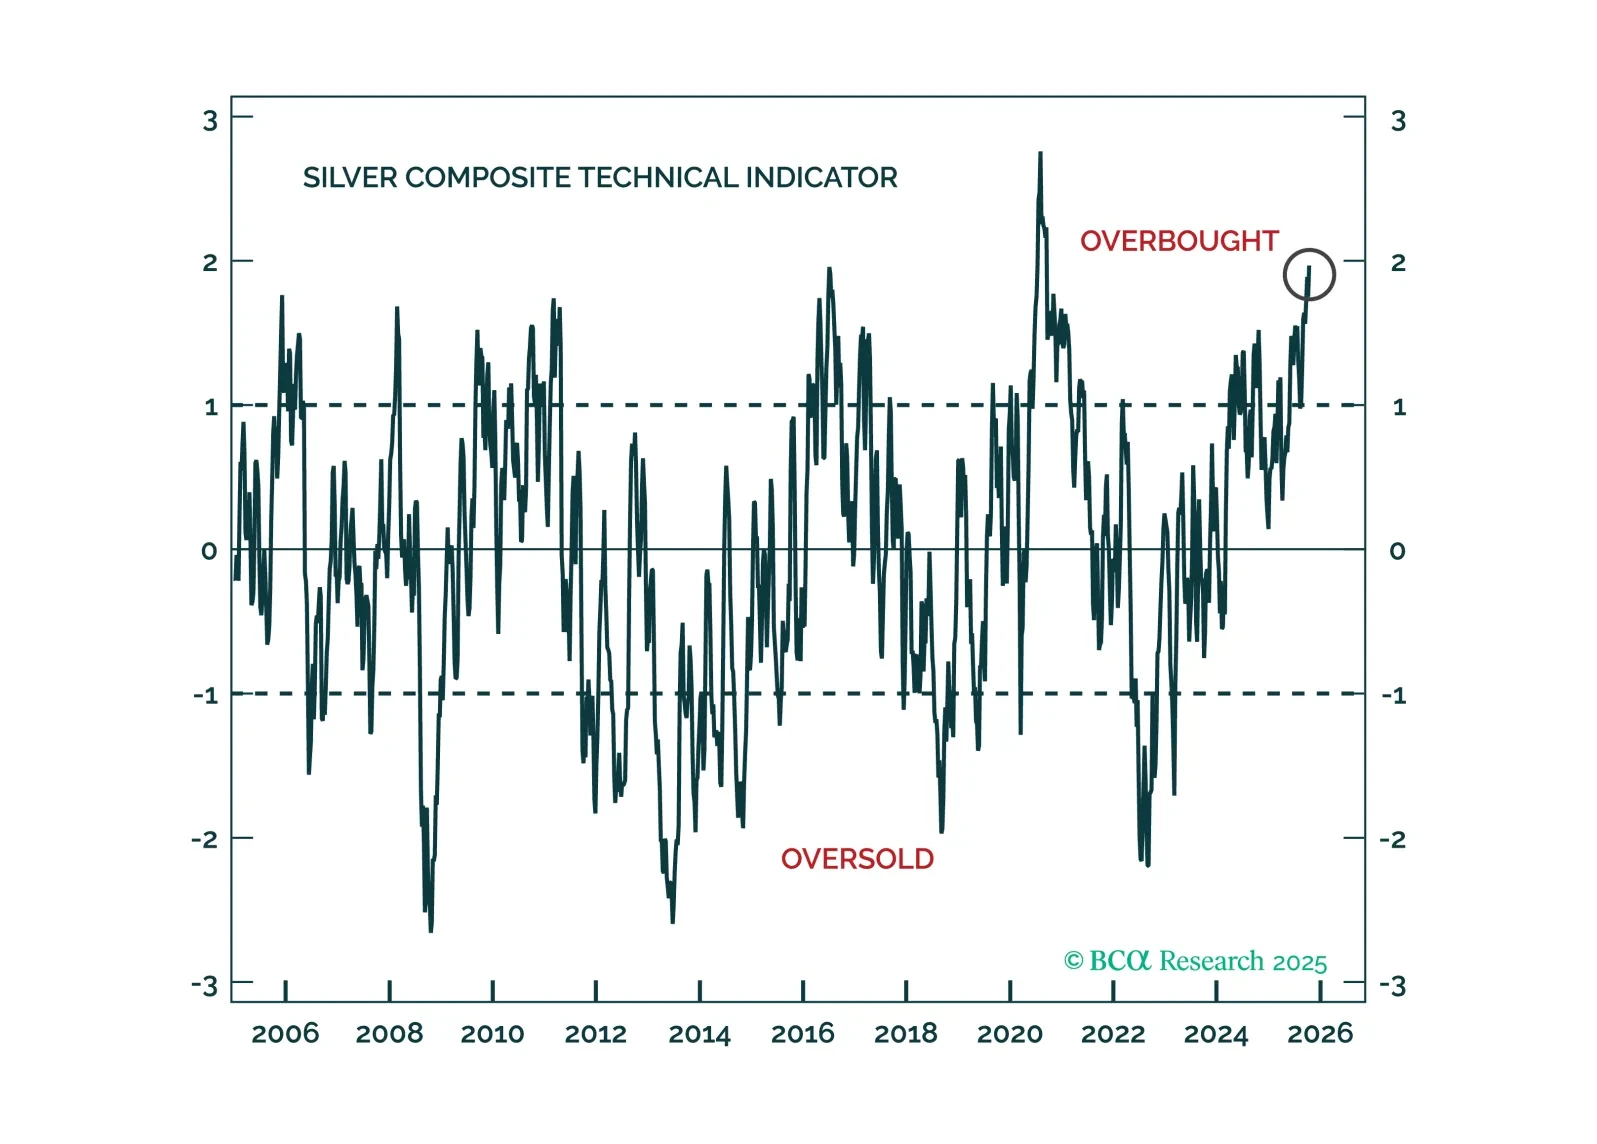
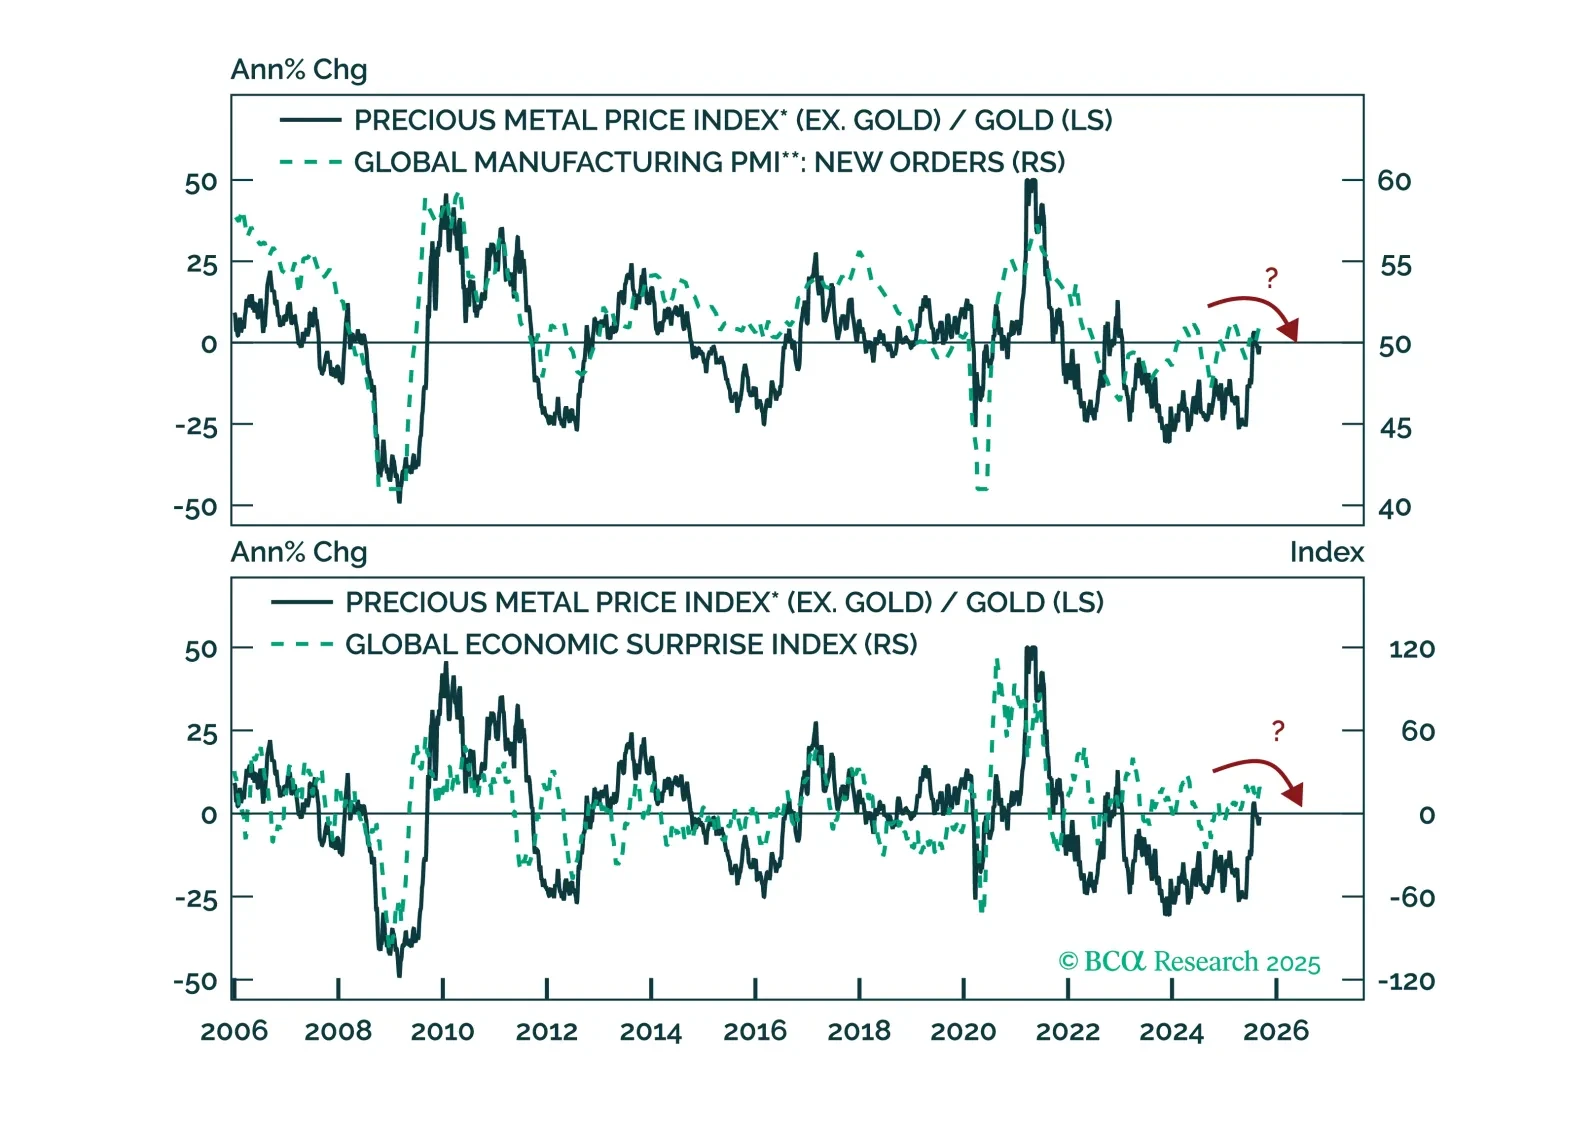
Highlights The dollar is fighting a tug of war between two diverging forces: an economic slowdown around the world but plunging real interest rates in the US. The litmus test for determining which force will gain the upper hand is if the DXY fails to break above the 93-94 level that marked the March highs. So far that appears to be the case. In the interim, investors can capitalize on a few themes that will ultimately unfold: an end to the China slowdown, a bet on real rates staying low for longer, and a play on the Olympics. The expressions of these themes are long AUD/MXN, long silver and long the yen, respectively. Natural disasters are also rising in frequency globally. Historically, this has coincided with rising currency volatility. Long CHF/NZD positions can be a potent play on this trend. We ultimately expect the dollar lower 9-12 months from now. The best currencies to express this view today are NOK and SEK. Feature We are a month into the second half of year, and it is instructive to revisit the dollar view and our roadmap towards year-end. As a starting point, two key themes are propping the dollar on a tactical basis: The first is a global economic slowdown, one that could be exacerbated by increased infections of the COVID-19 Delta variant. The dollar tends to rise in an environment where global growth is weak. This is especially the case when US growth is relatively resilient, like now (Chart I-1). The second is the resilience of the US equity market, not only due to superior earnings, but also as regulatory crackdowns hit shares in China specifically, and emerging markets in general. Equity inflows into the US were a key reason the dollar did not collapse in 2020. Renewed inflows into US equities will be particularly beneficial for the dollar (Chart I-2). This will especially be the case if technology and healthcare earnings keep surprising to the upside. Chart I-1The Dollar And Relative Economic Momentum Chart I-2The US Is Leading The Earnings ##br##Cycle At the same time, real interest rates in the US are very depressed. In its latest meeting, the Federal Reserve reiterated that it will keep running the economy hot, a thesis central to our bearish dollar view. This puts the dollar in a tug of war between two diverging forces: an economic slowdown around the world but plunging real interest rates in the US. Arbitrating The Tug Of War Historically, unless the world economy experiences a recession, the interest rate story has dominated currency market action. Our report last week showed that real interest rates matter for currencies both short term and longer term. Given our bias that global growth will moderate rather than contract, the future path of interest rates will once again become important for currency market action. In this light, lower real rates are negative for the US dollar. How long the outperformance of US equities will last is a tougher call. What we do know is that in a rising interest rate environment, the US equity market has tended to derate relative to the rest of the world. Our base case is that bond yields will be higher globally on a cyclical horizon, suggesting investors should fade the current outperformance of US equities. Scandinavian Currencies As A Strategic Dollar Play The best currencies to express a cyclically lower dollar are the NOK and SEK, for a few reasons other than the strong correlation with the DXY index (Chart I-3): Chart I-3NOK And SEK Are A Play On DXY Economic momentum in both Norway and Sweden is picking up steam. In Norway, high oil prices will be a cyclical boost to the currency, as has been the case historically. Meanwhile, Sweden is benefiting from a strong manufacturing landscape, especially in autos where pricing has skyrocketed due to shortages. While the Swedish manufacturing PMI has moderated recently, it still sits at 65.8, the highest level since the mid-1990s. Both currencies remain very cheap according to our models. Our favored PPP model shows that NOK and SEK are trading at a discount of 20% and 17% respectively, amongst the cheapest in the G10 (Chart I-4). Chart I-4The Dollar Is Expensive Norway, Sweden and Canada are among the countries whose output gaps are expected to close relatively fast (Chart I-5). In the case of Norway (and Canada), the central bank has been vocal about curtailing monetary accommodation, as market conditions improve. The upside surprise in Swedish GDP this week lowers the odds of more monetary accommodation from the Riksbank. This will boost real rates in these countries, supporting their currencies. Chart I-5Output Gaps Across The G10 In a nutshell, if the dollar heads lower 9-12 months from now, this will benefit most procyclical currencies, with the NOK and SEK as winners. The Yen As An Olympian Chart I-6Currencies And The Olympics We made the case last month that the yen was the most underappreciated G10 currency, and that certainly remains true. Since then, there has been improvement in the Japanese economy: The vaccination campaign is progressing smoothly, with 27% of the population having been inoculated from almost nil earlier this year. Meanwhile, about 38% have received at least one dose. This should curtail hospitalizations, despite the increase in new cases. Economic momentum remains tepid, but there are green shoots. Real cash earnings are inflecting higher, which is boosting household spending. There was also remarkable improvement in the Eco Watchers Survey, a sign of optimism among small and medium-sized businesses. Global trade remains strong, which is a boost to the Japanese external sector. While this may slow going forward, it will be a benign headwind. Japan is less exposed to China, a key market for exports, compared to its developed market peers like Australia and New Zealand. Meanwhile, China is already easing policy at the margin. The true catalyst for the yen could be the Olympics. Since the 1970s, the median performance of a currency hosting the Olympics is 4% over a year. The performance of the yen today falls well below the 25th percentile of this performance gap (Chart I-6). This year’s games have obviously been unique given the pandemic but given that the yen is the most shorted G10 currency, this is probably already in the price. It also it does raise the prospect that the yen rises from being an underdog to staging a powerful mean reversion rally. While Japan will not get a tourism boost this summer that will buffet discretionary spending, foreigners are likely to return as the pandemic is put behind us. It is remarkable that Japanese shares, even construction and material companies, that should have benefited from the leadup to the Olympics, have massively underperformed (Chart I-7). This suggests that at the margin, many investors have folded hands and sold Japanese equities indiscriminately. Chart I-7Japanese Shares Have Underperformed Finally, real rates in Japan are among the highest in the G10. This will not only prevent Japanese concerns from deploying yen cash on foreign paper, but could also lead to some repatriation of funds, boosting the yen. Low Real Rates: Buy Silver (And Platinum) The case for buying silver has become compelling, at least on a tactical basis. First, the runup in prices from under $12/oz in March to almost $30/oz in August ushered silver into a well-defined wedge formation, with a series of higher lows. We are now sitting close to the lower bound of this wedge. Given our expectation that any DXY rally will be capped at 93-94, this puts a solid floor under silver prices around the $22-$23/oz level (Chart I-8). This makes for an attractive risk/reward since silver could overtake its 2011 highs near $50/oz, once strong resistance at $30/oz is breached. Second, similar to gold, silver benefits from low interest rates, plentiful liquidity, and the incentive for fiat money debasement. But unlike gold or even cryptocurrencies, physical use for silver is quite elevated. Silver fabrication demand benefits from electronic production (whereby there is a shortage, so it is bound to eventually increase), as well as new green industries such as solar power that are dominating the manufacturing landscape (Chart I-9). Meanwhile, our Commodity & Energy Strategists have flagged that the surplus of silver is expected to shrink significantly this year, driven by both industrial and investment demand (Chart I-10). Chart I-8Buy Some Silver Chart I-9Silver Demand Is Picking Up Chart I-10The Silver Surplus Is Shrinking Third, silver is also a more potent play on a lower dollar. This is because the silver market is thinner and more volatile, with futures open interest at about one-third that of gold. Put another way, volatility in silver has always been historically higher than gold, which is why silver tends to outperform gold when the dollar is falling (Chart I-11). Chart I-11Silver Is A More Potent Play On The Dollar It is worth pointing out that the velocity of money between the US and China is slowing again, suggesting growth is likely to start outperforming outside the US, beyond the current slowdown. The US benefits less from a pickup in Chinese growth, compared to other countries. This has generally pushed the dollar lower and set fire under the silver/gold ratio (Chart I-12). Finally, there is also a case to be made for platinum. It has lagged both gold and palladium prices (Chart I-13). Meanwhile, breakthroughs are being made in substituting palladium for platinum in gasoline catalytic converters. Chart I-12Money Velocity And The GSR Chart I-13Platinum And Silver Have Lagged Gold China Slowdown Almost Over: Buy AUD/MXN Soon We highlighted in February that a tactical opportunity had opened to go short the AUD/MXN cross. With the cross down 11% from its recent highs, an opportunity to go long will soon open up. China has started easing policy at the margin. The AUD/MXN cross correlates quite strongly with the Chinese credit cycle, as Australia is economically tied to China while Mexico depends more on the US (Chart I-14). The Australian PMI has remained quite firm, despite a slowdown in the Chinese credit impulse. Strong commodity prices have been a factor, but it also points to endogenous strength in the Aussie economy. Relative terms of trade favor the Aussie. We had expected terms of trade between Australia and Mexico to relapse on the basis of destocking in China, but that has not been the case (Chart I-15). With oil prices structurally challenged by EVs, while metal prices benefit from the buildout of green infrastructure, terms of trade will remain favorable for the cross longer term. Australian stocks have been underperforming the more defensive Mexican bourse (Chart I-16). This should reverse as cyclicals start to regain the upper hand. Chart I-14AUD/MXN Tracks Chinese Credit Chart I-15AUD/MXN And Terms Of Trade Chart I-16AUD/MXN And Relative Equity Prices The timing for a long position is tricky as Chinese economic activity is likely to slow in the coming months, and cyclical equities could remain under pressure. Meanwhile, as value investors, we are also uncomfortable with AUD/MXN valuations. This suggests that in the very near term, short positions still make sense. That said, the 13-14 zone should provide formidable support to go long, an opportunity likely to unfold in the next 3 months (Chart 17). Chart I-17AUD/MXN And Momentum A Final Thought On Rising Catastrophes We have been watching with obvious trepidation the rising incidence of catastrophes globally. The occurrence of weather events such as droughts, floods, storms, cyclones, and wildfires has been skyrocketing (Chart I-18). Chart I-18Disasters And Volatility The direct play is to buy global construction and machinery stocks that are likely to benefit from increased reconstruction activity. It also favors agricultural futures. As for currency markets, the one observation is rising volatility with the VIX having spiked significantly in the years with numerous weather events. We are already long CHF/NZD and the yen as a play on rising currency volatility, and we will be exploring this thesis more deeply in future publications. Chester Ntonifor Foreign Exchange Strategist chestern@bcaresearch.com Currencies U.S. Dollar Chart II-1USD Technicals 1 Chart II-2USD Technicals 2 Data out of the US this week was relatively robust: The Markit manufacturing PMI for July edged up from 62.1 to 63.1. That said, the services PMI fell from 64.6 to 59.8. Durable goods orders were rather weak, rising 0.8% year on year in June, versus a consensus of a 2.2% increase. Admittedly, the core non-defense measure, excluding aircraft and parts, rose by 0.5% from 0.1%. Consumer confidence remains resilient, rising from 127.3 to 129.1 in July, well above expectations. Q2 GDP came in at 6.5% quarter on quarter, versus an 8.4% consensus. The US dollar DXY index fell this week. The Fed meeting highlighted that the authorities are in no rush to tighten monetary policy, despite what has been a robust recovery in labor market conditions and inflation. The aftermath of the meeting saw a drop in US real yields and the dollar. The Fed’s dovish stance has been a central theme to our bearish dollar view. Report Links: Arbitrating Between Dollar Bulls And Bears - March 19, 2021 The Dollar Bull Case Will Soon Fade - March 5, 2021 Are Rising Bond Yields Bullish For The Dollar? - February 19, 2021 The Euro Chart II-3EUR Technicals 1 Chart II-4EUR Technicals 2 Data out of the eurozone this week softened: The manufacturing PMI fell to 62.6 in July from 63.4. The services PMI surprisingly improved, rising from 58.3 to 60.4 in July. Economic confidence rose from 117.9 to 119 in July. The German IFO survey was below consensus in July, but the expectations component did rise from 99.6 to 100.4. The euro rose by 1% this week. We went long the euro at 1.18 on expectations that at the margin, monetary policy in the euro area will shift in a more hawkish fashion. Since then, the ECB has adopted a symmetric inflation target, promising to keep interest rates low for longer. The euro’s indifference to this dovish development suggests a strong floor under the currency, and upside should euro area growth beat consensus. Report Links: Relative Growth, The Euro, And The Loonie - April 16, 2021 The Euro Dance: One Step Back, Two Steps Forward - April 2, 2021 On Japanese Inflation And The Yen - January 29, 2021 The Japanese Yen Chart II-5JPY Technicals 1 Chart II-6JPY Technicals 2 Japanese data was rather mixed this week: The Jibun manufacturing PMI eased slightly in July, to 52.2 from 52.4. The services component also fell to 46.4. Department store sales came in at 3.7% year on year in June. We highlighted last week that supermarket sales also remain strong. The yen was up 0.4% against the dollar this week. In the history of the Olympics, the incumbent currency has tended to rise over the course of the year. Given the yen is the most shorted developed-market currency currently, this sets it up for a coiled spring rebound. Report Links: The Case For Japan - June 11, 2021 The Dollar Bull Case Will Soon Fade - March 5, 2021 On Japanese Inflation And The Yen - January 29, 2021 British Pound Chart II-7GBP Technicals 1 Chart II-8GBP Technicals 2 There were some mixed data out of the UK this week: Retail sales in the UK were in line with expectations. The measure excluding automobiles and fuel rose by 7.4% year on year in June. The PMIs generally slowed from very strong levels. The manufacturing print for July was 60.4, while the services component came in at 57.8. House price inflation remains strong, with the nationwide measure coming in at 10.5% year on year in July. Mortgage approvals fell slightly in June but remain at a robust 81.3K. The pound rose by 1.5% this week. The big surprise in the UK has been a reversal in the COVID-19 infection rate, despite an economy that is reopening quite briskly. This sets cable up for a volatile few weeks and months, given a poor technical picture (speculations are cutting long positions from very aggressive levels). We like GBP long term but will stand aside for now. Report Links: Why Are UK Interest Rates Still So Low? - March 10, 2021 Portfolio And Model Review - February 5, 2021 Thoughts On The British Pound - December 18, 2020 Australian Dollar Chart II-9AUD Technicals 1 Chart II-10AUD Technicals 2 The inflation report in Australia was in line with expectations for Q2: Headline CPI rose from 1.1% to 3.8%. The trimmed mean and median measure came in at 1.6% and 1.7% respectively. The AUD was flat this week, the worst performing G10 currency. The dominant story remains the renewed restrictions from a resurgence in COVID-19, particularly in Sydney. That said, weakness in AUD is starting to create an attractive reward/risk profile. Speculators are net short the Australian dollar, and our bias is that there has been spillover pressure from the recent turmoil in Asian/Chinese markets. In the end, this only makes for a coiled spring rebound in the AUD. Report Links: The Dollar Bull Case Will Soon Fade - March 5, 2021 Portfolio And Model Review - February 5, 2021 Australia: Regime Change For Bond Yields & The Currency? - January 20, 2021 New Zealand Dollar Chart II-11NZD Technicals 1 Chart II-12NZD Technicals 2 The was scant data out of New Zealand this week: The trade balance came in at NZ$261 million, even with stronger imports in June. The ANZ activity outlook index fell in July, to 26.3 from 31.6. The NZD was up 0.5% this week. The strong rally in NZD after a hawkish RBNZ a fortnight ago continues to fade. This week, we highlighted a new theme, which is the rising incidence of natural disasters. Historically, this has been great for agricultural prices, benefiting NZD. But it has also been accompanied by a tremendous rise in currency volatility, which hurts the NZD vis-à-vis safe-haven currencies. We are currently long CHF/NZD and will be exploring this theme in future publications. Report Links: How High Can The Kiwi Rise? - April 30, 2021 Portfolio And Model Review - February 5, 2021 Currencies And The Value-Versus-Growth Debate - July 10, 2020 Canadian Dollar Chart II-13CAD Technicals 1 Chart II-14CAD Technicals 2 Data out of Canada this week has been mixed: Retail sales fell month on month in May by 2.1% but this was above expectations. Inflation remains robust. Headline CPI was 3.1%, while the core trim, median and common measures came in at 2.6%, 2.4% and 1.7% respectively. The CAD rose by 0.8% this week. The backdrop for the loonie remains positive as the Bank of Canada is leaning against monetary accommodation by tapering asset purchases, and signaling interest rate increases, while the Fed remains on hold. These pin real interest rate differentials in favor of the loonie. Report Links: Relative Growth, The Euro, And The Loonie - April 16, 2021 Will The Canadian Recovery Lead Or Lag The Global Cycle? - February 12, 2021 The Outlook For The Canadian Dollar - October 9, 2020 Swiss Franc Chart II-15CHF Technicals 1 Chart II-16CHF Technicals 2 There was scant data out of Switzerland this week: Investor confidence from the Credit Suisse survey fell in July, from 51.3 to 42.8. Total sight deposits were unchanged at CHF 712 bn for the week of July 23. The Swiss franc was up 1.3% this week. Incoming Swiss inflation data next week will dictate whether the SNB steps up the pace of FX intervention. So far, there have been no big moves in the CHF exchange rate to implore central bank attention. A rebound in global bond yields will be a welcome relief since the franc tends to weaken in that environment. For the time being, we believe volatility can continue to rise. As such, the franc will benefit, justifying long CHF/NZD bets. Report Links: An Update On The Swiss Franc - April 9, 2021 Portfolio And Model Review - February 5, 2021 The Dollar Conundrum And Protection - November 6, 2020 Norwegian Krone Chart II-17NOK Technicals 1 Chart II-18NOK Technicals 2 There was scant data out of Norway this week: Retail sales were flat month on month in June. The NOK was up 1% this week. Our limit buy on Scandinavian currencies was triggered a fortnight ago, nudging us in the money with this week’s currency moves. We are not fighting the Norges Bank, which has signaled they will increase interest rates this year, ahead of both the Federal Reserve and the ECB. As such, we are short EUR/NOK and USD/NOK. Report Links: The Norwegian Method - June 4, 2021 Portfolio And Model Review - February 5, 2021 Revisiting Our High-Conviction Trades - September 11, 2020 Swedish Krona Chart II-19SEK Technicals 1 Chart II-20SEK Technicals 2 Recent data from Sweden have been improving: The PPI for July came in at 9.6%, up from 7.9%. The June trade balance showed a healthy surplus of SEK 10.3 billion. The economic tendency survey for July came in at 122.4 from 119.8. Manufacturing confidence continues to inflect higher, rising from 125.2 to 129.2 in July. The SEK was the strongest performing G10 currency this week, rising 1.5%. Swedish Q2 GDP was a welcome positive surprise, up by 10.5% year on year and 0.9% quarter on quarter. This is paring back expectations of more stimulus from the Riksbank. We have been highlighting that SEK remains one of our most potent plays on a global growth recovery. As such, we are short EUR/SEK and USD/SEK. Report Links: Revisiting Our High-Conviction Trades - September 11, 2020 More On Competitive Devaluations, The CAD And The SEK - May 1, 2020 Sweden Beyond The Pandemic: Poised To Re-leverage - March 19, 2020 Trades & Forecasts Forecast Summary Core Portfolio Tactical Trades Limit Orders Closed Trades