Food Retail
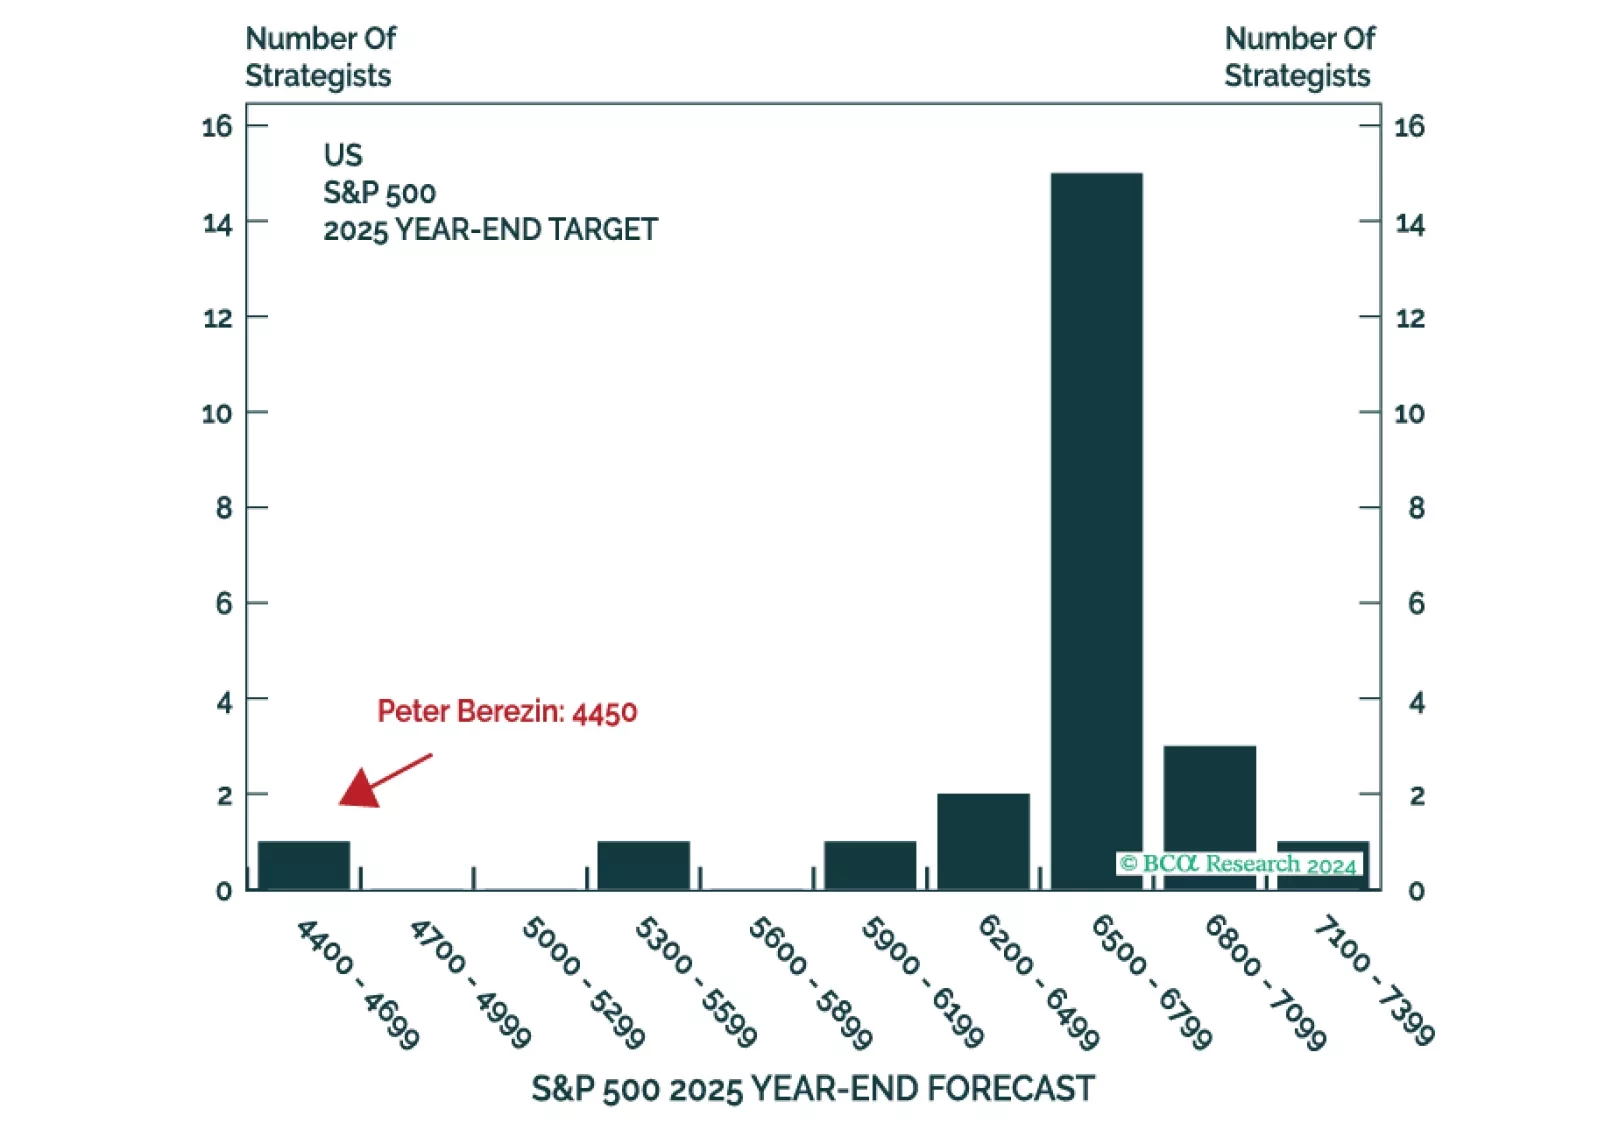
This is the time of the year when strategists are busy sending out their annual outlooks. Here on the Global Investment Strategy team, we decided to go one step further. Rather than pontificating about what could happen in 2025, we decided to harness the power of the multiverse to tell you what did happen (in at least one highly representative timeline).
Next week, please join me for a Webcast on Tuesday, December 17 at 10:30 AM EST (3:30 PM GMT, 4:30 PM CET) to discuss the economy and financial markets.
And with that, I will sign off for the year. I wish you and your loved ones a very happy and healthy 2025. We will be back in the first week of January with our MacroQuant Model Update.

US retail sales beat expectations in September, rising 0.4% from August when growth was essentially flat. The control group also beat expectations at 0.7% month-on-month, accelerating from 0.3%. Growth was however somehow weak on an annual basis, suggesting a…
High food and fertilizer prices could morph into food crises in several developing nations. A Special Report from our Emerging Markets Strategy team reckons that Lebanon, Egypt, Kenya, Peru, Pakistan, and Sri Lanka are most at-risk of slipping into a food…

Executive Summary Increase In Chinese Ag Prices Has Been Much More Muted Than Globally China’s food price inflation accelerated in April. The rising cost of global agricultural goods and domestic COVID-related disruptions in the supply-chain contributed to a sharp bump in food prices last month. China is not overly reliant on food imports. The country is also well stocked with grain reserves and should weather ongoing global food supply shortages, particularly wheat, better than most emerging economies. However, China will still be impacted by escalating prices of global agricultural products and energy. Some imported goods (e.g. soybeans and related products) that China relies on, coupled with higher energy costs and a bottoming in China’s pork prices, will continue to push up food prices and headline inflation. Higher reading in headline inflation will not change the direction of the PBoC’s monetary policy. However, more expensive food will dampen Chinese households’ spending power on non-food consumer goods, especially as income growth slows. The food and beverage sector in China’s onshore stocks will benefit from higher food costs. We are initiating a new trade: long domestic consumer staples/broad A-share market. CYCLICAL RECOMMENDATIONS (6 - 18 MONTHS) INITIATION DATE RETURN SINCE INCEPTION (%) COMMENT LONG DOMESTIC CONSUMER STAPLES/BROAD A-SHARE MARKET 05/18/2022 Bottom Line: Despite China’s solid self-sufficiency in food supplies, its food price inflation is not immune from the mounting prices of global agricultural products. Is China’s Food Price Inflation Transitory? The food component of China’s consumer price index (CPI) increased by 0.9% in April compared with the previous month, a sharp reversal from a 1.2% month-over-month decline in March. Higher food and energy prices pushed headline CPI to 2.1% in April, the fastest year-on-year growth since August 2020. China is not overly reliant on food imports and has abundant grain reserves. The country is in a better position to weather ongoing global supply shortages in grain compared with other emerging economies, such as the Middle East and North Africa. Moreover, agricultural product prices in China have been structurally higher than those traded in the global commodity market. Large margins in China’s bulk agricultural pricing provide a cushion from escalating global food prices. Nonetheless, China remains at risk for higher food prices this year. Elevated oil prices and the war in Ukraine will further lift the price of fertilizers, adding to input costs for agricultural products. A strong USD will add to the price of USD-denominated commodity imports, particularly soybeans. In addition, China’s domestic pork price may have reached its hog cycle bottom and will pick up in the second half of this year. Food Prices Are Driving Up Inflation China’s headline CPI accelerated to 2.1% in April, on a year-on-year basis, from 1.5% in the previous month. Even though pork prices plunged by 33% in April from a year ago, food prices grew by 1.9% and have been boosted by a jump in the cost of fresh food, such as vegetables (+24% year-on-year), fruit (+14%) and eggs (+12%). Prices in other food categories, such as grains and edible oil, also rose, albeit more modestly (Chart 1A and 1B). Chart 1ALarge Jump In Fresh Food Prices In April Chart 1BOther Food Prices Also Picked Up, But More Modestly China’s strict COVID-19 containment measures have had a broad-based impact on food supplies. Mobility restrictions, roadblocks and risk-averse truck drivers introduced significant challenges in food supplies and transportation. Lockdowns in some large urban areas also led to panic buying and stockpiling among consumers, pushing up demand. Chart 2Increase In Chinese Ag Prices Has Been Much More Muted Than Globally Meanwhile, higher global food and energy prices have likely both directly and indirectly contributed to food price inflation in China. The UN Food and Agriculture Organization (FAO) Food Price Index in April this year leapt to its highest level since its inception in 1990; it is 30% higher than last year and nearly double from its trough in mid-2020. Although price increases in China’s domestic agricultural products have been more moderate, the country’s agricultural wholesale prices have jumped by 10% from a year ago (Chart 2). Bottom Line: Food accounts for about 20% of China’s CPI basket (Chart 3). Climbing food, along with energy, prices are driving up China’s headline inflation. Chart 3Food Accounts For 20% Of Chinese Household Budgets China Is In A Good Position To Weather Global Food Supply Shocks … Chart 4Ex-China Food Inventories Haven’t Been Built China is well stocked with food reserves and does not rely on imports for most of its agricultural supplies. Thus, the country should weather ongoing global shortages in the food supply better than most emerging economies (Chart 4). China’s food inventories are significantly higher than levels in the 2006-2008 and 2010-2012 global food price hikes (Chart 5). The nation’s inventories have been steadily building up in the past decade to avert potential food supply shortages. Corn and rice stocks are sufficient to cover consumption for nearly three quarters of a year and wheat stocks are at nearly a year’s worth of consumption. Chart 5China Has Been Building Up Inventories To Buffer Against Supply Shortfalls Chart 6China Is Not Overly Dependent On Ag Imports Furthermore, with the exception of soybeans, China is not overly dependent on imports for agricultural supplies (Chart 6). The country is self-sufficient in supplying rice, wheat, and corn, three major staples in China’s grain consumption basket. Less than 5% of China’s total consumption of the three staple grains comes from imports. Bottom Line: China is well stocked with agriculture products and is not overly dependent on imports for its food supplies. … But Not Immune To Food Price Hikes Worldwide Chart 7Ag Products Are Traded At Higher Prices In China Than In The Global Market Rising global agricultural and energy prices could still push up the country’s food price inflation. In USD terms, prices of China’s domestic agricultural products have been structurally higher than those traded on global commodity markets (Chart 7). The government heavily regulates and subsidizes its agricultural procurement prices as an encouragement to domestic farmers. When global food supply shocks sharply pushed up agricultural prices worldwide, China’s domestic agricultural prices, with their large buffer versus global food prices, rose more moderately. Nonetheless, China’s domestic food prices are not insulated from worldwide price hikes. China is facing higher inflation in food prices this year for the following reasons: Pork prices, which account for 13% of China’s CPI food basket, have likely bottomed. Although pork prices remain in a deep contraction year-over-year, they rebounded sharply in April on a month-on-month basis (Chart 8). The number of sows peaked in mid-2021 and has been declining for the past 10 consecutive months. Falling sow numbers have historically led to rising pork prices (Chart 9). Chart 8Pork Prices May Have Bottomed Chart 9Pork Prices Will Likely Increase In 2H22 Nearly 90% of China’s soybean consumption relies on imports, making the country vulnerable to external price fluctuations. Soybean prices have jumped sharply this year. A stronger USD will also add to the price of USD-denominated commodity imports. About 80% of Chinese soybeans are crushed to produce meal to feed China’s massive pork industry, which means higher soybean prices will indirectly lead to rising pork prices by boosting input costs. Given that pig output is approaching its cyclical bottom, an increase in pig livestock would mean more demand for soybeans. Chart 10Edible Oil Prices Reached Their Highest In Decades Growing prices in soybeans and corn will lift the cost of cooking oil, which represents about 8% of China’s food CPI basket (Chart 10). Ukraine supplies 30% of China’s corn imports, and Russia and Ukraine together account for nearly 20% of China’s soybean oil imports. China ramped up corn imports from Ukraine through March despite the war and snapped up large volumes of US corn in April after supplies from Ukraine were cut off. Nonetheless, prices of soybeans and corn will likely remain elevated with no end in sight to the Russia-Ukraine war and supply shortages globally. In addition, as global travel becomes more popular and oil prices remain elevated, the demand for corn-based ethanol, which is blended with gasoline, will also expand. Wheat prices will continue to experience upward pressure in the global market, mainly due to reduced production and exports from Ukraine and Russia (these countries account for 30% of world’s wheat exports). The World Bank forecasts that wheat will be 40% more expensive this year, reaching an all-time high in nominal terms.1 Although China is about 96% self-sufficient in wheat, the upsurge in global prices has boosted China’s domestic cost for wheat; it climbed by 15% in May from a year ago (Chart 11). Higher shipping and input costs, especially for fertilizers, will exacerbate the upside price pressures on agricultural goods. China is the world’s largest exporter of phosphate fertilizer, but its domestic fertilizer prices are heavily subsidized and much cheaper than exported ones (Chart 12). However, the domestic cost of fertilizer will likely follow the lead of rising global prices for fertilizers and agricultural products. Chart 11Chinese Wheat Prices Jumped Against The Backdrop Of Global Supply Shortages Chart 12China's Domestic Fertilizer Prices Will Likely Trend Up The relationship between agricultural prices and the dollar broke down early last year (Chart 13). Historically, a strong USD would weigh down agricultural prices by encouraging ex-US producers to raise exports and boost global supplies. However, the COVID pandemic and war in Ukraine have triggered a global surge in government controls on food exports. Such broad enforcement of protectionist measures will continue to exacerbate worldwide inflationary pressures on food. Chart 13The Inverse Relationship Between Global Ag Prices And The Dollar Has Broken Down Bottom Line: China’s food prices face upward pressure. Strengthening global prices in a wide range of agricultural products, coupled with higher energy costs and a bottoming in China’s pork prices, will all contribute to higher food price inflation in the country. Investment Conclusions Chart 14Core CPI Remains Subdued Food price inflation should not constrain the PBoC from further easing monetary policy. As mentioned in previous reports, China’s monetary policy framework has shifted away from headline CPI and has been anchored in core CPI, which has remained subdued (Chart 14). However, China’s accelerating food and energy prices, as household income growth is slowing, will lower households’ purchasing power and curb their demand for non-food consumer goods and services. While China’s overall consumption and economy will suffer from higher food price inflation, soaring food prices will help to widen the profit margins among food processing firms (Chart 15). Furthermore, food and beverage companies in China’s onshore equity market have one of the highest ROAs and the lowest financial leverages (Chart 16). We are initiating a new trade: long Chinese onshore consumer staples/short broad A-share market. Chart 15Long Chinese Onshore Consumer Staples... Chart 16...As The Sector Will Benefit From Rising Food Prices Jing Sima China Strategist jings@bcaresearch.com Footnotes 1 The World Bank’s Commodity Markets Outlook Report, April 2022. Strategic Themes Cyclical Recommendations
Highlights Portfolio Strategy The consumer staples recovery is sales-driven, underscoring that additional outperformance lies ahead. The lagging hypermarkets and retail food industries are starting to play catch up, reflecting a shift in consumer spending patterns. Use the drubbing in air freight shares to upgrade to overweight. Recent Changes S&P Air Freight & Logistics - Upgrade to overweight from neutral. Table 1Sector Performance Returns (%) Feature Equities caught a bid last week, after holding at the bottom end of their tactical trading range. The overall consolidation phase likely has further to run, but should ultimately be resolved in a positive fashion. Chart 1Ongoing Margin Expansion Real economic performance continues to lag relative to exuberant 'soft' economic survey data, while the odds of meaningful pro-cyclical U.S. fiscal largesse fade. Inflation expectations are softening as commodity prices dip, while the yield curve is narrowing. These factors are likely to sustain ambiguity about the durability and strength of the expansion. But in the background, the corporate sector continues to heal slowly, aided by the hiatus in the U.S. dollar bull market. The latter is enabling some corporate pricing power revival. Our pricing power diffusion index has surged alongside our pricing power proxy (Chart 1, second panel). The broadening of selling price inflation bodes well for the sustainability of corporate sector pricing power gains. We have updated our industry group pricing power gauges (see Table 2), comprising the respective CPI, PPI, PCE and commodity year-over-year changes for 60 industry groups. The table details the most recent annual and 3-month pricing power trends and each industry's spread to overall inflation in order to identify potential profit winners and losers. Our analysis reveals that ¾ of the industries tracked are experiencing rising selling prices, and half are also besting overall inflation rates. Only 14 of 60 industries are in outright deflation, versus 19 in January and 23 last September. Importantly, 31 of 60 industry groups are enjoying a rising pricing trend, a 50% increase from last quarter, 9 are moving laterally and only 20 are fading. The implication is that upward momentum in pricing power is gathering steam. Importantly, the rate of selling price inflation is outpacing wage bill growth, which heralds some incremental near-term torque for profit margins (Chart 1, bottom panel). Are there any themes of note? Cyclical sectors continue to dominate the table with energy and materials taking the top two spots, although recent corrective action in the commodity pits suggests that these gains may peter out. The technology sector is a notable exception within deep cyclicals, as most tech sub-groups still have to slash prices (Table 2). Early cyclicals (or interest rate-sensitives) also show strength, with banks, insurers, and media-related groups managing to lift selling prices at a decent rate. Select defensives like health care and utilities are expanding pricing power, but the overall consumer staples and telecom services sectors are lagging. Table 2Industry Group Pricing Power Adding it all up, there are tentative signs that the profit advantage may be starting to slowly shift away from defensives. In that light, we are closely monitoring several factors that could expedite a transition to a more balanced portfolio from our current defensive bias. First, the gap between hard and soft data remains unusually wide (Chart 2). The longer hard data takes to play catch up, the less likely the Fed will be re-priced more aggressively. History shows that until this gap narrows, defensive sectors are likely to retain the upper hand in terms of relative performance (Chart 2), while financials could continue to languish owing to uncertainty about the path of future Fed policy. Second, commodity prices and the U.S. dollar - especially versus emerging market (EM) currencies - are still signaling that the cyclical/defensive ratio has more downside (Chart 3). Finally, within the context of the current broad equity market consolidation, it should continue to pay to remain with a defensive over cyclical portfolio tilt for a little while longer (Chart 4, top panel). Chart 2The Gap ##br##Is Closing Chart 3Monitoring The U.S. ##br##Dollar And Commodities1 Chart 4Stick With Defensives##br## For A While Longer Nevertheless, we will likely use this phase to make additional portfolio adjustments. The wide gap between emerging/developing markets performance and the cyclical/defensive share price ratio has narrowed significantly year-to-date, suggesting that defensive outperformance may be in the late stages. In sum, equity markets are in a transition phase and we are further tweaking our intra-industrials positioning after using recent underperformance to upgrade to neutral. We are also updating our high-conviction consumer staples view, and two unloved staples sub-groups. The Consumer Staples Sector Remains Appealing As part of this year's defensive sector leadership, the consumer staples sector has confounded its critics and registered a solid year-to-date relative performance gain. We expect additional near-term upside on the back of both internal and external drivers. Consumer staples companies are enjoying a revenue renaissance. Domestically, non-discretionary retail sales are gaining market share from discretionary outlays (Chart 5), reflecting consumers structurally ingrained propensity to save vs. spend since the financial crisis. Even exports are contributing to rising revenues, despite the U.S. dollar's appreciation (Chart 5). Easing monetary conditions in the emerging markets are underpinning domestic demand, benefiting U.S. staples exporters. Improving demand and cost containment are boosting operating profit margins (Chart 5, fourth panel). This should ensure that the sector continues to register meaningful free cash flow growth, a refreshing difference with the overall corporate sector. Meanwhile, external factors also point to a further relative performance recovery. The bond-to-stock ratio is joined at the hip with relative performance momentum, and a mean reversion phase is unfolding (Chart 6). Geopolitical uncertainty, the risk of a cooling in economic momentum following the downturn in the Economic Surprise Index could fuel flows into this non-cyclical sector. Chart 5Domestic And International##br## Positive Demand Drivers Chart 6Financial Variables ##br##Reinforce Staples Bid There is both valuation and technical motivation for capital inflows. Chart 6 shows that our Technical Indicator has troughed near one standard deviation below the historical mean. Every time this has occurred in the last decade, a sizable relative share price recovery has ensued. There are no valuation roadblocks, countering the assertion that defensive sectors are all overvalued in relative terms (Chart 6). As a result, this sector remains a high-conviction overweight, especially with two previous lagging groups now exhibiting signs of a recovery. Hypermarket Green-Shoots The hypermarkets industry is sprouting a number of green-shoots that should further propel the recent advance in relative share price performance. The industry is enjoying profit margin support on two fronts. Import prices are still deflating (Chart 7), and the nascent rebuilding in Asian manufacturing inventories suggests that pricing pressure will persist. On the revenue front, Wal-Mart recently noted that store traffic continues to improve, albeit aided by discounting. A tight labor market is supporting aggregate wage growth, especially those in lower income brackets, which is supportive of total hypermarkets sales. Importantly, the need to slash prices to attract more customers should abate courtesy of improving demand. The overall retail sales price deflator has climbed into positive territory. Hypermarket sales growth is highly correlated with overall retail selling price inflation (Chart 8). Chart 7Input Costs Will Remain Contained Chart 8Low Profit Hurdle At least some of the improvement in pricing power reflects an easing in food industry deflation, which implies that the intensity of price wars with food retailers will diminish. Total outlays on food and beverages are climbing as a share of total consumer spending after falling for six consecutive years (Chart 8). These elements are captured by our hypermarkets earnings pressure gauge, which is signaling a rosier sales and EPS growth backdrop (Chart 8, fourth panel). If the border adjustment tax continues to lose momentum, the risk premium for this group should narrow. Food Retailers Are Down, But Not Out Elsewhere, the drubbing in food retailers looks overdone. The relative share price ratio is at a multi-decade low. Investor fears have concentrated on industry selling price deflation, which has weighed on already razor thin profit margins. Nevertheless, a turnaround is afoot, and we would lean against extreme bearishness. As noted previously, consumer spending on food and beverages are gaining a foothold relative to overall outlays. That is supporting a reacceleration in grocery store same-store sales. With the unemployment rate this low, wage inflation is expected to sustain recent gains. Rising incomes are synonymous with higher consumer spending power. Thus, the rebound in industry sales has more upside (Chart 9). The upshot of consumers' increased food appetite is that the food CPI is exiting deflation (Chart 10). That should go a long way in allaying investor profit margin concerns. Chart 9Buy The Wash ##br##Out In Food Retailers... Chart 10...Because The Deflation##br## Threat Is Diminishing Previous pricing pressure forced grocers to refocus on productivity. The industry's total wage bill has cooled significantly. Our productivity proxy, defined as sales/employee, is accelerating, hitting growth rates last seen more than five years ago, when share prices were trading at much higher valuations (Chart 10). Bottom Line: We reiterate our overweight stance both in the S&P hypermarkets and the compellingly valued S&P food retail index. The ticker symbols for the stocks in these indexes are: WMT, COST and KR, WFM, respectively. Air Freight Stocks Will Spread Their Wings The sell-off in transportation stocks has progressed to the point where pockets of value are materializing. Specifically, air freight and logistics stocks have been pummeled, trading down to the bottom of their post-GFC trading range (Chart 11). This is a playable opportunity. Relative performance has returned to levels first reached in the depths of the GFC. Bears have pushed valuations and technical conditions to extremely washed out levels. Both the forward P/E and price-to-sales ratios have collapsed, trading significantly below their historical means and at a steep discount to the S&P 500 (Chart 11). To be sure, a number of forces have fueled the selling. Industry activity is running below capacity, as evidenced by weakness in industry average weekly hours worked (Chart 11). The loss of momentum in internet sales compared with bricks and mortar retail sales may be causing some concern about the pace of future land deliveries (Chart 11). Walmart's news that it is offering an in-store pick up option for online orders has also spooled investors. Amazon's push for its own delivery service is a longer-term yellow flag. Nevertheless, deeply discounted valuations and depressed earnings growth expectations imply that these drags are already reflected in prices. In fact, more recently analysts have pushed the net earnings revision ratio back into positive territory. We expect additional upside as global trade improves. While we were concerned about global trade last November when we downgraded to neutral, there is more evidence now that global revenue ton miles will reaccelerate. The surge in BCA's boom/bust indicator and advance in the business sales-to-inventories (S/I) ratio are both signaling that global trade will continue to recover (Chart 12). The sustainability of the S/I improvement looks solid. The global manufacturing PMI has shot higher on the back of a synchronized developed and emerging market final demand improvement, which heralds accelerating global export volumes (Chart 12). hiatus in the U.S. dollar bull market has also provided much needed reflationary relief to the emerging world. We expect these global forces to overwhelm recent domestic freight demand concerns. Importantly, global exports have been positively correlated with air freight pricing power and the current message is to expect price hikes to stick (Chart 13, third and fourth panels). Keep in mind that air freight companies typically command greater pricing power when the supply chain is lean and lead times begin to lengthen, because companies will pay up to ensure product/parts availability. Chart 11Grim News Is Well Discounted Chart 12Recovering Global Trade... Chart 13...Is A Boon To Air Freight Pricing Power In sum, a durable recovery in global trade should ignite an earnings led relative outperformance phase in the S&P air freight & logistics index. Bottom Line: Boost exposure to overweight in the S&P air freight & logistics sub-group. The ticker symbols for the stocks in this index are: BLBG: S5AIRFX - UPS, FDX, CHRW, EXPD. Current Recommendations Current Trades Size And Style Views Favor small over large caps and stay neutral growth over value.
Highlights Portfolio Strategy Retail food stocks are deep into the buy zone. Deflating food costs augur well for profit margins in the coming quarters. Lift the financial sector to neutral, via the asset manager and investment bank indexes. Recent Changes S&P Financials Sector - Raise to neutral, recording a loss of 8%. S&P Asset Manager & Custody Bank Index - Raise to overweight from underweight, locking in a profit of 5%. S&P Investment Bank & Brokerage Index - Raise to neutral, recording a loss of 3%. Table 1Sector Performance Returns (%) Equity markets celebrated the surprise Republican U.S. election victory. Investors believe the regime shift will entail fiscal stimulus and a lifting in regulatory constraints that stir animal spirits and lift the economy out of its growth funk. The reality is that it is premature to make long-term assumptions. Meanwhile, the underlying fragility of the U.S. economic expansion will be tested in the coming quarters. Indeed, it is easy to envision a hit to business confidence, causing delays in decision making and investment, especially given Trump's anti-trade rhetoric and penchant for profligacy. Policy uncertainty and confidence have been reliable leading indicators for valuations, and slippage would put upward pressure on the Equity Risk Premium (Chart 1). It will be critical to monitor aggregate financial conditions. The Goldman Sachs Financial Conditions index has tentatively edged up (Chart 1), and if corporate bond spreads, long-term yields and the U.S. dollar move much higher, upside risks will intensify. The low level of overall potential growth has made the economy increasingly sensitive to swings in financial conditions and deflationary impulses from abroad. Both the high yield and investment-grade corporate bond index are languishing, perhaps picking up on the deflationary signal from U.S. dollar strength and growth drag from higher Treasury yields (Chart 2, bottom panel). It is notable that emerging markets currencies have pulled back. These exchange rates are typically pro-cyclical. Sustained currency weakness typically leads to domestic corporate bond spread widening (Chart 2, CDX spreads shown inverted). In the past five years, it has paid to bet on defensive over cyclical sectors when EM currencies weaken and CDX spreads are this tight, i.e. contrarians should take note. At a minimum, it may be a signal that global growth is less robust than the rise in global bond yields implies. As a result, forecasts for double-digit profit growth in the next twelve months look very aggressive, even if our economic outlook proves too cautious. The tentative trough in third quarter S&P 500 profits has not yet been validated by other indicators. For example, tracking tax revenue provides a good real-time gauge on corporate sector cash flows. Federal income tax receipts have dropped into negative territory. Corporate income taxes are contracting. Previous major and sustainable overall profit recoveries have been either led by, or coincident with, corporate income tax growth (Chart 3). This argues against extrapolating positive third quarter earnings growth in the S&P 500. Chart 1Watch Confidence And Financial Conditions Chart 2Don't Get Caught Up In The Hype Chart 3Taxes And Profits Rather than get overly excited about the potential for a new fiscal spending impulse, it may be more appropriate to view the latter as truncating downside economic risks, given that the corporate sector remains a key headwind to stronger growth, even excluding its balance sheet stress. Consequently, we still expect undervalued defensives to retake a leadership role from overvalued cyclical sectors and we also retain a domestic vs. global bias. If the U.S. dollar breaks above its recent trading range, the odds of the broad market making further liquidity fueled gains will diminish significantly. Importantly, the last few days of market moves have been massively exaggerated, as industrials and materials have rallied as if fiscal stimulus is about to hit next month. Even when implemented, it is not a panacea for sector earnings. Drug and biotech stocks have soared as if pricing pressures will evaporate, when in reality price pressures emerged prior to any political interference. Tech stocks have been crushed because of fears they will be forced to move production back to the U.S. All of these knee-jerk reactions should be treated with caution, with the exception of financials, where a step function reduction in the risk premium may be underway. There Is A New Sheriff In Town: Lift Financials To Neutral Financials have celebrated the modest upshift in the interest rate structure and hopes for a reversal of the regulatory framework that has been a structural noose on profitability, and risk premiums. These factors, along with our domestic vs. global bias, argue against maintaining a below benchmark weighting on a tactical basis. As discussed last week, our view on banks remains cautious, however, asset managers and investment banks have lower odds of falling back toward recent lows even after election euphoria inevitably fades. The largest earnings drags from the past year have eased. M&A activity has troughed. New and secondary stock offerings have hooked back up and margin debt is back to new highs, suggesting that investor risk appetites have stopped shrinking (Chart 4). Thus, capital formation is unlikely to dry up, even if upside is limited given poor corporate sector balance sheet health and an upward creep in the cost of capital. In terms of asset managers and custody banks (AMCB), even modestly higher interest rates would reduce a major profit impediment. Fees on funds held in trust have been decimated by ZIRP, underscoring that the latest uptick in short-term Treasury yields is a plus. Relative performance had already diverged negatively from the stock-to-bond ratio, the equity risk premium and global economic sentiment (Chart 5). This gap could close with a prospective thawing in relations between lawmakers and the industry. There is still structural downward pressure on fees as low cost ETFs gain market share, but that is being partially offset by the renewed growth in total mutual fund assets (Chart 4, bottom panel). Bear in mind that both groups tend to do well when the stocks outperform bonds, as seems likely in the near run given creeping protectionism. In sum, despite our concerns about overall financial sector productivity growth, mainly owing to rising bank cost structures, and the risks of a renewed deflationary impulse from U.S. dollar strength, we are lifting sector weightings to neutral. This will put us onside with the objective message from our Cyclical Macro Indicator, the buy signal from our Technical Indicator (Chart 6) and our broader theme of favoring domestic vs. global industries. Chart 4Earnings Drivers Have Stabilized Chart 5Recovery Candidate Chart 6Following Our Indicators Bottom Line: The Republican victory has provided a fillip to the financials sector, and underweight positions putting underweight positions offside. We are lifting allocations to neutral, via the S&P AMCB and S&P investment banks & brokerage indexes. AMCB moves to overweight, and the latter to neutral, with an eye to downgrading again once euphoria fades and investor focus returns to economic durability. Food Retailers: Too Cheap To Overlook Food retailers offer attractive value, defensive and domestic equity exposure with the potential for upside profit surprises. This group will benefit if U.S. wage inflation persists. The latter would boost consumer purchasing power and could lead to tighter financial conditions, either through U.S. dollar strength and/or a tighter Fed. The defensive appeal of retail food equities would shine through under that scenario. The starting point for grocery stocks is extremely appealing. The price ratio is extraordinarily oversold. It fell farther below its 200-day moving average than at any time since 2002, before recently bouncing (Chart 7). Valuations are cheap, return on equity is solid and share prices have diverged negatively from a number of macro indicators. For instance, relative performance has been tightly linked with the U.S. dollar, but the former plunged even as the currency firmed (Chart 8, top panel). A strong exchange rate will keep a lid on imported food costs, boost the allure of domestically-oriented industries while lifting consumer spending power. Chart 7Extraordinarily Oversold Chart 8Top-Line Improvement Ahead Outlays on food products have climbed as a share of total spending in the past six months, reversing a long-term downtrend (Chart 8). If consumer confidence stays firm as a consequence of rising wage growth and a positive wealth effect, then it is conceivable that store traffic and total grocery spending will accelerate. The surge in capital spending in recent years reflects store upgrades and a refreshed shopping experience, which could also translate into faster sales growth. Now that capital spending growth is cooling, it will reduce a profit margin drag. Profitability should also benefit from cost deflation. The food manufacturing PPI is contracting, reflecting shrinking raw food prices (Chart 9, top panel, shown inverted). It is normal for food stocks to outperform when raw food prices fall. Importantly, capacity utilization rates in the packaged food industry are very low (Chart 9), which augurs well for ongoing pricing pressure among suppliers. Tack on deflation in industry wage inflation, and it is no wonder profit margins have been able to grind back toward previous highs without a strong sales impulse. If sales rebound, as seems likely given evidence of market share gains away from hypermarkets (Chart 10, bottom panel), then grocery stores should continue to demonstrate decent pricing power gains (Chart 10, middle panel). Chart 9Cost Deflation Chart 10Gaining Market Share Adding it up, the ingredients for a powerful rally in the S&P retail food store index exist, with good downside protection should the economy disappoint on the back of tighter financial conditions. Bottom Line: We recommend an overweight position in the S&P retail food store index (BLBG: S5FDRE - KR, WFM). Current Recommendations Current Trades Size And Style Views Favor small over large caps and growth over value.