China

Executive Summary Rebounding Chinese Auto Sales
Chinese Infrastructure Investment Growth: A Slowdown Ahead
Chinese Infrastructure Investment Growth: A Slowdown Ahead
China’s stimulus for auto purchases and an easing global auto chip shortage will lead to about a 10% recovery in domestic auto sales in 2022H2 from a year ago. Next year, we expect Chinese auto sales to grow only modestly (under 5%). The share of new energy vehicles (NEVs) in auto sales is rising rapidly in China, crowding out internal combustion engine vehicles (ICEVs) at a fast rate. China is becoming more competitive in global auto manufacturing given its edge in NEV battery technologies and autonomous driving. Production of NEVs and the installation of NEV charging poles will expand rapidly. Yet, given the still-high valuation of these stocks, we will look to buy into these sectors at a better price entry point. Bottom Line: Chinese onshore and offshore automobile stock prices have risen sharply in the past couple of months on the expectation of improving car sales. Our bias is that the rally has been too fast and gone too far. Investors should wait for a pullback before they buy. Feature Chinese total auto sales contracted by 12% year on year in the first five months of this year due to a deep 24% contraction in non-NEV sales. In stark contrast, Chinese NEV sales have more than doubled during the same period. However, the 1-million-unit increase in NEV sales failed to counteract the 2.4-million-unit loss in non-NEV demand. This raises two questions. Why have NEV sales skyrocketed at a time when non-NEV sales have tanked? Will Chinese auto sales recover in 2022H2 and 2023? If so, then how strongly will the recovery be? The answer to the first question lies in a major auto chip allocation strategy that many Chinese auto producers adopted last year. Under limited semiconductor supplies, auto producers in China prioritized the use of chips in their production of NEV models – which have higher profit margins –over traditional vehicles. The greater availability of NEVs than ICEVs has meant an increase in sales of the former and a deep contraction in the latter in 2022H1. Chart 1Chinese Auto Sales: A Recovery Ahead?
Chinese Auto Sales: A Recovery Ahead?
Chinese Auto Sales: A Recovery Ahead?
For the second question, we believe that China’s stimulus package to boost auto sales and an easing global auto chip shortage will lead to about a 10% recovery in auto sales in 2022H2 from a year ago. On the other hand, growth in 2023 will be very modest (under 5%). Accordingly, the daily data of Chinese retail auto sales have already shown a strong rebound in the total sales of NEVs and ICEVs in the last three weeks of June (Chart 1). Auto Sales In China: A Gradual Recovery China’s auto sales are set to have a gradual recovery in 2022H2. We expect auto sales to reach 26.2-26.8 million units by the end of this year, with NEV and non-NEVs rising to 5-5.3 million units and 21.2-21.5 million units, respectively1 (Chart 2). The reasons for our positive estimates include policy stimulus, improving technological advancement of NEVs, as well as an easing in the global auto chip shortage. First, the government has issued a flurry of policies since late May attempting to boost domestic auto demand. As Chart 1 shows, these policies have proved effective, at least for now. In previous episodes of stimulus aimed at boosting auto sales in 2009-2010, 2016-2017, and 2019-2021, authorities had implemented similar supportive measures. While the stimulus worked well in the first two episodes, it was not effective in 2019-2021 (Chart 3). Chart 2Auto Demand In China: A Gradual And Moderate Rebound
Auto Demand In China: A Gradual And Moderate Rebound
Auto Demand In China: A Gradual And Moderate Rebound
Chart 3Policy Stimulus Will Help Lift Chinese Auto Demand
Policy Stimulus Will Help Lift Chinese Auto Demand
Policy Stimulus Will Help Lift Chinese Auto Demand
Box 1 shows our summary of those auto stimulus and a comparison of these episodes. Of all these policies, we believe that a sales tax reduction2 on certain vehicles has proved to be the most effective policy as it directly reduced the prices of these vehicles. In 2022H2, this policy will mainly benefit ICEVs sales as NEVs will continue to enjoy a full exemption from the 10% vehicle purchase tax. The government is also considering an extension of the exemption for NEVs to the end of next year. Box 1China’s Stimulus Package For The Domestic Auto Industry
The Chinese Auto Market: On A Path To Recovery
The Chinese Auto Market: On A Path To Recovery
This year’s stimulus is more comparable to the 2009 and 2016 episodes as they share the same reduction in the sales tax rate from 10% to 5%. The main difference is that this time the policy targets cars with 2-liter engines or smaller, while back in 2009 and 2016 this policy only applied to vehicles with capacity no bigger than 1.6-liters. This means a larger range of vehicles will benefit from the reduction. In short, the current policy will allow an additional 23% share of total vehicles sold to benefit from the stimulus. Please note that for the period of 2019-2021 there was no sales tax reduction. This may be one of the reasons for the lack of recovery in vehicle sales in this episode; Chinese auto sales contracted in both 2019 and 2020. Second, Chinese NEVs buyers have been enjoying government subsidies, albeit on a sliding scale since 2019. The amount of subsidy has been dropping by 10%, 20% and 30% in 2020, 2021 and 2022, respectively (Table 1). We expect NEV sales to rise as the subsidy is set to expire by the end of this year. This may induce some buyers to buy NEVs before the subsidy ends. Table 1Government Subsidy For NEV Purchase in China
The Chinese Auto Market: On A Path To Recovery
The Chinese Auto Market: On A Path To Recovery
Chart 4NEVs Become More Appealing To Chinese Consumers
NEVs Become More Appealing To Chinese Consumers
NEVs Become More Appealing To Chinese Consumers
In addition, NEVs are becoming increasingly appealing for auto buyers. This is due to longer travel mileage per battery charge, constant improvement in NEV related technologies, and an expanded charging/battery swap framework (Chart 4). Further, in comparison to traditional ICEVs, NEVs have become increasingly more equipped with functions such as autonomous driving, intelligent interconnection, and other software application-based services. NEVs will also become more integrated with intelligent and interactive networks. All these features will make NEVs more attractive to automobile buyers as well. According to the McKinsey China Auto Consumer Insights 2021 report, Chinese consumers are more interested than ever in smart vehicle technologies, and they are willing to pay a premium for innovative features. 80% of consumers report that autonomous driving will be a key factor in their decision-making when they buy their next car. Meanwhile, 69% of consumers consider that over-the-air update technology (OTA) is an important feature, and 62% of those are willing to pay for it. Chart 5NEV Sales In China Are Not Very Sensitive To Gasoline Prices
NEV Sales In China Are Not Very Sensitive To Gasoline Prices
NEV Sales In China Are Not Very Sensitive To Gasoline Prices
Rising oil and gasoline prices have also encouraged NEV sales in the past six-to-nine months. But we believe high fuel prices are relatively less important factors to NEV demand in China than in the US and EU. For example, in 2020H2, when oil prices were only around US$40-50 and domestic gasoline price were low, Chinese NEV sales still rose strongly during the same period (Chart 5). Third, the deep contraction in non-NEV sales in China in 2021 was partially caused by the global auto chip shortage. Global semiconductor chip shortages are likely to continue easing in 2022H2 as demand-supply gaps decrease across most components. Demand for consumer electronics is set to contract in the US and the EU in the next six-to-nine months. Hence, some capacity for PC and smartphone chips could be used to produce auto chips in the months ahead. Bottom Line: Government initiatives to boost auto sales, improving technological advancement of NEVs, and an easing of the global auto chip shortage will lift Chinese auto sales to some extent. Structural Auto Demand: A New Normal? Auto sales peaked in 2017 and are since down by 13%. Even if auto sales registered a modest recovery as we expect in 2022 and 2023, they will still be about 6% below their 2017 peak. The reasons why we do not expect a brisk auto sales recovery are as follows: Household (HH) income growth is very weak and the unemployment rate has been rising (Chart 6). HHs have considerable debt (Chart 7). With house prices not rising, and potentially deflating, HH willingness to take on more debt has declined. Chart 6Falling HH Income Growth And Rising Unemployment
Falling HH Income Growth And Rising Unemployment
Falling HH Income Growth And Rising Unemployment
Chart 7HH Debt Burden Is Already High
HH Debt Burden Is Already High
HH Debt Burden Is Already High
Wage/income growth has downshifted and narrowed its gap with interest rates on consumer loans. The cost HH debt has therefore risen relative to their income growth, making consumers less willing to take on more debt. Reflecting downbeat consumer sentiment, the HH marginal propensity to consume has fallen to very low levels and has not shown signs of improvement (Chart 8). With the mediocre structural auto demand outlook in China, NEV sales will rapidly gain market share from non-NEVs (Chart 9). NEVs currently account for about 18% of total auto sales in China, still much lower than the country’s goal of 40% in 2030. Chart 8HH Willingness To Spend Is Low Chinese Consumers: Falling Willingness To Consume
HH Willingness To Spend Is Low Chinese Consumers: Falling Willingness To Consume
HH Willingness To Spend Is Low Chinese Consumers: Falling Willingness To Consume
Chart 9Accelerating NEV Penetration In China
Accelerating NEV Penetration In China
Accelerating NEV Penetration In China
Last week the EU passed a plan of a 2035 phase-out of new fossil fuel car sales. This is also a trend for China. Chinese auto makers such as Changan, BAIC Motor and Haima have already announced that they will stop ICEV production in 2025. Chart 10Decelerating Growth In Chinese Oil Demand
Decelerating Growth In Chinese Oil Demand
Decelerating Growth In Chinese Oil Demand
Declining ICEV sales will lead to lower growth of these vehicles on the road (Chart 10). Consequently, gasoline and diesel demand growth from passenger and commercial autos will be decelerating in China in the coming years. Bottom Line: Passenger car demand in China will be settled in low single digit growth rates. The market share of NEVs will rise very fast at the expense of ICEVs. In turn, falling ICEV sales will result in slower growth in domestic petroleum demand. China: Increasing Competitiveness Chart 11Increasing Competitiveness Of Chinese Auto Manufacturers
Increasing Competitiveness Of Chinese Auto Manufacturers
Increasing Competitiveness Of Chinese Auto Manufacturers
China has become increasingly competitive in global auto manufacturing. This is a strong tailwind for the country’s auto exports. In fact, the country’s net exports of autos have been rising (Chart 11). China is the world’s largest auto producer and consumer, accounting for 32.5% and 32% of global auto production and sales, respectively. The country is also the world’s largest NEV producer. Chart 12China: The World’s Leading And Largest EV Battery Producer
The Chinese Auto Market: On A Path To Recovery
The Chinese Auto Market: On A Path To Recovery
The battery is the most important component of an NEV, and its technological progress holds the key to the speed of NEV penetration. China is the world leader in this battery technology. China’s CATL is currently the world's largest battery manufacturer, with a market share of 32.5%. CATL ranked first in the world for five consecutive years from 2017 to 2021. In addition, four out of the top ten global EV battery players are Chinese companies, with a total market share of 44%, up from 41% last year (Chart 12). Moreover, in late June, CATL launched its cell-to-pack (CTP 3.0) battery. With a record-breaking volume utilization efficiency of 72% and an energy density of up to 255 Wh/kg, it achieves the highest integration level worldwide so far, capable of delivering a range of over 1,000 km on a single charge. The CTP 3.0 batteries are expected to be mass produced and come onto the market in 2023. The development of charging/battery-swapping infrastructure will continue to be faster in China than in other countries/regions due to the country’s competitive advantage in NEV production, including batteries, as well as related policy support. For example, the number of total public & private charging poles rose at a compound annual growth rate of 50% in the past five years. This allows China to collect more NEV charging-related data, which could be used to improve the country’s NEV manufacturing process, charging pole production, and the country’s charging infrastructure development. This will help reduce the charging anxiety of Chinese NEV users. In terms of autonomous driving, five Chinese companies have been included in the world’s 10 best autonomous driving companies based on their technological edge, according to the global autonomous driving report released by the California Department of Motor Vehicles (DMV). In addition to test drives in the US, major Chinese NEV makers have also carried out test drives in China with long distances and more complicated driving conditions. For example, as of mid-March, Baidu Apollo’s autonomous driving has already exceeded 25 million kilometers. In comparison, the total test distance of autonomous driving of all autonomous driving test cars in California were only 6.4 million kilometers. Chart 13China: Faster NEV Penetration Versus Other Countries
The Chinese Auto Market: On A Path To Recovery
The Chinese Auto Market: On A Path To Recovery
At 13.4%, the share of NEVs in total auto sales in China was high last year compared with other countries (Chart 13). The ratio has already risen to 21% in the first five months of this year. Bottom Line: China will become more competitive in global auto manufacturing given its edge in NEV battery technologies and autonomous driving. Investment Implications Chinese onshore and offshore automobile stock prices have risen sharply in the past couple of months, expecting improving car sales in the short-to-medium term (Chart 14). Our bias is that the rally has been too fast and gone too far. Investors should wait for a pullback before they buy. A shakeout in broader Chinese offshore and onshore stocks is likely due to the following (Chart 15): Chart 14Chinese Automobile Stock Prices: A Lot Of Good News Already Priced In...
Chinese Automobile Stock Prices: A Lot Of Good News Already Priced In...
Chinese Automobile Stock Prices: A Lot Of Good News Already Priced In...
Chart 15...A Pullback Is Due
...A Pullback Is Due
...A Pullback Is Due
Chart 16Look To Buy Chinese NEV-related Stocks
Look To Buy Chinese NEV-related Stocks
Look To Buy Chinese NEV-related Stocks
China’s economy is still facing downward pressure due to a faltering property market, sluggish household income growth and consumption, falling export demand, as well as heightened risks of further COVID-induced lockdowns. Global equities have probably not completed their downtrend. It will be hard for Chinese stocks to continue rallying if global share prices continue to fall. That said, we have a bullish bias towards Chinese NEV producers. China’s NEV sector enjoys tailwinds from structurally strong demand and its technological edge, especially in batteries. Hence, we will look to buy Chinese NEV and battery stocks at a better price entry point (Chart 16). Ellen JingYuan He Associate Vice President ellenj@bcaresearch.com Footnotes 1 China Association of Automobile Manufacturers (CAAM) predicted Chinese auto sales to rise to 27.5 million units for the full year. We are a little bit less optimistic on that front. 2 The State Council of China is enacting 60-billion-yuan (US$9 billion) worth of tax cuts between June and December. The purchase tax on certain passenger vehicles will be reduced by half to 5% of the sticker price. The tax cuts target cars with 2-liter engines or smaller, priced at 300,000 yuan (US$ 44,800) or less. Strategic Themes Cyclical Recommendations
China’s service sector is expanding anew after 3 months of contraction. The China Caixin non-manufacturing PMI surged to 54.5 in June from 41.4 in May, handily exceeding expectations of 49.6, and pointing to the strongest increase in service sector…
Executive Summary China: GeoRisk Indicator
China: GeoRisk Indicator
China: GeoRisk Indicator
A new equilibrium between NATO, which now includes Sweden and Finland, and Russia needs to be reestablished before geopolitical risks in Europe subside. Russia aims to inflict a recession on the EU which will revive dormant geopolitical risks embedded in each country. Investors should ignore the apparent drop in China’s geopolitical risk as it could rise further until Xi Jinping consolidates power at the Party Congress this fall. Stay on the sideline on Brazilian, South African, Australian, and Canadian equities despite the commodity bull market, at least until China’s growth stabilizes. Korean risk will rise, albeit by less than Taiwanese risk. The US political cycle ensures that Biden may take further actions against adversaries in Europe, Middle East, and East Asia, putting a floor under global geopolitical risk. Tactical Recommendation Inception Date Return LONG GLOBAL AEROSPACE & DEFENSE / BROAD MARKET EQUITIES 2020-11-27 9.3% Bottom Line: Geopolitical risk will rise in the near term. Stay long gold and global defensive stocks. Feature This month we update our GeoRisk Indicators and make observations about the status of political risk for each territory, and where risks are underrated or overrated by global financial markets. Russia GeoRisk Indicator Our “Original” quantitative measure of Russian political risk – the Russian “geopolitical risk premium” shown in the dotted red line below – has fallen to new lows (Chart 1). One must keep in mind that this geopolitical premium is operating under the assumption of a “free market” but the Russian market in the past few months had been anything but free. The Russian government and central bank had been manipulating the ruble and preventing capital outflows. Hence, Russian assets and any indicator derived from it does not reflect its true risk premium, merely the resolve of its government in the geopolitical struggle. Chart 1Russia: GeoRisk Indicator
Russia: GeoRisk Indicator
Russia: GeoRisk Indicator
While the Russia Risk Premium accurately detected the build-up in tensions before the invasion of Ukraine this year, today it gives the misleading impression that Russian geopolitical risk is low. In reality the risk level remains high due to the lack of strategic stability between Russia and the West, particularly the United States, and particularly over the question of NATO enlargement. Our “Old” Russia GeoRisk Indicator remains elevated but has slightly fallen back. This measure failed to detect the rise in risk ahead of this year’s invasion of Ukraine. We predicted the war based on non-market variables, including qualitative analysis. As a result of the failure of our indicator, we devised a “New” Russia GeoRisk Indicator after this year’s invasion, shown as the green line below. This measure provides the most accurate reading. It is pushing the upper limits, which we truncated at 4, as it did during the invasion of Georgia in 2008 and initial invasion of Ukraine in 2014. Related Report Geopolitical StrategyThird Quarter Geopolitical Outlook: Thunder And Lightning Has Russian geopolitical risk peaked for Europe and the rest of the world? Not until a new strategic equilibrium is established between the US and Russia. That will require a ceasefire in Ukraine and a US-Russia understanding about the role of Finland and Sweden within NATO. However, Hungary is signaling that the EU should impose no further sanctions on Russia. Russia’s cutoff of natural gas exports to Europe will create economic hardship that will start driving change in European governments or policies. A full ban on Russian natural gas may not be implemented in the coming years due to lack of EU unanimity. Still, the EU cannot lift sanctions on Russia because that would enable economic recovery and hence military rehabilitation, which could enable new aggression. Also, Russia will not relinquish the territories it has taken from Ukraine even if President Putin exits the scene. No Russian leader will have the political capital to do that given the sacrifices that Russia has made. Bottom Line: Russia’s management of the ruble is distorting some of our risk indicators. Russia remains un-investable for western investors. Substantial sanction relief will not come until late in the decade, if at all. UK GeoRisk Indicator British political risk is rising, and it may surpass the peaks of the Brexit referendum period in 2016 now that Scotland is pursuing another independence referendum (Chart 2). Chart 2United Kingdom: GeoRisk Indicator
United Kingdom: GeoRisk Indicator
United Kingdom: GeoRisk Indicator
New elections are not due until January 25, 2025 and the ruling Conservative Party has every reason to avoid an election over the whole period so that inflation can come down and the economy can recover. But an early election is possible between now and 2025. Prime Minister Boris Johnson has become a liability to his party but he is still a more compelling leader than the alternatives. If Johnson is replaced, then the change of leadership will only temporarily boost the Tories’ public approval. It will ultimately compound the party’s difficulties by dividing the party without resolving the Scottish question. Regardless, the Tories face stiff headwinds in the coming referendum debate and election, having been in power since 2010 and having suffered a series of major shocks (Brexit, the pandemic, inflation). Bottom Line: The US dollar is not yet peaking against pound sterling, As from a global geopolitical perspective it can go further. Investors should stay cautious about the pound in the short term. But they should prefer the pound to eastern European currencies exposed to Russian instability. Germany GeoRisk Indicator German political risk spiked around the time of the 2021 election and has since subsided, including over the course of the Ukraine war (Chart 3). However, risk will rise again now that Germany has declared that it is under “economic attack” from Russia, which is cutting natural gas in retaliation to Germany’s oil embargo. Chart 3Germany: GeoRisk Indicator
Germany: GeoRisk Indicator
Germany: GeoRisk Indicator
This spike in strategic tensions should not be underrated. Germany is entering a new paradigm in which Russian aggression has caused a break with the past policy of Ostpolitik, or economic engagement. Germany will have to devote huge new resources to energy security and national defense and will have to guard against Russia for the foreseeable future. Domestic political risk will also rise as the economy weakens and industrial activity is rationed. Germany does not face a general election until October 26, 2025. Early elections are rare but cannot be ruled out over the next few years. The ruling coalition does not have a solid foundation. It only has a 57% majority in the Bundestag and consists of an ideological mix of parties (a “traffic light” coalition of Social Democrats, Greens, and Free Democrats). Still, Germany’s confrontation with Russia will keep the coalition in power for now. Bottom Line: From a geopolitical point of view, there is not yet a basis for the dollar to peak and roll over against the euro. That is not likely until there is a ceasefire in Ukraine and/or a new NATO-Russia understanding. France GeoRisk Indicator French political risks are lingering at fairly high levels in the wake of the general election and will only partially normalize given the likelihood of European recession and continued tensions around Russia (Chart 4). Chart 4France: GeoRisk Indicator
France: GeoRisk Indicator
France: GeoRisk Indicator
President Emmanuel Macron was re-elected, as expected, but his Renaissance party (previously En Marche) lost its majority and Macron will struggle to win over 39 deputies to gain a majority of 289 seats in the Assembly. He will, however, be able to draw from an overall right-wing ideological majority – especially the Republicans – when it comes to legislative compromises. The election produced some surprises. The right-wing, anti-establishment National Rally of Marine Le Pen, which usually performs poorly in legislative elections, won 89 seats. The left-wing alliance (NUPES) underperformed opinion polls and has not formed a unified bloc within the Assembly. Still, the left will be a powerful force as it will command 151 seats (the sum of the left-wing anti-establishment leader Jean-Luc Mélenchon’s La France Insoumise party and the Communists, Socialists, and Greens). Macron’s key reform – raising the average retirement age from 62 to 65 – will require an ad hoc majority in the Assembly. The Republicans, with 74 seats, can provide the necessary votes. But some members have already refused to side with Macron on this issue. Macron will most likely get support from the populist National Rally on immigration, including measures to make it harder to be naturalized or obtain long-term residence permits, and measures making it easier to expel migrants whose asylum applications have been refused. France will remain hawkish on immigration, but Macron will be able to rein in the populists. On energy and the environment, Macron may be able to cooperate with the Left on climate measures, but ultimately any cooperation will be constrained by the fact that Mélenchon opposes nuclear power. The Republicans and the National Rally will support Macron’s bid to shore up France’s nuclear energy sector. Popular opinion will hold up for France’s energy security in the face of Russian weaponization of natural gas. Macron and Mélenchon will clash on domestic security. Police violence has emerged as a major source of controversy since the Yellow Vest protests. Macron and the Right will protect the police establishment while the Left will favor reforms, notably the concept of “proximity police,” which would entail police officers patrolling in a small area to create stronger, more personal links between the police and the population; officers being under the control of the mayor and prefect; and ultimately most officers not carrying lethal weapons, and the ban of physically dangerous arrest techniques. Grievances over the police as well as racial inequality will likely erupt into significant social unrest in the coming years. As a second-term president without a single-party majority, Macron will increasingly focus on foreign policy. He will aim to become the premier European leader on the world stage. He will seek to revive France’s historic role as a leading diplomatic power and arbiter of Europe. He will strengthen France’s position in the EU and NATO, keep selling arms to the Middle East, and maintain a French military presence in the Sahel. Macron will favor Ukraine’s membership in the EU but also a ceasefire with Russia. He will face a difficult decision on whether to join Israeli and American military action against Iran should the latter reach nuclear breakout capacity and pursue weaponization. Bottom Line: The outperformance of French equities is stretched relative to EMU counterparts. But France will not underperform until the EU’s natural gas crisis begins to subside and a new equilibrium is established with Russia. Italy GeoRisk Indicator Italy is perhaps the weakest link in Europe both economically and strategically (Chart 5). Elections are due by June 2023 but could come earlier as the ruling coalition is showing strains. A change of government would likely compromise the EU’s attempt to maintain a unified front against Russia over the war in Ukraine. Chart 5Italy: GeoRisk Indicator
Italy: GeoRisk Indicator
Italy: GeoRisk Indicator
Before the war Italy received 40% of its natural gas from Russia and maintained pragmatic relations with the Putin administration. Now Russia is reducing flows to Italy by 50%, forcing the country into an energy crisis at a time when expected GDP growth had already been downgraded to 2.3% this year and 1.7% in 2023. Meanwhile Italian sovereign bond spreads over German bunds have risen by 64 basis points YTD as a result of the global inflation. The national unity coalition under Prime Minister Mario Draghi came together for two purposes. First, to distribute the EU’s pandemic recovery funds across the country, which amounted to 191.5 billion euros in grants and cheap loans for Italy, 27% of the EU’s total recovery fund and 12% of Italy’s GDP. Second, to elect an establishment politician in the Italian presidency to constrain future populist governments (i.e. re-electing President Sergio Mattarella). Now about 13% of the recovery funds have been distributed in 2021, the economy is slowing, Russia is cutting off energy, and elections are looming. The coalition is no longer stable. Coalition members will jockey for better positioning and pursue their separate interests. The anti-establishment Five Star Movement has already split, with leader Luigi di Maio walking out. Five Star’s popular support has fallen to 12%. The most popular party in the country is now the right-wing, anti-establishment Brothers of Italy, who receive 23% support in polling. Matteo Salvini, leader of the League, another right-wing populist party, has seen its public support fall to 15% and will be looking for opportunities. On the whole, far-right parties command 38% of popular voting intentions, while far-left parties command 17% and centrist parties command 39%. Italy’s elections will favor anti-incumbent parties, especially if the country falls into recession. These parties will be more pragmatic toward Russia and less inclined to expand the EU’s stringent sanctions regime. Implementing a ban on Russian natural gas by 2027 will become more difficult if Italy switches. Italy will be more inclined to push for a ceasefire. A substantial move toward ceasefire will improve investor sentiment, although, again, a durable new strategic equilibrium cannot be established until the US and Russia come to an understanding regarding Finland, Sweden, and NATO enlargement. Bottom Line: Investors should steer clear of Italian government debt and equities until after the next election. Spain GeoRisk Indicator Infighting and power struggles within the People’s Party (PP) have provided temporary relief for the ruling Socialist Worker’s Party (PSOE) and Spanish Prime Minister Pedro Sanchez. However, with Alberto Nunez Feijoo elected as the new leader of PP on April 2, the People’s Party quickly recovered from its setback. It not only retook the first place in the general election polling, but also scored a landslide victory in the Andalusia regional election. Andalusia is the most populous autonomous community in Spain, contributing 17% of the seats in the lower house. The Andalusian regional election was a test run for the parties before next year’s general election. Historically, Andalusia was PSOE’s biggest stronghold, but it was ousted by the center-right People’s Party-Citizens coalition in 2018. Since then, the People’s party has consolidated their presence and popularity in Andalusia. The snap election in June, weeks after Feijoo was elected as the new national party leader, expanded PP’s seats in the regional parliament. It now has an absolute majority in the regional parliament while the Socialists suffered its worst defeat. With the sweeping victory in Andalusia, the People’s Party is well positioned for next year’s general election. In addition, the ruling Socialist Worker’s Party continues to suffer from the stagflationary economic condition. In May, Spain recorded the second highest inflation figure in more than 30 years, slightly below its March number. Furthermore, the recent deadly Melilla incident which resulted in dozens of migrants’ death, also caused some minor setbacks within Sanchez’s ruling coalition. His far-left coalition partner joined the opposition parties in condemning Sanchez for being complacent toward the Moroccan police. The pressure is on the Socialists now, and political risk will rise in the coming months, till after the election (Chart 6). Chart 6Spain: GeoRisk Indicator
Spain: GeoRisk Indicator
Spain: GeoRisk Indicator
Bottom Line: Domestic political risk will remain elevated in this polarized country, as elections are due by December 2023 and could come sooner. Populism may return if Europe suffers a recession. Russia aims to inflict a recession on the EU which is negative for cyclical markets like Spain, but Spain benefits from Europe’s turn to liquefied natural gas and has little to fear from Russia. Investors should favor Spanish stocks relative to Italian stocks. Turkey GeoRisk Indicator Turkey faces extreme political and economic instability between now and the general election due by June 2023 (Chart 7). Chart 7Turkey: GeoRisk Indicator
Turkey: GeoRisk Indicator
Turkey: GeoRisk Indicator
Almost any country would see the incumbent ruling party thrown from power under Turkey’s conditions. The ruling Justice and Development Party has been in charge since 2002, the country’s economy has suffered over that period, and today inflation is running at 73% while unemployment stands at 11%. However, President Recep Tayyip Erdoğan is doing everything he can with his recently expanded presidential powers to stay in office. He is making amends with the Gulf Arab states and seeking their economic support. He is also warming relations with Israel, as Turkey seeks to diversify away from Russian gas and Israel/Egypt are potential suppliers. He is doubling down on military distractions across the Middle East and North Africa. And he waged a high-stakes negotiation with the West over Finnish and Swedish accession to NATO. Russian aggression poses a threat to Turkish national interests. Turkey ultimately agreed to Finnish and Swedish membership after a show of Erdoğan strong hands in negotiating with the West over their membership, to show his domestic audience that he is one of the big boys ahead of the election. A risk to this view is that Erdoğan stages military operations against Greek-controlled Cyprus. This would initiate a crisis within NATO and put Finnish and Swedish accession on hold for a longer period. Bottom Line: Investors should not attempt to bottom-feed Turkish lira or stocks and should sell any rallies ahead of the election. A decisive election that removes Erdoğan from power is the best case for Turkish assets, while a decisive Erdoğan victory is second best. Worse scenarios include indecisive outcomes, a contested or stolen election, a constitutional breakdown, or a military coup. China GeoRisk Indicator China’s geopolitical risk is falling and relative equity performance is picking up now that the government has begun easing monetary, fiscal, and regulatory policy to try to secure the economic recovery (Chart 8). Chart 8China: GeoRisk Indicator
China: GeoRisk Indicator
China: GeoRisk Indicator
Easing regulation on Big Tech has spurred a rebound in heavily sold Chinese tech shares, while the Politburo will likely signal a pro-growth turn in policy at its July economic meeting. The worst news of the country’s draconian “Covid Zero” policy is largely priced, while positive news regarding domestic vaccines, vaccine imports, or anti-viral drugs could surprise the market. However, none of these policy signals are reliable until Xi Jinping consolidates power at the twentieth national party congress sometime between September and November (likely October). Chinese stimulus could fail to pick up as much as the market hopes and policy signals could reverse or could continue to contradict themselves. After the party congress, we expect the Xi administration to intensify its efforts to stabilize the economy. The economic work conference in December will release a pro-growth communique. The March legislative session will provide more government support for the economy if needed. However, short-term measures to stabilize growth should not be mistaken for a major reacceleration, as China will continue to struggle with debt-deflation as households and corporations deleverage and the economic model transitions to a post-manufacturing model. Bottom Line: A Santa Claus rally in the fourth quarter, and/or a 2023 rally, is likely, both for offshore and onshore equities. But long-term investors, especially westerners, should steer clear of Chinese assets. China’s reversion to autocracy and confrontation with the United States will ultimately result in tariffs and sanctions and geopolitical crises and will keep risk premiums high. Taiwan GeoRisk Indicator Taiwan’s geopolitical risk has spiked as expected due to confrontation with China. Tensions will remain high through the Taiwanese midterm election on November 26, the Chinese party congress, and the US midterm (Chart 9). But China is not ready to stage a full-scale military conflict over Taiwan yet – that risk will grow over in the later 2020s and 2030s, depending on whether the US and China provide each other with adequate security assurances. Chart 9Taiwan: GeoRisk Indicator
Taiwan: GeoRisk Indicator
Taiwan: GeoRisk Indicator
Still, Taiwan is the epicenter of global geopolitical risk. China insists that it will be unified with the mainland eventually, by force if not persuasion. China’s potential growth is weakening so it is losing the ability to absorb Taiwan through economic attraction over time. Meanwhile the Taiwanese people do not want to be absorbed – they have developed their own identity and prefer the status quo (or independence) over unification. Taiwan does not have a mutual defense treaty with the United States and yet the US and Taiwan are trying to strengthen their economic and military bonds. This situation is both threatening to China and yet not threatening enough to force China to forswear the military option. At some point China could believe it must assert control over Taiwan before the US increases its military commitment. Meanwhile China, the US, Japan, South Korea, and Europe are all adopting policies to promote semiconductor manufacturing at home, and/or outside Taiwan, so that their industries are not over-reliant on Taiwan. That means Taiwan will lose its comparative advantage over time. Bottom Line: Structurally remain underweight Taiwanese equities. Korea GeoRisk Indicator The newly elected President Yoon reaffirmed the strong military tie between Korea and the US, when he hosted President Biden in Seoul in May. Both Presidents expressed interests in expanding cooperation into new areas like semiconductors, economic security, and stability in the Indo-Pacific region. The new administration is also finding ways to improve relations with Japan, which soured in the past few years over the issue of forced labor during the Japanese occupation of Korea. A way forward is yet to be found, but a new public-private council will be launched on July 4 to seek potential solutions before the supreme court ruling in August which could further damage bilateral ties. President Yoon’s various statements throughout the NATO summit in Madrid on wanting a better relationship with Japan and to resolve historical issues showed this administration’s willingness towards a warming of the relations between the two countries, a departure from the previous administration. On the sideline of the NATO summit, Yoon also engaged with European leaders, dealing Korean defense products, semiconductors, and nuclear technologies, with a receptive European audience eager to bolster their defense, secure supply chain, and diversify energy source. North Korea ramped up its missile tests this year as it tends to do during periods of political transitions in South Korea. It is also rumored to be preparing for another nuclear test. Provocations will continue as the North is responding to the hawkish orientation of the Yoon administration. Investors should expect a rise in geopolitical risk in the peninsular, but on a relative basis, due to its strong alliance network, Korean risk will be lower compared to Taiwan (Chart 10). Korea will benefit from a rebound in China in the near term, but in the long-term, it is a secure source of semiconductors and high-tech exports, as Greater China will be mired in long-term geopolitical instability. Chart 10Korea: GeoRisk Indicator
Korea: GeoRisk Indicator
Korea: GeoRisk Indicator
Bottom Line: Overweight South Korean equities relative to emerging markets as a play on Chinese stimulus. Overweight Korea versus Taiwan. Australia GeoRisk Indicator Australia’s Labor Party ultimately obtained a one-seat majority in the House of Representatives following the general election in May (77 seats where 76 are needed). It does not have a majority in the Senate, where it falls 13 seats short of the 39 it needs. It will rely on the Green Party (12 seats) and a few stragglers to piece together ad hoc coalitions to pass legislation. Hence Prime Minister Anthony Albanese’s domestic agenda will be heavily constrained. Pragmatic policies to boost the economy are likely but major tax hikes and energy sector overhauls are unlikely (Chart 11). Chart 11Australia: GeoRisk Indicator
Australia: GeoRisk Indicator
Australia: GeoRisk Indicator
Fortunately for Albanese, his government is taking power in the wake of the pandemic, inflation, and Chinese slowdown, so that there is a prospect for the macroeconomic context to improve over his term in office. This could give him a tailwind. But for now he is limited. Like President Biden in the US, Albanese can attempt to reduce tensions with China after Xi Jinping consolidates power. But also like Biden, he will not have a basis for broad and durable re-engagement, since China’s regional ambitions threaten Australian national security over the long run. Global commodity supply constraints give Australia leverage over China. Bottom Line: Stay neutral on Australian currency and equities until global and Chinese growth stabilize. Brazil GeoRisk Indicator It would take a bolt of lightning to prevent former President Lula da Silva from winning re-election in Brazil’s October 2 first round election. Lula is more in line with the median voter than sitting President Jair Bolsonaro. Bolsonaro’s term has been marred with external shocks, following on a decade of recession and malaise. Polls may tighten ahead of the election but Lula is heavily favored. While ideologically to the left, Lula is a known quantity to global investors (Chart 12). However, Bolsonaro may attempt to cling to power, straining the constitutional system and various institutions. A military coup is unlikely but incidents of insubordination cannot be ruled out. Once Lula is inaugurated, a market riot may be necessary to discipline his new administration and ensure that his policies do not stray too far into left-wing populism. Chart 12Brazil: GeoRisk Indicator
Brazil: GeoRisk Indicator
Brazil: GeoRisk Indicator
Brazil’s macroeconomic context is less favorable than it was when Lula first ruled. During the 2000s he rode the wave of Chinese industrialization and a global commodity boom. Today China is slipping into a balance sheet recession and the next wave of industrialization has not yet taken off. Brazil’s public debt dynamics discourage a structural overweight on Brazil within emerging markets. At least Brazil is geopolitically secure – far separated from the conflicts marring Russia, East Europe, China, and East Asia. It also has a decade of bad news behind it that is already priced. Bottom Line: Stay neutral Brazilian assets until global and Chinese growth stabilize and the crisis-prone election season is over. South Africa GeoRisk Indicator South Africa’s economy continues to face major headwinds amid persistent structural issues that have yet to be adequately addressed and resolved by policy makers. The latest bout of severe energy supply cuts by the state-run energy producer, Eskom, serve as a reminder to investors that South Africa’s economy is still dealing with a major issue of generating an uninterrupted supply of electricity. Each day that electricity supply is cut to businesses and households, the local economy stalls. Among other macroeconomic issues such as high unemployment and rising inflation, low-income households which are too the median voter, are facing increasing hardships. The political backdrop is geared toward further increases in political risk going forward (Chart 13). Chart 13South Africa: GeoRisk Indicator
South Africa: GeoRisk Indicator
South Africa: GeoRisk Indicator
Fiscal reform and austerity are underway but won’t last long enough to make a material difference in government finances. The 2024 election is not that far out and the ruling political party, the ANC, will look to quell growing economic pressures to shore up voter support and reinforce its voter base. Fiscal austerity will unwind. Meanwhile, the bull market in global metal prices stands to moderate on weakening global growth, which reduces a tailwind for the rand, South African equities relative to other emerging markets, and government coffers, reducing our reasons for slight optimism on South Africa until global growth stabilizes. Bottom Line: Shift to a neutral stance on South Africa until global and Chinese growth stabilize. Canada GeoRisk Indicator Canadian political risk has spiked since the pandemic (Chart 14). Populist politics can grow over time in Canada, especially if the property sector goes bust. However, the country is geopolitically secure and benefits from proximity to the US economy. Chart 14Canada: GeoRisk Indicator
Canada: GeoRisk Indicator
Canada: GeoRisk Indicator
Global commodity supply constraints create opportunities for Canada as governments around the world pursue fiscal programs directed at energy security, national defense, and supply chain resilience. Bottom Line: Stay neutral Canadian currency and equities. While Canada benefits from the high oil price and robust US economy, rising interest rates pose a threat to its high-debt model, while US growth faces disappointments due to Europe’s and China’s troubles. Matt Gertken Chief Geopolitical Strategist mattg@bcaresearch.com Yushu Ma Research Analyst yushu.ma@bcaresearch.com Jesse Anak Kuri Associate Editor jesse.kuri@bcaresearch.com Guy Russell Senior Analyst GuyR@bcaresearch.com Alice Brocheux Research Associate alice.brocheux@bcaresearch.com Strategic Themes Open Tactical Positions (0-6 Months) Open Cyclical Recommendations (6-18 Months) Regional Geopolitical Risk Matrix Section III: Geopolitical Calendar
In this <i>Strategy Outlook</i>, we present the major investment themes and views we see playing out for the rest of the year and beyond.
Executive Summary Accelerating wages will make core consumer inflation sticky in the US. In addition, inflation is a lagging variable and is still well above the Fed’s target. These dynamics imply that the Fed will not make a dovish pivot imminently. Following the re-normalization of economic activity after reopening, China’s recovery will be U-shaped, rather than V-shaped. Global manufacturing and exports are heading into contraction. Contracting global trade is bullish for the trade-weighted US dollar given that it is a counter-cyclical currency. A hawkish Fed is also positive for the greenback. Hence, the US dollar will likely overshoot. EM equities are unlikely to rally/outperform on a sustainable basis until an EM profit contraction is priced in and the US dollar starts depreciating. Asian Currencies Will Depreciate
Asian Currencies Will Depreciate
Asian Currencies Will Depreciate
Bottom Line: Absolute return investors should stay defensive for now. The global equity selloff has entered its final capitulation phase. Feature Global equity and fixed-income portfolios should maintain an underweight allocation to EM. That said, we will likely be upgrading EM versus DM later this year. EM currencies have more downside. Global and EM risk assets will likely continue selling off. Our major macro themes remain intact. Accelerating wages will make core consumer inflation sticky in the US. In addition, inflation is a lagging variable and is still well above the Fed’s target. These dynamics imply that the Fed will not make a dovish pivot imminently. Meanwhile, global growth is slowing rapidly, and global trade volumes are on the verge of contracting. US and EU demand for consumer goods (ex autos) is set to shrink. EM ex-China domestic demand will be weakening from already very low levels. Following the re-normalization of Chinese economic activity after the reopening, China’s recovery will be U-shaped, rather than V-shaped. Overall, global profits − including US and EM –will contract. Our bias is that equity markets have not fully discounted a profit contraction. The combination of shrinking corporate profits and a hawkish Fed that is focused on taming inflationary pressures is bearish for global stocks and risk assets. As long as the Fed maintains its hawkish bias and/or global trade contracts, the US trade-weighted dollar will continue to appreciate. The USD will likely overshoot in the near term. Contracting global trade is bullish for the counter-cyclical greenback. EM currencies will therefore continue to depreciate, weighing on EM bonds and stocks. Typically, EM stocks do not out outperform DM ones when the dollar is strengthening. Even though global risk assets have already sold off significantly and there is a temptation to buy, odds are high that there will be another downleg. Several markets are already breaking down below their technical support lines: The Nasdaq 100 index is slipping below its 3-year moving average which proved to be a major support in past selloffs (Chart 1, top panel). The average exchange rate of AUD, NZD and CAD (which are all cyclical commodity currencies) versus the US dollar has fallen below its 3-year moving average (Chart 1, bottom panel). In the commodity space, we have similar breakdowns. Share prices of gold mining companies, silver prices and the silver-to-gold price ratio have all clearly crossed below their 3-year moving averages (Chart 2). Chart 1Breakdowns in The Nasdaq 100 And Commodity Currencies
Breakdowns in The Nasdaq 100 And Commodity Currencies
Breakdowns in The Nasdaq 100 And Commodity Currencies
Chart 2Precious Metal Prices Are Breaking Down Too
Precious Metal Prices Are Breaking Down Too
Precious Metal Prices Are Breaking Down Too
Emerging Asian financial markets underscore that growth is relapsing and demand for raw materials is weak. The top panel of Chart 3 illustrates that Korean materials stocks have broken below their 3-year moving average. Further, in China, rebar steel, rubber, cement and plate glass prices are all falling (Chart 3, middle and bottom panels). Chart 3Bearish Signals For Raw Materials From Asia
Bearish Signals For Raw Materials From Asia
Bearish Signals For Raw Materials From Asia
The charts below provide more evidence, supporting our macro themes and investment strategy. Investment Conclusions Absolute return investors should stay defensive for now. The global equity selloff has entered its final capitulation phase. Global equity and fixed-income portfolios should continue underweighting EM. That said, we will likely be upgrading EM versus DM later this year. The US dollar has more upside. EM/Asian FX and commodity currencies are vulnerable. We also continue to short the following currencies versus the USD: ZAR, COP, PEN, PLN, PHP and IDR; as well as HUF vs. CZK, and KRW vs. JPY. A buying opportunity in global and EM risk assets will emerge once US Treasury yields roll over decisively, the US dollar begins its descent and China provides more stimulus. Arthur Budaghyan Chief Emerging Markets Strategist arthurb@bcaresearch.com The US Equity Bear Market: How Advanced Is It? If this US equity selloff is part of an ongoing bull market that began in 2009, then the drop in share prices is probably over. However, if this same bull market has reached its end, then this selloff has further room to go. Our best guess is that it is the latter, i.e., we might be witnessing the end of the S&P 500 bull market that commenced in 2009. Our S&P 500 Capitulation Indicator is low, but it can drop further. Also, the S&P 500 will likely break below its 3-year moving average, which acted as a support in the 2011, 2015-16 and 2018 selloffs. Chart 4The US Equity Bear Market: How Advanced Is It?
The US Equity Bear Market: How Advanced Is It?
The US Equity Bear Market: How Advanced Is It?
US Corporate Credit And Share Prices The US corporate credit market does not yet point to a durable bottom in US share prices. Rising corporate HY ex-energy bond yields, and the underperformance of HY ex-energy corporate credit versus IG credit, point to lower share prices for now. Chart 5US Corporate Credit And Share Prices
US Corporate Credit And Share Prices
US Corporate Credit And Share Prices
Chart 6US Corporate Credit And Share Prices
US Corporate Credit And Share Prices
US Corporate Credit And Share Prices
The US Inflation Genie Is Out Of The Bottle US labor demand is outstripping labor supply by a record margin since 1950. US wages have accelerated and will remain sticky in the coming months. High wage growth and weaker output entail rising unit labor costs. The latter is a key driver of core inflation. Unless the unemployment rate rises, US core inflation will not drop below 3.5-4%. In fact, median and trimmed-mean CPI have continued rising even though core CPI has rolled over. Chart 7The US Inflation Genie Is Out Of The Bottle
The US Inflation Genie Is Out Of The Bottle
The US Inflation Genie Is Out Of The Bottle
Chart 8The US Inflation Genie Is Out Of The Bottle
The US Inflation Genie Is Out Of The Bottle
The US Inflation Genie Is Out Of The Bottle
Chart 9The US Inflation Genie Is Out Of The Bottle
The US Inflation Genie Is Out Of The Bottle
The US Inflation Genie Is Out Of The Bottle
Chart 10The US Inflation Genie Is Out Of The Bottle
The US Inflation Genie Is Out Of The Bottle
The US Inflation Genie Is Out Of The Bottle
US Manufacturing Is Downshifting Rapidly Railroad carload is declining, and new orders from the US regional Feds’ manufacturing surveys are in free fall. The ISM new orders index will drop below the critical 50 line. Chart 11US Manufacturing Is Downshifting Rapidly
US Manufacturing Is Downshifting Rapidly
US Manufacturing Is Downshifting Rapidly
Chart 12US Manufacturing Is Downshifting Rapidly
US Manufacturing Is Downshifting Rapidly
US Manufacturing Is Downshifting Rapidly
Chart 13US Manufacturing Is Downshifting Rapidly
US Manufacturing Is Downshifting Rapidly
US Manufacturing Is Downshifting Rapidly
The US Is Entering A Major Growth Slump US household demand for consumer goods ex-autos will shrink. The basis is excessive goods purchases in the last two years, falling household disposable income in real terms and a shift in preference for services versus goods. US retail inventories of consumer goods ex-autos have surged. Retailers will substantially cut back on their orders. Asian/Chinese exports are set to shrink. US consumption of gasoline is also contracting. Chart 14The US Is Entering A Major Growth Slump
The US Is Entering A Major Growth Slump
The US Is Entering A Major Growth Slump
Chart 15The US Is Entering A Major Growth Slump
The US Is Entering A Major Growth Slump
The US Is Entering A Major Growth Slump
Chart 16The US Is Entering A Major Growth Slump
The US Is Entering A Major Growth Slump
The US Is Entering A Major Growth Slump
Global Manufacturing And Exports Are Heading Into Contraction The relative performance of global cyclical stocks versus defensives points to a major relapse in global manufacturing. Chinese import volumes have been contracting and EM import volumes will drop too with the deteriorating purchasing power of households across many developing economies. Chart 17Global Manufacturing And Exports Are Heading Into Contraction
Global Manufacturing And Exports Are Heading Into Contraction
Global Manufacturing And Exports Are Heading Into Contraction
Chart 18Global Manufacturing And Exports Are Heading Into Contraction
Global Manufacturing And Exports Are Heading Into Contraction
Global Manufacturing And Exports Are Heading Into Contraction
Chart 19Global Manufacturing And Exports Are Heading Into Contraction
Global Manufacturing And Exports Are Heading Into Contraction
Global Manufacturing And Exports Are Heading Into Contraction
Contracting Asian Exports Are Negative For Asian Currencies There are already signs of contraction in Asian manufacturing/exports. Downshifting global trade typically leads to Asian currency depreciation. Chart 20Contracting Asian Exports Are Negative For Asian Currencies
Contracting Asian Exports Are Negative For Asian Currencies
Contracting Asian Exports Are Negative For Asian Currencies
Chart 21Contracting Asian Exports Are Negative For Asian Currencies
Contracting Asian Exports Are Negative For Asian Currencies
Contracting Asian Exports Are Negative For Asian Currencies
Chart 22Contracting Asian Exports Are Negative For Asian Currencies
Contracting Asian Exports Are Negative For Asian Currencies
Contracting Asian Exports Are Negative For Asian Currencies
Chart 23Contracting Asian Exports Are Negative For Asian Currencies
Contracting Asian Exports Are Negative For Asian Currencies
Contracting Asian Exports Are Negative For Asian Currencies
The USD Has More Upside, EM FX More Downside The EM ex-China currency total return index has failed to break above its technical resistance line. This entails a major downside. The underperformance of global cyclicals versus defensives points to lower Asian currencies. The US dollar (shown inverted on Chart 24) will be supported by a deceleration in global US dollar liquidity. Chart 24The USD Has More Upside, EM FX More Downside
The USD Has More Upside, EM FX More Downside
The USD Has More Upside, EM FX More Downside
Chart 25The USD Has More Upside, EM FX More Downside
The USD Has More Upside, EM FX More Downside
The USD Has More Upside, EM FX More Downside
Chart 26The USD Has More Upside, EM FX More Downside
The USD Has More Upside, EM FX More Downside
The USD Has More Upside, EM FX More Downside
EM Equity Capitulation Our EM Equity Capitulation Indicator has dropped significantly but is still above its 2008, 2015-16 and 2020 lows. Given the global and EM macro backdrops, odds point to an undershoot in EM share prices. Chart 27EM Equity Capitulation
EM Equity Capitulation
EM Equity Capitulation
EM Equity And Bond Sentiment Investor sentiment on EM stocks and EM USD bonds is downbeat. This is positive from a contrarian perspective. However, as global risk assets continue selling off and the US dollar overshoots, EM stocks and bonds might undershoot. Chart 28EM Equity And Bond Sentiment
EM Equity And Bond Sentiment
EM Equity And Bond Sentiment
Chart 29EM Equity And Bond Sentiment
EM Equity And Bond Sentiment
EM Equity And Bond Sentiment
EM Equity Valuations And Profits Based on our cyclically adjusted P/E ratio, EM equity valuations have improved to one standard deviation below the mean. Relative to the S&P 500, EM stock valuations are at their record low based on a similar measure. Nevertheless, EM equities are unlikely to rally/outperform on a sustainable basis until an EM profit contraction is priced in and the US dollar starts depreciating. Chart 30EM Equity Valuations And Profits
EM Equity Valuations And Profits
EM Equity Valuations And Profits
Chart 31EM Equity Valuations And Profits
EM Equity Valuations And Profits
EM Equity Valuations And Profits
Chart 32EM Equity Valuations And Profits
EM Equity Valuations And Profits
EM Equity Valuations And Profits
Chart 33EM Equity Valuations And Profits
EM Equity Valuations And Profits
EM Equity Valuations And Profits
Four Large-Cap EM Stocks The four largest EM stocks (by market value) might not be out of the woods. Alibaba is facing resistance at its 200-day moving average. Tencent, TSMC and Samsung will likely drop to their next technical support lines. Chart 34Four Large-Cap EM Stocks
Four Large-Cap EM Stocks
Four Large-Cap EM Stocks
Chart 35Four Large-Cap EM Stocks
Four Large-Cap EM Stocks
Four Large-Cap EM Stocks
Chart 36Four Large-Cap EM Stocks
Four Large-Cap EM Stocks
Four Large-Cap EM Stocks
Chart 37Four Large-Cap EM Stocks
Four Large-Cap EM Stocks
Four Large-Cap EM Stocks
Chinese And EM ex-China Stocks The rally in the Chinese onshore CSI 300 stock index will probably dwindle at its 200-day moving average. Technical supports have held up for Chinese investable TMT and non-TMT stocks. However, the recent rebound is unlikely to be sustained if the global selloff continues. Finally, EM ex-China stocks have been in a free fall. Chart 38Chinese And EM ex-China Stocks
Chinese And EM ex-China Stocks
Chinese And EM ex-China Stocks
Chart 39Chinese And EM ex-China Stocks
Chinese And EM ex-China Stocks
Chinese And EM ex-China Stocks
Chart 40Chinese And EM ex-China Stocks
Chinese And EM ex-China Stocks
Chinese And EM ex-China Stocks
Chart 41Chinese And EM ex-China Stocks
Chinese And EM ex-China Stocks
Chinese And EM ex-China Stocks
Global Cross-Asset Interlinkages Rising US TIPS yields will keep upward pressure on EM local bond yields and downward pressure on EM currencies. The mainstream EM ex-China currencies are not cheap. Without EM currencies rallying, it will be difficult for EM stocks to outperform DM ones. Chart 42Global Cross-Asset Interlinkages
Global Cross-Asset Interlinkages
Global Cross-Asset Interlinkages
Chart 43Global Cross-Asset Interlinkages
Global Cross-Asset Interlinkages
Global Cross-Asset Interlinkages
Chart 44Global Cross-Asset Interlinkages
Global Cross-Asset Interlinkages
Global Cross-Asset Interlinkages
A Structural Breakdown In Chinese Real Estate The Chinese real estate market is experiencing a structural breakdown, as is illustrated by the collapse in share prices of Chinese property developers and their corporate bond prices. The breakdown in property developers’ financing heralds lower construction volumes with negative implications for raw material prices. Chart 45A Structural Breakdown In Chinese Real Estate
A Structural Breakdown In Chinese Real Estate
A Structural Breakdown In Chinese Real Estate
Chart 46A Structural Breakdown In Chinese Real Estate
A Structural Breakdown In Chinese Real Estate
A Structural Breakdown In Chinese Real Estate
Chart 47A Structural Breakdown In Chinese Real Estate
A Structural Breakdown In Chinese Real Estate
A Structural Breakdown In Chinese Real Estate
Chart 48A Structural Breakdown In Chinese Real Estate
A Structural Breakdown In Chinese Real Estate
A Structural Breakdown In Chinese Real Estate
Chinese Domestic Demand Has Been Absent Over The Past 12 Months Chinese imports of various commodities and goods have been contracting over the past 12 months. The resilience of commodity prices has not been due to China. As investors start pricing in the US economic downturn and the need for inflation protection wanes, commodity prices could gap down. Chart 49Chinese Domestic Demand Has Been Absent Over The Past 12 Months
Chinese Domestic Demand Has Been Absent Over The Past 12 Months
Chinese Domestic Demand Has Been Absent Over The Past 12 Months
Chart 50Chinese Domestic Demand Has Been Absent Over The Past 12 Months
Chinese Domestic Demand Has Been Absent Over The Past 12 Months
Chinese Domestic Demand Has Been Absent Over The Past 12 Months
Will The Pendulum Swing From Inflation To Deflation? The US equity and bond market selloffs of the past 12 months have wiped out about $12 trillion and $3.5 trillion of their respective market value, respectively. This adds up to a combined $15 trillion or about 60% of US GDP, which already exceeds the wipeouts that occurred during the March 2020 crash and all other bear markets. Such wealth destruction and a hawkish Fed could swing the pendulum from inflation to deflation. Commodity prices are currently vulnerable. Stay tuned. Chart 51Will The Pendulum Swing From Inflation To Deflation?
Will The Pendulum Swing From Inflation To Deflation?
Will The Pendulum Swing From Inflation To Deflation?
Chart 52Will The Pendulum Swing From Inflation To Deflation?
Will The Pendulum Swing From Inflation To Deflation?
Will The Pendulum Swing From Inflation To Deflation?
Chart 53Will The Pendulum Swing From Inflation To Deflation?
Will The Pendulum Swing From Inflation To Deflation?
Will The Pendulum Swing From Inflation To Deflation?
Footnotes Strategic Themes (18 Months And Beyond) Equities Cyclical Recommendations (6-18 Months) Cyclical Recommendations (6-18 Months)
Executive Summary Long-Term Contracts Needed To Increase LNG Supply
EU Will Reverse Course On Fossil Fuels
EU Will Reverse Course On Fossil Fuels
The EU will have to reverse course and execute long-term contracts with natural gas producers, LNG shippers and pipeline operators to incentivize production of supplies needed to contain energy prices. Long-term contracting will offer the EU an opportunity to address political and economic fragmentation risks via joint taxation policies. This would transform state-level risks via-a-vis energy and military security into joint-and-several obligations. The G7’s plan to cap Russian oil prices will be DOA. The most oil import-dependent EM economies – China and India – will find deeply discounted crude irresistible. Hydrocarbon producers and refiners will increase investments in carbon-capture and storage technology, to maintain their new-found advantage as secure energy sources. Additional subsidies and funding for this technology will be forthcoming. Bottom Line: The hard realities of military conflict and a lack of investment in production and refining will force governments to incentivize substantial investments in hydrocarbons – particularly natural gas and LNG infrastructure – to address global energy scarcity during a time of war. We remain long oil and gas exposures via the COMT ETF, and long equity refining and services exposures via the CRAK and IEZ ETFs. We will re-establish our producer-oriented XOP ETF position if prompt Brent futures trade down to $105/bbl in the front month. We also remain tactically long Brent and eurozone natgas futures and options. Feature The G7 last opined on liquified natural gas (LNG) supply in May, and as was the case this week, it left even casual observers uncertain as to what it is seeking to achieve: It advocated for a halt to further investments in fossil-fuel projects and, at the same time, called for higher LNG supplies to be provided for the EU states.1 The EU faces daunting energy security and supply constraints.2 A deepening energy scarcity will, we expect, push the EU into recession later this year, as natural-gas rationing is invoked to ensure there are sufficient supplies to meet human needs this winter. Natgas scarcity will force the EU to reverse course on its renewable-energy transition in the medium term and prioritize fossil-fuel investments, in our view. Long-term contracting with LNG suppliers will be required to incentivize needed investment in production and transportation to replace Russian gas imports. Such contracting is a necessity for hydrocarbon producers, given governments’ continued calls for no additional fossil-fuel investment. Quicksilver shifts in policy are a continuing source of uncertainty for investors and energy-supply firms. Over time, the EU will have to replace close to 7 Tcf/yr of Russian gas imports (Chart 1, middle panel). This will propel the EU into the ranks of the world’s largest LNG importers (Chart 2). Chart 1EU Needs To Replace ~ 7 Tcf/yr Of LNG
EU Will Reverse Course On Fossil Fuels
EU Will Reverse Course On Fossil Fuels
Chart 2EU Will Become A World-Class LNG Importer
EU Will Become A World-Class LNG Importer
EU Will Become A World-Class LNG Importer
Chart 3Long-Term Contracts Needed To Increase LNG Supply
EU Will Reverse Course On Fossil Fuels
EU Will Reverse Course On Fossil Fuels
Given the length of contracts typically executed with LNG exporters – in excess of 20-plus years – EU governments will be compelled to allow firms and member states to sign long-term contracts for these supplies. EU governments also will be required to begin planning for and developing LNG importing infrastructure, as these supplies become available over the next 3-5 years. In the meantime, LNG prices will remain under pressure as competition heats up globally ahead of the coming winter (Chart 3). G7 Price-Cap Scheme Will Be DOA The G7’s scheme to impose a price cap on Russian oil exports will be DOA as soon as details are presented. This is because the world’s largest oil import-dependent economies – China and India – not only have long trading histories with Russia, but they also operate their own oil-transport fleets that can circumvent insurance-related obstacles imposed by the US and the UK. China and India already find discounted Russian oil irresistible, and are unlikely to acquiesce to US demands for a price cap. China imports 75% of its 15.5mm b/d of oil consumption, while India imports ~ 85% of the 5mm b/d of oil it consumes. Even if oil importers taking Russia's exports going to the EU were to sign on to a price-cap scheme, Russia could always unilaterally cut its oil and condensate production by 20-30% and force Brent prices sharply higher for remaining contract holders. This would almost surely lead to higher prices – above $140/bbl, based on our earlier estimates – and raise Russia’s net export proceeds in the process, since the G7 does not want all of Russia's oil taken off the market.3 Government Interventions Exacerbate Scarcity Governments of states with contestable elections increasingly are intervening – or attempting to do so – in global energy markets and imposing often-contradictory policies that nominally favor consumers at the expense of energy producers. This almost always is counter-productive: Price caps intended to soften the blow of higher-cost electricity and hydrocarbons discourages the necessary conservation of scarce resources. So-called windfall profits taxes discourage the investment required to address supply scarcity. Higher demand and lower supply does not lead to lower prices. Even grander schemes – e.g., the monopsony cartels floated by G7 member states like the US and EU, along with China – almost surely would reduce the profitability of developing and marketing new energy supplies, which also would exacerbate scarcity of supply by discouraging investment. These quick ad hoc fixes work at cross purposes in solving the problem of global energy scarcity. While they are in keeping with a penchant of governments to demonstrate they are addressing voters’ concerns, such policies mistake a quick response for long-term solutions. Investment Implications The EU will, in our opinion, be forced to reverse course and sign long-term LNG supply contracts to replace Russian natural gas imports. This will not derail its renewable-energy transition strategy, but it will significantly delay it. We remain long oil and gas exposures via the S&P GSCI and COMT ETF, and long equity refining and services exposures via the CRAK and IEZ ETFs. We will re-establish our producer-focused XOP ETF position if Brent trades down to $105/bbl in the front month. We also remain tactically long Brent and eurozone natgas futures and options (see p. 7 below). Housekeeping Notes We were stopped out of our long S&P GSCI position with a gain of 64%. We are getting long again at the close. We also were stopped out of our long 4Q22 $120/bbl Brent calls with a 16% return. Separately, there will be no Commodity Round-Up in this week’s publication. We are broadcasting our Commodity Round-Up today at 9 a.m. EDT. Robert P. Ryan Chief Commodity & Energy Strategist rryan@bcaresearch.com Footnotes 1 Please see The G7 wants to dump natural gas … but not yet published by politico.com 27 May 2022. The report notes, “The G7 called for an end to international investments in fossil fuels by the end of this year and slammed private finance for continuing to back dirty energy — but left a big out for EU countries desperate to replace Russian gas. ‘We acknowledge that investment in [the liquefied natural gas] sector is necessary in response to the current crisis, in a manner consistent with our climate objectives and without creating lock-in effects,’ the ministers said.” 2 Please see One Hot Mess: EU Energy Policy, published 26 May 2022. This report delves into the EU’s post-Cold War foreign policy. For three decades, EU foreign policy largely was set by Germany, the organization's most powerful economy. Successive generations of German politicians championed the idea that the West could bring the former Soviet Union – and later Russia – into the modern world of global trade through Ostpolitik, which had, at its core, a belief in the power of trade to effect political and economic change. This policy is kaput. 3 Please see Higher Gasoline, Diesel Prices Ahead, which we published 2 June 2022. It is available at ces.bcaresearch.com. Investment Views and Themes Strategic Recommendations Tactical Trades Trades Closed in 2022
BCA Research’s China Investment Strategy service continues to recommend a neutral stance in Chinese equities within a global portfolio. China’s economic data moved up slightly in May from an extremely depressed level in April. A normalization of the supply…
Executive Summary Depressing Housing Market And Service Sector Activity
Depressing Housing Market And Service Sector Activity
Depressing Housing Market And Service Sector Activity
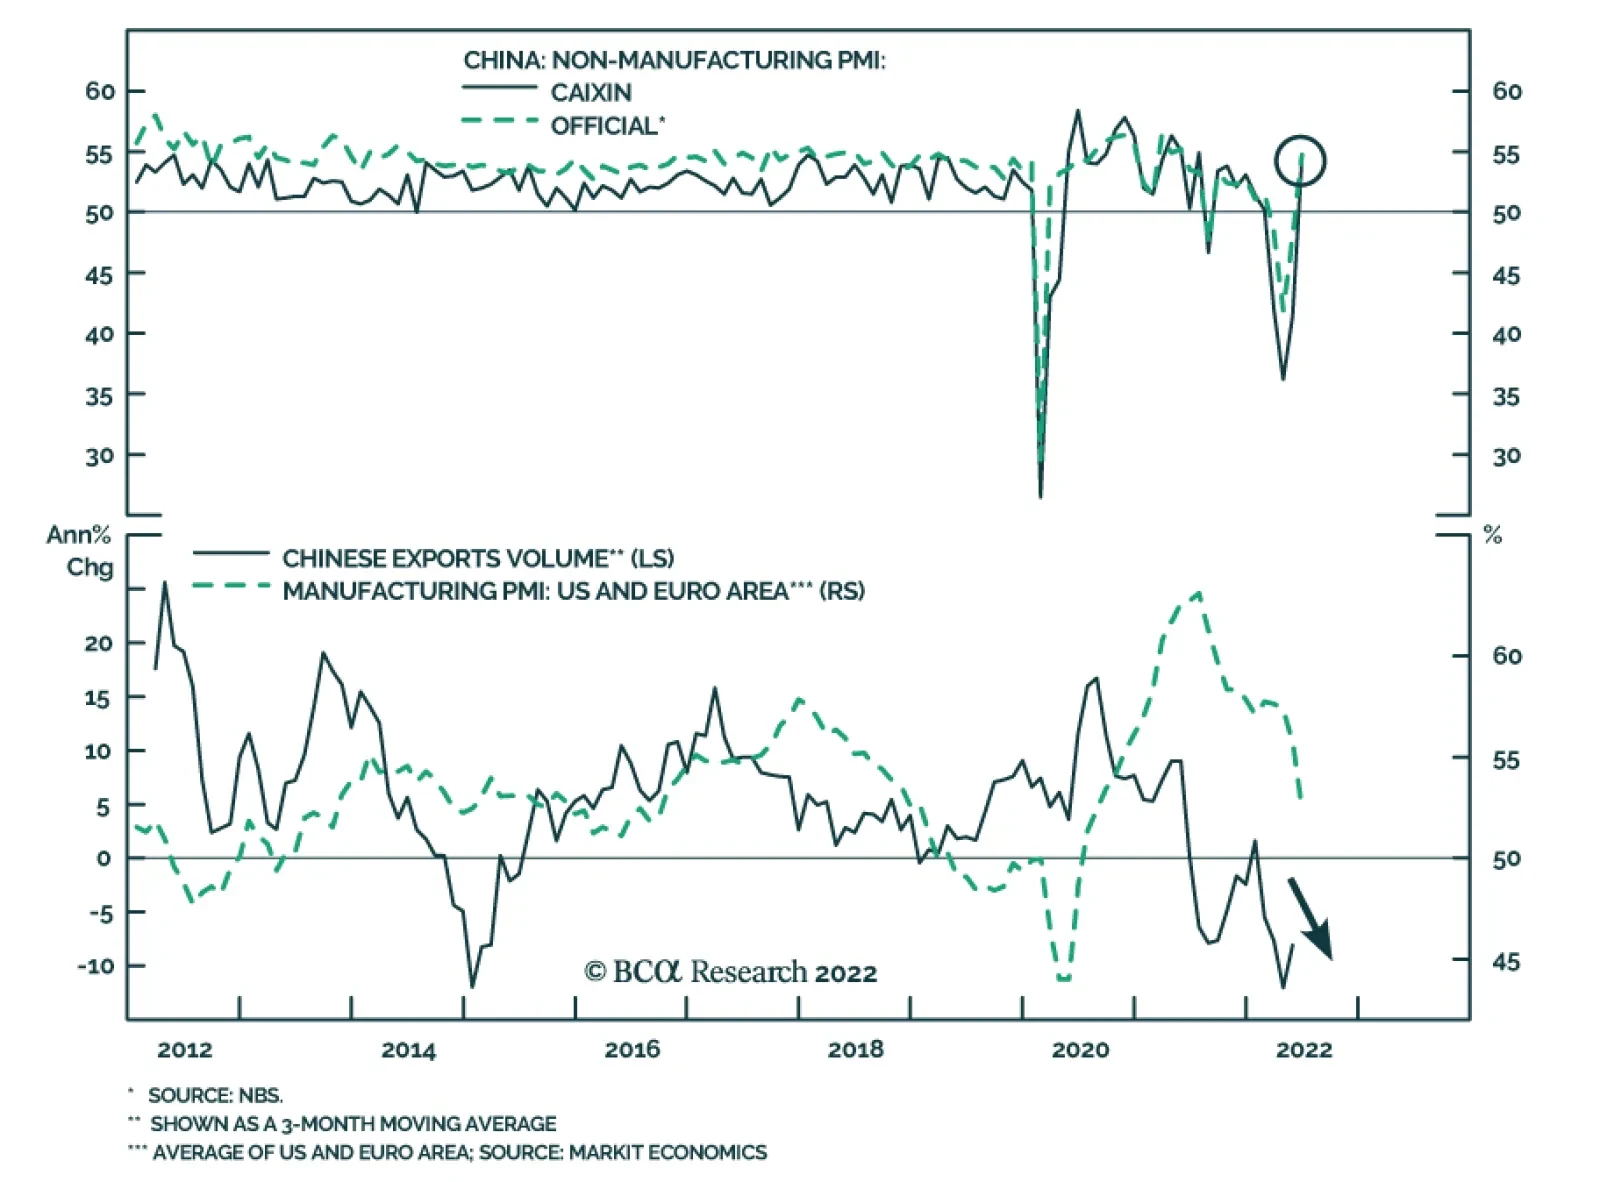
May’s economic data ticked up from extremely depressed levels in April, driven by a normalization in the supply chain and a resumption in production. The service sector and housing market continued to shrink on a year-on-year (YOY) basis and sentiment among households and corporates remains lackluster. The rebound in exports growth in May will likely be unsustainable. Chinese exports are set to contract from 2021 as external demand for goods weakens. The rapidly worsening labor market dynamics reinforce households’ unwillingness to consume and hence, will hinder the recovery in household consumption. Although industrial production showed a decent rebound in May, the manufacturing production recovery might be derailed by rolling lockdowns and prolonged logistic bottlenecks. Barring major lockdowns, China’s economy will likely improve in 2H 2022 from the very low base in Q2. That said, the country’s economic recovery faces several challenges and the magnitude of the rebound will be subdued. Bottom Line: The elements for a robust and sustainable recovery in the Chinese economy are not yet in place. The recent rally in the A-share market reflects a mean-reversal to the pre-March lockdown price level, rather than the beginning of a cyclical bull market. Investors should remain cautious on Chinese equities in the next several months. Feature China’s economic data moved up slightly in May from an extremely depressed level in April. A normalization of the supply chain and a resumption of production post-lockdown in Shanghai and other cities led to a modest recovery in business activities. However, indicators from the service sector and housing market continued to shrink on a YOY basis, highlighting persistent weaknesses on the demand side. Chart 1Import Dynamics Reflect Weak Domestic Demand
Import Dynamics Reflect Weak Domestic Demand
Import Dynamics Reflect Weak Domestic Demand
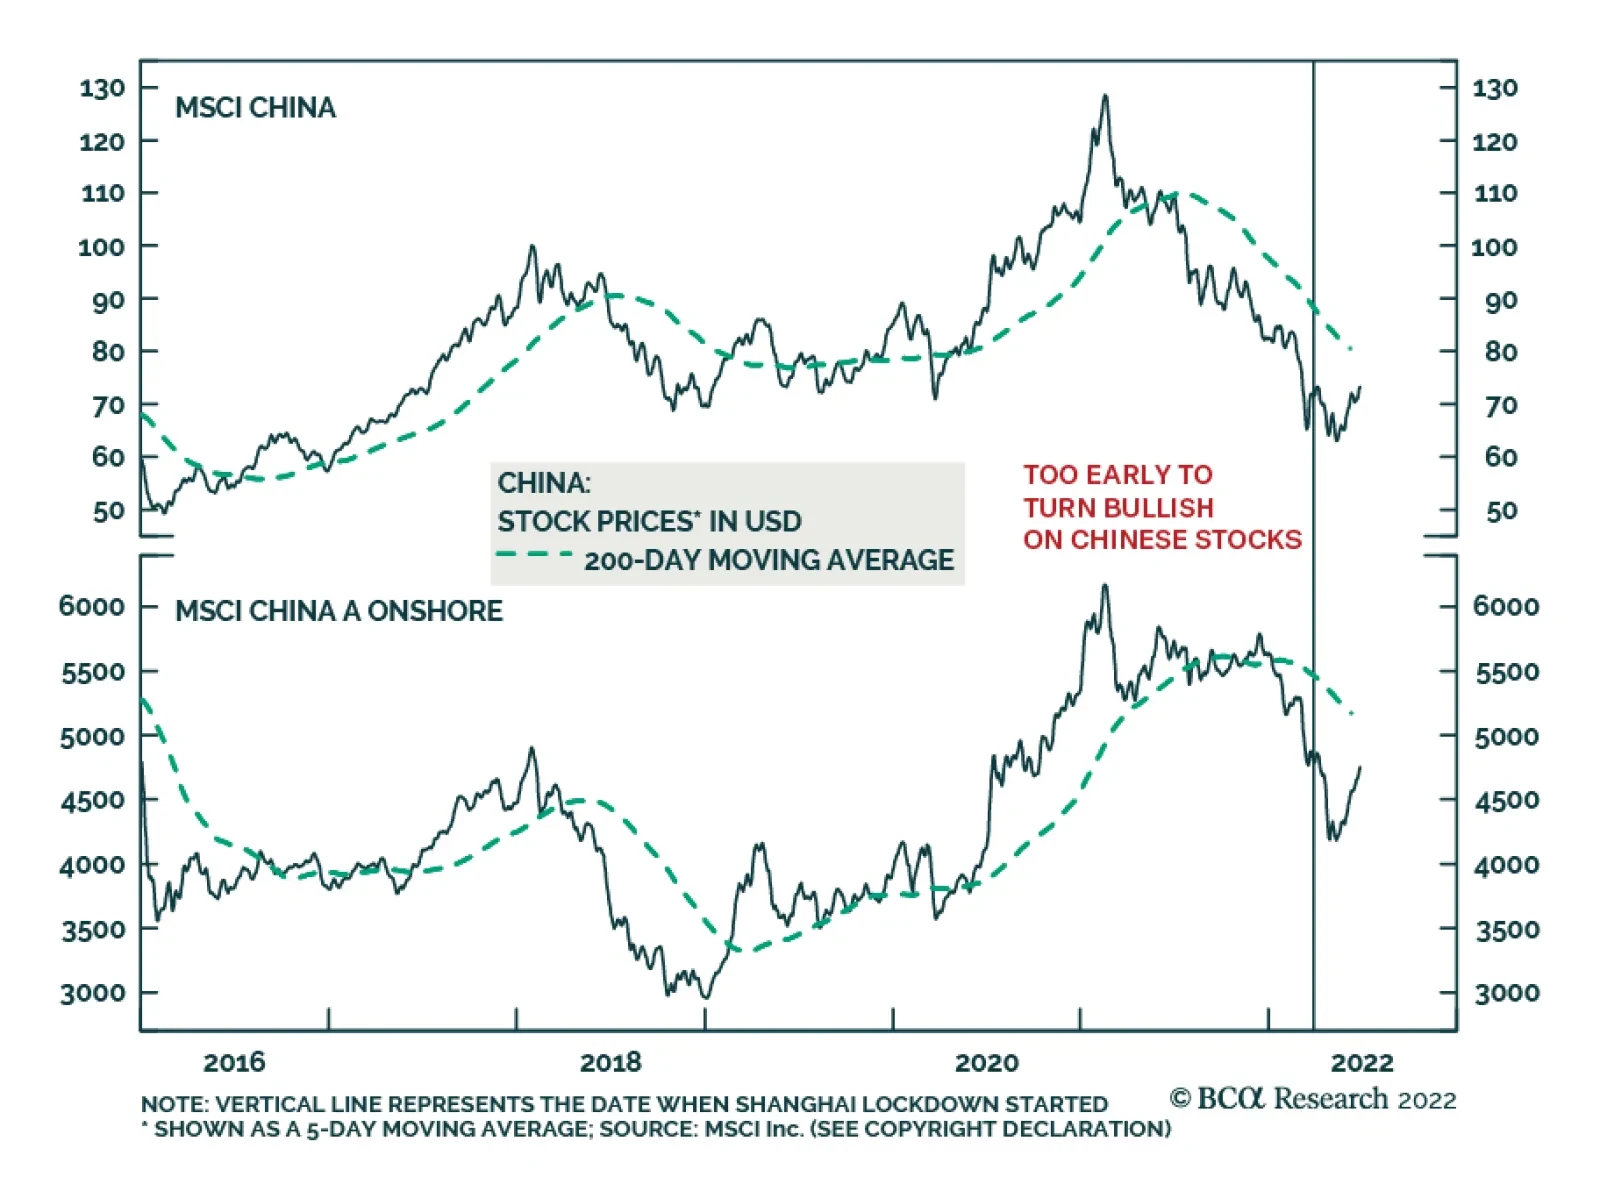
May’s import data also reflects sluggish domestic demand. The increase in imports value from a year ago was largely driven by the elevated prices in energy and agriculture products. China’s imports in May, in volume terms, continued to contract on a YOY basis, albeit improved from its historical low in April (Chart 1). Barring major lockdowns, China’s economy will likely improve in the second half of this year. However, the economic recovery in 2H 2022 will be very subdued due to the following challenges: Downbeat sentiment among households and enterprises; Continued real estate woes; A contraction in exports; Deteriorating labor market conditions; and Risk of rolling lockdowns and persistent logistic bottlenecks. The recent rebound in the A-share market reflects an improvement in investors’ sentiment buttressed by the easing of lockdowns and a resumption of production. In other words, the rebound in Chinese stock prices is probably a mean-reversal to pre-lockdown levels, rather than a sustainable rally (Chart 2). Our cautious view on Chinese equities is also corroborated by the divergence between falling raw industrial prices, which reflect weak China’s growth, and rising Chinese equity prices (Chart 3). Overall, we continue to recommend a neutral stance in Chinese equities within a global portfolio. Chart 2Too Early To Turn Bullish On Chinese Stocks
Too Early To Turn Bullish On Chinese Stocks
Too Early To Turn Bullish On Chinese Stocks
Chart 3Falling Prices In Raw Materials Do Not Signal An Imminent Round In Demand
Falling Prices In Raw Materials Do Not Signal An Imminent Round In Demand
Falling Prices In Raw Materials Do Not Signal An Imminent Round In Demand
Qingyun Xu, CFA Associate Editor qingyunx@bcaresearch.com Downbeat Household And Corporate Sentiment Chart 4Subdued Bank Loan Growth Has Been A Drag On Credit Expansion
Subdued Bank Loan Growth Has Been A Drag On Credit Expansion
Subdued Bank Loan Growth Has Been A Drag On Credit Expansion
Although China’s credit growth improved sequentially in May after a very weak reading in April, the magnitude of May’s credit rebound is much more subdued compared with the months following the first lockdowns in early 2020 (Chart 4). In addition, May’s rebound in credit growth was mainly driven by an acceleration in local government bond issuance. The modest pickup in the credit impulse - calculated as a 12-month change in total social financing (TSF) as a percentage of nominal GDP - is much more muted when excluding local government bond issuance (Chart 5). Furthermore, as noted in our previous report, given that most of the planned local government special purpose bonds (SPBs) will be issued by the end of June, barring any increase in this year’s SPBs quota, the support from local government bond issuance to TSF growth will likely wane significantly in the second half of 2022. Meanwhile, confidence among consumers and businesses remained downbeat through May (Chart 6). The poor private-sector sentiment will continue to dampen credit demand and thus, limit the effectiveness of monetary stimulus. Chart 5The Rebound In Credit Impulse Is Much More Muted When Excluding Local Government Bond Issuance
The Rebound In Credit Impulse Is Much More Muted When Excluding Local Government Bond Issuance
The Rebound In Credit Impulse Is Much More Muted When Excluding Local Government Bond Issuance
Chart 6Gloomy Sentiment Among Chinese Households And Enterprises
Gloomy Sentiment Among Chinese Households And Enterprises
Gloomy Sentiment Among Chinese Households And Enterprises
Private-sector credit demand remains very frail. Household medium- to long-term loans are still contracting from previous month, while bank loans to corporate peers were also weak in May (Chart 7 & 8). Chart 7Depressed Household Loan Demand
Depressed Household Loan Demand
Depressed Household Loan Demand
Chart 8Corporate Demand For Credit Remains Weak Despite Accommodative Monetary Conditions
Corporate Demand For Credit Remains Weak Despite Accommodative Monetary Conditions
Corporate Demand For Credit Remains Weak Despite Accommodative Monetary Conditions
Chart 9Deterioration In Corporate Sentiment Is Also Reflected In Surveys of Business Conditions
Deterioration In Corporate Sentiment Is Also Reflected In Surveys of Business Conditions
Deterioration In Corporate Sentiment Is Also Reflected In Surveys of Business Conditions
On the other hand, corporate bill financing as a portion of new bank loans, although rolled over from April’s record high, remained very elevated through May (Chart 8, bottom panel). Moreover, enterprises’ financing and investment expectations deteriorated further in May (Chart 9). Persisting Real Estate Woes The near-term outlook for China’s property market remains uninspiring. So far, easing measures in the housing sector have not been successful in reviving home sales and homebuyers’ sentiment. Residential property sales and real estate investment growth ticked up slightly in May after plummeting by 43% and 10% in April, respectively (Chart 10). However, the modest improvement in May does not mark the start of a full-fledged cyclical recovery. High-frequency data show a renewed weakening in floor space sales, particularly in tier-one and tier-two cities, during the first two weeks of June (Chart 11). Chart 10The Slight Improvement In Housing Market Indicators Does Not Signal A Cyclical Recovery
The Slight Improvement In Housing Market Indicators Does Not Signal A Cyclical Recovery
The Slight Improvement In Housing Market Indicators Does Not Signal A Cyclical Recovery
Chart 11Renewed Deterioration In Home Sales In June
Renewed Deterioration In Home Sales In June
Renewed Deterioration In Home Sales In June
Chart 12Real Estate Developers' Decreased Funding Will Further Dampen Housing Construction Activities
Real Estate Developers' Decreased Funding Will Further Dampen Housing Construction Activities
Real Estate Developers' Decreased Funding Will Further Dampen Housing Construction Activities
Funds to real estate developers have been contracting at the fastest rate since data collection began in 1998. The lack of funding for real estate developers will further depress housing construction activities in the near term (Chart 12). Moreover, new home prices, which tend to lead housing starts, started to decrease on a YOY basis in May. This was the first price contraction since 2016. Our housing price diffusion index suggests that home price growth will continue to shrink in the next six to nine months (Chart 13). Many local cities reduced mortgage rates, by anywhere from 15 to more than 100 basis points, after the PBoC lowered mortgage rate floor and the benchmark rate (5-year LPR) in May. However, the average cost of mortgage loans remains higher than households’ income growth, making mortgage borrowing less attractive to ordinary households (Chart 14). Chart 13Housing Prices Are Set To Decline Further In 2H 2022
Housing Prices Are Set To Decline Further In 2H 2022
Housing Prices Are Set To Decline Further In 2H 2022
Chart 14Mortgage Rates Have Dropped, But Still Higher Than Income And Home Price Growth
Mortgage Rates Have Dropped, But Still Higher Than Income And Home Price Growth
Mortgage Rates Have Dropped, But Still Higher Than Income And Home Price Growth
In addition, the widening gap between the average mortgage rate and the pace of housing price appreciation implies that housing has become much less appealing to residents who purchase homes as investment (Chart 14, bottom panel). In short, property purchases will remain weak given neither “to live in” nor investment demand for properties is likely to recover fast. China's Exports Are Set To Contract In 2H 2022 China’s exports rebounded in May from the April low as supply chain interruptions subsided and logistic disruptions began to ease. However, as US and European consumer spending on goods (excluding autos) declines, Chinese shipments will shrink in the months ahead. May’s improvement in suppliers’ delivery times and product inventory subindexes of China’s official Purchasing Managers’ Index (PMI) suggests that logistics were less of a drag on economic activity than in April (Chart 15). In addition, Shanghai and China’s exports freight indexes recovered significantly on a month-over-month basis (Chart 16) with the lifting of lockdown measures. Chart 15Chinese Logistics Pressures Have Eased Slightly In May...
Chinese Logistics Pressures Have Eased Slightly In May...
Chinese Logistics Pressures Have Eased Slightly In May...
Chart 16...And Export Freight Indices Have Rebounded
...And Export Freight Indices Have Rebounded
...And Export Freight Indices Have Rebounded
Chart 17Global Demand Is Dwindling
Global Demand Is Dwindling
Global Demand Is Dwindling
Meanwhile, global demand for goods has been weakening. Korean exports volume growth, a bellwether for global trade, has been trending down since late 2021 (Chart 17). Moreover, the US and Euro Area manufacturing PMIs have been falling (Chart 17, bottom panel). Spending in developed economies is shifting from manufactured goods to services. Retail inventories in the US are well above their pre-pandemic trend, suggesting that the demand growth for Chinese goods will dwindle when US retailers start to destock their inventories (Chart 18). Falling US and Euro Area real household disposable income will also reinforce the downward trend in external demand (Chart 19). Therefore, China's exports are set to shrink in the second half of this year. Chart 18Well-Stocked Shelves In The US Bode Poorly For Chinese Export Demand
Well-Stocked Shelves In The US Bode Poorly For Chinese Export Demand
Well-Stocked Shelves In The US Bode Poorly For Chinese Export Demand
Chart 19A Contraction in US and Euro Area Household Real Disposable Income
A Contraction in US and Euro Area Household Real Disposable Income
A Contraction in US and Euro Area Household Real Disposable Income
Deteriorating Labor Market Conditions Will Curb Household Consumption Recovery Although improved from April’s extreme low, Chinese retail sales and service activity remained in contractionary territory in May, highlighting sluggish household demand (Chart 20). In addition, the cinema audience, which is used to gauge the impact of the pandemic on the service sector, indicates a further deterioration in the sector’s activity in June (Chart 20, bottom panel). The lackluster consumer demand is also evidenced by soft core and service consumer prices (CPI) in May (Chart 21). Chart 20Chinese Retail Sales And Service Activity Continued To Contract In May
Chinese Retail Sales And Service Activity Continued To Contract In May
Chinese Retail Sales And Service Activity Continued To Contract In May
Chart 21Soft Core And Service CPIs Also Reflect Lackluster Household Demand
Soft Core And Service CPIs Also Reflect Lackluster Household Demand
Soft Core And Service CPIs Also Reflect Lackluster Household Demand
Labor market conditions have also worsened. Although the nationwide urban survey-based unemployment rate fell moderately in May, the 31-large city surveyed unemployment rate climbed to an all-time high in the 10-year history of this survey. Moreover, employment in the service sector deteriorated to the worst level since mid-2020 (Chart 22). Furthermore, urban new job creation fell into deep shrinkage on a YOY basis, while the unemployment rate among younger workers rose to the highest point since data collection began in 2018 (Chart 23). Chart 22Labor Market Situation Is Worsening Rapidly...
Labor Market Situation Is Worsening Rapidly...
Labor Market Situation Is Worsening Rapidly...
Chart 23...Particularly Among Younger Workers
...Particularly Among Younger Workers
...Particularly Among Younger Workers
Chart 24Weak Sentiment On Future Income Contributes To Households' Unwillingness To Consume
Weak Sentiment On Future Income Contributes To Households' Unwillingness To Consume
Weak Sentiment On Future Income Contributes To Households' Unwillingness To Consume
The rapidly worsening labor market dynamics and income prospects reinforce households’ downbeat sentiment (Chart 24). The latter will impede household consumption recovery in the second half of this year. Production Recovery Faces Risks Of Persistent Logistic Bottlenecks The uptick in industrial activity in May was due to a lifting of Covid-related lockdown restrictions. Although industrial production showed a decent rebound, underlying data suggest that economic fundamentals remained subdued. Chart 25Industrial Activity Improved Only Slightly In May
Industrial Activity Improved Only Slightly In May
Industrial Activity Improved Only Slightly In May
Chart 26Construction Material Production Continues To Shrink On A YOY Basis
Construction Material Production Continues To Shrink On A YOY Basis
Construction Material Production Continues To Shrink On A YOY Basis
Electricity output remained in contractionary territory through May (Chart 25). Cement and steel output continued shrinking from the same period last year (Chart 26). Moreover, their prices have been falling even though production growth has been waning, which indicates that demand in the construction sector is depressed (Chart 3, bottom panel). Consumer durable goods production also remains well below their levels from a year ago (Chart 27 & 28). Chart 27Auto And Smartphone Production Keeps Decreasing From A Year Ago...
Auto And Smartphone Production Keeps Decreasing From A Year Ago...
Auto And Smartphone Production Keeps Decreasing From A Year Ago...
Chart 28… As Well As Production Of Home Appliances
...As Well As Production Of Home Appliances
...As Well As Production Of Home Appliances
Chart 29Prolonged Logistic Bottlenecks
Prolonged Logistic Bottlenecks
Prolonged Logistic Bottlenecks
Chinese manufacturing investment rebounded in May. However, since exports will likely shrink in the second half of this year, it will create a major headwind for manufacturing investment and output. Moreover, China’s manufacturing production will likely be challenged by persistent logistic bottlenecks in 2H 2022. Chinese road freight was still declining in the first three weeks in June from the same period last year as shown in Chart 29. The risk of renewed Covid-induced lockdowns or mobility restrictions are nontrivial since China will maintain its zero-Covid policy at least through the end of this year. Table 1China Macro Data Summary
A Muted Post-Lockdown Recovery Ahead
A Muted Post-Lockdown Recovery Ahead
Table 2China Financial Market Performance Summary
A Muted Post-Lockdown Recovery Ahead
A Muted Post-Lockdown Recovery Ahead
Footnotes Strategic Themes Cyclical Recommendations
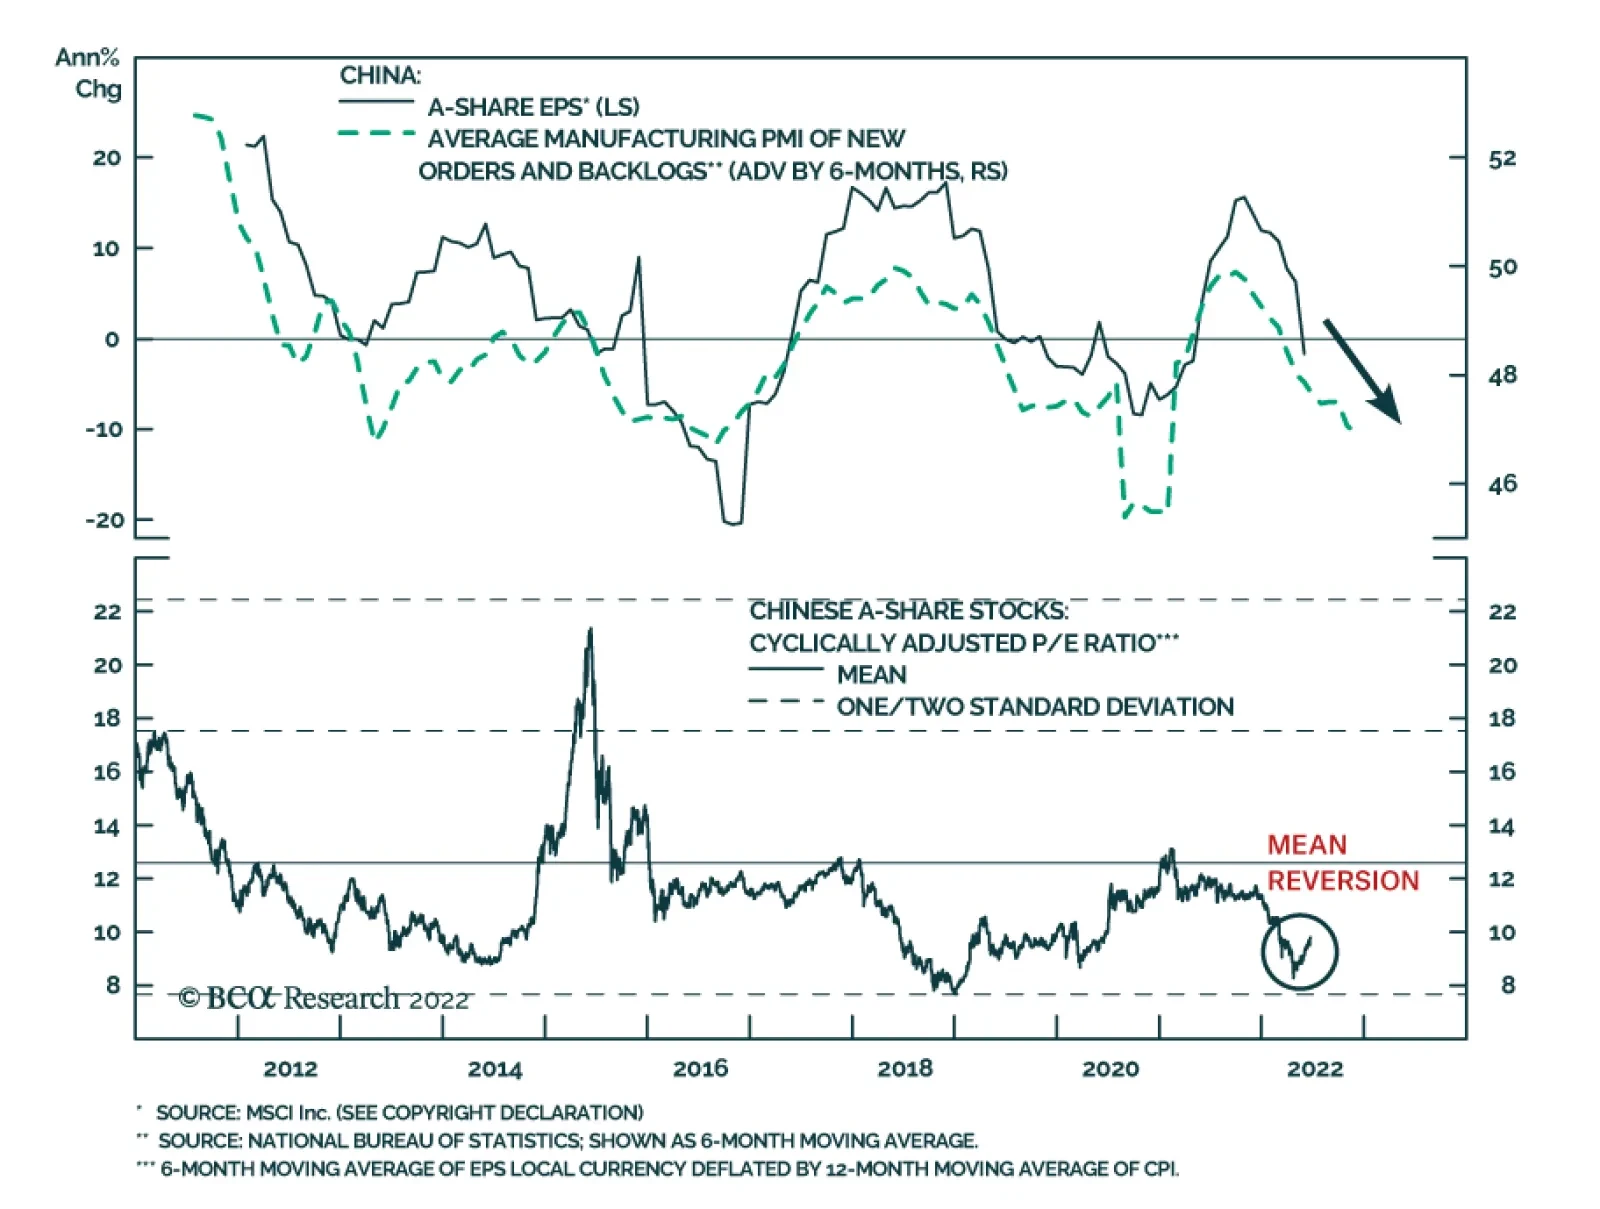
Although Chinese industrial profits continued to decline in May, the magnitude of contraction narrowed slightly to 6.5% y/y from 8.5% in April. This latest release follows a series of better-than-expected economic data Although most measures are still…
Executive Summary Russia Squeezes EU Natural Gas
Russia Squeezes EU Natural Gas
Russia Squeezes EU Natural Gas
Major geopolitical shocks tend to coincide with bear markets, so the market is getting closer to pricing this year’s bad news. But investors are not out of the woods yet. Russia is cutting off Europe’s natural gas supply ahead of this winter in retaliation to Europe’s oil embargo. Europe is sliding toward recession. China is reverting to autocratic rule and suffering a cyclical and structural downshift in growth rates. Only after Xi Jinping consolidates power will the ruling party focus exclusively on economic stabilization. The US can afford to take risks with Russia, opening up the possibility of a direct confrontation between the two giants before the US midterm election. A new strategic equilibrium is not yet at hand. Tactical Recommendation Inception Date Return LONG GLOBAL DEFENSIVES / CYCLICALS EQUITIES 2022-01-20 18.3% Bottom Line: Maintain a defensive posture in the third quarter but look for opportunities to buy oversold assets with long-term macro and policy tailwinds. Feature 2022 is a year of geopolitics and supply shocks. Global investors should remain defensive at least until the Chinese national party congress and US midterm election have passed. More fundamentally, an equilibrium must be established between Russia and NATO and between the US and Iran. Until then supply shocks will destroy demand. Checking Up On Our Three Key Views For 2022 Our three key views for the year are broadly on track: 1. China’s Reversion To Autocracy: For ten years now, the fall in Chinese potential economic growth has coincided with a rise in neo-Maoist autocracy and foreign policy assertiveness, leading to capital flight, international tensions, and depressed animal spirits (Chart 1). Related Report Geopolitical StrategyWill China Let 100 Flowers Bloom? Only Briefly. Rising incomes provided legitimacy for the Communist Party over the past four decades. Less rapidly rising incomes – and extreme disparities in standards of living – undermine the party and force it to find other sources of public support. Fighting pollution and expanding the social safety net are positives for political stability and potentially for economic productivity. But converting the political system from single-party rule to single-person rule is negative for productivity. Mercantilist trade policy and nationalist security policy are also negative. China’s political crackdown, struggle with Covid-19, waning exports, and deflating property market have led to an abrupt slowdown this year. The government is responding by easing monetary, fiscal, and regulatory policy, though so far with limited effect (Chart 2). Economic policy will not be decisive in the third quarter unless a crash forces the administration to stimulate aggressively. Chart 1China's Slowdown Leads To Maoism, Nationalism
China's Slowdown Leads To Maoism, Nationalism
China's Slowdown Leads To Maoism, Nationalism
Chart 2Chinese Policy Easing: Limited Effect So Far
Chinese Policy Easing: Limited Effect So Far
Chinese Policy Easing: Limited Effect So Far
Chart 3Nascent Rally In Chinese Shares Will Be Dashed
Nascent Rally In Chinese Shares Will Be Dashed
Nascent Rally In Chinese Shares Will Be Dashed
Once General Secretary Xi Jinping secures another five-to-ten years in power at the twentieth national party congress this fall, he will be able to “let 100 flowers bloom,” i.e. ease policy further and focus exclusively on securing the economic recovery in 2023. But policy uncertainty will remain high until then. The party may have to crack down anew to ensure Xi’s power consolidation goes according to plan. China is highly vulnerable to social unrest for both structural and cyclical reasons. The US would jump to slap sanctions on China for human rights abuses. Hence the nascent recovery in Chinese domestic and offshore equities can easily be interrupted until the political reshuffle is over (Chart 3). If China’s economy stabilizes and a recession is avoided, investors will pile into the rally, but over the long run they will still be vulnerable to stranded capital due to Chinese autocracy and US-China cold war. If the Politburo and Politburo Standing Committee are stacked with members of Xi’s faction, as one should expect, then the reduction in policy uncertainty will only be temporary. Autocracy will lead to unpredictable and draconian policy measures – and it cannot solve the problem of a shrinking and overly indebted population. If the Communist Party changes course and stacks the Politburo with Xi’s factional rivals, to prevent China from going down the Maoist, Stalinist, and Putinist route, then global financial markets will cheer. But that outcome is unlikely. Hawkish foreign policy means that China will continue to increase its military threats against Taiwan, while not yet invading outright. Beijing has tightened its grip over Tibet, Xinjiang, and Hong Kong since 2008; Taiwan and the South China Sea are the only critical buffer areas that remain to be subjugated. Taiwan’s midterm elections, US midterms, and China’s party congress will keep uncertainty elevated. Taiwan has underperformed global and emerging market equities as the semiconductor boom and shortage has declined (Chart 4). Hong Kong is vulnerable to another outbreak of social unrest and government repression. Quality of life has deteriorated for the native population. Democracy activists are disaffected and prone to radicalization. Singapore will continue to benefit at Hong Kong’s expense (Chart 5). Chart 4Taiwan Equity Relative Performance Peaked
Taiwan Equity Relative Performance Peaked
Taiwan Equity Relative Performance Peaked
Chart 5Hong Kong Faces More Troubles
Hong Kong Faces More Troubles
Hong Kong Faces More Troubles
Chart 6Japan Undercuts China
Japan Undercuts China
Japan Undercuts China
China and Japan are likely to engage in clashes in the East China Sea. Beijing’s military modernization, nuclear weapons expansion, and technological development pose a threat to Japanese security. The gradual encirclement of Taiwan jeopardizes Japan’s vital sea lines of communication. Prime Minister Fumio Kishida is well positioned to lead the Liberal Democratic Party into the upper house election on July 10 – he does not need to trigger a diplomatic showdown but he would not suffer from it. Meanwhile China is hungry for foreign distractions and unhappy that Japan is reviving its military and depreciating its currency (Chart 6). A Sino-Japanese crisis cannot be ruled out, especially if the Biden administration looks as if it will lose its nerve in containing China. Financial markets would react negatively, depending on the magnitude of the crisis. North Korea is going back to testing ballistic missiles and likely nuclear weapons. It is expanding its doctrine for the use of such weapons. It could take advantage of China’s and America’s domestic politics to stage aggressive provocations. South Korea, which has a hawkish new president who lacks parliamentary support, is strengthening its deterrence with the United States. These efforts could provoke a negative response from the North. Financial markets will only temporarily react to North Korean provocations unless they are serious enough to elicit military threats from Japan or the United States. China would be happy to offer negotiations to distract the Biden administration from Xi’s power grab. South Korean equities will benefit on a relative basis as China adds more stimulus. 2. America’s Policy Insularity: President Biden’s net approval rating, at -15%, is now worse than President Trump’s in 2018, when the Republicans suffered a beating in midterm elections (Chart 7). Biden is now fighting inflation to try to salvage the elections for his party. That means US foreign policy will be domestically focused and erratic in the third quarter. Aside from “letting” the Federal Reserve hike rates, Biden’s executive options are limited. Pausing the federal gasoline tax requires congressional approval, and yet if he unilaterally orders tax collectors to stand down, the result will be a $10 billion tax cut – a drop in the bucket. Biden is considering waiving some of former President Trump’s tariffs on China, which he can do on his own. But doing so will hurt his standing in Rust Belt swing states without reducing inflation enough to get a payoff at the voting booth – after all, import prices are growing slower from China than elsewhere (Chart 8). He would also give Xi Jinping a last-minute victory over America that would silence Xi’s critics and cement his dictatorship at the critical hour. Chart 7Democrats Face Shellacking In Midterm Elections
Third Quarter Geopolitical Outlook: Thunder And Lightning
Third Quarter Geopolitical Outlook: Thunder And Lightning
Chart 8Paring Trump Tariffs Won't Reduce Inflation Much
Paring Trump Tariffs Won't Reduce Inflation Much
Paring Trump Tariffs Won't Reduce Inflation Much
Chart 9Only OPEC Can Help Biden - And Help May Come Late
Only OPEC Can Help Biden - And Help May Come Late
Only OPEC Can Help Biden - And Help May Come Late
Biden is offering to lift sanctions on Iran, which would free up 1.3 million barrels of oil per day. But Iran is not being forced to freeze its nuclear program by weak oil prices or Russian and Chinese pressure – quite the opposite. If Biden eases sanctions anyway, prices at the pump may not fall enough to win votes. Hence Biden is traveling to Saudi Arabia to make amends with Crown Prince Mohammed bin Salman. OPEC’s interest lies in producing enough oil to prevent a global recession, not in flooding the market on Biden’s whims to rescue the Democratic Party. Saudi and Emirati production may come but it may not come early in the third quarter. Lifting sanctions on Venezuela is a joke and Libya recently collapsed again (Chart 9). Even in dealing with Russia the Biden administration will exhibit an insular perspective. The US is not immediately threatened, like Europe, so it can afford to take risks, such as selling Ukraine advanced and long-range weapons and providing intelligence used to sink Russian ships. If Russia reacts negatively, a direct US-Russia confrontation will generate a rally around the flag that would help the Democrats, as it did under President John F. Kennedy in 1962 – one of the rare years in which the ruling party minimized its midterm election losses (Chart 10). The Cuban Missile Crisis counted more with voters than the earlier stock market slide. 3. Petro-States’ Geopolitical Leverage: Oil-producing states have immense geopolitical leverage this year thanks to the commodity cycle. Russia will not be forced to conclude its assault on Ukraine until global energy prices collapse, as occurred in 2014. In fact Russia’s leverage over Europe will be greatly reduced in the coming years since Europe is diversifying away from Russian energy exports. Hence Moscow is cutting natural gas flows to Europe today while it still can (Chart 11). Chart 10Biden Can Afford To Take Risks With Russia
Third Quarter Geopolitical Outlook: Thunder And Lightning
Third Quarter Geopolitical Outlook: Thunder And Lightning
Chart 11Russia Squeezes EU's Natural Gas
Russia Squeezes EU's Natural Gas
Russia Squeezes EU's Natural Gas
Chart 12EU/China Slowdown Will Weigh On World
Third Quarter Geopolitical Outlook: Thunder And Lightning
Third Quarter Geopolitical Outlook: Thunder And Lightning
Russia’s objective is to inflict a recession and cause changes in either policy or government in Europe. This will make it easier to conclude a favorable ceasefire in Ukraine. More importantly it will increase the odds that the EU’s 27 members, having suffered the cost of their coal and oil embargo, will fail to agree to a natural gas embargo by 2027 as they intend. Italy, for example, faces an election by June 2023, which could come earlier. The national unity coalition was formed to distribute the EU’s pandemic recovery funds. Now those funds are drying up, the economy is sliding toward recession, and the coalition is cracking. The most popular party is an anti-establishment right-wing party, the Brothers of Italy, which is waiting in the wings and can ally with the populist League, which has some sympathies with Russia. A recession could very easily produce a change in government and a more pragmatic approach to Moscow. The Italian economy is getting squeezed by energy prices and rising interest rates at the same time and cannot withstand the combination very long. A European recession or near-recession will cause further downgrades to global growth, especially when considering the knock-on effects in China, where the slowdown is more pronounced than is likely reported. The US economy is more robust but it will have to be very robust indeed to withstand a recession in Europe and growth recession in China (Chart 12). Russia does not have to retaliate against Finland and Sweden joining NATO until Turkey clears the path for them to join, which may not be until just before the Turkish general election due in June 2023. But imposing a recession on Europe is already retaliation – maybe a government change will produce a new veto against NATO enlargement. Russian retaliation against Lithuania for blocking 50% of its shipments to the Kaliningrad exclave is also forthcoming – unless Lithuania effectively stops enforcing the EU’s sanctions on Russian resources. Russia cannot wage a full-scale attack on the Baltic states without triggering direct hostilities with NATO since they are members of NATO. But it can retaliate in other ways. In a negative scenario Moscow could stage a small “accidental” attack against Lithuania to test NATO. But that would force Biden to uphold his pledge to defend “every inch” of NATO territory. Biden would probably do so by staging a proportionate military response or coordinating with an ally to do it. The target would be the Russian origin of attack or comparable assets in the Baltic Sea, the Black Sea, Ukraine, Belarus, or elsewhere. The result would be a dangerous escalation. Russia could also opt for cyber-attacks or economic warfare – such as squeezing Europe’s natural gas supply further. Ultimately Russia can afford to take greater risks than the US over Kaliningrad, other territories, and its periphery more broadly. That is the difference between Kennedy and Biden – the confrontation is not over Cuba. Russia is also likely to take a page out of Josef Stalin’s playbook and open a new front – not so much in Nicaragua as in the Middle East and North Africa. The US betrayal of the 2015 nuclear deal with Iran opens the opportunity for Russia to strengthen cooperation with Iran, stir up the Iranians’ courage, sell them weapons, and generate a security crisis in the Middle East. The US military would be distracted keeping peace in the Persian Gulf while the Europeans would lose their long-term energy alternative to Russia – and energy prices would rise. The Iranians – who also have leverage during a time of high oil prices – are not inclined to freeze their nuclear program. That would be to trade their long-term regime survival for economic benefits that the next American president can revoke unilaterally. Bottom Line: Xi Jinping is converting China back into an autocracy, the Biden administration lacks options and is willing to have a showdown with Russia, and the Putin administration is trying to inflict a European recession and political upheaval. Stay defensive. Checking Up On Our Strategic Themes For The 2020s As for our long-term themes, the following points are relevant after what we have learned in the second quarter: 1. Great Power Rivalry: The war in Ukraine has reminded investors of the primacy of national security. In an anarchic international system, if a single great nation pursues power to the neglect of its neighbors’ interests, then its neighbors need to pursue power to defend themselves. Before long every nation is out for itself. At least until a new equilibrium is established. For example, Russia’s decision to neutralize Ukraine by force is driving Germany to abandon its formerly liberal policy of energy cooperation in order to reduce Russia’s energy revenues and avoid feeding its military ambitions. Russia in turn is reducing natural gas exports to weaken Europe’s economy this winter. Germany will re-arm, Finland and Sweden will eventually join NATO, and Russia will underscore its red line against NATO bases or forces in Finland and Sweden. If this red line is violated then a larger war could ensue. Chart 13China Will Shift To Russian Energy
China Will Shift To Russian Energy
China Will Shift To Russian Energy
Until Russia and NATO come to a new understanding, neither Europe nor Russia can be secure. Meanwhile China cannot reject Russia’s turn to the east. China believes it may need to use force to prevent Taiwan independence at some point, so it must prepare for the US and its allies to treat it the same way that they have treated Russia. It must secure energy supply from Russia, Central Asia, and the Middle East via land routes that the US navy cannot blockade (Chart 13). Beijing must also diversify away from the US dollar, lest the Treasury Department freeze its foreign exchange reserves like it did Russia’s. Global investors will see diversification as a sign of China’s exit from the international order and preparation for conflict, which is negative for its economic future. However, the Russo-Chinese alliance presents a historic threat to the US’s security, coming close to the geopolitical nightmare of a unified Eurasia. The US is bound to oppose this development, whether coherently or not, and whether alone or in concert with its allies. After all, the US cannot offer credible security guarantees to negotiate a détente with China or Iran because its domestic divisions are so extreme that its foreign policy can change overnight. Other powers cannot be sure that the US will not suffer a radical domestic policy change or revolution that leads to belligerent foreign policy. Insecurity will drive the US and China apart rather than bringing them together. For example, Russia’s difficulties in Ukraine will encourage Chinese strategists to go back to the drawing board to adjust their plans for military contingencies in Taiwan. But the American lesson from Ukraine is to increase deterrence in Taiwan. That will provoke China and encourage the belief that China cannot wait forever to resolve the Taiwan problem. Until there is a strategic understanding between Russia and NATO, and the US and China, the world will remain in a painful and dangerous transitional phase – a multipolar disequilibrium. Chart 14Hypo-Globalization: Globalizing Less Than Potential
Third Quarter Geopolitical Outlook: Thunder And Lightning
Third Quarter Geopolitical Outlook: Thunder And Lightning
2. Hypo-Globalization: If national security rises to the fore, then economics becomes a tool of state power. Mercantilism becomes the basis of globalization rather than free market liberalism. Hypo-globalization is the result. The term is fitting because the trade intensity of global growth is not yet in a total free fall (i.e. de-globalization) but merely dropping off from its peaks during the phase of “hyper-globalization” in the 1990s and early 2000s (Chart 14). Hypo-globalization is probably a structural rather than cyclical phenomenon. The EU cannot re-engage with Russia and ease sanctions without rehabilitating Russia’s economy and hence its military capacity – which could enable Russia to attack Europe again. The US and China can try to re-engage but they will fail. Russo-Chinese alliance ensures that the US would be enriching not one but both of its greatest strategic rivals if it reopened its doors to Chinese technology acquisition and intellectual property theft. Iran will see its security in alliance with Russia and China. China has an incentive to develop Iran’s economy so as not to depend solely on Russia and Central Asia. Russia has an incentive to develop Iran’s military capacity so as to deprive Europe of an energy alternative. Both Russia and China wish to deprive the US of strategic hegemony in the Middle East. By contrast the US and EU cannot offer ironclad security guarantees to Iran because of its nuclear ambitions and America’s occasional belligerence. Thus the world can see expanding Russian and Chinese economic integration with Eurasia, and expanding American and European integration with various regions, but it cannot see further European integration with Russia or American integration with China. And ultimately Europe and China will be forced to sever links (Chart 15). Globalization will not cease – it is a multi-millennial trend – but it will slow down. It will be subordinated to national security and mercantilist economic theory. 3. Populism/Nationalism: In theory, domestic instability can cause introversion or extroversion. But in practice we are seeing extroversion, which is dangerous for global stability (Chart 16). Chart 15Global Economic Disintegration
Global Economic Disintegration
Global Economic Disintegration
Chart 16Internal Sources Of Nationalism
Internal Sources Of Nationalism
Internal Sources Of Nationalism
Russia’s invasion of Ukraine derived from domestic Russian instability – and instability across the former Soviet space, including Belarus, which the Kremlin feared could suffer a color revolution after the rigged election and mass protests of 2020-21. The reason the northern European countries are rapidly revising their national defense and foreign policies to counter Russia is because they perceive that the threat to their security is driven by factors within the former Soviet sphere that they cannot easily remove. These factors will get worse as a result of the Ukraine war. Russian aggression still poses the risk of spilling out of Ukraine’s borders. China’s Maoist nostalgia and return to autocratic government is also about nationalism. The end of the rapid growth phase of industrialization is giving way to the Asian scourge: debt-deflation. The Communist Party is trying to orchestrate a great leap forward into the next phase of development. But in case that leap fails like the last one, Beijing is promoting “the great rejuvenation of the Chinese nation” and blaming the rest of the world for excluding and containing China. Taiwan, unfortunately, is the last relic of China’s past humiliation at the hands of western imperialists. China will also seek to control the strategic approach to Taiwan, i.e. the South China Sea. China’s claim that the Taiwan Strait is sovereign sea, not international waters, will force the American navy to assert freedom of passage. American efforts to upgrade Taiwan relations and increase deterrence will be perceived as neo-imperialism. The United States, for its part, could also see nationalism convert into international aggression. The US is veering on the brink of a miniature civil war as nationalist forces in the interior of the country struggle with the political establishment in the coastal states. Polarization has abated since 2020, as stagflation has discredited the Democrats. But it is now likely to rebound, making congressional gridlock all but inevitable. A Republican-controlled House will find a reason to impeach President Biden in 2023-24, in hopes of undermining his party and reclaiming the presidency. Another hotly contested election is possible, or worse, a full-blown constitutional crisis. American institutions proved impervious to the attempt of former President Trump and his followers to disrupt the certification of the Electoral College vote. However, security forces will be much more aggressive against rebellions of whatever stripe in future, which could lead to episodes in which social unrest is aggravated by police repression. If the GOP retakes the White House – especially if it is a second-term Trump presidency with a vendetta against political enemies and nothing to lose – then the US will return to aggressive foreign policy, whether directed at China or Iran or both. In short, polarization has contaminated foreign policy such that the most powerful country in the world cannot lead with a steady hand. Over the long run polarization will decline in the face of common foreign enemies but for now the trend vitiates global stability. Chart 17Germany And Japan Rearming
Third Quarter Geopolitical Outlook: Thunder And Lightning
Third Quarter Geopolitical Outlook: Thunder And Lightning
It goes without saying that nationalism is also an active force in Iran, where 83-year-old Supreme Leader Ayatollah Khamenei is attempting to ensure the survival of his regime in the face of youthful social unrest and an unclear succession process. If Khamenei takes advantage of the commodity cycle, and American and Israeli disarray, he can make a mad dash for the bomb and try to achieve regime security. But if he does so then nationalism will betray him, since Israel and/or the US are willing to conduct air strikes to uphold the red line against nuclear weaponization. If any more proof of global nationalism is needed, look no further than Germany and Japan, the principal aggressors of World War II. Their pacifist foreign policies have served as the linchpins of the post-war international order. Now they are both pursuing rearmament and a more proactive foreign policy (Chart 17). Nationalism may be very nascent in Germany but it has clearly made a comeback in Japan, which exacerbates China’s fears of containment. The rise of nationalism in India is widely known and reinforces the trend. Bottom Line: Great power rivalry is intensifying because of Russia’s conflict with the West and China’s inability to reject Russia. Hypo-globalization is the result since EU-Russia and US-China economic integration cannot easily be mended in the context of great power struggle. Domestic instability in Russia, China, and the US is leading to nationalism and aggressive foreign policy, as leaders find themselves unwilling or unable to stabilize domestic politics through productive economic pursuits. Investment Takeaways BCA has shifted its House View to a neutral asset allocation stance on equities relative to bonds (Chart 18). Chart 18BCA House View: Neutral Stocks Versus Bonds
BCA House View: Neutral Stocks Versus Bonds
BCA House View: Neutral Stocks Versus Bonds
Geopolitical Strategy remains defensively positioned, favoring defensive markets and sectors, albeit with some exceptions that reflect our long-term views. Tactically stay long US 10-year Treasuries, large caps versus small caps, and defensives versus cyclicals. Stay long Mexico and short the UAE (Chart 19). Strategically stay long gold, US equities relative to global, and aerospace/defense sectors (Chart 20). Among currencies favor the USD, EUR, JPY, and GBP. Chart 19Stay Defensive In Q3 2022
Stay Defensive In Q3 2022
Stay Defensive In Q3 2022
Chart 20Stick To Long-Term Geopolitical Trades
Stick To Long-Term Geopolitical Trades
Stick To Long-Term Geopolitical Trades
Chart 21Favor Semiconductors But Not Taiwan
Favor Semiconductors But Not Taiwan
Favor Semiconductors But Not Taiwan
Chart 22Indian Tech Will Rebound Amid China's Geopolitical Risks
Indian Tech Will Rebound Amid China's Geopolitical Risks
Indian Tech Will Rebound Amid China's Geopolitical Risks
Chart 23Overweight ASEAN
Overweight ASEAN
Overweight ASEAN
Go long US semiconductors and semi equipment versus Taiwan broad market (Chart 21). While we correctly called the peak in Taiwanese stocks relative to global and EM equities, our long Korea / short Taiwan trade was the wrong way to articulate this view and remains deeply in the red. Similarly our attempt to double down on Indian tech versus Chinese tech was ill-timed. China eased tech regulations sooner than we expected. However, the long-term profile of the trade is still attractive and Chinese tech will still suffer from excessive government and foreign interference (Chart 22). Go long Singapore over Hong Kong, as Asian financial leadership continues to rotate (see Chart 5 above). Stay long ASEAN among emerging markets. We will also put Malaysia on upgrade watch, given recent Malaysian equity outperformance on the back of Chinese stimulus and growing western interest in alternatives to China (Chart 23). Matt Gertken Chief Geopolitical Strategist mattg@bcaresearch.com Strategic Themes Open Tactical Positions (0-6 Months) Open Cyclical Recommendations (6-18 Months) Regional Geopolitical Risk Matrix