China
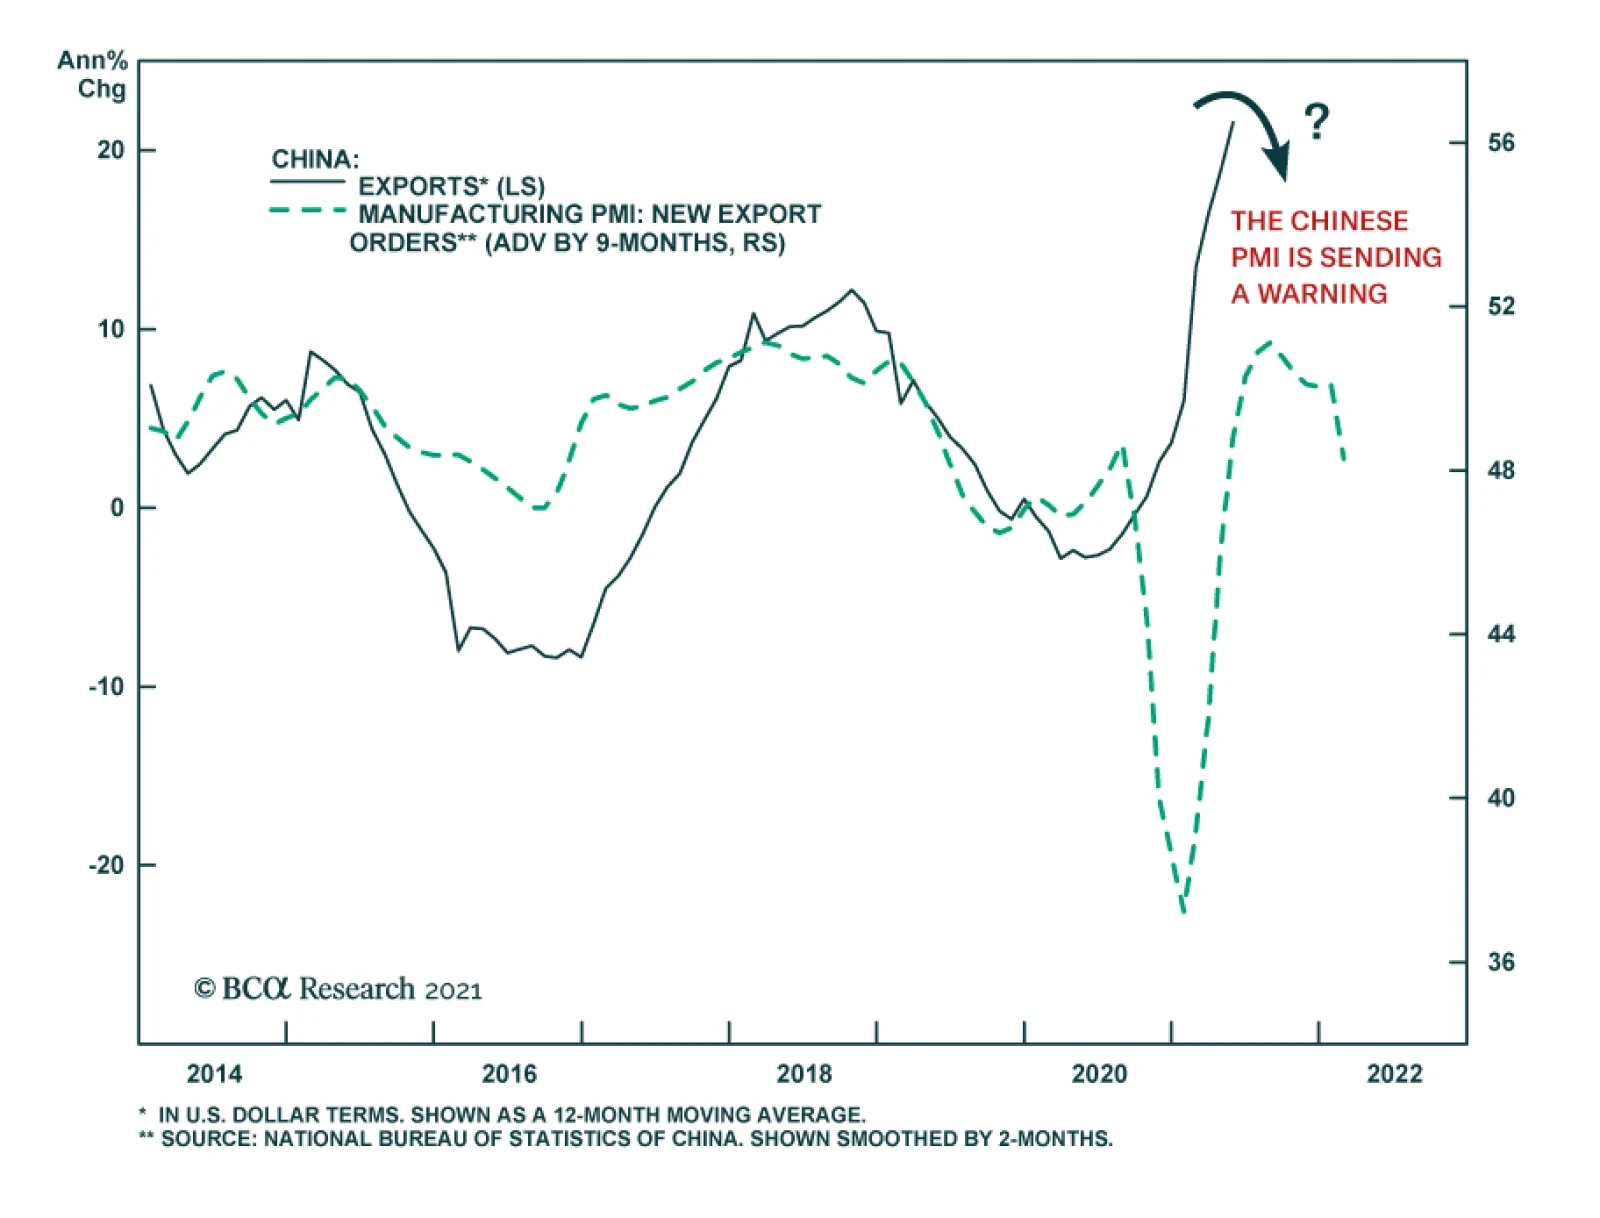
China’s trade surplus widened for the second consecutive month in May, rising to $45.5 billion from $42.9 billion. Exports decelerated to 27.9% y/y from April’s 32.3% y/y, while imports accelerated to 51.1% y/y from 43.1% y/y. The easing in exports…

Highlights Asset Management Regulation (AMR) represents a critical and successful structural reform that is defusing risks in the most hazardous parts of China’s credit system. This bodes well for long-term sustainability of the nation’s financial system and, hence, its long-term economic outlook. That said, the sheer size of risky products and shadow banking makes it impossible to reduce systemic risk without hampering overall credit origination. AMR will dampen bank and shadow banking credit growth further and the credit impulse will be negative by year-end. As a result, China's growth will decelerate. The risk-reward profile of Chinese stocks remains poor. Favor Chinese local currency government bonds as yields will drop further. Feature Chart 1China’s Growth Is Set To Decelerate
China's Growth Is Set To Decelerate
China's Growth Is Set To Decelerate
China’s broad credit and money growth have relapsed substantially. Given that they have historically been reliable leading indicators of business cycles (Chart 1), the question is: how far will credit growth decelerate. When gauging the magnitude of a money/credit slowdown, one should not only look at borrowing costs but also at the willingness and capacity of creditors to extend credit. In this context, it is essential to examine the impact of Asset Management Regulation (AMR) in China on both bank and non-bank credit growth. Please refer to Box 1 below for a more detailed discussion on AMR. BOX 1 What Is AMR? AMR (Asset Management Regulation) was introduced in 2018 to mitigate financial system risks, increase transparency of financial products, and, hence, enhance investor protection. Financial institutions (banks and non-banks) were originally obliged to meet AMR requirements by the end of 2020. However, after the pandemic broke out, this term was extended to the end of 2021. The main objectives of AMR are: To restrict financial institutions from dodging financial regulations and prevent them from engaging in regulatory arbitrage. To prohibit financial institutions from providing other financial organizations with “channels” for evading regulatory requirements. To preclude banks from investing in high-risk assets. To forbid financial institutions from providing explicit or implicit guarantees for the principal and return on asset management products. AMR non-compliant products need to be either terminated or revamped to become AMR compliant before December 31, 2021. Assessing the value of outstanding AMR non-compliant products will help to gauge the actual impact of AMR on credit growth over the course of this year. A portion of banks’ wealth management products (WMP) and single fund trust products are AMR non-compliant and will need to be terminated or revamped. Commercial banks’ WMPs represent fund investment and management plans developed, designed and sold by commercial banks to individuals or institutions. In China, individual investors are the main customers for banks’ WMPs. In 2020, individual investors accounted for more than 99% in number of investors and 87% in investment amounts.1 The outstanding amount of WMPs is presently RMB 25 trillion. Single fund trusts have one investor – usually a bank or another financial institution. Given the disclosure regulation for single fund trusts is much looser than other fund trusts, it was prevalently used by financial institutions, including banks, to channel funds into investments to achieve regulatory arbitrage. Chart 2China Has Not Yet Deleveraged
China Has Not Yet Deleveraged
China Has Not Yet Deleveraged
AMR represents regulatory tightening and will negatively affect bank and non-bank credit growth over the course of this year. In this report we examine what its impact will be on broad credit growth as banks and shadow banking attempt to comply with AMR by end of December this year. Authorities in China have been conducting well-thought-out surgical reforms – AMR being the cornerstone of these – to curb and restructure the risky elements of the credit system. By doing so, they have already dramatically reduced systemic risk in the financial system. Regardless of how deft and precise these reforms have been, they will continue to weigh on bank and shadow banking credit growth. The basis is that the sheer size of risky products and shadow banking makes it impossible to reduce systemic risk without hampering overall credit origination. It should also be noted that China has not yet deleveraged (Chart 2). How Large Are AMR Non-Compliant Assets? We reckon that AMR’s effect on broad credit is mainly through its impact on commercial banks’ Wealth Management Products (WMP) and single fund trusts. S&P Global2 estimates that by the end of 2020, banks will still have RMB 8.5 trillion in off-balance sheet WMP to restructure. Single fund trusts’ assets stood at RMB 7.7 trillion in March 2021. However, to avoid double counting, flows from banks to trust funds (“bank-trust cooperation”) should be deducted from this value. The basis is that channeling funds by banks via trust companies is already captured in banks’ WMP statistics. Overall, non-compliant AMR assets that need to be revamped by year-end are as follows: Banks’ non-compliant WPM 8.5 trillion Single fund trust assets excluding “bank-trust cooperation” 1.2 trillion Total RMB 9.7 trillion This RMB 9.7 trillion represents 3.6% of total social financing (TSF) excluding equity issuance and 4.2% of private credit. The latter is defined as TSF excluding equity and central and local government bond issuance as well as special bonds. Chart 3China: Various Borrowing Costs
China: Various Borrowing Costs
China: Various Borrowing Costs
SP Global2 estimates that around RMB 5 trillion WMP will be revamped and made AMR compliant during this year. To put this figure into perspective, banks revamped RMB 4.8 trillion in 2020 and RMB 5.7 trillion in 2019. This will leave RMB 3.5 trillion of non-compliant WMP that banks are likely to take on their balance sheet before year-end. Even in the case of revamped WMP and single fund trusts, there will be unintended consequences for borrowers. In particular, the cost of borrowing could rise and/or the maturity of loans could be shortened. Both will weigh down on economic activity in general, and investment in the real economy in particular. With full transparency and no implicit guarantee from banks, investors will require higher interest rates to invest in these products (Chart 3). In addition, investors will opt for shorter maturities of these products. Impact On Bank Credit… Chart 4China: Bank Loan Approvals And Bank Credit Impulse
China: Bank Loans Approvals And Bank Credit Impulse
China: Bank Loans Approvals And Bank Credit Impulse
As banks take these AMR non-compliant WMP onto their balance sheets, their assets will automatically expand even though they will not originate new loans/provide financing to the real economy. The estimated RMB 3.5 trillion of WMP is equivalent to 1.5% of commercial bank broad credit and 1.2% of their assets. Hence, AMR will reinforce the deceleration in new credit origination. Both bank assets and broad bank credit will slow and their impulses will contract further (Chart 4). Importantly, bringing these assets onto their balance sheet will require banks to both (1) allocate more capital to support these new assets and (2) increase provisions for the portion of these assets that are non-performing. The non-performing share of these AMR-non-compliant assets could be significant given that funds from off-balance sheet WMP were often invested in high-risk, high-return projects. These often represent claims on risky businesses, including property developers and local government financing vehicles (LGFV). In brief, there were reasons why banks did not initially put these assets on their balance sheets and doing so now will not be inconsequential. Overall, this move will hinder commercial banks’ ability and willingness to originate new credit, i.e., to provide new funding to the real economy (Chart 4). …And Shadow Banking Chart 5 demonstrates that shadow banking credit – comprised of trust loans, entrust loans, and unrealized banker acceptance bills – has been contracting. Outstanding shadow banking credit at RMB 23.9 trillion makes up 9% of TSF excluding equity issuance. Single fund trust loans – please refer to Box 1 above for more information – are the most vulnerable part of shadow banking to AMR. Despite their having contracted since 2017, single fund trust assets excluding “bank-trust cooperation” still amount to RMB 1.2 trillion or 0.5% of TSF, excluding equity issuance (Chart 6). Chart 5China’s Shadow Banking Continues To Shrink
China's Shadow Banking Continues To Shrink
China's Shadow Banking Continues To Shrink
Chart 6Single Fund Trusts Are The Most Vulnerable To AMR Regulation
Single Fund Trusts Are The Most Vulnerable To AMR Regulation
Single Fund Trusts Are The Most Vulnerable To AMR Regulation
This type of financing will continue to shrink, weighing on aggregate credit flow. Although investors in these products might reinvest their funds in AMR-compliant funds, they will demand higher interest rates to offset higher credit risk. The basis is that full transparency will inform them that the trust companies and banks can neither guarantee principal nor interest on their investments. Higher interest rates demanded by investors in trust funds or their reduced financing will affect borrowers that rely on funding from this source. Specifically, trust funds investment in property developers and LGFV has been and will continue to shrink (Chart 7). Impact On Property Developers And LGFV Property developers and LGFV are among the most vulnerable segments to reduced financing because of AMR. Trust companies have meaningful exposure to both real estate developers and LGFV. RMB 2.3 trillion in trust funds are invested in real estate and RMB 1.2 trillion in government projects, mostly representing claims on LGFV. Trust companies’ claims to both segments have been and will continue contracting (Chart 7). Property developers and LGFV are not only vulnerable to curtailed funding due to AMR but also from authorities’ campaign to limit their debt. Three Red Lines policy for property developers imposes caps on their debt. In addition, bank regulators have imposed limits on banks’ claims on property developers as well as residential mortgages (Chart 8, top panel). Loans are capped at 40% for the largest state-owned lenders, while banks’ mortgage lending should be no more than 32.5% of large banks’ outstanding credit. The regulations are even more rigorous for smaller banks. For smaller banks, caps on loans to real estate and mortgage loans are 27.5% and 20%, respectively.3 Banks’ credit to property developers and household mortgages are growing at a historically low pace and will likely decelerate further (Chart 8, bottom panel). To sum up, banks and shadow banking will curtail their exposure to property developers and LGFV. Consequently, these credit-intensive sectors will have to shrink their capital spending and construction activity. The latter will have ramifications for raw materials and industrial sectors exposed to traditional infrastructure and construction. Chart 7Trust Funds’ Exposure To Property Developers And LGFVs
Trust Funds' Exposure To Property Developers And LGFVs
Trust Funds' Exposure To Property Developers And LGFVs
Chart 8Banks’ Exposure To Property Developers And Residential Mortgages
Banks' Exposure To Property Developers And Residential Mortgages
Banks' Exposure To Property Developers And Residential Mortgages
Investment Conclusions On the positive side, AMR represents critical and successful structural reform that is defusing risks in the most hazardous parts of China’s credit system. This bodes well for long-term sustainability of the nation’s financial system and, hence, its long-term economic outlook. Nevertheless, this regulatory tightening along with clampdown on the property market and local government debt will weigh on the Chinese business cycle over the next six-to-nine months: Private credit growth will continue downshifting and its impulse will turn negative, weighing on credit-exposed sectors (Chart 9). Although the private credit impulse is unlikely to reach -10% of GDP like it did in 2018, it will likely turn negative by year-end. Our guess it might be negative 3-4 % of GDP later this year. Chart 9China: Private Credit Impulse Will Turn Negative By Year-End
China: Private Credit Impulse Will Turn Negative By Year-End
China: Private Credit Impulse Will Turn Negative By Year-End
Chart 10China: Fiscal Spending Impulse Will Be Modestly Positive In 2021
China: Fiscal Spending Impulse Will Be Modestly Positive In 2021
China: Fiscal Spending Impulse Will Be Modestly Positive In 2021
Public sector credit – measured as borrowing by central and local government, including special-purpose bonds – will continue decelerating according to bond quotas for this year. Still, higher government revenue will offset the slump in government borrowing so that government spending will grow in 2021 from a year ago. In aggregate, the fiscal spending impulse for all of 2021 will be positive at 1.6% of GDP (Chart 10). Overall, the fiscal spending impulse of 1.6% of GDP in 2021 will not offset the private credit impulse that we reckon to be about negative 3-4% of GDP. The upshot will be a modestly negative aggregate credit and fiscal spending impulse. The latter will be slightly worse than the readings of this indicator during the 2011 and 2014-15 slowdowns but more positive than in 2018 (please refer to Chart 1 above). This heralds a non-trivial business cycle slowdown. The latter will be concentrated in areas that usually benefit from credit and fiscal stimulus. Construction activity and traditional infrastructure spending are the most vulnerable areas. This entails that Chinese demand for raw materials will disappoint and base metals prices are vulnerable. With regard to investment strategy, investors should continue favoring Chinese local currency government bonds over stocks. As the economy decelerates, bond yields will drift lower. Share prices remain vulnerable. Chart 11 illustrates that net EPS revisions for the MSCI China A-share index has rolled over but has not yet dropped to their previous lows. Our hunch that EPS slowdown is not yet fully priced into the Chinese onshore equity market. Concerning MSCI China Investable non-TMT stocks, they have rolled over at their previous high (Chart 12). Given the negative corporate profit outlook, the risk-reward is unattractive both in absolute terms and relative to global equities. Chart 11Chinese Stocks: EPS Growth Expectations Will Downshift Further
Chinese Sotkcs: EPS Growth Expectations Will Downshift Further
Chinese Sotkcs: EPS Growth Expectations Will Downshift Further
Chart 12An Intermediate-Term Top In Chinese Non-TMT Stocks?
An Intermediate-Term Top In Chinese Non-TMT Stocks?
An Intermediate-Term Top In Chinese Non-TMT Stocks?
In the long run, however, the de-risking of the credit system is bullish for Chinese share prices. Declining systemic financial risks entail a lower equity risk premium. Consequently, equity valuations will ultimately be re-rated. Arthur Budaghyan Chief Emerging Markets Strategist arthurb@bcaresearch.com Qingyun Xu Associate Editor Qingyun@bcaresearch.com Footnotes 1 2020 Bank’s Wealth Management Product Report 2 Source: SP Global "China Banks May Still Have RMB3 Trillion In Shadow Assets By Year-End Deadline." 3 https://www.cbirc.gov.cn/cn/view/pages/ItemDetail.html?docId=955074&ite…
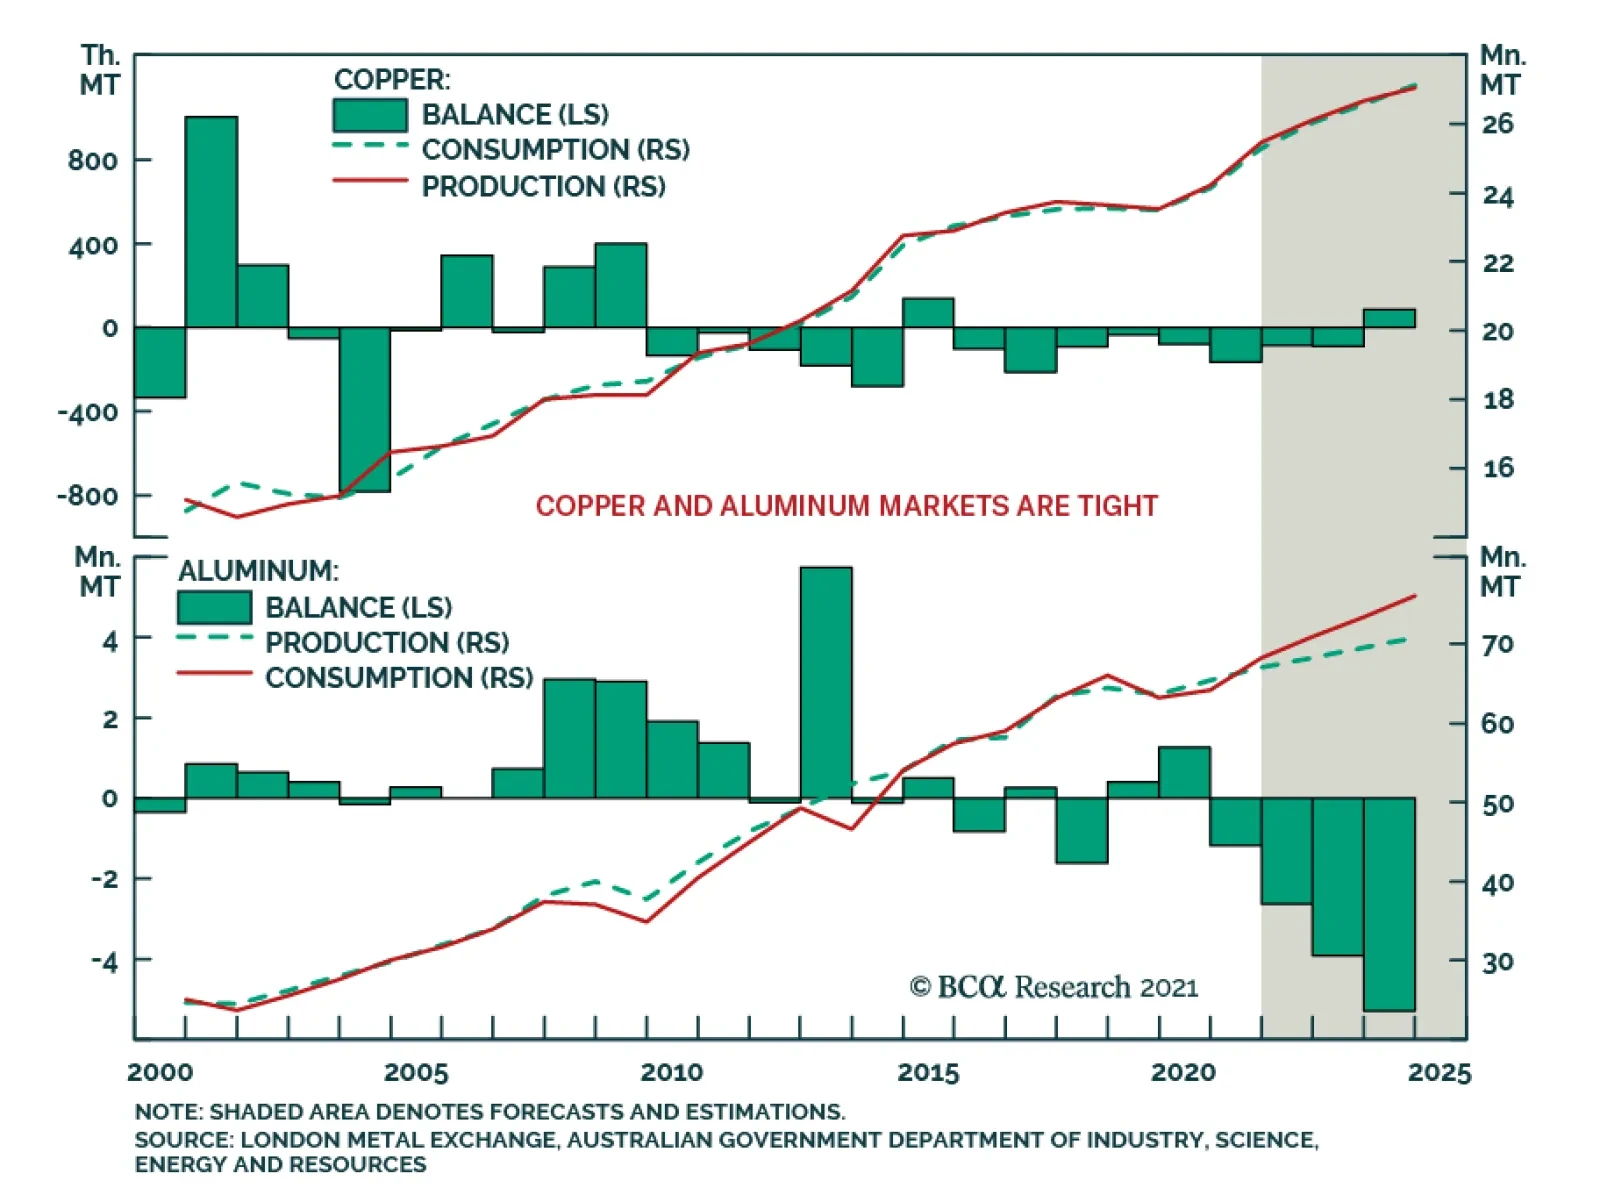
Highlights Political and corporate climate activism will increase the cost of developing the resources required to produce and deliver energy going forward – e.g., oil and gas wells; pipelines; copper mines, and refineries. Over the short run, the fastest way for investor-owned companies (IOCs) to address accelerated reductions in CO2 emissions imposed by courts and boards is to walk away from the assets producing them, which could be disruptive over the medium term. Longer term, state-owned companies (SOCs) not facing the constraints of IOCs likely will be required to provide an increasing share of the resources needed to produce and distribute energy. The real difficulty will come in the medium term. Capex for critical metals like copper languishes, just as the call on these metals steadily increases over the next 30 years (Chart of the Week). The evolution to a low-carbon future has not been thought through at the global policy level. A real strategy must address underinvestment in base metals and incentivize the development of technology via a carbon tax – not emissions trading schemes – so firms can innovate to avoid it. We remain long energy and metals exposures.1 Feature And you may ask yourself, "Well … how did I get here?" David Byrne, Once In A Lifetime Energy markets – broadly defined – are radically transforming from week to week. The latest iteration of these markets' evolution is catalyzed by climate activists, who are finding increasing success in court and on corporate boards – sometimes backed by major institutional investors – and forcing oil and gas producers to accelerate CO2 emission-reduction programs.2 Climate activists' arguments are finding increasing purchase because they have merit: Years of stiff-arming investors seeking clarity on the oil and gas producers' decarbonization agendas, coupled with a pronounced failure to provide returns in excess of their cost of capital, have given activists all of the ammo needed to argue their points. Chart of the WeekCall On Metals For Energy Will Increase
A Perfect Energy Storm On The Way
A Perfect Energy Storm On The Way
This activism is not limited to the courts or boardrooms. Voters in democratic societies with contested elections also are seeking redress for failures of their governments to effectively channel mineral wealth back into society on an equitable basis, and to protect their environments and the habitats of indigenous populations. This voter activism is especially apparent in Chile and Peru, where elections and constitutional conventions likely will result in higher taxes and royalties on metals IOCs operating in these states, which will increase production costs and ultimately be passed on to consumers.3 These states account for ~ 40% of world copper output. IOCs Walk Away Earlier this week, Exxon walked away from an early-stage offshore oil development project in Ghana.4 This followed the unfavorable court rulings and boardroom setbacks experienced by Royal Dutch Shell, Chevron and Exxon recently (referenced in fn. 2). While the company had no comment on its abrupt departure, its action shows how IOCs can exercise their option to put a project back to its host government, thus illustrating one of the most readily available alternatives for energy IOCs to meet court- or board-mandated CO2 emissions targets. If these investments qualify as write-offs, the burden will be borne by taxpayers. As climate activism increases, state-owned companies (SOCs) not facing the constraints of IOCs likely will be required to provide an increasing share of the resources – particularly oil and gas – needed to produce and distribute energy going forward. This is not an unalloyed benefit, as the SOCs still face stranded-asset risks, if they invest in longer-lived assets that are obviated by a successful renewables + grid buildout globally. That is a cost that will have to be compensated, when the SOCs work up their capex allocations. Still, if legal and investor activism significantly accelerates IOCs' capex reductions in oil and gas projects, the SOCs – particularly those in OPEC 2.0 – will be able to expand their position as the dominant supplier in the global oil market, and could perhaps increase their influence on price levels and forward-curve dynamics (Chart 2).5 Chart 2OPEC 2.0s Could Expand If Investor Activism Increases
OPEC 2.0s Could Expand If Investor Activism Increases
OPEC 2.0s Could Expand If Investor Activism Increases
Higher Call On Metals At present, there is a lot of talk about the need to invest in renewable electricity generation and the grid structure supporting it, but very little in the way of planning for this transition. Other than repeated assertions of its necessity, little is being said regarding how exactly this strategy will be executed given the magnitude of the supply increase in metals required. Nowhere is this more apparent than in the refined copper market, which has been in a physical deficit – i.e., production minus consumption is negative – for the last 6 years (Chart 3). Physical copper markets in China, which consumes more than 50% of refined output, remain extremely tight, as can be seen in the ongoing weakness of treating charges and refining charges (TC/RC) for the past year (Chart 4). These charges are inversely correlated to prices – when TC/RCs are low, it means there is surplus refining capacity for copper – unrefined metal is scarce, which drives down demand for these services. Chart 3Coppers Physical Deficit Likely Persist
Coppers Physical Deficit Likely Persist
Coppers Physical Deficit Likely Persist
Chart 4Chinas Refined Copper Supply Remains Tight
Chinas Refined Copper Supply Remains Tight
Chinas Refined Copper Supply Remains Tight
Theoretically, high prices will incentivize higher levels of production. However, after the last decade’s ill-timed investment in new mine discoveries and expansions, mining companies have become more wary with their investments, and are using earnings to pay dividends and reduce debt. This leads us to believe that mining companies will not invest in new mine discoveries but will use capital expenditure to expand brownfield projects to meet rising demand. In the last decade, as copper demand rose, capex for copper rose from 2010-2012, and fell from 2013-2016 (Chart 5). During this time, the copper ore grade was on a declining trend. This implies that the new copper brought online was being mined from lower-grade ore, due to the expansion of existing projects(Chart 6). Chart 5Copper Capex Growth Remains Weak
A Perfect Energy Storm On The Way
A Perfect Energy Storm On The Way
Chart 6Copper Ore-Quality Declines Persist Through Capex Cycle
A Perfect Energy Storm On The Way
A Perfect Energy Storm On The Way
Capex directed at keeping ore production above consumption will not be sufficient to avoid major depletions of ore supplies beginning in 2024, according to Wood Mackenzie. The consultancy foresees a cumulative deficit of ~ 16mm MT by 2040. Plugging this gap will require $325-$500 billion of investment in the copper mining sector.6 The Case For A Carbon Tax The low-carbon future remains something of a will-o'-the-wisp – seen off in the future but not really developed in the present. Most striking in discussions of the low-carbon transition is the assumption of resource availability – particularly bases metals –in, e.g., the IEA's Net Zero by 2050, A Roadmap for the Global Energy Sector, published last month. In the IEA's document, further investment in hydrocarbons is not required beyond 2025. The copper, aluminum, steel, etc., required to build the generation and supporting grid infrastructure will be available and callable as needed to build all the renewable generation the world requires. The document is agnostic between carbon trading and carbon taxes as a way to price carbon and incentivize the technology that would allow firms and households to avoid a direct cost on carbon. A real strategy must address the fact that most of the world will continue to rely on fossil fuels for decades, as development goals are pursued. Underinvestment in base metals and its implications for the buildout of generation and grids has to be a priority if these assets are to be built. Given the 5-10-year lead times base metals mines require to come online, it is obvious that beyond the middle of this decade, the physical reality of demand exceeding supply will assert itself. A good start would be a global effort to impose and collect carbon taxes uniformly across states.7 This would need to be augmented with a carbon club, which restricts admission and trading privileges to those states adopting such a scheme. Harmonizing the multiple emissions trading schemes worldwide will be a decades-long effort that is unlikely to succeed. Such schemes also can be gamed by larger players, producing pricing distortions. A hard and fast tax that is enforced in all of the members of such a carbon club would immediately focus attention on the technology required to avoid paying it – mobilizing capital, innovation and entrepreneurial drive to make it a reality. This would support carbon-capture, use and storage technologies as well, thus extending the life of existing energy resources as the next generation of metals-based resources is built out. In addition, a carbon tax raises revenue for governments, which can be used for a variety of public policies, including reducing other taxes to reduce the overall burden of taxation. Lastly, a tax eliminates the potential for short-term price volatility in the pricing of carbon – as long as households and firms know what confronts them they can plan around it. Tax revenues also can be used to reduce the regressive nature of such levies. Investment Implications The lack of a coherent policy framework that addresses the very real constraints on the transition to a low-carbon economy makes the likelihood of a volatile, years-long evolution foreordained. We believe this will create numerous investment opportunities as underinvestment in hydrocarbons and base metals production predisposes oil, natural gas and base metals prices to move higher in the face of strong and rising demand. We remain long commodity index exposure – the S&P GSCI and GSCI Commodity Dynamic Roll Strategy ETF (COMT), which is optimized to take advantage of the most backwardated commodity forward curves in the index. These positions were up 5.3% and 7.2% since inception on December 7, 2017 and March 12, 2021, respectively, at Tuesday's close. We also remain long the MSCI Global Metals & Mining Producers ETF (PICK), which is up 33.9% since it was put on December 10, 2020. Expecting continued volatility in metals – copper in particular – we will look for opportunities to re-establish positions in COMEX/CME Copper after being stopped out with gains. A trailing stop was elected on our long Dec21 copper position established September 10, 2020, which was closed out with a 48.2% gain on May 21, 2021. Our long calendar 2022 vs short calendar 2023 COMEX copper backwardation trade established April 22, 2021, was closed out on May 20, 2021, leaving us with a return of 305%. Robert P. Ryan Chief Commodity & Energy Strategist rryan@bcaresearch.com Ashwin Shyam Research Associate Commodity & Energy Strategy ashwin.shyam@bcaresearch.com Commodities Round-Up Energy: Bullish OPEC 2.0 offered no surprises to markets this week, as it remained committed to returning just over 2mm b/d of production to the market over the May-July period, 70% of which comes from the Kingdom of Saudi Arabia (KSA), according to Platts. While Iran's return to the market is not a given in OPEC 2.0's geometry, we have given better than even odds it will return to the market beginning in 3Q21 and restore most of the 1.4mm b/d not being produced at present to the market over the course of the following year. OPEC itself expects demand to increase 6mm b/d this year, somewhat above our expectation of 5.3mm b/d. Stronger demand could raise Brent prices above our average $63/bbl forecast for this year (Chart 7). Brent was trading above $71/bbl as we went to press. Base Metals: Bullish BHP declared operations at its Escondida and Spence mines were running at normal rates despite a strike by some 200 operations specialists. BHP is employing so-called substitute workers to conduct operation, according to reuters.com, which also reported separate unions at both mines are considering strike actions in the near future. Precious Metals: Bullish The Fed’s reluctance to increase nominal interest rates despite indications of higher inflation will reduce real rates, which will support higher gold prices (Chart 8). We agree with our colleagues at BCA Research's US Bond Strategy that the Fed is waiting for the US labor market to reach levels consistent with its assessment of maximum employment before it makes its initial rate hike in this interest-rate cycle. Subsequent rate changes, however, will be based on realized inflation and inflation expectations. In our opinion, the Fed is following this ultra-accommodative monetary policy approach to break the US liquidity trap, brought about by a rise in precautionary savings due to the pandemic. In addition, we continue to expect USD weakness, which also will support gold and precious metals prices. We remain long gold, expecting prices to clear $2,000/oz this year. Ags/Softs: Neutral Corn prices fell more than 2% Wednesday, following the release of USDA estimates showing 95% of the corn crop was planted by 31 May 2021, well over the 87% five-year average. This was in line with expectations. However, the Department's assessment that 76% of the crop was in good-to-excellent condition exceeded market expectations. Chart 7
By 2023 Brent Trades to $80/bbl
By 2023 Brent Trades to $80/bbl
Chart 8
Gold Prices Going Up
Gold Prices Going Up
Footnotes 1 Please see Trade Tables below. 2 Please see OPEC, Russia seen gaining more power with Shell Dutch ruling and EXCLUSIVE BlackRock backs 3 dissidents to shake up Exxon board -sources published by reuters.com June 1, 2021 and May 25, 2021. 3 Please see Chile's govt in shock loss as voters pick independents to draft constitution published by reuters.com May 17, 2021, and Peru’s elite in panic at prospect of hard-left victory in presidential election published by ft.com June 1, 2021. Peru has seen significant capital flight on the back of these fears. See also Results from Chile’s May 2021 elections published by IHS Markit May 21, 2021 re a higher likelihood of tax increases for the mining sector. The risk of nationalization is de minimis, according to IHS. 4 Please see Exxon walks away from stake in deepwater Ghana block published by worldoil.com June 1, 2021. 5 Please see OPEC 2.0's Production Strategy In Focus, which we published on May 20, 2021, for a recap our how we model OPEC 2.0's strategy. It is available at ces.bcaresearch.com. 6 Please see Will a lack of supply growth come back to bite the copper industry?, published by Wood Mackenzie on March 23, 2021. 7 Please see The Challenges and Prospects for Carbon Pricing in Europe published by the Oxford Institute for Energy Studies last month for a discussion of carbon taxes vs. emissions trading schemes. Investment Views and Themes Strategic Recommendations Tactical Trades Commodity Prices and Plays Reference Table Trades Closed in 2021 Summary of Closed Trades
Higher Inflation On The Way
Higher Inflation On The Way
Highlights Asset Management Regulation (AMR) represents a critical and successful structural reform that is defusing risks in the most hazardous parts of China’s credit system. This bodes well for long-term sustainability of the nation’s financial system and, hence, its long-term economic outlook. That said, the sheer size of risky products and shadow banking makes it impossible to reduce systemic risk without hampering overall credit origination. AMR will dampen bank and shadow banking credit growth further and the credit impulse will be negative by year-end. As a result, China's growth will decelerate. The risk-reward profile of Chinese stocks remains poor. Favor Chinese local currency government bonds as yields will drop further. Feature Chart 1China’s Growth Is Set To Decelerate
China's Growth Is Set To Decelerate
China's Growth Is Set To Decelerate
China’s broad credit and money growth have relapsed substantially. Given that they have historically been reliable leading indicators of business cycles (Chart 1), the question is: how far will credit growth decelerate. When gauging the magnitude of a money/credit slowdown, one should not only look at borrowing costs but also at the willingness and capacity of creditors to extend credit. In this context, it is essential to examine the impact of Asset Management Regulation (AMR) in China on both bank and non-bank credit growth. Please refer to Box 1 below for a more detailed discussion on AMR. BOX 1 What Is AMR? AMR (Asset Management Regulation) was introduced in 2018 to mitigate financial system risks, increase transparency of financial products, and, hence, enhance investor protection. Financial institutions (banks and non-banks) were originally obliged to meet AMR requirements by the end of 2020. However, after the pandemic broke out, this term was extended to the end of 2021. The main objectives of AMR are: To restrict financial institutions from dodging financial regulations and prevent them from engaging in regulatory arbitrage. To prohibit financial institutions from providing other financial organizations with “channels” for evading regulatory requirements. To preclude banks from investing in high-risk assets. To forbid financial institutions from providing explicit or implicit guarantees for the principal and return on asset management products. AMR non-compliant products need to be either terminated or revamped to become AMR compliant before December 31, 2021. Assessing the value of outstanding AMR non-compliant products will help to gauge the actual impact of AMR on credit growth over the course of this year. A portion of banks’ wealth management products (WMP) and single fund trust products are AMR non-compliant and will need to be terminated or revamped. Commercial banks’ WMPs represent fund investment and management plans developed, designed and sold by commercial banks to individuals or institutions. In China, individual investors are the main customers for banks’ WMPs. In 2020, individual investors accounted for more than 99% in number of investors and 87% in investment amounts.1 The outstanding amount of WMPs is presently RMB 25 trillion. Single fund trusts have one investor – usually a bank or another financial institution. Given the disclosure regulation for single fund trusts is much looser than other fund trusts, it was prevalently used by financial institutions, including banks, to channel funds into investments to achieve regulatory arbitrage. Chart 2China Has Not Yet Deleveraged
China Has Not Yet Deleveraged
China Has Not Yet Deleveraged
AMR represents regulatory tightening and will negatively affect bank and non-bank credit growth over the course of this year. In this report we examine what its impact will be on broad credit growth as banks and shadow banking attempt to comply with AMR by end of December this year. Authorities in China have been conducting well-thought-out surgical reforms – AMR being the cornerstone of these – to curb and restructure the risky elements of the credit system. By doing so, they have already dramatically reduced systemic risk in the financial system. Regardless of how deft and precise these reforms have been, they will continue to weigh on bank and shadow banking credit growth. The basis is that the sheer size of risky products and shadow banking makes it impossible to reduce systemic risk without hampering overall credit origination. It should also be noted that China has not yet deleveraged (Chart 2). How Large Are AMR Non-Compliant Assets? We reckon that AMR’s effect on broad credit is mainly through its impact on commercial banks’ Wealth Management Products (WMP) and single fund trusts. S&P Global2 estimates that by the end of 2020, banks will still have RMB 8.5 trillion in off-balance sheet WMP to restructure. Single fund trusts’ assets stood at RMB 7.7 trillion in March 2021. However, to avoid double counting, flows from banks to trust funds (“bank-trust cooperation”) should be deducted from this value. The basis is that channeling funds by banks via trust companies is already captured in banks’ WMP statistics. Overall, non-compliant AMR assets that need to be revamped by year-end are as follows: Banks’ non-compliant WPM 8.5 trillion Single fund trust assets excluding “bank-trust cooperation” 1.2 trillion Total RMB 9.7 trillion This RMB 9.7 trillion represents 3.6% of total social financing (TSF) excluding equity issuance and 4.2% of private credit. The latter is defined as TSF excluding equity and central and local government bond issuance as well as special bonds. Chart 3China: Various Borrowing Costs
China: Various Borrowing Costs
China: Various Borrowing Costs
SP Global2 estimates that around RMB 5 trillion WMP will be revamped and made AMR compliant during this year. To put this figure into perspective, banks revamped RMB 4.8 trillion in 2020 and RMB 5.7 trillion in 2019. This will leave RMB 3.5 trillion of non-compliant WMP that banks are likely to take on their balance sheet before year-end. Even in the case of revamped WMP and single fund trusts, there will be unintended consequences for borrowers. In particular, the cost of borrowing could rise and/or the maturity of loans could be shortened. Both will weigh down on economic activity in general, and investment in the real economy in particular. With full transparency and no implicit guarantee from banks, investors will require higher interest rates to invest in these products (Chart 3). In addition, investors will opt for shorter maturities of these products. Impact On Bank Credit… Chart 4China: Bank Loan Approvals And Bank Credit Impulse
China: Bank Loans Approvals And Bank Credit Impulse
China: Bank Loans Approvals And Bank Credit Impulse
As banks take these AMR non-compliant WMP onto their balance sheets, their assets will automatically expand even though they will not originate new loans/provide financing to the real economy. The estimated RMB 3.5 trillion of WMP is equivalent to 1.5% of commercial bank broad credit and 1.2% of their assets. Hence, AMR will reinforce the deceleration in new credit origination. Both bank assets and broad bank credit will slow and their impulses will contract further (Chart 4). Importantly, bringing these assets onto their balance sheet will require banks to both (1) allocate more capital to support these new assets and (2) increase provisions for the portion of these assets that are non-performing. The non-performing share of these AMR-non-compliant assets could be significant given that funds from off-balance sheet WMP were often invested in high-risk, high-return projects. These often represent claims on risky businesses, including property developers and local government financing vehicles (LGFV). In brief, there were reasons why banks did not initially put these assets on their balance sheets and doing so now will not be inconsequential. Overall, this move will hinder commercial banks’ ability and willingness to originate new credit, i.e., to provide new funding to the real economy (Chart 4). …And Shadow Banking Chart 5 demonstrates that shadow banking credit – comprised of trust loans, entrust loans, and unrealized banker acceptance bills – has been contracting. Outstanding shadow banking credit at RMB 23.9 trillion makes up 9% of TSF excluding equity issuance. Single fund trust loans – please refer to Box 1 above for more information – are the most vulnerable part of shadow banking to AMR. Despite their having contracted since 2017, single fund trust assets excluding “bank-trust cooperation” still amount to RMB 1.2 trillion or 0.5% of TSF, excluding equity issuance (Chart 6). Chart 5China’s Shadow Banking Continues To Shrink
China's Shadow Banking Continues To Shrink
China's Shadow Banking Continues To Shrink
Chart 6Single Fund Trusts Are The Most Vulnerable To AMR Regulation
Single Fund Trusts Are The Most Vulnerable To AMR Regulation
Single Fund Trusts Are The Most Vulnerable To AMR Regulation
This type of financing will continue to shrink, weighing on aggregate credit flow. Although investors in these products might reinvest their funds in AMR-compliant funds, they will demand higher interest rates to offset higher credit risk. The basis is that full transparency will inform them that the trust companies and banks can neither guarantee principal nor interest on their investments. Higher interest rates demanded by investors in trust funds or their reduced financing will affect borrowers that rely on funding from this source. Specifically, trust funds investment in property developers and LGFV has been and will continue to shrink (Chart 7). Impact On Property Developers And LGFV Property developers and LGFV are among the most vulnerable segments to reduced financing because of AMR. Trust companies have meaningful exposure to both real estate developers and LGFV. RMB 2.3 trillion in trust funds are invested in real estate and RMB 1.2 trillion in government projects, mostly representing claims on LGFV. Trust companies’ claims to both segments have been and will continue contracting (Chart 7). Property developers and LGFV are not only vulnerable to curtailed funding due to AMR but also from authorities’ campaign to limit their debt. Three Red Lines policy for property developers imposes caps on their debt. In addition, bank regulators have imposed limits on banks’ claims on property developers as well as residential mortgages (Chart 8, top panel). Loans are capped at 40% for the largest state-owned lenders, while banks’ mortgage lending should be no more than 32.5% of large banks’ outstanding credit. The regulations are even more rigorous for smaller banks. For smaller banks, caps on loans to real estate and mortgage loans are 27.5% and 20%, respectively.3 Banks’ credit to property developers and household mortgages are growing at a historically low pace and will likely decelerate further (Chart 8, bottom panel). To sum up, banks and shadow banking will curtail their exposure to property developers and LGFV. Consequently, these credit-intensive sectors will have to shrink their capital spending and construction activity. The latter will have ramifications for raw materials and industrial sectors exposed to traditional infrastructure and construction. Chart 7Trust Funds’ Exposure To Property Developers And LGFVs
Trust Funds' Exposure To Property Developers And LGFVs
Trust Funds' Exposure To Property Developers And LGFVs
Chart 8Banks’ Exposure To Property Developers And Residential Mortgages
Banks' Exposure To Property Developers And Residential Mortgages
Banks' Exposure To Property Developers And Residential Mortgages
Investment Conclusions On the positive side, AMR represents critical and successful structural reform that is defusing risks in the most hazardous parts of China’s credit system. This bodes well for long-term sustainability of the nation’s financial system and, hence, its long-term economic outlook. Nevertheless, this regulatory tightening along with clampdown on the property market and local government debt will weigh on the Chinese business cycle over the next six-to-nine months: Private credit growth will continue downshifting and its impulse will turn negative, weighing on credit-exposed sectors (Chart 9). Although the private credit impulse is unlikely to reach -10% of GDP like it did in 2018, it will likely turn negative by year-end. Our guess it might be negative 3-4 % of GDP later this year. Chart 9China: Private Credit Impulse Will Turn Negative By Year-End
China: Private Credit Impulse Will Turn Negative By Year-End
China: Private Credit Impulse Will Turn Negative By Year-End
Chart 10China: Fiscal Spending Impulse Will Be Modestly Positive In 2021
China: Fiscal Spending Impulse Will Be Modestly Positive In 2021
China: Fiscal Spending Impulse Will Be Modestly Positive In 2021
Public sector credit – measured as borrowing by central and local government, including special-purpose bonds – will continue decelerating according to bond quotas for this year. Still, higher government revenue will offset the slump in government borrowing so that government spending will grow in 2021 from a year ago. In aggregate, the fiscal spending impulse for all of 2021 will be positive at 1.6% of GDP (Chart 10). Overall, the fiscal spending impulse of 1.6% of GDP in 2021 will not offset the private credit impulse that we reckon to be about negative 3-4% of GDP. The upshot will be a modestly negative aggregate credit and fiscal spending impulse. The latter will be slightly worse than the readings of this indicator during the 2011 and 2014-15 slowdowns but more positive than in 2018 (please refer to Chart 1 above). This heralds a non-trivial business cycle slowdown. The latter will be concentrated in areas that usually benefit from credit and fiscal stimulus. Construction activity and traditional infrastructure spending are the most vulnerable areas. This entails that Chinese demand for raw materials will disappoint and base metals prices are vulnerable. With regard to investment strategy, investors should continue favoring Chinese local currency government bonds over stocks. As the economy decelerates, bond yields will drift lower. Share prices remain vulnerable. Chart 11 illustrates that net EPS revisions for the MSCI China A-share index has rolled over but has not yet dropped to their previous lows. Our hunch that EPS slowdown is not yet fully priced into the Chinese onshore equity market. Concerning MSCI China Investable non-TMT stocks, they have rolled over at their previous high (Chart 12). Given the negative corporate profit outlook, the risk-reward is unattractive both in absolute terms and relative to global equities. Chart 11Chinese Stocks: EPS Growth Expectations Will Downshift Further
Chinese Sotkcs: EPS Growth Expectations Will Downshift Further
Chinese Sotkcs: EPS Growth Expectations Will Downshift Further
Chart 12An Intermediate-Term Top In Chinese Non-TMT Stocks?
An Intermediate-Term Top In Chinese Non-TMT Stocks?
An Intermediate-Term Top In Chinese Non-TMT Stocks?
In the long run, however, the de-risking of the credit system is bullish for Chinese share prices. Declining systemic financial risks entail a lower equity risk premium. Consequently, equity valuations will ultimately be re-rated. Arthur Budaghyan Chief Emerging Markets Strategist arthurb@bcaresearch.com Qingyun Xu Associate Editor Qingyun@bcaresearch.com Footnotes 1 2020 Bank’s Wealth Management Product Report 2 Source: SP Global "China Banks May Still Have RMB3 Trillion In Shadow Assets By Year-End Deadline." 3 https://www.cbirc.gov.cn/cn/view/pages/ItemDetail.html?docId=955074&ite… Cyclical Investment Stance Equity Sector Recommendations
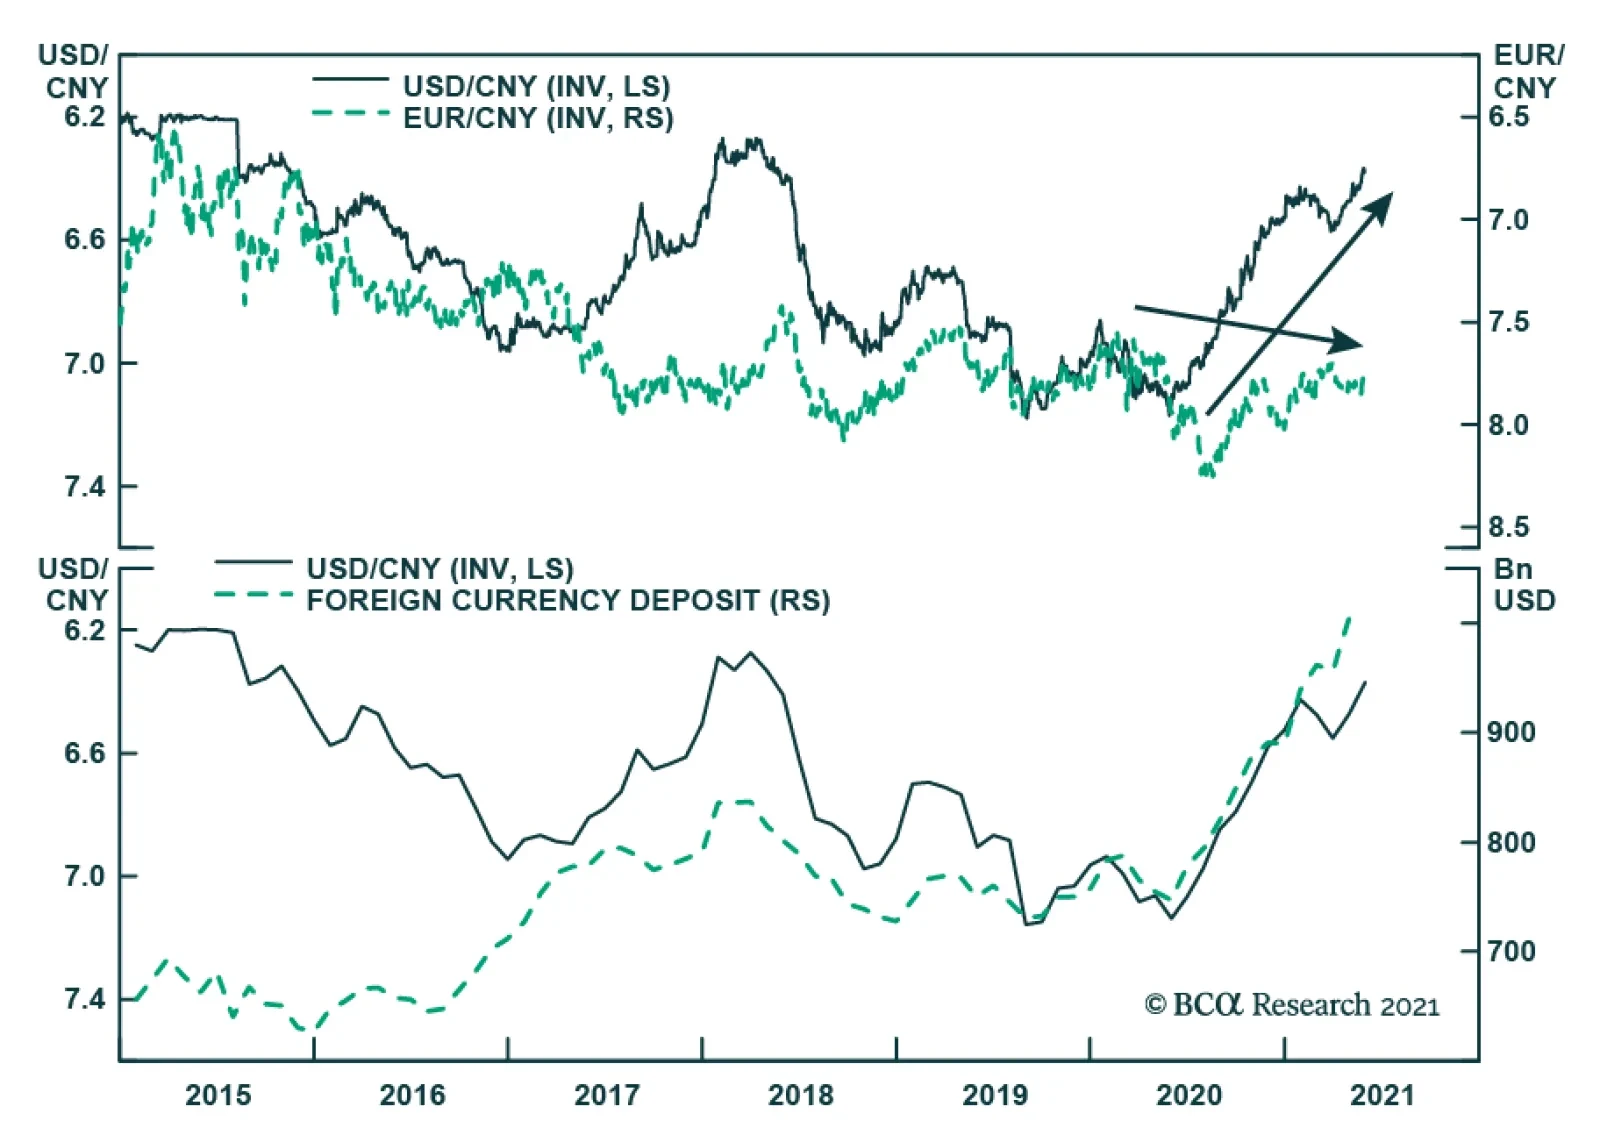
The PBoC announced on Monday that it will raise the reserve requirement ratio rate for FX deposits at financial institutions –the first FX deposit RRR rate hike in 14 years – effective on June 15. The RMB fell by a meager half percentage point against the USD…
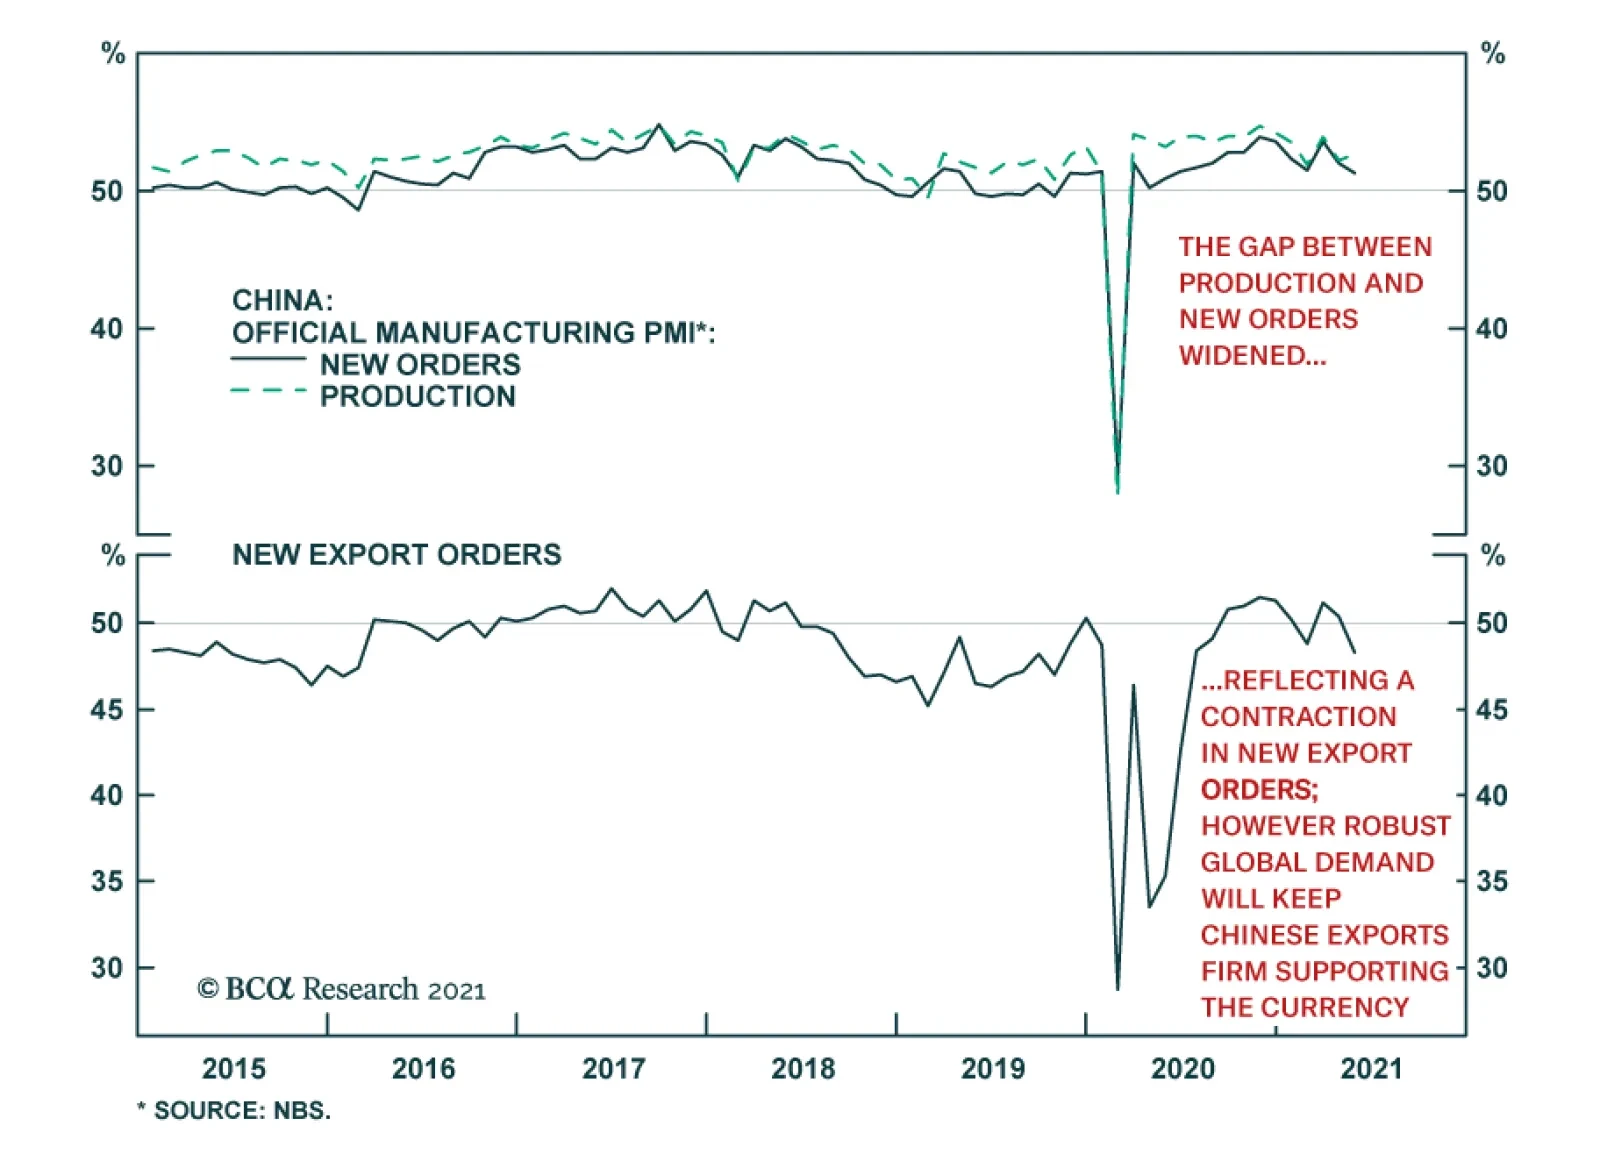
Total Social Financing, a broad measure of Chinese credit growth, has slowed from its peak last October. The current pace of credit growth is broadly in line with nominal GDP growth. The authorities have made it clear that they want to stabilize the ratio of…
On Monday, the PBoC raised the reserve requirement ratio for Chinese banks’ foreign exchange deposits to 7% from 5% beginning June 15. The change aims to reduce foreign currency liquidity and in the process curb the CNY’s appreciation. The RRR hike follows a…
Highlights President Biden has called for the US intelligence community to investigate the origins of COVID-19 and one of Biden’s top diplomats has stated the obvious: the era of “engagement” with China is over. This clinches our long-held view that any Democratic president would be a hawk like President Trump. The US-China conflict – and global geopolitical risk – will revive and undermine global risk appetite. China faces a confluence of geopolitical and macroeconomic challenges, suggesting that its equity underperformance will continue. Domestic Chinese investors should stay long government bonds. Foreign investors should sell into the bond rally to reduce exposure to any future sanctions. The impending agreement of a global minimum corporate tax rate has limited concrete implications that are not already known but it symbolizes the return of Big Government in the western world. Our updated GeoRisk Indicators are available in the Appendix, as well as our monthly geopolitical calendar. Feature In our quarterly webcast, “Geopolitics And Bull Markets,” we argued that geopolitical themes matter to investors when they have a demonstrable relationship with the macroeconomic backdrop. When geopolitics and macro are synchronized, a simple yet powerful investment thesis can be discerned. The US war on terror, Russia’s resurgence, the EU debt crisis, and Brexit each provided cases in which a geopolitically informed macro view was both accessible and actionable at an early stage. Investors generally did well if they sold the relevant country’s currency and disfavored its equities on a relative basis. Chart 1China's Decade Of Troubles
China's Decade Of Troubles
China's Decade Of Troubles
Of course, the market takeaway is not always so clear. When geopolitics and macroeconomics are desynchronized, the trick is to determine which framework will prevail over the financial markets and for how long. Sometimes the market moves to its own rhythm. The goal is not to trade on geopolitics but rather to invest with geopolitics. One of our key views for this year – headwinds for China – is an example of synchronization. Two weeks ago we discussed China’s macroeconomic challenge. In this report we discuss China’s foreign policy challenge: geopolitical pressure from the US and its allies. In particular we address President Biden’s call for a deeper intelligence dive into the origins of COVID-19. The takeaway is negative for China’s currency and risk assets. The Great Recession dealt a painful blow to the Chinese version of the East Asian economic miracle. By 2015, China’s financial turmoil and currency devaluation should have convinced even bullish investors to keep their distance from Chinese stocks and the renminbi. If investors stuck with this bearish view despite the post-2016 rally, on fear of trade war, they were rewarded in 2018-19. Only with China’s containment of COVID-19 and large economic stimulus in 2020 has CNY-USD threatened to break out (Chart 1). We expect the renminbi to weaken anew, especially once the Fed begins to taper asset purchases. Our cyclical view is still bullish but US-China relations are unstable so we remain tactically defensive. Forget Biden’s China Review, He’s A Hawk Chinese financial markets face a host of challenges this year, despite the positive factors for China’s manufacturing sector amid the global recovery. At home these challenges consist of a structural economic slowdown, a withdrawal of policy stimulus, bearish sentiment among households, and an ongoing government crackdown on systemic risk. Abroad the Democratic Party’s return to power in Washington means that the US will bring more allies to bear in its attempt to curb China’s rise. This combination of factors presents a headwind for Chinese equities and a tailwind for government bonds (Chart 2). This is true at least until the government should hit its pain threshold and re-stimulate. Chart 2Global Investors Still Wary
Global Investors Still Wary
Global Investors Still Wary
New stimulus may not occur in 2022. The Communist Party’s leadership rotation merely requires economic stability, not rapid growth. While the central government has a record of stimulating when its pain threshold is hit, even under the economically hawkish President Xi Jinping, a financial market riot is usually part of this threshold. This implies near-term downside, particularly for global commodities and metals, which are also facing a Chinese regulatory backlash to deter speculation. In this context, President Biden’s call for a deeper US intelligence investigation into the origin of COVID-19 is an important confirming signal of the US’s hawkish turn toward China. Biden gave 90 days for the intelligence community to report back to him. We will not enter into the debate about COVID-19’s origins. From a geopolitical point of view it is a moot point. The facts of the virus origin may never be established. According to Biden’s statement, at least one US intelligence agency believes the “lab leak theory” is the most likely source of the virus (while two other agencies decided in favor of animal-to-human transmission). Meanwhile Chinese government spokespeople continue to push the theory that the virus originated at the US’s Fort Detrick in Maryland or at a US-affiliated global research center. What is certain is that the first major outbreak of a highly contagious disease occurred in Wuhan. Both sides are demanding greater transparency and will reject each other’s claims based on a lack of transparency. If the US intelligence report concludes that COVID originated from the Wuhan Institute of Virology, the Chinese government and media will reject the report. If the report exonerates the Wuhan laboratory, at least half of the US public will disbelieve it and it will not deter Biden from drawing a hard line on more macro-relevant policy disputes with China. The US’s hawkish bipartisan consensus on China took shape before COVID. Biden’s decision to order the fresh report introduces skepticism regarding the World Health Organization’s narrative, which was until now the mainstream media’s narrative. Previously this skepticism was ghettoized in US public discourse: indeed, until Biden’s announcement on May 26, the social media company Facebook suppressed claims that the virus came from a lab accident or human failure. Thus Biden’s action will ensure that a large swathe of the American public will always tend to support this theory regardless of the next report’s findings. At the same time Biden discontinued a State Department effort to prove the lab leak theory, which shows that it is not a foregone conclusion what his administration will decide. The good news is that even if the report concluded in favor of the lab leak, the Biden administration would remain highly unlikely to demand that China pay “reparations,” like the Trump administration demanded in 2020. This demand, if actualized, would be explosive. The bad news is that a future nationalist administration could conceivably use the investigation as a basis to demand reparations. Nationalism is a force to be reckoned with in both countries and the dispute over COVID’s origin will exacerbate it. Traditionally the presidents of both countries would tamp down nationalism or attempt to keep it harnessed. But in the post-Xi, post-Trump era it is harder to control. The death toll of COVID-19 will be a permanent source of popular grievance around the world and a wedge between the US and China (Chart 3). China’s international image suffered dramatically in 2020. So far in 2021 China has not regained any diplomatic ground. Chart 3Death Toll Of COVID-19
Biden Confirmed As A China Hawk (GeoRisk Update)
Biden Confirmed As A China Hawk (GeoRisk Update)
The US is repairing its image via a return to multilateralism while the Europeans have put their Comprehensive Agreement on Investment with China on hold due to a spat over sanctions arising from western accusations of genocide (a subject on which China pointedly answered that it did not need to be lectured by Europeans). Notably Biden’s Department of State also endorsed its predecessor’s accusation of genocide in Xinjiang. Any authoritative US intelligence review that solidifies doubts about the WHO’s initial investigation – even if it should not affirm the lab leak theory – would give Biden more ammunition in global opinion to form a democratic alliance to pressure China (for example, in Europe). An important factor that enables the US to remain hawkish on China is fiscal stimulus. While stimulus helps bring about economic recovery, it also lowers the bar to political confrontation (Chart 4). Countries with supercharged domestic demand do not have as much to fear from punitive trade measures. The Biden administration has not taken new punitive measures against China but it is clearly not worried about Chinese retaliation. Chart 4Large Fiscal Stimulus Lowers The Bar To Geopolitical Conflict
Biden Confirmed As A China Hawk (GeoRisk Update)
Biden Confirmed As A China Hawk (GeoRisk Update)
China’s stimulus is underrated in this chart (which excludes non-fiscal measures) but it is still true that China’s policy has been somewhat restrained and it will need to stimulate its economy again in response to any new punitive measures or any global loss of confidence. At least China is limited in its ability to tighten policy due to the threat of US pressure and western trade protectionism. Simultaneous with Biden’s announcement on COVID-19, his administration’s coordinator for Indo-Pacific affairs, Kurt Campbell, proclaimed in a speech that the era of “engagement” with China is officially over and the new paradigm is one of “competition.” By now Campbell is stating the obvious. But this tone is a change both from his tone while serving in President Obama’s Department of State and from his article in Foreign Affairs last year (when he was basically auditioning for his current role in the Biden administration).1 Campbell even said in his latest remarks that the Trump administration was right about the “direction” of China policy (though not the “execution”), which is candid. Campbell was speaking at Stanford University but his comments were obviously aimed for broader consumption. Investors no longer need to wait for the outcome of the Biden administration’s comprehensive review of policy toward China. The answer is known: the Biden administration’s hawkishness is confirmed. The Department of Defense report on China policy, due in June, is very unlikely to strike a more dovish posture than the president’s health policy. Now investors must worry about how rapidly tensions will escalate and put a drag on global sentiment. Bottom Line: US-China relations are unstable and pose an immediate threat to global risk appetite. The fundamental geopolitical assessment of US-China relations has been confirmed yet again. The US is seeking to constrain China’s rise because China is the only country capable of rivaling the US for supremacy in Asia and the world. Meanwhile China is rejecting liberalization in favor of economic self-sufficiency and maintaining an offensive foreign policy as it is wary of US containment and interference. Presidents Biden and Xi Jinping are still capable of stabilizing relations in the medium term but they are unlikely to substantially de-escalate tensions. And at the moment tensions are escalating. China’s Reaction: The Example Of Australia How will China respond to Biden’s new inquiry into COVID’s origins? Obviously Beijing will react negatively but we would not expect anything concrete to occur until the result of the inquiry is released in 90 days. China will be more constrained in its response to the US than it has been with Australia, which called for an international inquiry early last year, as the US is a superior power. Australia was the first to ban Chinese telecom company Huawei from its 5G network (back in 2018) and it was the first to call for a COVID probe. Relations between China and Australia have deteriorated steadily since then, but macro trends have clearly driven the Aussie dollar. The AUD-JPY exchange rate is a good measure for global risk appetite and it is wavering in recent weeks (Chart 5). Chart 5Australian Dollar Follows Macro Trends, Rallies Amid China Trade Spat
Australian Dollar Follows Macro Trends, Rallies Amid China Trade Spat
Australian Dollar Follows Macro Trends, Rallies Amid China Trade Spat
Tensions have also escalated due to China’s dependency on Australian commodity exports at a time of spiking commodity prices. This is a recurring theme going back to the Stern Hu affair. The COVID spat led China to impose a series of sanctions against Australian beef, barley, wine, and coal. But because China cannot replace Australian resources (at least, not in the short term), its punitive measures are limited. It faces rising producer prices as a result of its trade restrictions (Chart 6). This dependency is a bigger problem for China today than it was in previous cycles so China will try to diversify. Chart 6Constraints On China's Tarrifs On Australia
Constraints On China's Tarrifs On Australia
Constraints On China's Tarrifs On Australia
By contrast, China is not likely to impose sanctions on the US in response to Biden’s investigation, unless Biden attacks first. China’s imports from the US are booming and its currency is appreciating sharply. Despite Beijing’s efforts to keep the Phase One trade deal from collapsing, Biden is maintaining Trump’s tariffs and the US-China trade divorce is proceeding (Chart 7). Bilateral tariff rates are still 16-17 percentage points higher than they were in 2018, with US tariffs on China at 19% (versus 3% on the rest of the world) while Chinese tariffs on the US stand at 21% (versus 6% on the rest of the world). The Biden administration timed this week’s hawkish statements to coincide with the first meeting of US trade negotiators with China, which was a more civil affair. Both countries acknowledged that the relationship is important and trade needs to be continued. However, US Trade Representative Katherine Tai’s comments were not overly optimistic (she told Reuters that the relationship is “very, very challenging”). She has also been explicit about maintaining policy continuity with the Trump administration. We highly doubt that China’s share of US imports will ever surpass its pre-Trump peaks. The Biden administration has also refrained so far from loosening export controls on high-tech trade with China. This has caused a bull market in Taiwan while causing problems for Chinese semiconductor stocks’ relative performance (Chart 8). If Biden’s policy review does not lead to any relaxation of export controls on commercial items then it will mark a further escalation in tensions. Chart 7US Tarrifs Reduce China In Trade Deficit
US Tarrifs Reduce China In Trade Deficit
US Tarrifs Reduce China In Trade Deficit
Bottom Line: Until Presidents Biden and Xi stabilize relations at the top, the trade negotiations over implementing the Phase One trade deal – and any new Phase Two talks – cannot bring major positive surprises for financial markets. Chart 8US Export Controls Amid Chip Shortage
US Export Controls Amid Chip Shortage
US Export Controls Amid Chip Shortage
Congress Is More Hawkish Than Biden Biden’s ability to reduce frictions with China, should he seek to, will also be limited by Congress and public opinion. With the US deeply politically divided, and polarization at historically high levels, China has emerged as one of the few areas of agreement. The hawkish consensus is symbolized by new legislation such as the Strategic Competition Act, which is making its way through the Senate rapidly. Congress is also trying to boost US competitiveness through bills such as the Endless Frontier Act. These bills would subject China to scrutiny and potential punitive measures over a broad range of issues but most of all they would ignite US industrial policy , STEM education, and R&D, and diversify the US’s supply chains. We would highlight three key points with regard to the global impact of this legislation: Global supply chains are shifting regardless: This trend is fairly well established in tech, defense, and pharmaceuticals. It will continue unless we see a major policy reversal from China to try to court western powers and reduce frictions. The EU and India are less enthusiastic than the US and Australia about removing China from supply chains but they are not opposed. The EU Commission has recommended new defensive economic measures that cover supply chains in batteries, cloud services, hydrogen energy, pharmaceuticals, materials, and semiconductors. As mentioned, the EU is also hesitating to ratify the Comprehensive Agreement on Investment with China. Hence the EU is moving in the US’s direction independently of proposed US laws. After all, China’s rise up the tech value chain (and its decision to stop cutting back the size of its manufacturing sector) ultimately threatens the EU’s comparative advantage. The EU is also aligned with the US on democratic values and network security. India has taken a harder stance on China than usual, which marks an important break with the past. India’s decision to exclude Huawei from its 5G network is not final but it is likely to be at least partially implemented. A working group of democracies is forming regardless. The Strategic Competition Act calls for the creation of a working group of democracies but the truth is that this is already happening through more effective forums like the G7 and bilateral summits. Just as the implementation of the act would will ultimately depend on President Biden, so the willingness of other countries to adopt the recommendations of the working group would depend on their own executives. Allies have leeway as Biden will not use punitive measures against them: Any policy change from the EU, UK, India, and Australia will be independent of the US Congress passing the Strategic Competition Act. These countries will be self-directed. The US would have to devote diplomatic energy to maintaining a sustained effort by these states to counter China in the face of economic costs. This will be limited by the fact that the Biden administration will be very reluctant to impose punitive measures on allies to insist on their cooperation. The allies will set the pace of pressure on China rather than the United States. This gives the EU an important position, particularly Germany. And yet the trends in Germany suggest that the government will be more hawkish on China after the federal elections in September. Bottom Line: The Biden administration is unlikely to use punitive measures against allies so new US laws are less important than overall US diplomacy with each of the allies. Some allies will be less compliant with US policies given their need for trade with China. But so far there appears to be a common position taking shape even with the EU that is prejudicial to China’s involvement in key sectors of emerging technologies. If China does not respond by reducing its foreign policy assertiveness, then China’s economic growth will suffer. That drag would have to be offset by new supply chain construction in Southeast Asia and other countries. Investment Takeaways The foregoing highlights the international risks facing China even at a time when its trend growth is slowing (Chart 9) and its ongoing struggle with domestic financial imbalances is intensifying. China’s debt-service costs have risen sharply and Beijing is putting pressure on corporations and local governments to straighten out their finances (Chart 10), resulting in a wave of defaults. This backdrop is worrisome for investors until policymakers reassure them that government support will continue. Chart 9China's Growth Potential Slowing
China's Growth Potential Slowing
China's Growth Potential Slowing
Chart 10China's Leaders Struggle With Debt
China's Leaders Struggle With Debt
China's Leaders Struggle With Debt
China’s domestic stability is a key indicator of whether geopolitical risks could spiral out of control. In particular we think aggressive action in the Taiwan Strait is likely to be delayed as long as the Chinese economy and regime are stable. China has rattled sabers over the strait this year in a warning to the United States not to cross its red line (Chart 11). It is not yet clear how Biden’s policy continuity with the Trump administration will affect cross-strait stability. We see no basis yet for changing our view that there is a 60% chance of a market-negative geopolitical incident in 2021-22 and a 5% chance of full-scale war in the short run. Chart 11China PLA Flights Over Taiwan Strait
Biden Confirmed As A China Hawk (GeoRisk Update)
Biden Confirmed As A China Hawk (GeoRisk Update)
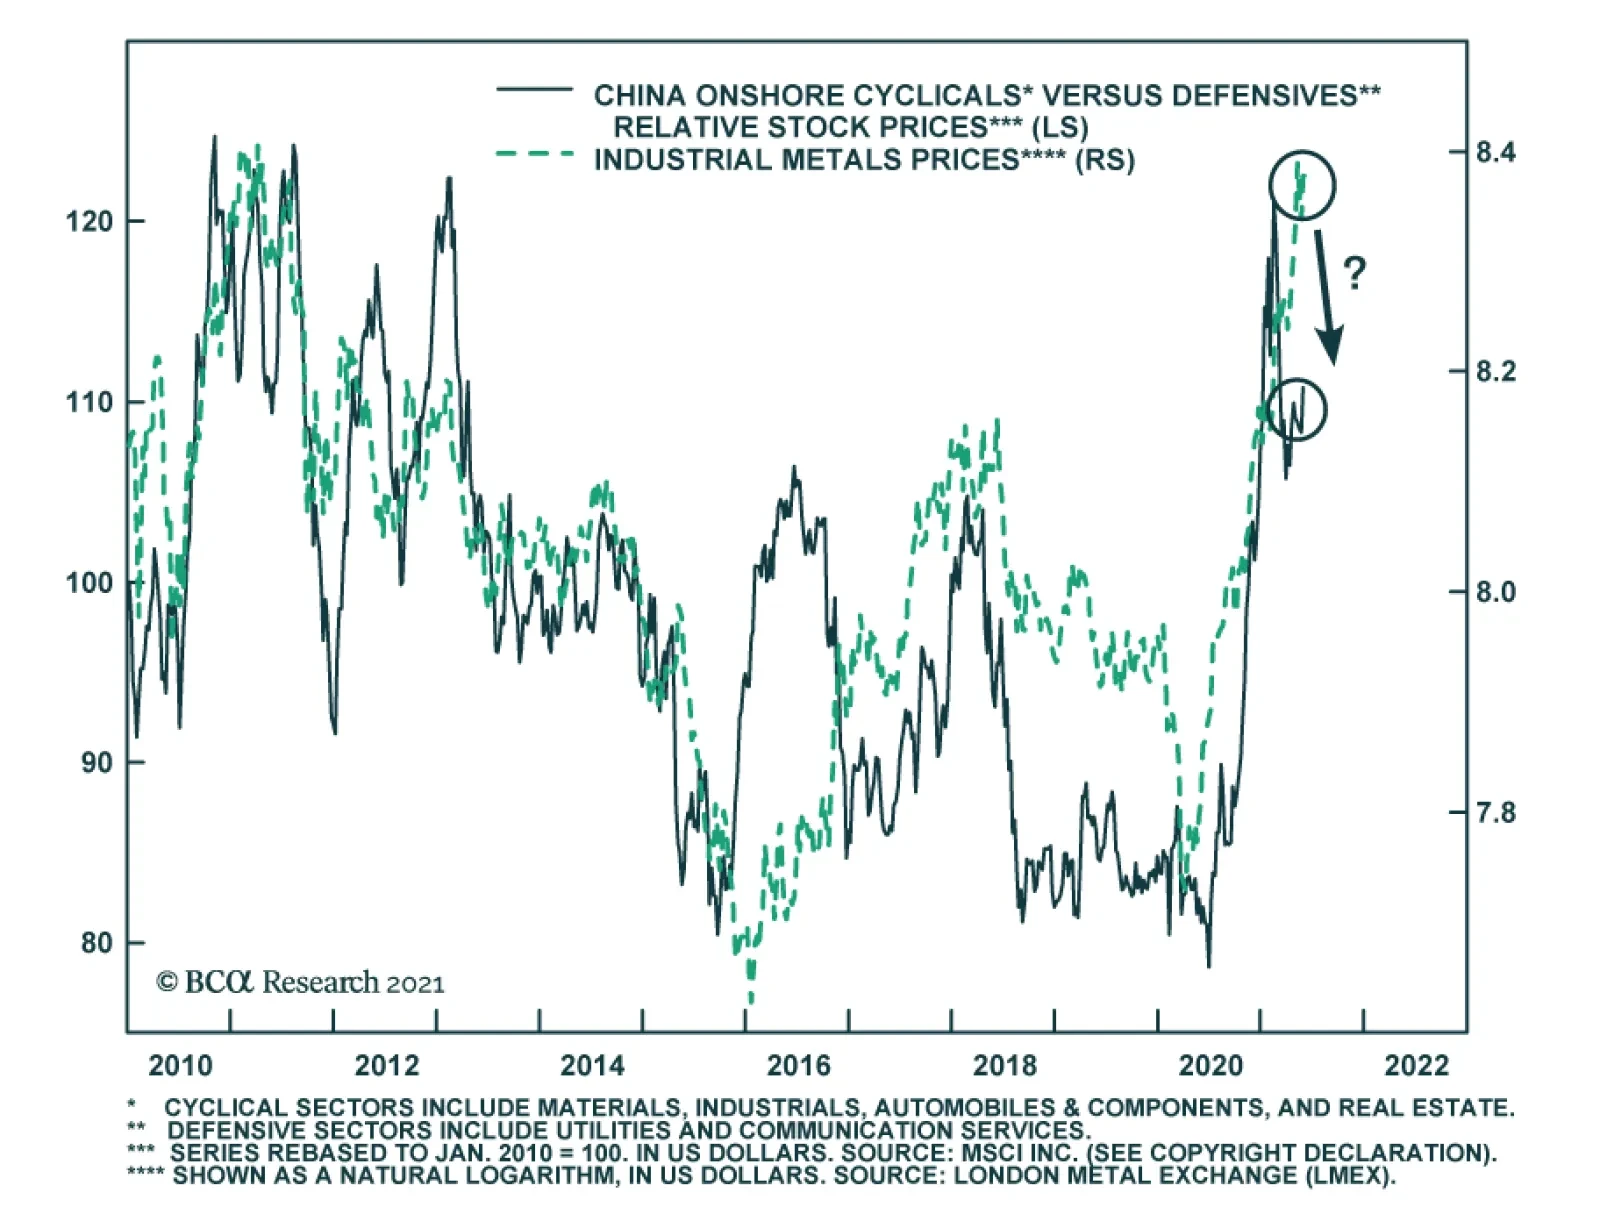
Putting all of the above together, we see substantial support for two key market-relevant geopolitical risks: Chinese domestic politics (including policy tightening) and persistent US-China tensions (including but not limited to the Taiwan Strait). We remain tactically defensive, a stance supported by several recent turns in global markets: The global stock-to-bond ratio has rolled over. China is a negative factor for global risk appetite (Chart 12). Global cyclical equities are no longer outperforming defensives. There is a stark divergence between Chinese cyclicals and global cyclicals stemming from the painful transition in China’s bloated industrial economy (Chart 13). Global large caps are catching a bid relative to small caps (Chart 14). Chart 12Global Stock-To-Bond Ratio Rolled Over
Global Stock-To-Bond Ratio Rolled Over
Global Stock-To-Bond Ratio Rolled Over
Chart 13Global Cyclicals-To-Defensives Pause
Biden Confirmed As A China Hawk (GeoRisk Update)
Biden Confirmed As A China Hawk (GeoRisk Update)
Chart 14Global Large Caps Catch A Bid Versus Small Caps
Global Large Caps Catch A Bid Versus Small Caps
Global Large Caps Catch A Bid Versus Small Caps
Cyclically the global economic recovery should continue as the pandemic wanes. China will eventually relax policy to prevent too abrupt of a slowdown. Therefore our strategic portfolio reflects our high-conviction view that the current global economic expansion will continue even as it faces hurdles from the secular rise in geopolitical risk, especially US-China cold war. Measurable geopolitical risk and policy uncertainty are likely to rebound sooner rather than later, with a negative impact on high-beta risk assets. Matt Gertken Vice President Geopolitical Strategy mattg@bcaresearch.com Coda: Global Minimum Tax Symbolizes Return Of Big Government On Thursday, the US Treasury Department released a proposal to set the global minimum corporate tax rate at 15%. The plan is to stop what Treasury Secretary Janet Yellen has referred to as a global “race to the bottom” and create the basis for a rehabilitation of government budgets damaged by pandemic-era stimulus. Although the newly proposed 15% rate is significantly below President Biden’s bid to raise the US Global Intangible Low-Taxed Income (GILTI) rate to 21% from 10.5%, it is the same rate as his proposed minimum tax on corporate book income. Biden is also raising the headline corporate tax rate from 21% to around 25% (or at highest 28%). Negotiators at the OECD were initially discussing a 12.5% global minimum rate. The finance ministers of both France and Germany – where the corporate income tax rates are 32.0% and 29.9%, respectively – both responded positively to the announcement. However, Ireland, which uses low corporate taxes as an economic development strategy, is obviously more comfortable with a minimum closer to its own 12.5% rate. Discussions are likely to occur when G7 finance ministers meet on June 4-5. Countries are hoping to establish a broad outline for the proposal by the G20 meeting in early July. It is highly likely that the OECD will come to an agreement. However, it is not a truly “global” minimum as there will still be tax havens. Compliance and enforcement will vary across countries. A close look at the domestic political capital of the relevant countries shows that while many countries have the raw parliamentary majorities necessary to raise taxes, most countries have substantial conservative contingents capable of preventing stiff corporate tax hikes (Table 1, in the Appendix). Our Geopolitical strategists highlight that the Biden administration’s compromise on the minimum rate reflects its pragmatism as well as emphasis on multilateralism. Any global deal will be non-binding but the two most important low-tax players are already committed to raising corporate rates well above this level: Biden’s plan is noted above, while the UK’s budget for March includes a jump in the business rate to 25% in April 2023 from the current 19%. Ireland and Hungary are the only outliers but they may eventually be forced to yield to such a large coalition of bigger economies (Chart 15). Chart 15Global Minimum Corporate Tax Impact Is Symbolic Rather Than Concrete
Biden Confirmed As A China Hawk (GeoRisk Update)
Biden Confirmed As A China Hawk (GeoRisk Update)
Thus a nominal minimum corporate tax rate is likely to be forged but it will not be truly global and it will not change the corporate rate for most countries. The reality of what companies pay will also depend on loopholes, tax havens, and the effective tax rate. Bottom Line: On a structural horizon, the global minimum corporate tax is significant for showing a paradigm shift in global macro policy: western governments are starting to raise taxes and revenue after decades of cutting taxes. The experiment with limited government has ended and Big Government is making a comeback. On a cyclical horizon, the US concession on global minimum tax is that the Biden administration aims to be pragmatic and “get things done.” Biden is also working with Republicans to pass bills covering some bipartisan aspects of his domestic agenda, such as trade, manufacturing, and China. The takeaway from a global point of view is that Biden may prove to be a compromiser rather than an ideologue, unlike his predecessors. Matt Gertken Vice President Geopolitical Strategy mattg@bcaresearch.com Roukaya Ibrahim Vice President Daily Insights RoukayaI@bcaresearch.com Footnotes 1 Kurt M. Campbell and Jake Sullivan, "Competition Without Catastrophe," Foreign Affairs, September/October 2019, foreignaffairs.com. Section II: Appendix Table 1OECD: Which Countries Are Willing And Able To Raise Corporate Tax Rates?
Biden Confirmed As A China Hawk (GeoRisk Update)
Biden Confirmed As A China Hawk (GeoRisk Update)
GeoRisk Indicator China
China: GeoRisk Indicator
China: GeoRisk Indicator
Russia
Russia: GeoRisk Indicator
Russia: GeoRisk Indicator
UK
UK: GeoRisk Indicator
UK: GeoRisk Indicator
Germany
Germany: GeoRisk Indicator
Germany: GeoRisk Indicator
France
France: GeoRisk Indicator
France: GeoRisk Indicator
Italy
Italy: GeoRisk Indicator
Italy: GeoRisk Indicator
Canada
Canada: GeoRisk Indicator
Canada: GeoRisk Indicator
Spain
Spain: GeoRisk Indicator
Spain: GeoRisk Indicator
Taiwan – Province Of China
Taiwan-Province of China: GeoRisk Indicator
Taiwan-Province of China: GeoRisk Indicator
Korea
Korea: GeoRisk Indicator
Korea: GeoRisk Indicator
Turkey
Turkey: GeoRisk Indicator
Turkey: GeoRisk Indicator
Brazil
Brazil: GeoRisk Indicator
Brazil: GeoRisk Indicator
Australia
Australia: GeoRisk Indicator
Australia: GeoRisk Indicator
Section III: Geopolitical Calendar
BCA Research’s Commodity & Energy Strategy service believes that China's jawboning of participants in metals markets raises the odds the State Reserve Board (SRB) will release some of its massive copper and aluminum stockpiles in the near future. …
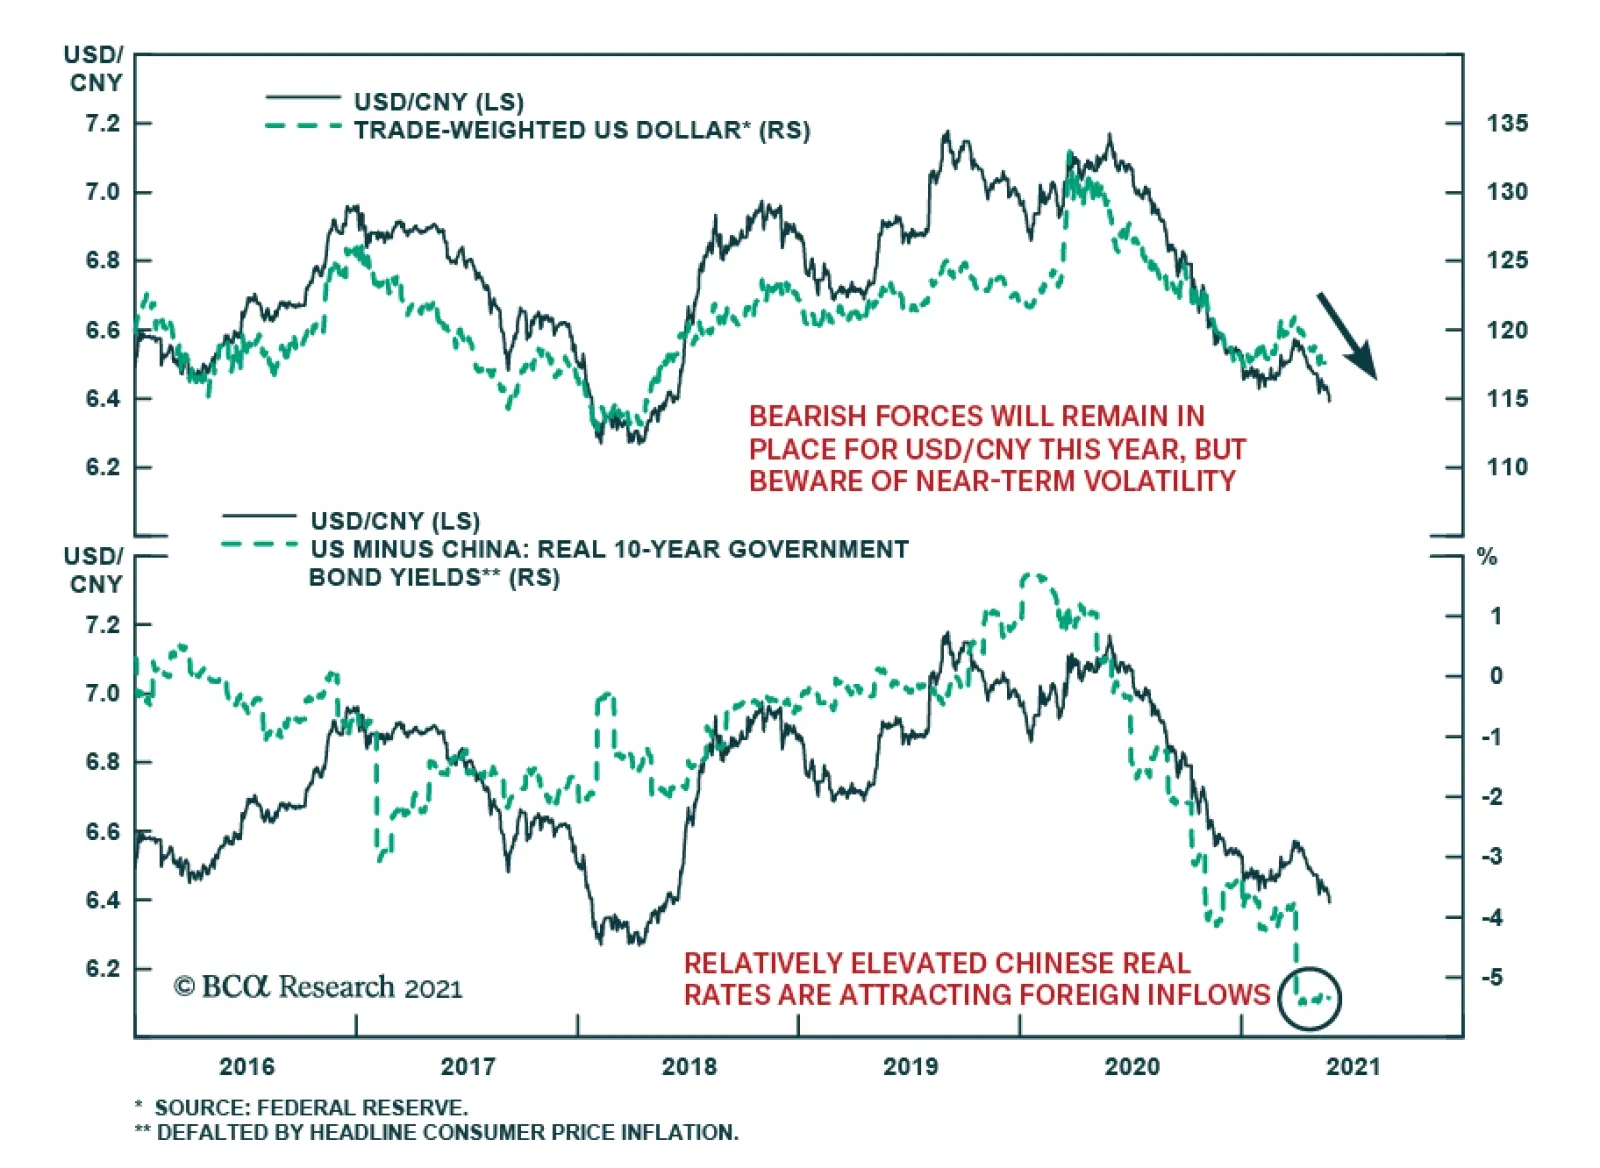
After a period of weakness in the first quarter, RMB strength has been reaffirmed. USD/CNY peaked at the end of March and is down more than 2.5% since then. Broad-based US dollar weakness explains some of the CNY’s recent gains. Nevertheless, the Chinese…