Sorry, you need to enable JavaScript to visit this website.
メインコンテンツにスキップ
メインコンテンツにスキップ

設備とサービス

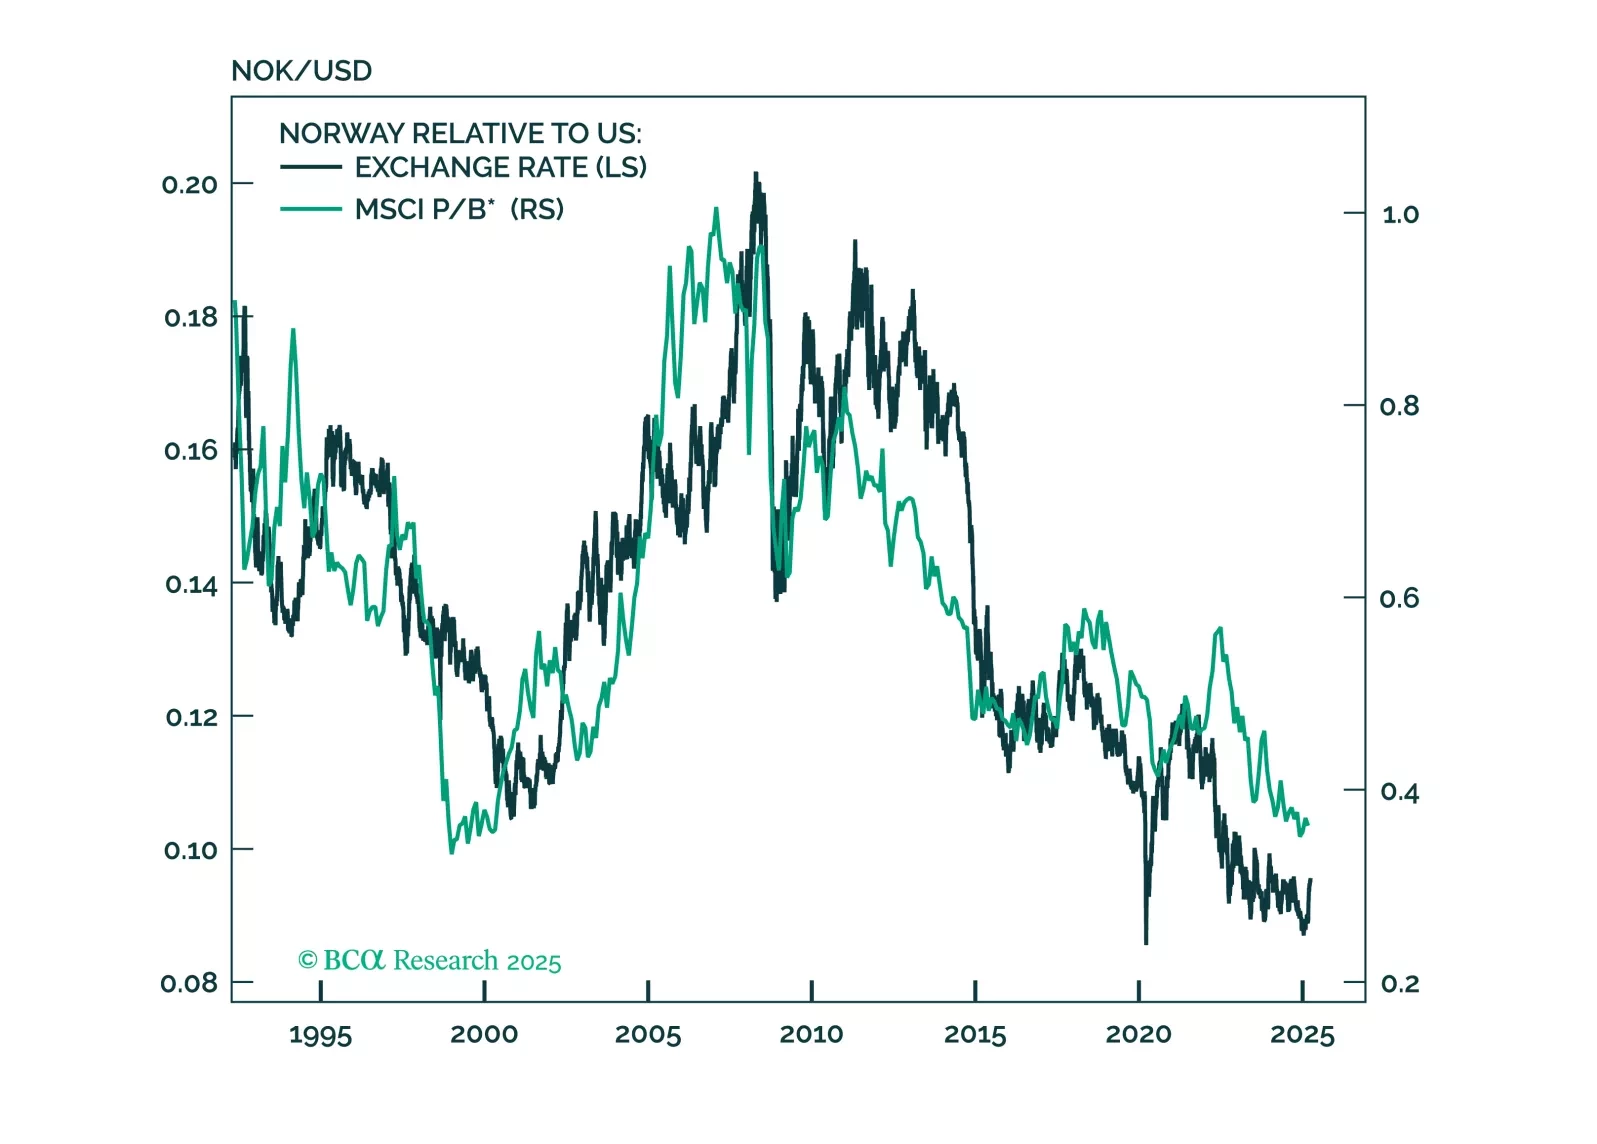
This report looks at investment implications, for Norwegian assets, given the recent meeting, from the Norges Bank. 

The decline in oil prices accelerated this month. Although Wednesday’s moves reversed Tuesday’s sharp daily declines, Brent and WTI have fallen 11% and 10% so far in September, and 30% and 33% from their April peaks. Deteriorating demand likely drove these…
According to BCA Research’s Commodity & Energy Strategy service, oil markets are caught in a tug-of-war that has kept oil prices in a trading range since H2 2023. Bearish demand concerns are enforcing an upper limit on the price of crude while bullish…
European regulatory carbon credits (EUAs) are becoming increasingly investable as an asset class. In a Special Report published last September, our Global Investment strategists agreed to the strategic bull case for EUAs, but highlighted a bearish view on…
We close our overweights to Energy and Aerospace & Defense. The macroeconomic backdrop is deteriorating for Energy. As for A&D, the good news is already priced in.

特別レポート

China’s oil demand growth will moderate to a still robust 4%-6% in the next six-to-nine months. We recommend that investors in China’s onshore and offshore stock indexes overweight energy producers.

特別レポート Executive Summary Earnings Growth Outpacing Multiple Expansion The US Energy sector is in a good place right now: Rising demand and faltering supply from OPEC 2.0 translate into a price of oil anchored at around $80 to $85/bbl. This price is twice the breakeven production cost for the majority of US producers. High prices have also created an opening for US Energy producers to restart Capex to increase production. Further, the Energy sector tends to outperform in an environment of high inflation and rising rates. As a real asset, oil is also a good inflation hedge, a quality that extends to Energy-related equities.  The favorable macro backdrop is also complimented by bombed-out valuation. Meanwhile, technicals are overbought signaling that a near-term pause is needed for prices to reset. Bottom Line: We reiterate our cyclical overweight in the Energy sector, despite the rising probability or a near-term pullback. Within Energy, we recommend a cyclical overweight of the upstream and equipment & services segments, underweight midstream, and equal weight downstream and integrated stocks.  Feature Dear client, In lieu of the February 28th publication, we will be sending you a Special Report on Wednesday, February 23rd written by our US Political Strategy service colleagues. Our regular weekly publication will resume Monday, March 7th. Kind Regards, Irene Tunkel Chief Strategist, US Equity Strategy Part I Recap Last week, in Part I of this Special Report, we described the structure of the Energy sector, its value chain, key industry drivers, and supply/demand/oil price dynamics. The Energy value chain consists of four distinct segments, with each segment corresponding to a section of the oil production value chain. The GICS classifies them as Oil & Gas Exploration and Production (Upstream or E&P), Oil & Gas Equipment and Services (E&S), Storage and Transportation (Midstream or S&T), and Refining and Marketing (Downstream or R&M). Integrated Oil & Gas straddles the entire supply chain (Integrated). Demand exceeds supply: We concluded that crude oil demand is expected to return to trend, driven by strong economic growth and the receding pandemic. In the meantime, production remains suppressed because of curtailments by OPEC 2.0 members, investment restraint from US producers, and multiple supply disruptions. Sizzling tensions with Iran, Russia, and a possible new market share war with the Saudis exacerbate supply problems and lead to heightened volatility in crude oil prices. The US Energy producers are ramping up supply: To meet the increasing oil demand, US shale oil producers are now perfectly positioned to pick up the slack in supply. To ramp up production, the US oil companies will have to invest in new and existing wells, starting a new Capex cycle, after “seven lean years” of Capex (Chart 1). There are early signs that the US Energy sector is in the early innings of new Capex and production. This week, we rely on our investment process, i.e., analysis of the macroeconomic backdrop, fundamentals, valuations, and technicals to shape our view on each segment of the Energy value chain. We are currently overweight the Energy sector and are ahead of the benchmark by 35%. Chart 1The Energy Industry Is In The Early Innings Of New Capex Cycle Macroeconomic Backdrop Can Withstand Rising Rates And High Inflation The Energy sector tends to outperform in the environment of high inflation and rising rates (Chart 2). As a real asset, oil is also a good inflation hedge, a quality that extends to Energy-related equities. Appreciating Dollar Is A Temporary Phenomenon There is a tight inverse relationship between the USD and energy prices due to the simple fact that commodity prices are quoted in dollars. Over the past seven years, the nominal WTI oil price has been over 70% inversely correlated with the strength of the USD trade-weighted index (TWI), with a beta of oil to USD of -1.6. That is, a 1% change in the TWI would be expected to translate into a $1.60/barrel change in the price of WTI (Chart 3). Chart 2The Energy Sector Is Resilient To Rising Rates Chart 3Price Of Oil And USD Are Inversely Correlated According to the BCA Research FX Strategy team, the recent dollar strengthening is a temporary phenomenon, catalyzed by the rising interest-rate differential with the rest of the world. However, historically, equity portfolio flows have been more important than other factors in explaining dollar moves. Rising rates undermine the performance of US equities and are likely to lead to a reversal in cross-border equity flows, damaging the key pillar of support for the dollar. Hence, risks to the dollar are on the downside. Fundamentals And Valuations The Energy Sector Is Enjoying Strong Sales EIA reports that “global oil consumption outpaced oil production for the six consecutive quarters, ending with the fourth quarter of 2021 (4Q21), which has led to persistent withdrawals from global oil inventories and significant increases in crude oil prices”.1 As a result of higher production, and WTI prices increasing from $52 to $85 over 2021, energy company sales have soared (Chart 4). Looking ahead, we expect sales growth to remain robust, albeit lower than in 2021: Not only are comparables more challenging, but economic growth is also decelerating. What can bring the strong sales growth to a halt? The answer is that it may be either higher prices or higher volumes: Surging prices destroy demand while surging volumes suppress oil prices, which, eventually, weigh on Capex and production. At the moment, both production levels and price are in a sweet spot: All segments of the value chain are benefiting from high but not excessive prices and volumes. Chart 4Energy Sales Surged In 2021 Chart 5Sector Profitability Is Tied To The Price Of Oil Profit Recovery Continues The overall profitability of the Energy sector is also tightly linked to the price of oil (Chart 5). The BCA Research house view is WTI centered around $80-85, with substantial volatility triggered by geopolitical tensions. With oil prices likely peaking, barring any negative geopolitical developments, earnings growth normalization off the high levels is expected (Chart 6). However, even if they are slowing, Energy sector earnings are expected to grow by 26% over the next 12 months, exceeding S&P 500 earnings by 17%. Further, over the next five years, energy earnings growth is expected to re-accelerate towards the 26% range. Chart 6Energy Sector's Earnings Growth To Exceed The Market's Chart 7Margins To Continue To Expand Importantly, sector operating margins are expected to expand towards 10% (Chart 7), which is quite a feat considering the broad-based margin contraction of the other S&P 500 sectors and industries. Our verdict? Earnings growth expectations look darn good! Despite Recent Outperformance, Valuations Are Still Attractive The BCA valuation indicator, which is a composite of P/B, P/S, and DY relative to the S&P 500, standardized relative to its own history, shows that the sector is still undervalued (Chart 8), despite a recent run of performance – earnings growth still outpaces multiple expansion (Chart 9). The energy sector is currently trading with a nearly 40% discount to the S&P 500 (Table 1) on a forward earnings basis (12.4x vs 20.3x). Chart 8Still Undervalued… Chart 9Earnings Growth Outpacing Multiple Expansion Table 1Valuation Summary Cheap But Overbought! Curiously, despite modest valuations, from a technical standpoint the sector appears overbought (Chart 10). Worse yet, our Energy Sentiment Composite is outright in the bullish zone (Chart 11) with a reading last achieved in 2009. This is certainly concerning, as euphoria is inevitably followed by panic and disappointment. However, we need to keep in mind that the technical indicators are short term in scope by design, and their main use is to help refine the position entry and exit timing. Chart 10...But Overbought! Chart 11Sentiment Is Extended Why such a pronounced dichotomy with valuations? Technical indicators are based on returns, which have been rather outstanding for the sector, while valuations take into account earnings growth, which explains and justifies the surging returns. Too Much Cash Our analysis would be amiss if we did not bring energy companies’ free cash flow (FCF) into the discussion. With a curtailed supply of energy and rising prices, these companies have been awash in cash (Chart 12) – their FCF has increased by nearly 80% year over year, and profits have surged. What will companies do with this windfall? Well, first and foremost, during the seven lean years of extreme Capex discipline, these companies have gotten their commitment to returning cash to shareholders embedded in the corporate psyche, which is something that is unlikely to change fast. Energy continues to be the highest-yielding sector in the S&P 500 (Chart 13). However, having learned the lesson the hard way, many companies are adopting variable dividends to avoid potential disappointment if the oil price collapses. In addition to disbursing cash, the energy companies are paying off debt and are investing in expanding production. Chart 12Windfall Of Cash Chart 13Energy Is The Highest Yielding Sector Investment Outlook By Segments Of The Energy Value Chain The macroeconomic backdrop for Energy appears benign, with rates rising, inflation elevated, and the dollar likely contained. The sector also appears attractive from both a profitability and a valuation standpoint. However, a near-term pullback is likely as the sentiment around the sector is overly bullish – but that is likely to be short-lived. While we like the sector overall, we aim to provide granular industry group recommendations. To do so, we will zoom in on each segment of the value chain. Oil And Gas Exploration & Production (Upstream) Strong demand recovery and OPEC 2.0 oil production shortages bode well for the US E&P companies, which are cautiously starting to restart capital investment and ramp up production. We expect the E&P, especially shale oil production, companies to be one of the best performing energy subsectors, with WTI anchored around a consensus of $80-85/bbl. The upstream segment is highly dependent on the price of oil, which is currently in a sweet spot: High but not high enough to cause demand destruction (Chart 14). With oil prices peaking, E&P sales growth is decelerating (Chart 15). However, upstream also benefits from the sustainable cost reductions achieved through improved experience in well siting, drilling, and completion techniques. Chart 14Upstream Earnings Depend On The Price Oil Chart 15Sales Growth Is Normalizing As a result of growing, albeit decelerating, sales and effective cost management, E&P is one of the most profitable segments of the energy complex: Operating margins are currently at 22% and are expected to expand to 27% (Chart 16). From a valuation standpoint, the industry is trading at 10 times forward earnings, which represents an 50% discount to the S&P 500. The BCA valuation indicator for the industry group is also in the undervalued territory (Chart 17). Chart 16Margins To Continue To Expand Chart 17E&P Is Still Cheap Overweight Oil and Gas Exploration & Production industry Equipment And Services Is A High Octane Play On The New Capex Cycle Upstream Capex is revenue for E&S companies. After “seven lean years” of the Capex cycle, the fortunes of E&S companies are finally turning, with a rising price of oil finally enticing upstream companies to expand production by reopening existing and drilling new wells (Chart 18). According to CFRA, upstream Capex is expected to increase by 25% in 2022, and 7% in 2023. With the new energy Capex cycle in sight, Oil Services is the only energy segment for which sales growth is expected to accelerate over the coming year (Chart 19). In fact, sales will continue to grow at a healthy clip until the cycle matures – a time period measured in years. Chart 18Capex Has Restarted Chart 19Sales Growth Is Rebounding Sharply   The profitability of the sector is also normalizing after a pandemic slump, and margins are expected to stay flat (Chart 20) despite industry labor costs rising sharply to 8% year over year (Chart 21). Earnings are expected to rise by a third in 2022, albeit off very low levels. Chart 20Profit Margins Will Stabilize Chart 21Rising Wages Are Cutting Into Profitability In terms of valuations, the E&S industry is one of the cheapest in the sector, with the BCA Valuations Indicator standing at -1.5 standard deviations below a long-term average. We are positive on the Energy Equipment and Services space, which we consider a high octane play on the upcoming production increases and the new energy cycle. Overweight Energy Equipment and Services Storage And Transportation Will Benefit From Rising Production Volumes The midstream segment is one of the most profitable in the energy supply chain. This industry has high fixed costs, and its profitability is a function of production volume, not oil price. (Chart 22). From that standpoint, the industry is in a good place: US production volume, especially of shale oil, is poised to increase, filling the pipelines and driving sales growth. However, there are also challenges: Pipelines installed in older shales start to see original contractual commitments expiring, resulting in lower cash flows as the pipelines try to re-commit suppliers within a market that has an abundance of pipeline capacity. On the cost side, the S&T segment is seeing an increase in labor costs, with average hourly earnings (AHE) rising close to 10%. Chart 22Production Volume Is A Driver Of Midstream Segment's Profitability With challenges on the sales side and rising costs, it is not surprising that the market expects earnings in the S&T industry to stay flat over the next year or so (Chart 23). Operating profit margins will contract over the next year from the 19% the industry is enjoying now to roughly 14% (Chart 24). Chart 23Midstream Earnings Are To Stay Flat Chart 24Industry Is Highly Profitable But Margins Are Contracting In addition, it is important to note that pipelines run through public land. The recent tightening of EPA regulations and an administration hostile to fossil fuel may halt or slow down pipeline build-out. This may be a short-term negative as some companies may have to forego some of their investments. Over the long run, this may limit pipeline availability and lead to higher energy transportation and storage costs. Underweight Energy Storage and Transportation Industry Energy Refining And Marketing– Favorable Backdrop But No Oomph Similar to the midstream segment, refiners are a high fixed cost operation, and their business is only loosely dependent on the price of oil. Profitability of downstream companies is a function of capacity utilization of the refining facilities, and the crack spread or price differential between the price of crude and refined oil. Thanks to rising demand for oil, and rising volumes, capacity utilization stands at nearly 90% and is approaching pre-pandemic levels (Chart 25, bottom panel). Crack spreads are also high in absolute terms thanks to low inventories (Chart 25, top panel). Chart 25High Capacity Utilization and Wide Crack Spreads Are A Boon For Downstream… Chart 26...But Razor-Thin Margins Make The Industry Vulnerable With the upstream segment ramping up production, refining volumes should increase, further improving capacity utilization. And while margins are razor-thin, they are projected to increase over the next year (Chart 26). The key concern about the industry is that, with margins this narrow, there is little or no buffer to absorb changes in crack spreads or capacity utilization should oil prices rise or volumes decline. And yet, downstream, while cheap, is more expensive than Oil Services, midstream, or Integrated Oil. Equal-weight Energy Refining and Marketing industry Integrated Oil & Gas Is A Safe Bet Integrated Oil is an industry that is diversified across all the segments of the value chain. The characteristics that allowed Integrated Companies to maintain their stock prices better during the downturn – less financial leverage, less reinvestment volatility, stronger dividend support, and counter-cyclical improvement of downstream operations – will work against these stocks during an oil price recovery. As such, while Integrated stocks should benefit from higher prices and production volumes, this is a lower beta proposition: It is better to own Integrated Oil on the way down, but riskier and higher beta E&P or Oil Services stocks during the up leg of the energy cycle. Equal-Weight Integrated Oil & Gas Investment Implications The US Energy sector is in a good place right now: Rising demand and faltering supply from OPEC 2.0, translates into a price of oil anchored around $80 to $85/bbl. This price is twice the breakeven production cost for the majority of the US producers. Rising oil prices had resulted in windfall profits and surging free cash flow, which the Energy companies are dutifully returning to shareholders. High prices have also created an opening for US Energy producers to restart their Capex to increase production. This positive stance of upstream companies is benefiting the entire supply chain. Energy Equipment and Services providers are enjoying accelerated sales growth as E&P increases Capex. Transportation and storage companies are benefiting from higher volumes. And last, the downstream segment benefits from high-capacity utilization of its refineries and wide crack spreads thanks to low refined oil inventories. We are cyclically positive on the Energy sector, the fundamentals of which are solid, and for which valuations are modest. However, overextended technicals indicate that a near-term correction after a strong run is highly likely. We won’t sell to avoid the pullback but will use it as an opportunity to add to the existing positions. Within the Energy Sector, we are constructive on the upstream and E&S segments, both of which benefit from the high price of oil. We are less keen on the midstream segment, which, despite the benefits of increased production volume, is handicapped by rising labor costs, and expiring transportation contracts. And lastly, we are equal-weight the downstream segment, which, despite rising volumes and wide crack spreads, has razor-thin margins. Integrated Oil is the most diversified segment, which is more resilient during the down leg of the energy cycle, but too tame during the upcycle. Bottom Line We recommend a cyclical overweight to the Energy sector as it is in the early innings of the new energy cycle, thanks to surging demand and constrained production capacity out of the US. It is also the highest yielding sector in the S&P 500. However, a near-term pullback after a strong run is likely – we will leverage it to add to our existing overweight. We also recommend a cyclical overweight of the upstream and Oil Equipment & Services segment, underweight midstream, and equal weight downstream.   Irene Tunkel Chief Strategist, US Equity Strategy irene.tunkel@bcaresearch.com       Footnotes 1     https://www.eia.gov/outlooks/steo/   Recommended Allocation
Highlights Alternative energy is priced to deliver spectacular long-term earnings growth, but this will be a very tough ask. While alternative energy will take a greater share of the energy pie, the pie itself is shrinking, as is its price. At its current valuation, alternative energy does not meet the conditions to be in a long-term investment portfolio. As the Ethereum network becomes the ‘go to’ place to implement and execute smart contracts or decentralised finance, such services will have to be paid in ETH giving the token an economic value. ETH should certainly form a small part of a long-term investment portfolio. A near-term combination of valuation and technical constraints means that stocks will struggle to outperform ultra-long bonds. Fractal analysis: India versus China. Feature Chart of the WeekThe World Is Using Much Less Energy Per Unit Of Economic Output Alternative Energy Blues Alternative energy is the meme theme of the moment. Hardly a day passes without some exhortation to save the planet, by substituting fossil fuels with cleaner forms of energy. Yet this year, alternative energy stocks have performed dismally. Since January, the sector is down 30 percent in absolute terms, and almost 40 percent versus the broad market. Begging the question, how can one of the biggest themes of the moment be one of the worst investment performers? Last year, the forward earnings of the alternative energy sector rose by 35 percent, helped by post-pandemic stimulus measures that targeted the clean energy industry. But as investors fell in love with this meme theme, the bigger story was that the valuation paid for the sector skyrocketed from 13 times forward earnings to a nosebleed 42 times, an increase of 220 percent (Chart I-2 and Chart I-3). Chart I-2Alternative Energy Earnings Rose... Chart I-3...But The Valuation Skyrocketed To put the 42 into context, the peak multiple of the tech sector has reached ‘only’ 29 this cycle, meaning that alternative energy was trading at a near 50 percent premium even to the daddy of growth sectors! This year, as investors have pared back the nosebleed valuation, the alternative energy sector has underperformed. Nevertheless, it is still trading at a 25 percent premium to tech, meaning that its profits will have to deliver spectacular long-term growth to justify the sky-high valuation. Is this likely? We are not convinced. The world is using less energy per unit of economic output. A fundamental rule of long-term investment is that you shouldn’t own any sector whose sales are shrinking as a share of the economy. The problem for alternative energy is that it is, ultimately, energy (Chart I-4). And the world is using less energy per unit of economic output. Chart I-4Alternative Energy And Traditional Energy Show Similar Earnings Profiles In 1995, every $1000 of real GDP used 157 kilograms of oil equivalent energy. Today, that has plunged to 109 kilograms. Meaning that over the past 25 years, the world economy has reduced its energy intensity by 30 percent.1 And the downtrend persists (Chart I-1). Granted, over the past 25 years, the share of the energy pie taken by non-fossil fuels has increased from 13.4 to 16.9 percent, of which renewables have increased from 0.6 to 5.7 percent. But the marginal prices of wind, solar, and geothermal power generation are collapsing. As a recent report from the International Renewable Energy Agency (IRENA) points out: Generation costs for onshore wind and solar photovoltaics (PV) have fallen between 3 percent and 16 percent yearly since 2010 – far faster than anything in our shopping baskets or household budgets… (and) auction results show these favourable cost trends continuing through the 2020s.2 Given that the alternative energy market is competitive rather than monopolistic or oligopolistic, a large part of these massive cost savings will be passed on to end-users. Constituting a long-term boon to consumers rather than to alternative energy profits. To repeat, with the alternative energy sector still trading at a 25 percent premium to tech, it must deliver spectacular long-term earnings growth. But this will be a very tough ask. Energy sector profits tightly track the value of energy produced, meaning volume times price (Chart I-5). The risk is that while alternative energy will take a greater share of the energy pie, the pie itself is shrinking, as is its price. Chart I-5Energy Sector Profits Tightly Track The Value Of Energy Produced (Volume Times Price) We conclude that with an ambiguous outlook for long-term earnings growth, alternative energy does not meet the conditions to be in a long-term investment portfolio at its still nosebleed valuation multiple of 32 times forward earnings.  Now let’s turn to an investment that you should have in a long-term investment portfolio. The London Hard Fork Is A Boon For The Ethereum Network The Ethereum network’s London hard fork – an event that passed under most radar screens – marks the shape of things to come for the blockchain and the cryptocurrency space. Crucially, it signals an ongoing sea-change that favours the Ethereum network’s users at the expense of its cryptocurrency miners. For those interested in the nerdy details, we direct you to Ethereum Improvement Protocol (EIP) 1559. But to cut to the chase, the fork has drastically reduced the profitability of Ethereum mining while “ensuring that only ETH can ever be used to pay for transactions on Ethereum, cementing the economic value of ETH within the Ethereum platform.” Only ETH can ever be used to pay for transactions on Ethereum, cementing the economic value of ETH within the Ethereum platform. The statements of intent address, and will ultimately alleviate, two of the biggest investment concerns about cryptocurrencies – first, that cryptocurrency mining is a prodigious user of energy, particularly dirty energy; and second, that as cryptocurrencies cannot be readily exchanged for goods and services, they have no value other than that from other investors believing they have value. Addressing the first concern, mining becomes irrelevant if the blockchain users employ the skin in the game ‘proof-of-stake’ protocol to validate transactions rather than the energy-intensive ‘proof-of-work’ protocol that relies on external miners. Which is where Ethereum is headed with the fully proof-of-stake Ethereum 2.0. Addressing the second concern, if the Ethereum network becomes the ‘go to’ place to implement and execute smart contracts or decentralised finance, then such services will have to be paid in ETH, giving the tokens an economic value. Hence, the key structural question is, which blockchain networks will become the go to places for decentralised intermediation? Ethereum is an excellent candidate. Note that the lending arm of the EU, the European Investment Bank, has effectively endorsed the Ethereum network by issuing a €100 million digital bond on it. And although the principal “is expected to be repaid in euros”, the intermediators get paid in ETH. Crucially, the token of a successful blockchain network will become the de-facto currency of the network, exchangeable for intermediation services on that network. With a value independent of speculative investments, investors can also justifiably own these tokens as a ‘digital gold.’ Clearly, cryptocurrencies experience a higher volatility than gold, but this can be adjusted through position sizing. To equalise drawdowns in digital gold versus gold, investors should own $1 of cryptocurrency for every $3 of gold (Chart I-6). On this relative risk basis, cryptocurrencies should constitute at least one quarter ($3.8 trillion) of the $15 trillion ‘anti-fiat’ market that gold currently dominates.  Chart I-6Cryptocurrency Drawdowns Are Becoming Less Severe Therefore, if Ethereum became the dominant cryptocurrency based on its network size, it would command a market capitalisation of at least $1.9 trillion, a more than five-fold increase from today. ETH should certainly form a small part of a long-term investment portfolio. Stocks Versus Bonds Face A Double Constraint Since mid-March the world stock market (MSCI All Country World Index) has rallied by 10 percent, but the ultra-long bond (30-year T-bond) has done even better, rallying by 14 percent. Hence stocks to bonds have drifted gently lower, for which there are two reasons. First, the valuation of the most highly-rated parts of the stock market have reached the limit that has held in the post-GFC era. Specifically, tech’s earnings yield premium versus the 10-year T-bond has reached its 2.5 percent lower bound (Chart I-7). Chart I-7Tech Reached Its Post-GFC Valuation Limit Versus Bond Yields Second, the groupthink in overweighting stocks versus bonds reached an extreme. All investors up to 260-day investment horizons are already in the trade, and this level of extreme groupthink correctly signalled stocks versus bonds major-tops in 2010 and 2013 (as well as major-bottoms in 2008 and 2020) (Chart I-8). Chart I-8The Groupthink In Overweighting Stocks Versus Bonds Reached An Extreme This near-term combination of valuation and technical constraints means that stocks will struggle to outperform ultra-long bonds. In the near term, stocks will struggle to outperform ultra-long bonds. Nevertheless, if bonds rally, it will support stocks. But if bonds sell off, it will undermine stocks. The implication of the above is that a bond sell-off – should it even occur – will be self-limiting. As we explained last week in Stocks, Not The Economy, Will Set The Upper Limit To Bond Yields, the upper limit to the 10-year T-bond yield is 1.8 percent. India Trading At A Precarious Premium This week’s fractal analysis highlights that the spectacular outperformance of India versus China has reached the limit of fragility on its 260-day fractal structure that marked previous major-tops in 2014, 2016, and 2019 (as well as major bottoms in 2015, 2018, and 2020) (Chart I-9). Chart I-9The Outperformance Of India Versus China Is Fragile In effect, as China’s tech sector has recently corrected, tech stocks in India are now trading at a precarious 60 percent premium to those in China (Chart I-10). Chart I-10India Is Trading At A Precarious Premium To China The recommended trade is to short India versus China (MSCI indexes), setting the profit target and symmetrical stop-loss at 19 percent. Dhaval Joshi Chief Strategist dhaval@bcaresearch.com Footnotes 1 Source: World Bank, and BP Statistical Review of World Energy 2021 2 Source: Renewable Power Generation Costs In 2019, International Renewable Energy Agency Fractal Trading System Fractal Trades 6-Month Recommendations Structural Recommendations Closed Fractal Trades Closed Trades Asset Performance Equity Market Performance   Indicators To Watch - Bond Yields Chart II-1Indicators To Watch - Bond Yields ##br##- Euro Area Chart II-2Indicators To Watch - Bond Yields ##br##- Europe Ex Euro Area Chart II-3Indicators To Watch - Bond Yields ##br##- Asia Chart II-4Indicators To Watch - Bond Yields ##br##- Other Developed   Indicators To Watch - Interest Rate Expectations Chart II-5Indicators To Watch - Interest Rate Expectations Chart II-6Indicators To Watch - Interest Rate Expectations Chart II-7Indicators To Watch - Interest Rate Expectations Chart II-8Indicators To Watch - Interest Rate Expectations  
ハイライト 中国の鋼材需要の急増を受け、建築およびインフラプロジェクトが今年完了するにつれて上海鉄鋼先物が今月初めに5,200人民元/MT弱の史上高近くまで上昇したことから、銅価格はさらに上昇すると見込まれます(今週のチャート)。 銅は今年および来年にかけて実需ベースでの需給不足を記録し、在庫がさらに減少するとともに中国および世界的に銅スクラップの需要を押し上げるでしょう。 銅価格の上昇が続けば、現在の市場での口先介入が需要と価格上昇を抑えられない場合、中国の膨大な国家保有銅在庫(約200万MTと推定される)の一部を当局が放出する可能性があります。 強い鋼材マージンと製鉄所に対する新たな環境規制が高品位鉄鉱石(65% Fe)需要を押し上げており、同品は今週初めに約223ドル/MT弱の史上高を付けました。ベンチマークの鉄鉱石価格(62% Fe)は今週10年ぶり高値で取引され、約190ドル/MT手前でした。 当社は2021年12月の銅価格予想を4.50ドル/lbから5.00ドル/lbに引き上げます。さらに、本日の取引終了時に2022年物CME/COMEX銅をロングし、2023年物CME/COMEX銅をショートするポジションを取ります。より急峻なバックワーデーションを見込んでの取組みです。 特集 中国の唐山(Tangshan)製鉄拠点における汚染削減のための製鉄所稼働率の最大30%削減という政府指示は、建設およびインフラのブームに対応する既に逼迫した市場をさらに引き締めることになります(チャート2)。このブームは鋼材価格、そして結果的に鉄鉱石価格を急騰させました(チャート3)。過去と同様に、これが銅の強気相場の次の局面の舞台を整えます。 今週のチャート 鋼材の急騰が銅価格の更なる上昇を予告 鉄鋼の急騰は銅価格のさらなる上昇を示唆する 鉄鋼の急騰は銅価格のさらなる上昇を示唆する 当社のモデルでは、特に鉄筋(リバー)価格と銅価格の間に強い関係があることが今週のチャートで確認できます。鋼材は建築・インフラプロジェクトの前段階で使われ(鉄筋で補強されたコンクリートや圧延コイル製品など)、その後、完成したプロジェクトには銅が使われます(配線や配管の形で)。 チャート2 銅の強気相場は続く 銅の強気相場は続く 銅の強気相場は続く 建設・建築ブームに加え、製造業の継続的な回復が銅価格の追い風となり、2021年後半の世界的な活動回復がこれをさらに増幅します。チャート4は名目GDP水準と銅価格の関係を示しています。重要なのは、アジア(中国を含む)およびアジア以外の経済成長が銅価格とコインテグレーション(共積分)関係にあることで、すなわち経済成長と工業コモディティは長期的な均衡を共有しており、それが同時変動を説明します。 チャート3 鋼材ブームが鉄鉱石価格を押し上げる 鉄鋼ブームが鉄鉱石価格を押し上げる 鉄鋼ブームが鉄鉱石価格を押し上げる メディア報道はしばしば、中国の政府支出をGDP比で注目しがちです(例:社会融資総額のGDP比)。しかし商品価格動向を説明しようとする際に経済要因が除外されがちです。中国政府が民間部門(財・サービス面)をさらに拡大することに成功すれば、オーガニックな経済成長が中国のコモディティ需要を説明する上でより重要になります。 チャート4 世界経済の成長が銅価格を押し上げる 世界的な経済成長が銅価格を押し上げる 世界的な経済成長が銅価格を押し上げる 当社の銅モデルでは、名目中国GDP、新興アジア(EMアジア)GDPおよびアジア以外の新興国(EM)GDPに加え、鋼材と鉄鉱石価格が銅価格と共積分関係にあることが分かります。これは純粋な経済学的観点から期待される結果です。一方で、これらの工業用コモディティ価格と中国の名目GDPに対する社会融資総額の割合との間には共積分関係(経済的な共動性や共通トレンド)は見られません。これらのモデルにより、銅価格の説明や予測に役立たない偽の関係を回避できます。 チャート5 鉄鉱石・銅の需要はグリーン・エネルギーの整備で増加する 鉄鋼価格の急騰で銅が上昇 鉄鋼価格の急騰で銅が上昇 チャート6 再生可能エネルギーが新規増分発電を主導 銅、鉄鋼価格の急騰を受け上昇へ 銅、鉄鋼価格の急騰を受け上昇へ 長期的には、当社が過去の調査報告で指摘してきたように、分散型再生可能発電の導入、よりレジリエントな電力網、電気自動車(EV)への移行は、鉄鉱石や鋼材といったばら積み需要、および特に銅のようなベースメタルの需要成長の主要な源泉となります(チャート5)。1 すでに再生可能エネルギーは、世界の電力網に追加される新規増分発電の中で最も高い成長セグメントを占めています(チャート6)。 銅供給の増加にはより高い価格が必要 銅供給は短期(2022年末まで)では需要に対応するのが困難であり、再生可能エネルギーとEVの整備は大半がこれから始まる段階にあります。つまり中期(2025年末まで)および長期(2050年)において、需要を満たすためにはかなりの新供給を開発する必要があります。 短期的には、精錬銅の供給面、特に製錬所が半精製品として精製し製造入力にする凝縮物(コンデンセート)レベルが極めて低下しており、中国の製錬所におけるトリートメント料・精製料(TC/RC)の長期的な急落からも確認できます(チャート7)。先週およそ22ドル/MTで、これらの手数料は2013年に中国でのベンチマークTC/RC指数が開始されて以来の最低水準でした(reuters.comによる)。2 チャート7 供給減少で銅のTC/RCが低下、価格を押し上げる 銅のTCRCsが供給減で下落し、価格を押し上げる 銅のTCRCsが供給減で下落し、価格を押し上げる 銅の供給事情はチャート8にも表れており、年次の供給と需要を残高に換算すると、これが在庫市場を介して調整されます。国際銅研究グループ(ICSG)は、鉱山生産は昨年も前年並みで推移し、精銅供給はわずか1.5%の増加にとどまったと推定しています。 チャート8 実需の不足が銅在庫を引き下げる... 現物不足が銅在庫を取り崩す… 現物不足が銅在庫を取り崩す… ICSGの推定によれば消費は2.2%増加し、中国の保税倉庫在庫を調整後の今年の実需ベースの不足は456千MTが見込まれます。これで銅市場は4年連続の実需不足となり、2017年以降の平均不足は約414千MTです。その結果、在庫が再び供給ギャップを埋める頼みとなり、世界の在庫は前年比約25%減と低水準で今後も減少し続けるでしょう(チャート9)。 鉱業の設備投資が弱く、銅鉱石の品位が低下しているため、相当程度の新投資を促すにはより高い価格が必要です(チャート10)。しかし、これらプロジェクトのリードタイムは最良のケースでも5年であるため、鉱山会社は近い将来に最終投資判断を下してプロジェクトを承認する必要があります(チャート11)。 チャート9 ...結果として4年続く実需不足で在庫は低水準 …4年にわたる現物不足を経て低い …4年にわたる現物不足を経て低い チャート10 弱い投資と低下する鉱石品位を是正するにはより高い銅価格が必要 弱い設備投資と鉱石品位の低下を是正するには、銅価格のさらなる上昇が必要だ 弱い設備投資と鉱石品位の低下を是正するには、銅価格のさらなる上昇が必要だ チャート11 新規鉱山稼働までのリードタイムは短縮中だが時間は限られる 銅、鉄鋼価格の急騰で上昇へ 銅、鉄鋼価格の急騰で上昇へ 投資への含意 当社が銅に注目するのは、銅があらゆる再生可能技術に関わり、電気自動車(EV)にとっても重要であり、特にこの技術が広く普及した場合にその重要性が増すという単純な事実によります(チャート12)。 当社は短期・中期・長期の投資期間にわたり銅供給の課題が続くと予想しています。短期対応として、当社は2020年9月10日に2021年12月物銅をロングすることを推奨しており、このポジションは現在39.2%の含み益です。中長期をカバーするために、当社はS&P グローバル GSCI コモディティ・インデックスおよびiShares GSCI コモディティ ダイナミック ロール ストラテジー ETF(COMT)をそれぞれ2017年12月7日と2021年3月12日に推奨しており、これらは現時点でそれぞれ-2.3%および-0.8%となっています。 チャート12 電気自動車の普及が新たな銅需要を生む 鉄鋼価格の急騰で銅が上昇へ 鉄鋼価格の急騰で銅が上昇へ 本日の取引終了時に、上記の銅の需給ストーリーに基づく中期的な機会を捉えるために、2022年物CME/COMEX銅先物をロングし、2023年物CME/COMEX銅先物をショートするポジションを構築します。市場のさらなる引き締まりにより在庫が取り崩され、銅先物カーブのバックワーデーションがより急峻になると予想しています。 短期・中期・長期の当社ポジションに対する主なリスクは、世界的にCOVID-19パンデミックを抑制できないことであり、これは短期的なリスクだと考えています。第二のリスクは、中国国家備蓄局(別名:国家鉱物備蓄局)が保有する戦略的な銅コンセントレート備蓄の大規模放出です。後者のリスクに関して、同局の実際の保有量は不明ですが、約200万MTの範囲にあると考えられています。3 結論: 当社は工業用コモディティ、特に銅に対して強気の立場を維持します。 ロバート・P・ライアン チーフ・コモディティ&エネルギー・ストラテジスト rryan@bcaresearch.com   コモディティ概要 エネルギー: 強気 米国エネルギー情報局(EIA)によれば、テキサス州は2022年末までに約10GWのユーティリティ規模の太陽光発電を追加する見込みです。テキサスは2020年に本格的に太陽光市場に参入し、2.5GWを導入しました。EIAは今後2年間で年平均約5GWを追加すると見ており、総太陽光容量は約15GW弱になる見込みです。この新規容量の約30%は米国で最も生産性の高い油田があるパーミアン盆地で建設される予定です。比較として、米国の太陽光発電の主要生産州であるカリフォルニアはEIAによれば3.2GWの新規太陽光容量を追加します(チャート13)。2022年末までに、新規太陽光発電の約3分の1がテキサスで追加される見込みで、同州はすでに国内で最大の風力発電地でもあります。風力の発電可能性は夜間に高く、太陽は昼間に最も豊富です。 貴金属: 強気 パラジウム価格は水曜日に約2,876ドル/ozで取引され、2020年2月の過去最高2,875.50ドル/ozを上回り3,000ドル/ozに迫っています。これは世界最大のパラジウム生産者であるロシアの金属メーカー、ノリリスクの生産見通し引き下げが続いているためです(チャート14)。同社は今週、以前の見通しを更新し、鉱山の浸水により銅・ニッケル・パラジウムの鉱山生産が今年最大20%減少する可能性があるとしました。パラジウムはガソリン車の触媒に使われ、世界がCOVID-19由来の需要破壊と自動車の供給を制限している半導体不足から回復するにつれて、自動車販売の回復が見込まれます。加えて、白金族金属(PGM)の生産は南アフリカの電力供給の不安定さにより妨げられており、国内の電力大手が需給調整のために計画停電を実施せざるを得ない状況です。当社は2020年4月23日にパラジウムのロングを推奨して以降、同金属のロングを維持しており、このポジションは35.6%の含み益です。 チャート13 鉄鋼価格の急騰で銅が上昇へ 鉄鋼価格の急騰で銅が上昇へ チャート14 パラジウム価格 パラジウム価格     脚注 1     例として当社が2020年11月26日に発表したレポート「Renewables, China's FYP Underpin Metals Demand」(再生可能エネルギー:中国の五カ年計画が金属需要を支える)をご覧ください。‌ ces.bcaresearch.comで入手可能です。   2     reuters.comに掲載された2021年4月14日付の記事「RPT-COLUMN-Copper smelter terms at rock bottom as mine squeeze hits: Andy Home」を参照してください。この記事は、鉱山と製錬所間の直接取引が10ドル/MT程度まで報告されたことを指摘しており、銅の実需サイドが現状いかに逼迫しているかを示しています。 3    reuters.comに掲載された2021年4月20日付の記事「Column: Supercycle or China cycle? Funds wait for Dr Copper's call」をご覧ください。    投資見解とテーマ 推奨 戦略的推奨 戦術的トレード コモディティ価格と取組の参考表 2021年にクローズしたトレード クローズ済みトレードの要約 より高いインフレが到来 より高いインフレが到来
Overweight Quarter-to-date the S&P energy services index is up 12% compared with the 2% rise in the broad market. While the steep rebound in oil prices primarily lies behind such stellar outperformance (top panel), our capex upcycle theme for 2018 should support this nascent recovery. Energy related capital spending budgets are not only rising in the U.S. (primarily in shale oil), but also globally. The global rig count is breaking out, and declining OECD oil stocks suggest that drilling activity will remain robust (second and third panels). Relative share price momentum does not yet fully reflect the rebound in industry investment (using national accounts) that remains in a V-shaped recovery since the Q1/2016 oil market trough (bottom panel). In sum, there are more gains in store for the S&P energy services index. Firming industry demand at a time when global energy capital spending budgets are renormalizing, along with rising crude oil prices, signal that high-beta energy services equities have more running room. Bottom Line: Stay overweight the S&P energy service index and see our Weekly Report for more details. The ticker symbols for the stocks in this index are: BLBG: S5ENRE: NOV, SLB, FTI, BHGE, HAL, HP.