Commodities & Energy Sector

Highlights Geopolitical sparks in the Mediterranean point to the revival of realism or realpolitik in places where it has long been dormant. Europe is wary of Russia but will keep buying more of its natural gas. This will be a source of tension with the United States. Turkey is wary of Russia but will continue choosing pragmatic deals with Moscow that fly in the face of Europe and the United States. Turkey’s intervention in Libya is small but symbolic. Increases in foreign policy aggressiveness are negative signs for Turkey as they stem from domestic economic and political instability. Short Turkish currency, equities, and local government bonds. The recent increase in immigration into Europe will fuel another bout of populism if it goes unchecked. Feature “Multipolarity,” or competition among multiple powerful nations, is our overarching geopolitical theme at BCA Research. The collapse of the Soviet Union did not lead to the United States establishing a global empire, which might in theory have provided a stable and predictable trade and investment regime. The United States lashed out when attacked but otherwise became consumed by internal struggles: financial crisis and political polarization. Under two administrations the American public has demanded a reduced commitment to international affairs. Europe is even less likely to project power abroad – particularly after being thrown on the defensive by the Syrian and Libyan revolutions and ineffectual EU responses. Turkey’s aggressive foreign policy is a symptom of global multipolarity – which makes the world less predictable for investors. Emerging markets have risen in economic and military power relative to their developed counterparts. They demand a redistribution of global political power to set aright historical grievances and address immediate concerns, such as supply line insecurities, which increase alongside a rapidly growing economy. Multipolarity is apparent in Russia’s resurgence: pushing back on its borders with Europe and NATO, seeking a greater role in the Middle East and North Africa, interfering in US politics, and cementing its partnership with China. Multipolarity is equally evident when medium-sized powers – especially those that used to take orders from the US and Europe – seek to establish an independent foreign policy and throw off the shackles of the past. Turkey is just such a middle power. Strongman President Recep Tayyip Erdogan initially sought to lead Turkey into a new era of regional ascendancy. The Great Recession and Arab Spring intervened. Domestic economic vulnerabilities and regional instability have driven him to pursue increasingly populist and unorthodox policies that threaten the credit of the nation and security of the currency. A coup attempt in 2016 and domestic political losses in 2019 drove Erdogan further down this path, which includes aggressive foreign policy as well as domestic economic stimulus. The Anatolian peninsula has always stood at the crossroads of Europe and Asia, as well as Russia and Africa. Turkey’s efforts to change the regional status quo to its favor, increase leverage over its neighbors in Europe and the Middle East, and deal with Russia’s Vladimir Putin from a position of strength, are causing the geopolitics of the Mediterranean to heat up. It has now intervened in the Libyan civil war. In this special report, we focus on this trend and ask what it means for global investors. Unfinished Business In Libya Chart 1Haftar Is Weaponizing Libya’s Oil
The Geopolitics Of The Mediterranean
The Geopolitics Of The Mediterranean
As the Libyan conflict enters its sixth year this spring, the battle for control of the western bastion of Tripoli rages. Multiple efforts to mediate the conflict between Field Marshal Khalifa Haftar of the Libyan National Army (LNA) and Prime Minister Fayez al-Sarraj of the UN-recognized Government of National Accord (GNA) have failed. Ceasefire talks in Moscow, Rome, and Berlin have fizzled. Instead, fighting has finally hit oil production, with the state-run National Oil Corp (NOC) declaring force majeure on supplies on January 18. Tribal leaders who support Haftar have blockaded eastern ports (Chart 1). Previously the mutual dependence of the rival factions on oil revenues ensured production and exports went mostly undisturbed. LNA forces control nearly all key oil pipelines, fields, ports, and terminals in Libya. The exceptions are the Zawiyya and Mellitah terminals and offshore fields (Map 1). However the National Oil Company (NOC), headquartered in the GNA-controlled Tripoli, is the sole entity controlling operations and the sole marketer of Libyan oil. Map 1Libya’s Oil And Natural Gas Infrastructure: Monopolized By Haftar
The Geopolitics Of The Mediterranean
The Geopolitics Of The Mediterranean
General Haftar’s blockade – which has ground oil production to a halt – displays his ability to weaponize oil to obtain concessions from the Tripoli-based government. Tribal leaders behind the blockade are calling for a larger share of oil revenues, for which they are at the mercy of the LNA and NOC. With little progress in Haftar’s push to gain control of Tripoli, and Libya more generally, the conflict has reached a stalemate. Not one to back down, Haftar’s decision to cut off oil sales from the Tripoli government, which also cuts off revenues to his own parallel administration, is a brute attempt to force a settlement. Haftar’s gambit follows Turkey’s decision to intervene in Libya on behalf of Sarraj and the GNA. Turkey has deployed roughly 2,000 Syrian fighters, as well as 35 Turkish soldiers in an advisory capacity. Turkey apparently feared that Haftar, who has substantial backing from Egypt and the Gulf Arabs as well as Russia and France, was about to triumph, or at least force a settlement detrimental to Turkish interests. Bottom Line: Turkey’s decision to intervene in the Libyan civil war – while limited in magnitude thus far – raises the stakes of the conflict, which involves the EU, Russia, and the Arab states. It is a clear signal of the geopolitical multipolarity in the region – and a political risk that is flying under the radar amid higher profile risks in other parts of the world. Political Interests: Islamist Democracy Versus Arab Dictatorship The Libyan civil war is a proxy war between foreign nations motivated by conflicting economic and strategic interests in North Africa and the Mediterranean. But there is an ideological and political structure to the conflict that explains the alignment of the nations: Turkey is exporting democracy while the Arab states try to preserve their dictatorships. Haftar’s primary supporters include Egypt, the United Arab Emirates (UAE), and Saudi Arabia. These states see monarchy as the way to maintain stability in a region constantly on the edge of chaos. Islamist democracy movements, such as Egypt’s Muslim Brotherhood, pose a threat to their long-term authority and security. They try to suppress these movements and contain regimes that promote them or their militant allies. They are willing to achieve one-man rule by force and thus support military strongmen like Egypt’s Abdel Fattah el-Sisi and Libya’s General Haftar. On the other side of the conflict stand the backers of the GNA – Turkey and Qatar – which support political Islam and party politics (Chart 2). Turkey’s Erdogan and his Justice and Development Party (AKP) are sympathetic to Hamas in the Palestinian territories and Egypt’s Muslim Brotherhood. They want to ensure a lasting role for Islamic parties in the region, which strengthens their legitimacy. They do not want Libya’s Islamists to suffer the same fate as their affiliates in the Muslim Brotherhood – removal via a military coup. Chart 2Turkey Sees A Place For Political Islam
Turkey Sees A Place For Political Islam
Turkey Sees A Place For Political Islam
Chart 3Turkey Steps In Amid Qatar Embargo
The Geopolitics Of The Mediterranean
The Geopolitics Of The Mediterranean
The political conflict is mirrored in the Persian Gulf in the form of the air, land, and sea embargo imposed on Qatar in 2017 at the hands of the Saudis, Egyptians, and Emiratis. The Qatar crisis followed a 2014 diplomatic rift and the 2011 Arab Spring, when Qatar supported protesters and democracy movements against neighboring regimes. The embargo strengthened Turkey-Qatar relations, as Turkey stepped in to ensure that Qataris – who are heavily dependent on imports – would continue to receive essentials (Chart 3). Bottom Line: The alliances forged in the Libyan conflict reflect differing responses to powerful forces of change in the region. Established monarchies and dictatorships are struggling to maintain control of large youth populations and rapidly modernizing economies. Their response is to fortify the existing regime, suppress dissent, and launch gradual reforms through the central government. Their fear of Islamist movements makes them suspicious of Tripoli and the various Islamist groups allied with the GNA, and aligns them with Khalifa Haftar’s attempt to impose a new secular dictatorship in Libya. Meanwhile Turkey, with an active Islamist democracy, is seeking to export its political model, and Muslim Brotherhood-esque political participation, to gain influence across the region, including in Libya and North Africa. Economic Interests: The Scramble For Energy Sources Chart 4Europe Addicted To Russian Gas
The Geopolitics Of The Mediterranean
The Geopolitics Of The Mediterranean
The Libyan proxy war is also about natural resources, for all the powers involved. Turkey’s intervention reflects its supply insecurity and desire to carve a larger role for itself in the east Mediterranean economy. Turkey needs to secure cheap energy supplies, and also wants to make itself central to any emerging east Mediterranean natural gas hub that aims to serve Europe. Europe’s increasing dependency on natural gas imports to meet its energy demand, and Russia’s outsized role – supplying the EU with 40% of its needs – have encouraged a search for alternative suppliers (Chart 4). Israel is attempting to fill that role with resources discovered offshore in the eastern Mediterranean. Given its strategic location, Turkey hopes to become an energy hub. First, it is cooperating with the Russians. Presidents Putin and Erdogan inaugurated the Turkish Stream pipeline (TurkStream) at a ceremony in Istanbul on January 8. The pipeline will transport 15.75 billion cubic meters (Bcm) of Russian natural gas to Europe via Turkey. This is part of Russia’s attempt, along with the Nord Stream 2 pipeline, to bypass Ukraine and increase export capacity, strengthening its dominance over Europe’s natural gas market (Map 2). Map 2Russia’s Latest Pipelines Bypass Ukraine
The Geopolitics Of The Mediterranean
The Geopolitics Of The Mediterranean
Europe and its allies are wary of Russian influence, but the EU is not really willing to halt business with Russia, which is a low-cost and long-term provider free from the turmoil of the Middle East. Despite the significant growth in US natural gas supplies, the relatively higher cost makes Russian supplies comparatively more attractive (Chart 5). Chart 5Russian Gas Is Competitive In European Markets …
The Geopolitics Of The Mediterranean
The Geopolitics Of The Mediterranean
Chart 6… As US Attempts To Gain Market Share
The Geopolitics Of The Mediterranean
The Geopolitics Of The Mediterranean
The result will be tensions with the United States, which expects the Europeans to honor the security relationship by buying American LNG (Chart 6) and will always abhor anything resembling a Russo-European alliance. American legislation signed on December 20 would impose sanctions on firms that lay pipes for Nord Stream 2 and TurkStream. Second, Turkey wants to become central to eastern Mediterranean energy development. A series of offshore discoveries in recent decades has sparked talk of cooperation among potential suppliers (Table 1). There is a huge constraint on developing the fields quickly, as there is no export route currently available for the volumes that will be produced. While the reserves are not significant on a global scale, their location so close to Europe, and growing needs in the Middle East, has generated some interest. Table 1Recent East Mediterranean Discoveries Are Relatively Small, But Geopolitically Attractive
The Geopolitics Of The Mediterranean
The Geopolitics Of The Mediterranean
However, Europe and Israel – the status quo powers – threaten to marginalize Turkey in this process: A meeting of the energy ministers of Egypt, Cyprus, Greece, Israel, Italy, the Palestinian territories, and Jordan in Cairo last July resulted in the creation of the Eastern Mediterranean Gas Forum to promote regional energy cooperation. Turkey – along with Lebanon and Syria – was excluded. Turkey seeks access to natural resources – and to prevent Israel, Egypt, and Europe from excluding it. The EastMed Pipeline deal – signed by Greece, Cyprus, and Israel on January 2 – envisages a nearly 2,000 km subsea pipeline transporting gas from Israeli and Cypriot offshore fields to Cyprus, Crete and Greece, supplying Europe with 9-12 Bcm per year (Map 3). The project enjoys the support of the European Commission and the US as an attempt to diversify Europe’s gas supplies and boost its energy security.1 But it would also be an alternative to an overland pipeline on Turkish territory. Map 3The Proposed EastMed Pipeline Would Marginalize Turkey
The Geopolitics Of The Mediterranean
The Geopolitics Of The Mediterranean
Egypt has two underutilized liquefied natural gas plants – in Idku and Damietta – and has benefited from the 2015 discovery of the Zohr gas field. Egypt has recently become a net exporter of natural gas (Chart 7). It signed a deal with Israel to purchase 85.3 Bcm – $19.5 billion – of gas from Leviathan and Tamar fields over 15 years. Egypt sees itself as an energy hub if it can re-export Israeli supplies economically. Note that Russia and Turkey have some overlapping interests here. Russia does not want Europe to diversify, while Turkey does not want to allow alternatives to Russia that exclude Turkey. Thus maintaining the current trajectory of natural gas projects is not only useful for Russia’s economy (Chart 8) but also for Turkey’s strategic ambitions. Chart 7Egypt Also Aims To Become East Mediterranean Gas Hub
The Geopolitics Of The Mediterranean
The Geopolitics Of The Mediterranean
Of course, while Russian pipes are actually getting built, the EastMed pipeline is not – for economic as well as geopolitical reasons. Europe is currently well supplied and energy prices are low. At an estimated $7 billion, the cost of constructing the EastMed pipeline is exorbitant. Chart 8Maintaining Energy Dominance Advances Russia’s Strategic Ambitions Too
The Geopolitics Of The Mediterranean
The Geopolitics Of The Mediterranean
Still, Turkey must make its influence known now, as energy development and pipelines are necessarily long-term projects. The chaos in Libya presents an opportunity. Seizing on the Libyan GNA’s weakness, Turkey signed an agreement to provide for offshore maritime boundaries and energy cooperation as well as military aid. The EastMed pipeline, of course, would need to cross through Turkish and Libyan economic zones (see Map 3 above).2 Turkey is incapable of asserting its will militarily in the Mediterranean against powerful western naval forces. But short of war, it is capable of expanding its claims and leverage over regional energy and forcing the Israelis and Europeans to deal with it pragmatically and realistically rather than exclude it from their plans. Part of Turkey’s goal is to cement an alliance with Libya – at least a partitioned western Libyan government in any ceasefire brokered with Haftar and the Russians. Bottom Line: While Turkey and Russia support opposing sides in the Libyan conflict, both benefit from dealing directly with each other – bypassing the western powers, which are frustrated and ineffectual in Libya. Both would gain some direct energy leverage over Europe and both would gain some influence over any future eastern Mediterranean routes to Europe. In Libya, if either side triumphs and unites the country, it will grant its allies oil and gas contracts almost exclusively. But if the different foreign actors can build up leverage on opposing sides, they can hope to secure at least some of their interests in a final settlement. Turkey Needs Foreign Distractions The foregoing would imply that Turkey is playing the game well, except that its foreign adventures are in great part driven by domestic economic and political instability. After all, Turkey’s maritime claims are useless if they cannot be enforced, and offshore development and pipeline-building are at a low level given weak energy prices and slowing global demand. Economically, in true populist fashion, Erdogan has repeatedly employed money creation and fiscal spending to juice nominal GDP growth. The result is a wage-price spiral, currency depreciation, and current account deficits that exacerbate the problem. The poor economy has mobilized political opposition. Over the past year, for the first time since Erdogan rose to power in 2002, his Justice and Development Party is fracturing. Former Turkish deputy prime minister Ali Babacan, a founding member of the AKP, as well as former prime minister Ahmet Davutoglu, have both announced breakaway political parties that threaten to erode support for the AKP. Local elections in 2019 resulted in a popular rebuke in Istanbul. Thus Erdogan is distracting the public with hawkish or nationalist stances abroad that are popular at home. Turkey has taken a strident stance against the US and Europe, symbolized by its threats to loose Syrian refugees into Europe and its purchase of S400 missile defense from Russia despite being a NATO member. Military incursions in Syria aim to relocate refugees back to Syria (Chart 9). Chart 9Erdogan Is Distracting Turks With Popular Foreign Stances
The Geopolitics Of The Mediterranean
The Geopolitics Of The Mediterranean
Chart 10No Love Lost Toward The West
The Geopolitics Of The Mediterranean
The Geopolitics Of The Mediterranean
Turkish public opinion encourages close cooperation with Russia and a more aggressive stance against the West (Chart 10). This is a basis for Russia and Turkey to continue cutting transactional deals despite falling on opposite sides of conflicts in Syria, Libya, Iran, and elsewhere. Erdogan’s pretensions of reviving Ottoman grandeur in the Mediterranean fall in this context. Elections are not until 2023, but we expect Erdogan to continue using foreign policy as a distraction. The opposition is trying to unite behind a single candidate, which could jeopardize Erdogan’s grip on power. The insistence on stimulus at all costs means that Erdogan is not allowing the economic reckoning to occur now, three years before the election. He is trying to delay it indefinitely, which may fail. Libya may not get resolved, however. Allies of Haftar’s LNA – specifically Egypt, Saudi Arabia, and the UAE – will be motivated to intensify their support of him for fear that a loss would revive domestic interest in political Islam. Egypt especially fears militant proxies being unleashed from any base of operations there. The LNA currently serves as a buffer between Egypt and the militant actors in Libya. If Haftar is defeated, Egypt’s porous western border would provoke a harsh reaction from Cairo. The threat of a revival of Islamic State in Libya has united the Egyptian people – a critical variable in the administration’s vision of a stable country. That has provided Egypt’s Sisi an excuse to flex his muscles through military exercises. Neither Russia nor NATO will be moved to bring a decisive finish to the conflict, as neither wishes to invest too heavily in it. Bottom Line: Erdogan has doubled down on populism at home and abroad. His assertive foreign policy in Syria and now Libya may end up exacerbating economic and political pressures on the ruling party. What Is The Endgame In Libya? There are three possible scenarios to end the current stalemate between the Haftar’s forces and the internationally recognized GNA: Military: An outright military victory by either Haftar or Sarraj is highly unlikely. While Haftar’s forces enjoy military and financial support from the UAE, he lacks popular support in Tripoli – which has proved to be challenging to takeover. Similarly, Sarraj’s army is not strong enough to confront the eastern forces and reunify the country. The merely limited involvement of foreign actors – including Turkey – makes a military solution all the more elusive. The most likely path to a quick military victory comes if foreign actors disengage. This will only occur if they are punished for their involvement, and thus it requires a major neutral power, perhaps the United States, to change the calculus of countries involved. But the US is eschewing involvement and the Europeans have shown no appetite for a heavy commitment. Diplomatic: A negotiated settlement is eventually likely, given the loss of oil revenues. A ceasefire would assign some autonomy to each side of the country. Given Haftar’s ambitions of conquering the capital and becoming a strongman for the country as a whole, the diplomatic route will be challenging unless his Gulf backers grow tired of subsidizing him. Financial: Haftar could win by breaking the NOC’s monopoly on oil. In the past, the LNA failed at selling the oil extracted from infrastructure under its control. If Haftar manages to market the oil without the aid of the NOC then he will be able to guarantee a stream of revenue for his forces and at the same time starve the Tripoli government of financing. This would pose an existential risk for the GNA. The key challenge in this scenario is to obtain international backing for LNA sales of Libyan crude supplies. Libya’s partition into two de facto states is the likeliest outcome. Bottom Line: Unless one of the constraints on a military, diplomatic, or financial end to the conflict is broken, the current stalemate in the Libyan conflict will endure. A partition of Libya will be the practical consequence. Turkey hopes to boost its regional influence through Tripoli, and thus increase its leverage over Europe, but a heavy investment could result in fiscal losses or spiral into a broader regional confrontation. Investment Implications While it is not clear how long the current blockade on Libyan ports will last – or the associated over 1 million barrels per day loss of production – oil supplies will remain at risk so long as the conflict endures. However, unlike supplies in the Gulf or in Venezuela, Libyan crude is of the light sweet grade. There is enough global spare capacity – from US shales – to make up for the Libyan loss, at least over the short term. The fall in Libyan supplies is occurring against the backdrop of oil markets that have been beaten down by the decline in demand on the back of the coronavirus impact (Chart 11). The OPEC 2.0 technical panel recommended additional output cuts of 600 thousand barrels per day last week, and is waiting on a final decision by Russia. We expect the cartel to tighten supplies to shore up prices. The instability in Libya could also affect Europe through immigration. The conflict re-routes migrants through the western route and thus could result in an increased flow to Spain and Portugal, rather than Italy which was previously their landing pad (Chart 12). A meaningful pick up would have a negative impact on European domestic political stability, especially with Germany in the midst of a succession crisis and incapable of taking a lead role. Chart 11Libyan Blockade Comes Amid Demand Shock
Libyan Blockade Comes Amid Demand Shock
Libyan Blockade Comes Amid Demand Shock
Chart 12Refugees Will Favor Western Route Across The Mediterranean
Refugees Will Favor Western Route Across The Mediterranean
Refugees Will Favor Western Route Across The Mediterranean
Erdogan’s foreign adventurism, and aggression against the West, poses a risk for Turkish markets. We remain underweight Turkish currency and risk assets. Our Emerging Markets strategists expect foreign capital outflows from EM to weigh on Turkey’s currency, local fixed-income and sovereign credit relative to EM benchmarks. Go short the Turkish lira relative to the US dollar. Bottom Line: Historically, the Mediterranean was the world’s most important waterway. It was the “life line” of the British empire. The US succeeded the British as the guarantor of Suez and corralled both Turkey and Greece into a single alliance under the Truman Doctrine. This status quo held until the twenty-first century. Since 2000, Russia has revived, US foreign policy in the Middle East has become erratic, and the Europeans have lost clout. Turkey is seeking to carve a space for itself and challenge the settlements of the past, all the way back to the 1923 Treaty of Lausanne. Yet in the wake of the Great Recession its economy is unstable and its populist leaders are taking greater risks abroad. The result will be greater friction with Europe, or the Arab states, or both. Given Turkey’s mismanagement at home, and limited gains to be made in Syria or Libya, Turkish assets will be the first to suffer from negative surprises. Roukaya Ibrahim Editor/Strategist Geopolitical Strategy RoukayaI@bcaresearch.com Matt Gertken Vice President Geopolitical Strategist mattg@bcaresearch.com Footnotes 1 The Eastern Mediterranean Security and Energy Partnership Act of 2019 is an American bi-partisan bill the lends full support for the East Med pipelines and greater security cooperation with Israel, Cyprus, and Greece. The US Senate also passed an amendment to the National Defense Authorization Act last June which ended the arms embargo on Cyprus. 2 Turkey has also been engaging in drilling activities in disputed waters near Cyprus – which Ankara argues it is undertaking in order to protect Turkish-Cypriot claims – motivating EU economic sanctions in the form of travel bans and asset freezes on two Turkish nationals.
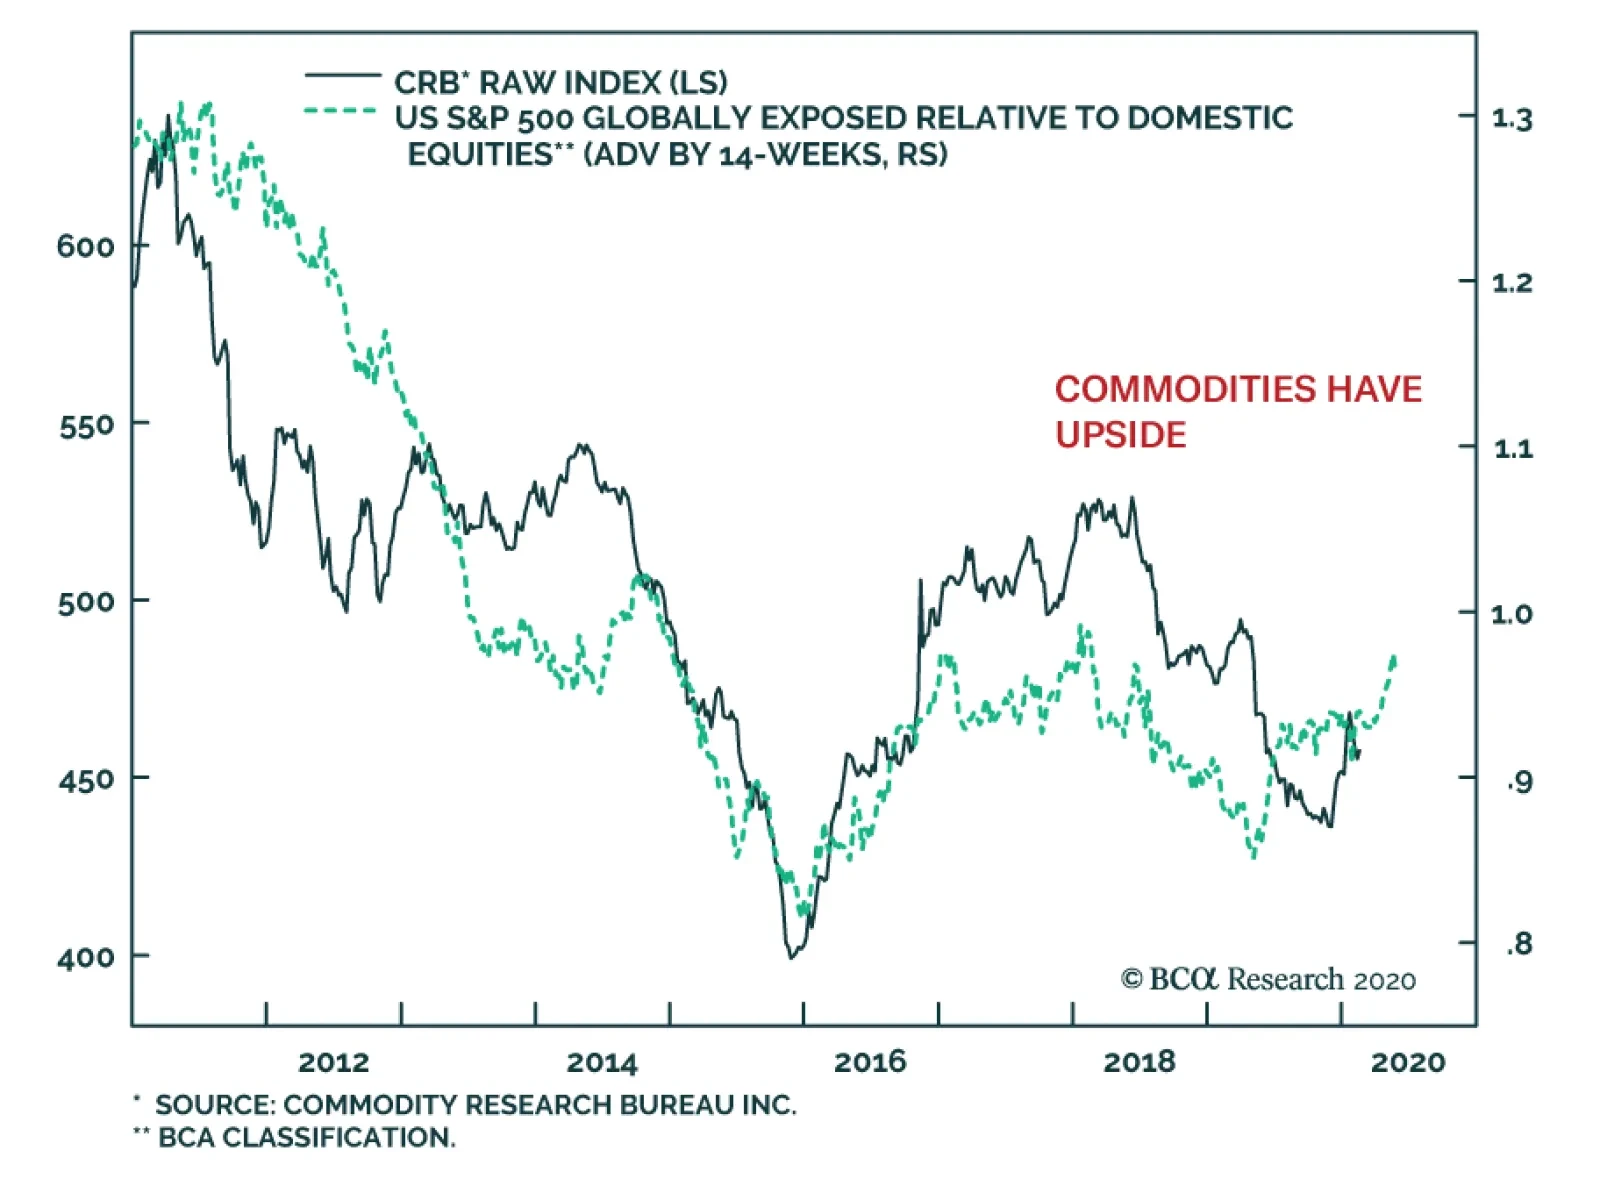
The spread of COVID-19 abruptly halted the embryonic recovery in commodity prices that began in December. However, this down leg in natural resource prices has created an attractive buying opportunity. Despite a strong dollar and the recent fear created by…
Highlights Bulk commodity markets – chiefly iron ore and steel – could see sharp rallies once Chinese authorities give the all-clear on COVID-19 (the WHO’s official name for the coronavirus). These markets rallied sharply Tuesday, as President Xi vowed China would achieve its growth targets this year, which, all else equal, likely will require additional monetary and fiscal stimulus. China accounts for ~ 70% of the global trade in iron ore, and ~ 50% of global steel supply and demand. COVID-19-induced losses have hit Chinese demand for steel hard, forcing blast furnaces to sharply reduce output. However, this partly is being countered by transitory weather- and COVID-19-related disruptions that are reducing iron ore exports from Brazil and delaying Australian shipments. Iron ore inventories could be drawn hard in 2Q and 2H20 to meet demand as steelmakers rebuild stocks and construction and infrastructure projects restart (Chart of the Week). The Chinese Communist Party celebrates its 100th anniversary next year. To offset the COVID-19-induced drag on domestic growth this year, which could take GDP growth below 5%, and a weak GDP performance next year additional stimulus is an all-but-foregone conclusion. Feature When policymakers really want to jumpstart GDP growth, their playbook typically turns to the real economy via policies that encourage construction, infrastructure development and manufacturing. There is a compelling case a strong rally in iron ore and steel will accompany the containment of COVID-19, reversing the 14% and 4% declines in both since the start of the year (Chart 2). Chief among the drivers of the rally will be the increase in fiscal and monetary stimulus required to restore Chinese GDP growth disrupted by the COVID-19 outbreak, which could reduce annual growth closer to 5% than the ~ 6% rate policymakers were targeting. Chart of the WeekLow Iron Ore Stocks Setting Up A Rally
Low Iron Ore Stocks Setting Up A Rally
Low Iron Ore Stocks Setting Up A Rally
Chart 2Policy Stimulus Will Reverse Declines In Iron Ore And Steel Prices
Policy Stimulus Will Reverse Declines In Iron Ore And Steel Prices
Policy Stimulus Will Reverse Declines In Iron Ore And Steel Prices
There are a number of reasons for expecting this. 2020 marks the terminus of the decade-long policy evolution that was supposed to end with the realization of the “Chinese Dream.” Chief among the goals that were to be realized by the end of this year – which will usher in the 100th anniversary of the founding of the Chinese Communist Party in 2021 – are a doubling of per capita income and of GDP.1 The Communist Party in China has numerous policy levers it can pull to respond to worse-than-expected growth and economic shocks. These policies consume a lot of bulk commodities and base metals. When policymakers really want to jump-start GDP growth, their playbook typically turns to the real economy via policies that encourage construction, infrastructure development and manufacturing. This was clearly seen following the Global Financial Crisis (GFC) in 2008-09 (Chart 3). Even before the COVID-19 outbreak, policymakers made it clear they wanted to stabilize growth following the Sino-US trade war at the conclusion of the Central Economic Work Conference (CEWC) in December. Nominal wages and per capita income growth had been falling since 3Q18, imperilling one of the principal goals of the “Chinese Dream.” Chart 3Policy Stimulus Will Lift GDP And Iron Ore And Steel Prices
Policy Stimulus Will Lift GDP And Iron Ore And Steel Prices
Policy Stimulus Will Lift GDP And Iron Ore And Steel Prices
Policymakers will aim for annualized quarterly growth of ~ 6.5% in 2Q- 4Q20 if their goal is simply to achieve 6% p.a. growth this year. Following that CEWC meeting, our colleagues at BCA’s China Investment Strategy (CIS) anticipated policymakers would announce growth targets at the National People’s Congress (NPC) meeting next month in the range of 5.8 and 6.2% p.a. growth, noting, “the Chinese economy needs to increase by 6% in 2020 to double its size from the 2010 level in real terms.”2 The growth rate required to put the economy on track to deliver on the “Chinese Dream” is now much higher following the COVID-19 outbreak, which could shave ~1% or more off China’s growth this year alone. This suggests policymakers will aim for annualized quarterly growth of ~ 6.5% in 2Q-4Q20 if their goal is simply to achieve 6% p.a. growth this year. This predisposes us to expect significant monetary and fiscal stimulus this year after the all-clear is sounded and the economy can return to its day-to-day activities. In addition – and by no means least of the concerns driving policymakers’ decisions – the 100th anniversary of the founding of the CCP will be celebrated next year, something policymakers at all levels have been looking forward to showcase the success of their revolution. A Boon For Bulks As monetary policy eases, the construction growth trajectory should pick up smartly. China accounts for ~ 70% of the global trade in iron ore. It is expected to import ~ 1.1 billion MT this year and next, based on estimates published by the Australian government’s Department of Industry, Innovation and Science in its December 2019 quarterly assessment (Chart 4). China will account for ~ 50% of global steel supply and demand, or roughly 900mm MT/yr in 2020 and 2021. The COVID-19 outbreak reduced utilization rates at the close to 250 steel mills monitored by Mysteel Global in China to 78%, a drop of 2.3pp.3 Platts estimates refined steel production could fall by 43mm MT by the end of February.4 Most of China’s steel output goes into commercial and residential construction (~ 35%), infrastructure (~20%), machinery (~ 20%), and automobile production (~ 7%), based on S&P Global Platts estimates.5 Residential construction began to recover last year, and residential housing inventories were declining relative to sales (Chart 5). In our view, once the COVID-19 infection rate falls outside Hubei Province – the epicenter of the outbreak – markets will begin pricing in a revival of commercial and residential construction in China. As monetary policy eases, the construction growth trajectory should pick up smartly (Chart 6). Chart 4China Dominates Iron Ore, Steel Markets
Iron Ore, Steel Poised For Rally
Iron Ore, Steel Poised For Rally
Chart 5Resumption Of Construction Will Lift Demand For Bulks
Resumption Of Construction Will Lift Demand For Bulks
Resumption Of Construction Will Lift Demand For Bulks
Chart 6Easier Money And Credit Policy Will Revive Construction
Easier Money And Credit Policy Will Revive Construction
Easier Money And Credit Policy Will Revive Construction
Infrastructure spending already was on track to increase prior to the COVID-19 outbreak, based on our CIS colleagues’ reading of the CEWC statement issued in December, which “suggests fiscal support to the economy will mainly focus on infrastructure, and listed transportation, urban and rural development, and the 5G networks to be the government’s main investment projects next year.”6 This fiscal push will be supported by additional spending at the local government level, and by the issuance of special-purpose bonds by these governments with proceeds earmarked for infrastructure development (Chart 7). “A bigger fiscal push by the central government, coupled with a frontloading of 2020 local government special-purpose bond issuance, will likely boost infrastructure spending to around 10% in the first two quarters, doubling the growth in the first eleven months of 2019,” according to our CIS colleagues. Chart 7Pump Priming Will Boost Infrastructure Spending
Pump Priming Will Boost Infrastructure Spending
Pump Priming Will Boost Infrastructure Spending
Bottom Line: Infrastructure fixed asset investment will be supported by easier credit and fiscal policy in China. Whether it rises at double-digit growth rates remains to be seen, however. Expect Chinese Consumers To Come Out Spending Infrastructure fixed asset investment will be supported by easier credit and fiscal policy in China. Prior to the outbreak of COVID-19, consumer confidence was running high (Chart 8), and employment prospects have bottomed and turned higher, although they still indicate contraction. (Chart 9). This boded well for consumer-spending expectations, particularly for autos (Chart 10). Chart 8Consumer Confidence Was High Prior to COVID-19 Outbreak ...
Consumer Confidence Was High Prior to COVID-19 Outbreak ...
Consumer Confidence Was High Prior to COVID-19 Outbreak ...
Chart 9... And Job Prospects Were Improving ...
... And Job Prospects Were Improving ...
... And Job Prospects Were Improving ...
At ~ 7%, China’s automobile production remains a marginal contributor to overall steel consumption. Nonetheless, a meaningful pickup in automobile production following the depressed growth rate of the past 15 months would move steel demand upward. China’s share of world auto sales is ~30% (Chart 11). Chart 10... Thus Lifting Prospects For Chinese Auto Sales
... Thus Lifting Prospects For Chinese Auto Sales
... Thus Lifting Prospects For Chinese Auto Sales
Chart 11Policy Stimulus Will Revive Chinese Auto Sector
Policy Stimulus Will Revive Chinese Auto Sector
Policy Stimulus Will Revive Chinese Auto Sector
Accommodative monetary and fiscal policies in China point toward higher growth for the auto sector. However, it is important to note the revival in auto production needs to be driven by consumer demand – if it is led simply by restocking, the rebound will not be sustainable. The recovery we are expecting will support steel and metal consumption at the margin, but the outlook for infrastructure and construction remains key due to their higher weight in total steel consumption. Bottom Line: Auto consumption and production were recovering in late 2019; however, the strength of the recovery did not match previous stimulus programs (2009 and 2016). The recovery we are expecting this year will support steel and metal consumption at the margin, but the outlook for infrastructure and construction remains key due to their higher weight in total steel consumption. If these other sectors remain constructive for metal demand (or at least are not contracting or slowing drastically), the boost from the auto sector will meaningfully contribute to higher iron ore and steel prices. Robert P. Ryan Chief Commodity & Energy Strategist rryan@bcaresearch.com Hugo Bélanger Associate Editor Commodity & Energy Strategy HugoB@bcaresearch.com Commodities Round-Up Energy: Overweight Oil prices halted their decline and rose 1% on Tuesday as the number of daily confirmed cases of the Wuhan coronavirus decelerated in China. As of Tuesday, the daily growth in cases dropped to 5%, down from 6% the previous day. Investors will closely monitor this number for any sign of a durable slowdown in daily confirmed cases. Separately, the US Energy Information Administration revised down its global demand growth estimates for 2020 to 1.0mm b/d from 1.3mm b/d last month, reflecting the effects of the coronavirus and warmer-than-expected January temperatures in the northern hemisphere. We will be updating our global oil balances next week. Base Metals: Neutral Iron ore prices fell 14% since the COVID-2019 outbreak in January. Investors are assessing how the iron ore market will balance weaker demand expectations in China amid lower supply – largely a result of falling Brazilian ore exports. Brazil’s total iron ore exports fell ~19% y/y in January due to heavy rainfall and lower production at Brazilian miner Vale. The company’s output never fully recovered from the 2019 dam incident and remains a risk to iron ore supply in 1Q20. Vale lowered its March sales guidance by 2mm MT. Low Chinese port inventories raise prices’ vulnerability to supply disruptions (Chart 12). Precious Metals: Neutral Gold remains well bid despite a strong US dollar, fueled by safe-haven demand. The yellow metal’s price fell slightly on Tuesday as investors’ concerns over the coronavirus eased. Based on our fair-value model, prices averaged $55/oz above our estimate in January. Investors – i.e. global ETF holders and net speculative positions reported by the US CFTC – have been important contributors to the latest gold rally. Investors’ total holding of gold reached a record high 113mm oz last week. Nonetheless, we believe there is still opportunity for this group to further support prices: the share of gold allocation vs. world equity-market capitalization is still low at 0.24%, vs. its peak of 0.42% in 2012 (Chart 13). Ags/Softs: Underweight March wheat futures were down 1.8% at Tuesday’s close, settling at the lowest level of the year after the USDA called for ‘stable supplies’ of the grain for the 2019/2020 U.S. marketing year. For corn, ending stocks were unchanged relative to the January projection, while world production was revised slightly upwards. March corn futures finished 2¢ lower at $3.7975/bu. The USDA also estimated higher soybean exports on the back of increased sales to China. However, soybean price gains were limited by higher production and ending stocks abroad. Chart 12Low Iron Ore Inventory Raises Exposure To Supply Disruptions
Low Iron Ore Inventory Raises Exposure To Supply Disruptions
Low Iron Ore Inventory Raises Exposure To Supply Disruptions
Chart 13A Higher Share Of Gold Holdings Could Support Prices Further
A Higher Share Of Gold Holdings Could Support Prices Further
A Higher Share Of Gold Holdings Could Support Prices Further
Footnotes 1 The “Chinese Dream” is a phrase coined by President Xi Jinping, following the 18th Party Congress of the Chinese Communist Party in 2012, when the overarching goal of transforming China into a “moderately well-off society” was memorialized in writing. These goals were crystalized in terms of progress expected in per capita income and GDP, both of which were to be doubled in the decade ending this year. Please see Why 2020 Is a Make-or-Break Year for China published by thediplomat.com February 13, 2015. 2 Please see A Year-End Tactical Upgrade, published by BCA Research’s China Investment Strategy December 18, 2019, for an in-depth analysis of policy guidance coming out of the Economic Work Conference last December. It is available at cis.bcaresearch.com. 3 Please see WEEKLY: China’s blast furnace capacity use drops to 78% published by Mysteel Global February 10, 2020. 4 Please see China steel consumption to plunge by up to 43 mil mt in February due to coronavirus published February 6, 2020, by S&P Global Platts. 5 Please see China Macro & Metals: Steel output falls, but property creates bright spots published by S&P Global Platts December 6, 2019. 6 Please see footnote 2 above. Investment Views and Themes Recommendations Strategic Recommendations Tactical Trades TRADE RECOMMENDATION PERFORMANCE IN 2019 Q4
Iron Ore, Steel Poised For Rally
Iron Ore, Steel Poised For Rally
Commodity Prices and Plays Reference Table Trades Closed in 2020 Summary of Closed Trades
Iron Ore, Steel Poised For Rally
Iron Ore, Steel Poised For Rally
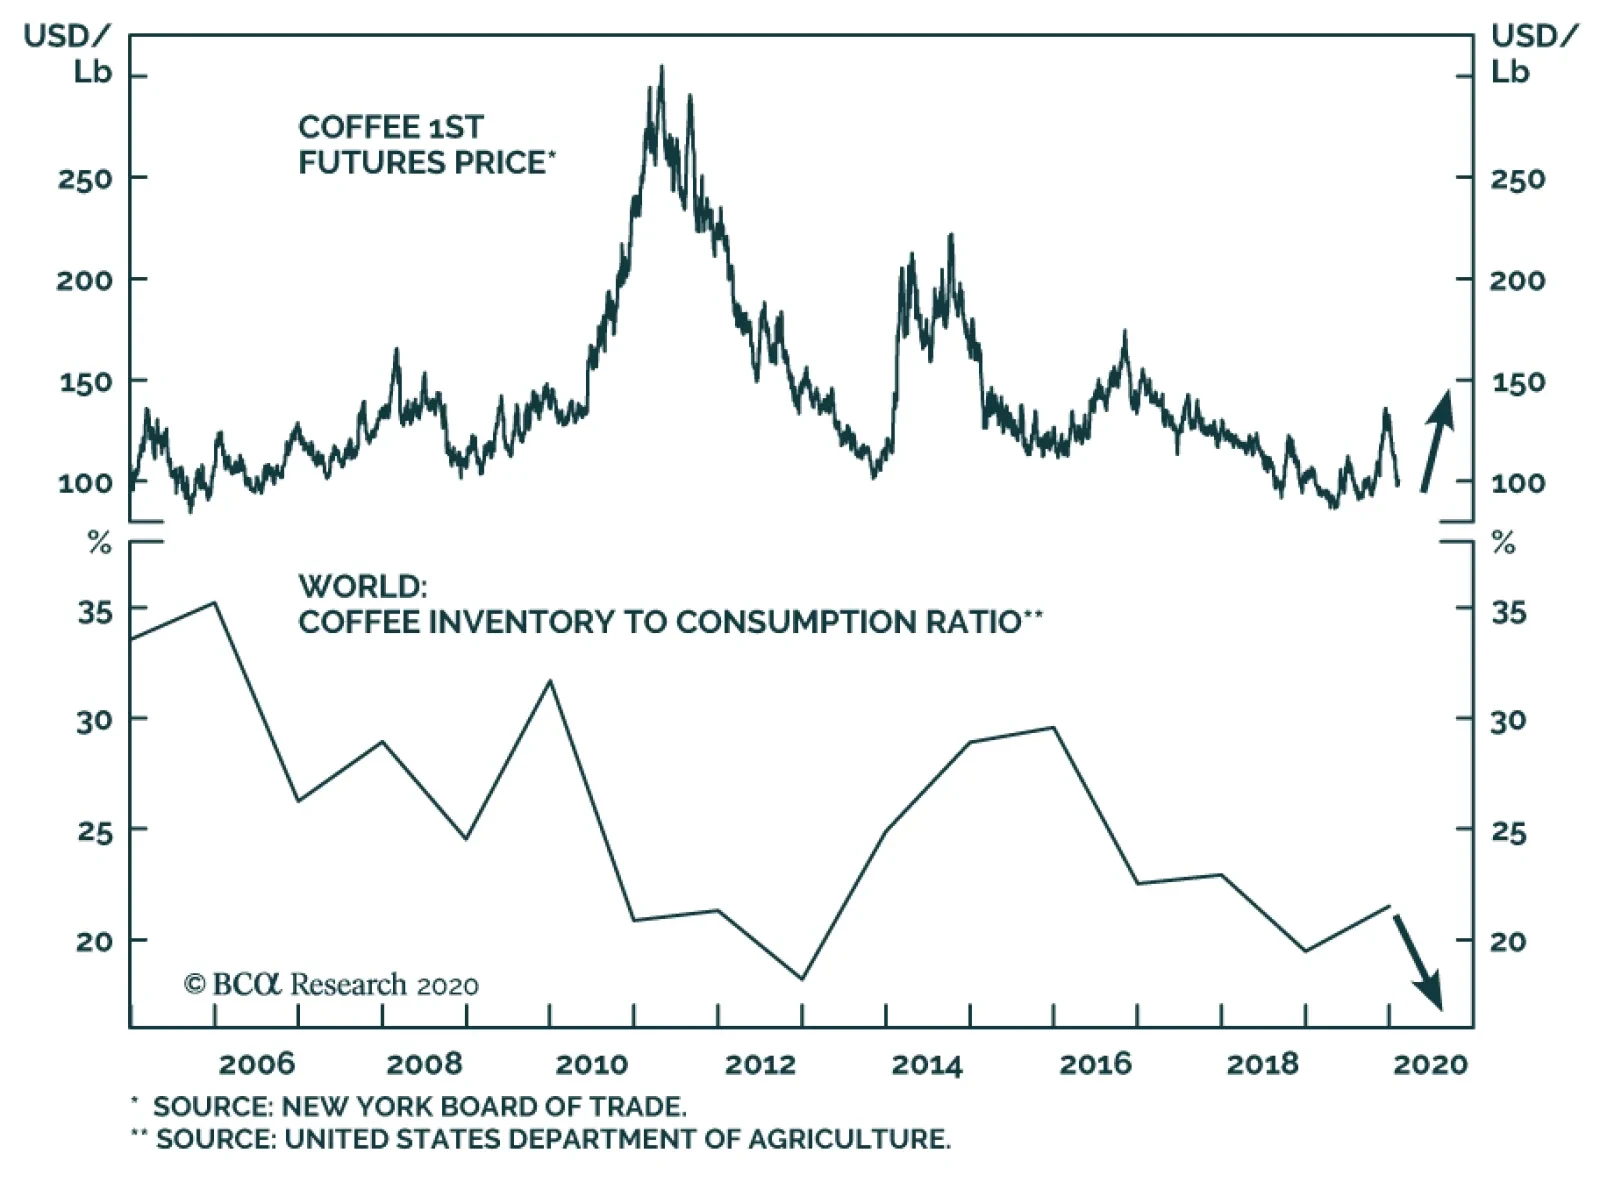
A large risk to coffee supply is emerging, which is making coffee an increasingly attractive buy. According to the United Nations Food and Agriculture Organization, East Africa is suffering from the worst locust infestation in decades. Locusts can consume…
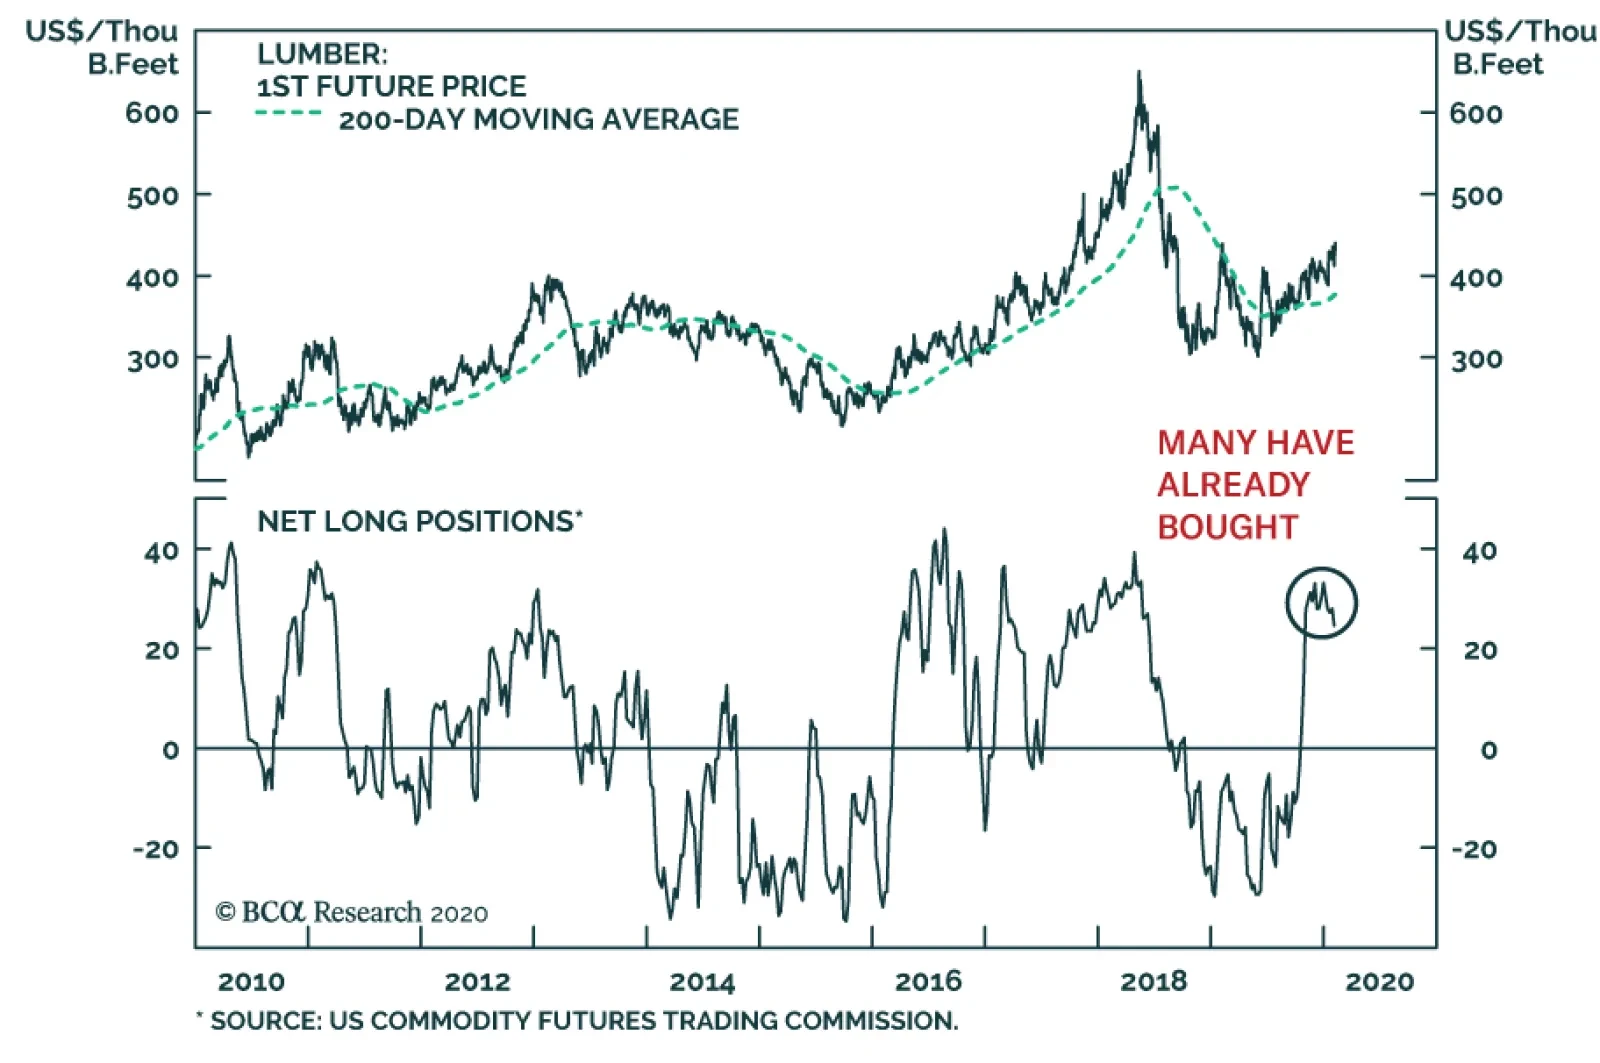
Lumber prices have enjoyed a robust rally since early 2019. A combination of easy US monetary conditions and falling bond yields have created a fertile ground for construction activity, which has forced lumber prices higher. As long as fears…
Highlights Base metals appear to be pricing the impact of the Chinese 2019-nCoV coronavirus in line with the 2003 SARS outbreak. We expect an earlier peak in reported (ex-Hubei) cases than is currently discounted by markets, implying Asian economies – and base metals – will recover sooner than expected, perhaps by end-February. We estimate the marginal impact of 2019-nCoV on global oil demand implied by the recent sell-off translates to a loss of ~ 800k b/d over February-July 2020. This leads us to expect OPEC 2.0’s technical committee will recommend additional cuts of 500k b/d for 2Q-4Q20 to the full coalition, following their meetings in Vienna. This would be bullish, if Asian economies recover as quickly as we expect. Safe-haven assets – chiefly gold and the USD – rallied but do not signal an exodus from risky assets. After breaching $1,580/oz last week, gold traded lower, while the broad trade-weighted USD index rallied 1%, mildly reversing a decline begun at the end of 2019. Risky-asset markets are anticipating monetary accommodation by systemically important central banks will remain in place this year; fiscal stimulus in China and EM economies is likely. This remains supportive of commodity demand. Feature Our view differs from the markets’, which makes us relatively more bullish base metals prices. There is a tight relationship between Asian economic activity and base metals prices, which provides a window on how markets currently expect the 2019-nCoV outbreak will impact aggregate demand in Asia (Chart of the Week). Our view differs from the markets’, which makes us relatively more bullish base metals prices. Chief among the assumptions driving our view is our expectation markets will stage a recovery once the number of 2019-nCoV cases peaks outside the epicenter of the outbreak in Wuhan, a city of 11mm people in Hubei Province, which remains locked down per Chinese containment efforts.1 This is our House view, as well. Alert: The peak in cases ex-Wuhan could come sooner than expected. Our colleagues at BCA’s China Investment Strategy (CIS) note, “New cases outside of the epicenter continue to rise, but a peak may be in sight. Our sense is that financial markets are likely to bottom earlier than the consensus expects. The economic impact on China from the outbreak will be large, but manufacturing activities in the majority of Chinese cities should resume by the end of February.”2 Chart of the WeekBase Metals Prices Lead Changes in Asian Economies
Base Metals Prices Lead Changes in Asian Economies
Base Metals Prices Lead Changes in Asian Economies
This will be important for base metals demand. China accounts for ~ 50% of global supply and demand for refined base metals (Chart 2). These markets are exquisitely attuned to the decisions of Chinese policymakers, so much so that they resemble a vertically integrated system: Policymakers allocate and direct credit to industries and projects – creating a demand signal – and the supply side, which includes numerous state-owned enterprises, responds. What cannot be consumed domestically is exported to neighboring economies. Chart 2China Dominates Base Metals
Metals Pricing To SARS-Type Demand Shock
Metals Pricing To SARS-Type Demand Shock
This largely explains why base metals are so entwined with Chinese economic activity, and with Asian activity generally. Our research indicates base-metals prices lead our Asia Economic Diffusion index, reflecting the information-processing capacity of these markets vis-à-vis the evolution of the regional economies.3 This is one reason we use base-metals markets as information sources in conjunction with our proprietary models and indicators. At present, it appears base metals markets are pricing in a recovery trajectory similar to what was seen during the 2003 SARS episode. Chart 3Markets Price Metals Hit Similar To SARS
Metals Pricing To SARS-Type Demand Shock
Metals Pricing To SARS-Type Demand Shock
At present, it appears base metals markets are pricing in a recovery trajectory similar to what was seen during the 2003 SARS episode (Chart 3), when the LMEX fell 9% from February to April, then fully recovered by year end (Chart 4). Also noteworthy is the fact that most commodity markets were processing this information and reflecting it in their own trajectories, as seen in the path taken by our proprietary Global Commodity Factor (Chart 4, bottom panel). Chart 4Once SARS Infection Peaked, Base Metals Recovered Quickly
Once SARS Infection Peaked, Base Metals Recovered Quickly
Once SARS Infection Peaked, Base Metals Recovered Quickly
The market call from our CIS colleagues implies base metals – summarized by the LMEX – will begin to rally this month as the odds of a peak in 2019-nCoV cases outside Hubei increases. We expect this rally will be aided by increased fiscal stimulus in China (e.g., infrastructure and construction spending), and monetary stimulus (Chart 5), which will renew the lift in manufacturing that appeared toward the end of 2019 (Chart 6).4 Chart 5Higher China Policy Stimulus Expected
Higher China Policy Stimulus Expected
Higher China Policy Stimulus Expected
Chart 6Early 2019-nCoV Peak Would Revive China's Growth
Early 2019-nCoV Peak Would Revive China's Growth
Early 2019-nCoV Peak Would Revive China's Growth
Oil Marches To A Different Drummer Oil markets primarily are pricing to expectations of a deep hit to crude oil demand, driven by 2019-nCoV’s impact on China’s consumption.5 Based on our modeling, we estimate the marginal impact of 2019-nCoV on global oil demand priced into WTI and Brent prices earlier in the week translates to a loss of ~ 800k b/d over February-July 2020. This leads us to expect OPEC 2.0’s technical committee will recommend additional cuts of 500k b/d for 2Q-4Q20, following meetings in Vienna this week. These cuts would be in addition to the 1.7mm b/d cuts agreed by the coalition at its November 2019 meeting, for the January to March 2020 period. OPEC’s (the old cartel) crude oil production in January fell 640k b/d from December levels to 28.35mm b/d, as the additional cuts of 1.7mm b/d agreed in November kicked in, according to Reuters. Additionally, Gulf Cooperation Council (GCC) member states over-complied on their cuts. Output from Libya also is down by ~ 1mm b/d since last month. Importantly, the latest OPEC output levels are ~ 1.3mm b/d below average 2019 production, which Platts estimates at 29.66mm b/d – the lowest output since 2011. We will be updating our balances and price forecasts in two weeks, which will reflect these data more fully. This will allow us to include more information on the demand destruction in China, the evolution of 2019-nCoV, and OPEC 2.0 supply decisions. Additional production cuts by OPEC 2.0 as demand recovers – along with the likely acceleration of the slow-down in US shale-oil production following the recent oil price rout and continued parsimony in capital markets – also would allow backwardation to return to the oil forward curves. Although China’s share of global oil demand amounts to ~ 14% – far less than its share of base metals’ supply and demand – the fact that more than 70% of its 10.2mm b/d of imports comes from OPEC 2.0 is focusing the coalition on the need to restrain supply (Chart 7).6 If, as discussed above, 2019-nCoV cases peak sooner than expected, Asia’s economies likely will recover sooner than expected, which will rally oil prices sooner than expected. Additional production cuts by OPEC 2.0 as demand recovers – along with the likely acceleration of the slow-down in US shale-oil production following the recent oil price rout and continued parsimony in capital markets – also would allow backwardation to return to the oil forward curves (Chart 8). Chart 7China's Share Of Global Oil Demand
China's Share Of Global Oil Demand
China's Share Of Global Oil Demand
Chart 8An Early Peak In 2019-nCoV Cases Would Restore Backwardation To Oil
An Early Peak In 2019-nCoV Cases Would Restore Backwardation To Oil
An Early Peak In 2019-nCoV Cases Would Restore Backwardation To Oil
Based on this assessment, we are getting long 4Q20 WTI vs. Short 4Q21 WTI at tonight’s close, in expectation of a return to backwardation. Bottom Line: Base metals markets could rally sharply if, as we expect, 2019-nCoV cases peak sooner than expected outside the epicenter of Wuhan. This also will lift oil demand in China and Asia. Lastly, it will restore backwardation in the benchmark crude oil curves – Brent and WTI – which is why we are going long 4Q20 WTI vs. short 4Q21 WTI at tonight’s close. Commodities Round-Up Energy: Overweight Uncertainty around the potential impact of the new coronavirus in China pushed WTI prices down to $49.6/bbl as of Tuesday’s close, a 22% drop since the onset of the outbreak. Oil speculators are rapidly exiting the market; non-commercial long WTI positions fell to 564k from 626k on January 7, 2020. On the supply side, OPEC’s oil production dropped to 28.4mm b/d in January, according to Bloomberg, in line with Reuters estimate. This partly reflects the collapse in Libya’s oil production following the closure of its main export terminals by forces loyal to General Khalifa Haftar. Production there was estimated at 204k b/d – the lowest level since the uprising against Muammar Qaddafi in 2011 – vs. an average of 1.1mm b/d in 2019. Base Metals: Neutral China’s net export of steel products declined throughout 2019 amid strong production growth and range-bound inventories. This suggests steel consumption in China remained buoyant, supported by strong new property starts and infrastructure investments (Chart 9). Our commodity-demand indicators suggest most metals’ fundamentals turned constructive in late 2019. However, the coronavirus outbreak will delay the rebound in prices we expected. Over the medium term, we continue to expect prices to pick up, fueled by accommodative monetary policy, and stronger-than-expected monetary and fiscal stimulus in China to offset the negative effect of the 2019-nCoV. Precious Metals: Neutral Fears of wider contagion of the coronavirus are keeping gold above $1,550/oz despite the rise in the US dollar powered by upbeat US manufacturing data. Over the long term, periods of elevated uncertainty are associated with rising households’ precautionary demand for savings as future income becomes increasingly uncertain. This pushes up asset prices as total savings increase, and specifically safer assets, such as gold, until uncertainty abates. This high savings rate acted as a floor to gold prices in the aftermath of the global financial crisis and is currently a crucial contributor to its elevated price (Chart 10). Ags/Softs: Underweight Abating fears of a pandemic spread of the 2019-nCoV lifted CBOT March corn futures to $3.8225/bu on Tuesday, reversing some of the damage done by disappointing export reports from the USDA and favorable crop conditions in South America supporting expectations for a large corn harvest there. Strong sales of soybeans to Egypt and favorable export inspections helped beans reverse last week's negative trend. USD strength on the back of the 2019-nCoV, particularly against the Brazilian real, remains a headwind to bean prices. Chart 9China's Steel Consumption Remained Buoyant In 2019
China's Steel Consumption Remained Buoyant In 2019
China's Steel Consumption Remained Buoyant In 2019
Chart 10Uncertainty Drives Demand For Safe Havens
Uncertainty Drives Demand For Safe Havens
Uncertainty Drives Demand For Safe Havens
Footnotes 1 It is important to note this is a highly speculative call, and that even the public-health experts are groping for understanding on the trajectory of 2019-nCoV at this point. It is possible the virus is not contained and extinguished as SARS was in 2003, but becomes a recurrent feature of the flu season globally. Please see Experts envision two scenarios if the new coronavirus isn’t contained, published by Stat February 4, 2020. Stat is a life sciences and medical news service produced by Boston Globe Media. 2 Please see Recovery, Temporarily Interrupted, published by BCA Research’s China Investment Strategy February 5, 2020. It is available at cis.bcaresearch.com. 3 Our Asia Economic Diffusion index was developed by BCA Research’s Global Investment Strategy team. The “information” we refer to here is the actual buying and selling of base metals, and contracting for services related to the economic activity accompanying a revival in manufacturing, infrastructure buildouts and construction that drives that demand. This will show up in various measures of economic activity, among them BCA’s Asia Economic Diffusion index and different gauges used by the IMF and World Bank. In other words, base metals prices lead the Asia Economic Diffusion index based on our analysis of Granger causality. This is valuable because the metals price in real time. In earlier research, we showed that, among commodity markets, base metals prices – via copper prices, the LMEX, and the IMF’s metals index – can be used to confirm the signals from our econometric indicators and models of EM and global economic activity. Please see World Bank Lowers Growth Forecast; Commodity Demand Will Pick Up, published January 16, 2020, and Godot … Trade Deal … Wait For It … Base Metals Are Primed For A Rally, published November 28, 2019, by BCA Research’s Commodity & Energy Strategy. They are available at ces.bcaresearch.com. 4 Iron ore and steel prices also will revive on the back of this economic recovery; we will be looking into this next week. 5 Earlier this week, Bloomberg reported the initial hit to oil demand in China amounted to 3mm b/d – the largest such hit since the Global Financial Crisis. This represented ~ 20% of daily Chinese oil demand. 6 We discuss China’s position in the global oil market – and, importantly, in the global air-transportation markets – in last week’s publication, Expect OPEC 2.0 To Cut Supply In Response to Demand Shock. It is available at ces.bcaresearch.com. Investment Views and Themes Recommendations Strategic Recommendations Tactical Trades TRADE RECOMMENDATION PERFORMANCE IN 2019 Q4
Metals Pricing To SARS-Type Demand Shock
Metals Pricing To SARS-Type Demand Shock
Commodity Prices and Plays Reference Table Trades Closed in 2019 Summary of Closed Trades
Metals Pricing To SARS-Type Demand Shock
Metals Pricing To SARS-Type Demand Shock
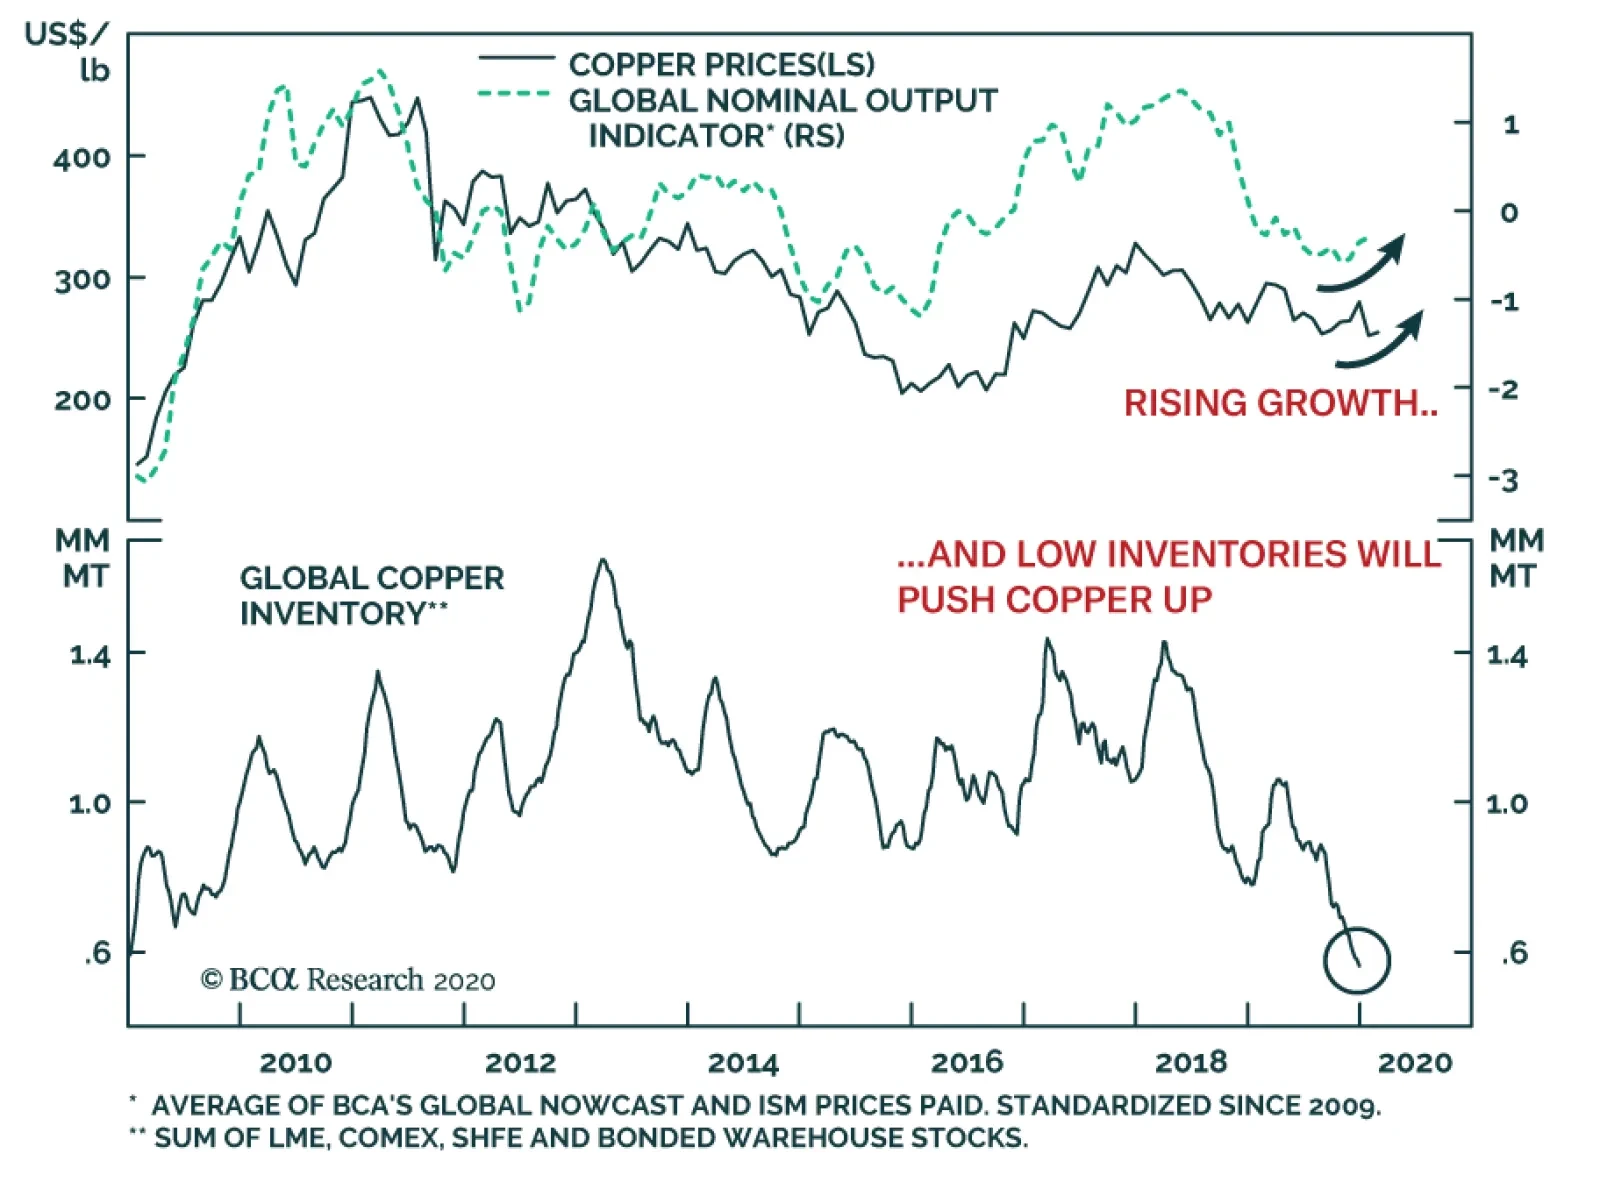
Copper has suffered from the combined assault of a strong dollar, weak global manufacturing activity and, most recently, the dreaded impact on growth from nCoV-2019. However, an opportunity to buy the red metal is emerging. Construction and manufacturing…
Feature Everyone’s asset-allocation plans for the year have been disrupted by the novel coronavirus (2019-nCoV). Our view is that, while the virus is serious and will hurt the Chinese and global economy in the short term, it does not change the 12-month structural outlook for financial markets. Once the epidemic is under control (which it is not yet), there will be an excellent buying opportunity for risk assets and for the most affected asset classes. Many commentators have pointed to the lessons from SARS in 2003. Markets bottomed around the time that new cases of the disease peaked (Chart 1). But there are risks with such a simplistic comparison. The US invasion of Iraq happened at the same time – between 19 March and 1 May 2003 – with arguably a bigger impact on global markets. The Chinese economy was much less significant: China represented only 4% of global nominal GDP in 2003 (versus 17% now), 7% of global car sales (35% now), and 10-20% of commodity demand (50-60%). And it is still unclear how similar 2019-nCoV is to SARS: it appears to be spreading more rapidly (Chart 2) but (so far, at least) is less deadly, with a mortality rate of about 2%, compared to 10% for SARS. Recommended Allocation
Monthly Portfolio Update: Going Viral
Monthly Portfolio Update: Going Viral
Chart 1The Lesson From Sars
The Lesson From Sars
The Lesson From Sars
Chart 2But Is Novel Coronavirus Different?
Monthly Portfolio Update: Going Viral
Monthly Portfolio Update: Going Viral
Nonetheless, the basic theory that markets should bottom around the time that new cases and deaths peak is likely to prove correct. With the number of deaths still growing, however, that is not yet the case. Our advice to investors would be not to sell at this point. The hedges we have in our portfolio (overweight cash and gold) should help to cushion any further downside. But, within a few weeks, assets such as EM equities, airline stocks, commodities, or the Australian dollar should look very attractive again (Chart 3). For the next few months, economic data, particularly from China, will be hard to interpret. In 2003, Chinese GDP was reduced by 1.1% because of SARS, according to estimates by the Brookings Institute.1 The global economy is likely to be more heavily impacted this time, given today’s closely integrated supply chains. On the other hand, most academic research shows that consumption and production lost during an epidemic are later made up. Additionally, the Chinese government is likely to respond with easier fiscal and monetary policy. Once the air clears, we think our thesis that the manufacturing cycle bottomed in late 2019 will remain intact. The data over the past few weeks supports this. In Asia, in particular, PMIs for the major emerging economies are back above 50 (Chart 4). Europe’s rebound has lagged a little but, in the key German economy, indicators of business and investor sentiment have bottomed. Demand in the auto sector, crucial for Europe and Japan, is clearly starting to recover. Data in Europe and EM have generally surprised to the upside recently (Chart 5). Chart 3Some Assets May Soon Look Attractive
Some Assets May Soon Look Attractive
Some Assets May Soon Look Attractive
Chart 4Asian And European Data Picking Up
Asian And European Data Picking Up
Asian And European Data Picking Up
Chart 5Positive Surprises
Positive Surprises
Positive Surprises
The theory that markets should bottom around the time that new cases and deaths peak is likely to prove correct. To a degree, the new virus gave investors an excuse to take profits in some over-bought markets. The US equity market, in particular, looked expensive at the start of the year, with a forward PE of 19x. But we would dismiss the common view that investors had become too optimistic. The bull-bear ratio is not elevated (Chart 6), with only 37% of US individual investors at the start of January believing that the stock market would go up over the next six months, not particularly high by historical standards – it has fallen now to 32%. Last year, investors took money out of equity funds, despite strong returns from stocks. In the past – for example 2012 and 2016 – when this happened, it was followed by further gains for equities, as investors belatedly bought into the rally (Chart 7). Chart 6Retail Investors Aren't So Bullish...
Retail Investors Aren't So Bullish...
Retail Investors Aren't So Bullish...
Chart 7...Indeed, They Have Been Selling Stocks
...Indeed, They Have Been Selling Stocks
...Indeed, They Have Been Selling Stocks
On a 12-month investment horizon, therefore, we remain overweight risk assets such as equities and credit, albeit with some hedges. The upside to global growth remains underestimated: the economists’ consensus is for only 1.8% GDP growth in the US and 1.0% in the euro area this year. A combination of accelerating global growth and central banks that will stay dovish should allow equities to outperform bonds over the next 12 months (Chart 8). Chart 8If PMIs Pick Up, Equities Will Outperform
If PMIs Pick Up, Equities Will Outperform
If PMIs Pick Up, Equities Will Outperform
Chart 9First Signs Of US Equity Underperformance?
First Signs Of US Equity Underperformance?
First Signs Of US Equity Underperformance?
Equities: In December, we moved underweight US equities and recommended shifting into more cyclical markets: overweight the euro zone, and neutral on EM, the UK, and Australia. Before the outbreak of 2019-nCoV, this had worked in EM, but less well in Europe (Chart 9). Once the effects of the virus have cleared, we still believe this allocation will outperform as the global manufacturing cycle picks up. But we have a couple of concerns. (1) The recent US/China trade deal will require China to increase imports from the US by a highly unrealistic 83% year-on-year in 2020 (Chart 10). Our China strategists don’t expect this target to be fully met, but think any increase will come from substitution.2 This would hurt exporters in Europe and Asia. (2) The outperformance of euro area equities is very much determined by how banks fare. The headwinds against them continue: the ECB recently decreed that six major banks fall below required capital ratios; loan growth to corporates in the euro area has fallen to 3.2% year-on-year. Much, though, depends on the yield curve (Chart 11). If it steepens, as a result of stronger growth this year, as we expect, bank stocks should outperform, especially since they remain very cheap (the average price/book ratio of euro area banks is currently only 0.65). Chart 10China’s Import Targets Are Unrealistic
Monthly Portfolio Update: Going Viral
Monthly Portfolio Update: Going Viral
Chart 11Bank Performance Depends On The Yield Curve
Bank Performance Depends On The Yield Curve
Bank Performance Depends On The Yield Curve
Once the air clears, we think our thesis that the manufacturing cycle bottomed in late 2019 will remain intact. Fixed Income: Government bond yields have fallen in recent weeks as investors sought cover, with the US Treasury 10-year yield dropping to 1.55%. While it may test last September’s low of 1.46%, we do not see much further room for global yields to fall. They tend to be highly correlated with manufacturing PMIs, which we expect to rise over the next 12 months (Chart 12). Also, we see the Fed staying on hold this year, not cutting rates twice, as the market is now pricing in. This mildly hawkish surprise should push up rates (Chart 13). We continue to prefer credit over government bonds. Our global fixed-income strategists consider that, from a valuation standpoint, US high yield, and UK investment grade and high yield are the most attractive (Chart 14).3 Chart 12Rates Move In Line With PMIs
Rates Move In Line With PMIs
Rates Move In Line With PMIs
Chart 13What If The Fed Doesn't Cut Rates?
What If The Fed Doesn't Cut Rates?
What If The Fed Doesn't Cut Rates?
Chart 14US Junk Looks Most Attractive
Monthly Portfolio Update: Going Viral
Monthly Portfolio Update: Going Viral
Currencies: Defensive currencies such as the yen, Swiss franc, and US dollar have benefitted from the recent risk-off move. We see this as temporary. Once investors refocus on growth, the US dollar should start to depreciate again (the DXY index did fall by 3% between September and early January). The dollar is a counter-cyclical currency. It is 15% overvalued relative to PPP (Chart 15). It is also very momentum-driven – and, since December, momentum has pointed to depreciation and continues to do so (Chart 16). Chart 15Dollar Is 15% Overvalued...
Dollar Is 15% Overvalued...
Dollar Is 15% Overvalued...
Chart 16...And Momentum Has Moved Against USD
...And Momentum Has Moved Against USD
...And Momentum Has Moved Against USD
Commodities: Industrial metals prices had started to pick up over the past few months, reflecting the stabilization of Chinese growth (Chart 17). How they fare from now will depend on: (1) how sharply Chinese growth slows as a result of 2019nCoV, and (2) how much stimulus the Chinese government rolls out to offset this. Given the degree of decline in some commodity prices (zinc down by 16% since mid-January, and copper by 9%, for example), there should be an attractive buying opportunity in these assets over coming weeks. Gold has proved to be a handy hedge against geopolitical risks (Iran) and unexpected tail risks (the coronavirus), rising by 4% year-to-date. We continue to believe it has a useful place in investors’ portfolios as a diversifier and hedge, particularly in a world of very low interest rates where cash is unattractive (Chart 18). The oil price has been hit by the disruption to air travel in January, but supply remains tight (and OPEC is likely to cut supply further in response to the demand shock).4 As long as economic growth picks up later this year, we see the crude oil price recovering over the coming months. Chart 17Metals Reflect Chinese Growth
Chinese Slowdown Will Weigh On Metal Prices Metals Reflect Chinese Growth
Chinese Slowdown Will Weigh On Metal Prices Metals Reflect Chinese Growth
Chart 18Gold Attractive With Bond Yields So Low
Gold Attractive With Bond Yields So Low
Gold Attractive With Bond Yields So Low
Garry Evans, Senior Vice President Chief Global Asset Allocation Strategist garry@bcaresearch.com Footnotes 1 Please see Globalization and Disease: The Case Of SARS, Jong-Wha Lee and Warwick J. McKibbin, Brookings Discussion Paper No. 156, available at https://www.brookings.edu/wp-content/uploads/2016/06/20040203-1.pdf 2 Please see China Investment Strategy Weekly Report “Managing Expectations,” dated 22 January 2020, available at cis.bcaresearch.com 3 Please see Global Fixed Income Strategy Weekly Report “How To Find Value In Corporate Bonds,” dated 21 January 2020, available at gfis.bcaresearch.com 4 Please see Commodity & Energy Strategy Weekly Report “Expect OPEC 2.0 To Cut Supply In Response to Demand Shock,” dated 30 January 2020, available at ces.bcaresearch.com GAA Asset Allocation
Highlights Collective market signals suggest a low but non-negligible probability of a dollar spike due to the coronavirus. Stay long the yen as a portfolio hedge. Short CHF/JPY bets also make sense. Our limit sell on the gold/silver ratio was triggered at 90. Place a stop at 95, with an initial target of 80. Feature Chart I-1Watching Market Signals
Watching Market Signals
Watching Market Signals
Investors can generally be classified in two camps. There are those who are predisposed to being risk averse. As such, capital preservation trumps the desire for outsized returns. For such investors, defensive equities such as staples and utility stocks, fixed-income assets, or even gold tend to be the favored vehicles over time. At the opposite end of the spectrum are the investors who desire hopping on and riding the next growth unicorn. Their favored investment universe can include technology and biotech concerns, but can also span industries such as automotive and food. The key, however, is that their inherent disposition is to multiply returns rather than preserve capital. There is a crucial difference between this bias and a risk-on/risk-off environment. For example, in a risk-on environment, the more prudent investor might choose high-yielding government bonds, while the high flyer will be in the S&P 500 or private equity. In the currency world, the “preservationist” might choose the euro as an anti-dollar play despite negative yields, while the “high flyer” would rather be in the New Zealand dollar or the Norwegian krone. The oscillation between these two bipolar universes can be measured in various ways, but one that has been prescient in gauging the direction for currency markets is the ratio between the S&P 500 index and gold prices. In general, whenever the S&P 500 has been outperforming gold, the dollar has tended to soar, and vice versa (Chart I-1). As a closed economy, US markets are generally more defensive. So even in a risk-off environment, this ratio can capture the preference for capital preservation versus growth. The collective signals from financial markets suggest there is a low probability of a dollar spike. The SPX/Gold ratio hit a peak of 2.5 in the last quarter of 2018 and has since been exhibiting a bearish pattern of lower highs, with the latest rise peaking a nudge below 2.2. Our belief is that it is less a story of greed versus fear, and more an indication of a powerful underlying preference for investors being revealed in asset prices. Gauging FX Market Signals The coronavirus outbreak has been dominating market headlines in recent weeks. We are not infectious disease specialists, so cannot provide any insight on the potential impact on growth and/or the probability for the virus to become much more widespread. However, the collective signals from financial markets suggest there is a low probability of a dollar spike. The rise in the dollar has been relatively on par with the SARS experience of 2002 (Chart I-2A and Chart I-2B). Back then, the Chinese economy had a much smaller effect on global growth, and so far, the number of reported cases is outpacing the SARS experience. So, it is possible that given the dollar bull market of the last decade or so, there is a dearth of new buyers in the greenback. Chart I-2ARun Of The Mill Virus ? (1)
Run Of The Mill Virus ? (1)
Run Of The Mill Virus ? (1)
Chart I-2BRun Of The Mill Virus ? (2)
Run Of The Mill Virus ? (2)
Run Of The Mill Virus ? (2)
The most recent fall in the S&P 500 index versus gold is definitely a sign of risk aversion, but the much broader peak almost two years ago might be signaling an outright shift in the investment universe. In other words, capital preservation might now be best sought outside US bourses. If this is the case, cheap and unloved value stocks will provide better shelter compared to the growth champions of the last decade. It is interesting that emerging market cyclical stocks (where the epicenter of the crisis is) have not underperformed defensives in a meaningful way during the latest riot (Chart I-3). The typical narrative is that the dollar is now a high-yielding currency within the G10. That means it has now become the object of carry trades. Should the investment universe be shifting to one of prudence, it is plausible though not probable that the greenback will provide both functions. Chart I-3Mixed Message From Cyclicals Versus Defensives
Mixed Message From Cyclicals Versus Defensives
Mixed Message From Cyclicals Versus Defensives
Chart I-4Correlation Break Down Or Unsustainable Gap?
Correlation Break Down Or Unsustainable Gap?
Correlation Break Down Or Unsustainable Gap?
The absolute collapse in the gold-to-bond ratio further confirms that after almost a decade of underperformance, hard money might be coming back into favor versus yield plays (Chart I-4). Gold was a monetary aggregate for centuries, and continues to stand as a viable threat to dollar liabilities. This is not only visible in the rampant accumulation of gold by foreign central banks, notably Russia and China, but also by the breakout in gold in almost every currency, including safe-havens like the Swiss franc and the Japanese yen (Chart I-5). The absolute collapse in the gold-to-bond ratio further confirms that after almost a decade of underperformance, hard money might be coming back into favor. Data from the US Treasury confirms that foreign entities have been fleeing US bond markets at among the fastest pace in recent years. On a rolling 12-month total basis, the US saw an exodus of about US$250 billion in Treasurys from foreigners, one of the largest on record (Chart I-6). Foreign private investors are still net buyers of US Treasurys, but the downtrend in purchases in recent years is evident. In addition, this helps explain why gold has also outperformed Treasurys over this period. Chart I-5Soft Versus Hard ##br##Money
Soft Versus Hard Money
Soft Versus Hard Money
Chart I-6Official Data Shows Less Preference For Treasurys
Official Data Shows Less Preference For Treasurys
Official Data Shows Less Preference For Treasurys
The US dollar’s reserve status remains intact for now. But subtle shifts in this exorbitant privilege are worth monitoring. If balance-of-payment dynamics continue to head in the wrong direction, as they are now, this will favor hard money and non-US assets, while accelerating divestment out of US Treasurys. This is irrespective of whether we enter a risk-on versus risk-off environment. A good proxy for whether the US government was prudent or profligate over the past four decades can be measured by the gap between unemployment relative to NAIRU (the so-called unemployment gap) and the corresponding budget deficit. In simple terms, full employment should be accompanied by balanced budgets, while governments can step in during recessions to put a floor under aggregate demand. Not surprisingly, using this simple rule, sound fiscal policies in the US were usually accompanied by a strong dollar, and vice versa. Chart I-7The Risk To Long Dollar Positions
The Risk To Long Dollar Positions
The Risk To Long Dollar Positions
Over the next five years, the US Congressional Budget Office (CBO) estimates that the US budget deficit will swell to 4.6% of GDP. Assuming the current account deficit remains stable, this will pin the twin deficits at 7.2% of GDP. This assumes no recession, which would have the potential to boost the deficit even further. In the last forty years, there has not been any prolonged period where twin deficits in the US have been expanding while the dollar has been in a bull market (Chart I-7). In a nutshell, even though the coronavirus is dominating headlines, the lack of a more pronounced greenback strength can be pinpointed to a rising number of negative market signals. Our bias is that when this eventually rolls over and global growth picks up in earnest, dollar bulls may be forced to capitulate. Bottom Line: We are not downplaying the potential impact of the coronavirus, but are skeptical of its ability to catapult the dollar higher. We are short the DXY index, with a target of 90 and a stop at 100. Stick with it. Bullish Both Gold And Silver, But Go Short The GSR If we are right, then both gold and silver will tend to rise in an environment where the dollar is falling. That said, the gold/silver ratio (GSR) hit a three-decade high of 93.3 last summer, opening up an arbitrage opportunity. The history of these reversals is that they tend to be powerful, quick, and extremely volatile (Chart I-8). This not only paves the way for an excellent entry point to short gold versus silver, but provides important information on the battleground between easing financial conditions and a pick-up in economic (or manufacturing) activity. The ratio of the velocity of money between the US and China has tended to track both the gold/silver ratio and the dollar closely. Just like gold, silver benefits from low interest rates, plentiful liquidity, and the incentive for fiat money debasement. However, the gold/silver ratio is sitting near two standard deviations above its mean. Meanwhile, over the past century, the peak in GSR has been around 100. The gold/silver ratio tends to rally ahead of an economic slowdown, but then peaks when growth is still weak but liquidity conditions are plentiful enough to affect the outlook for future growth. This appears to be the case today. The simple reason is that silver has more industrial uses than gold (Chart I-9). Chart I-8GSR At A Speculative Extreme
GSR At A Speculative Extreme
GSR At A Speculative Extreme
Chart I-9No Recession = Buy Silver
No Recession = Buy Silver
No Recession = Buy Silver
The ratio of the velocity of money between the US and China has tended to track both the gold/silver ratio and the dollar closely (Chart I-10). A falling ratio signifies that the number of times money is changing hands in China is outpacing that number in the US. This also tends to coincide with a preference for US versus non-US assets, since animal spirits (as measured by money velocity) tend to be pronounced in places where returns on capital are higher. Silver is a more volatile metal than gold. Part of the reason is that the silver market is thinner, with future open interest that is about one-third that of gold. As such, silver tends to rise faster than gold during precious metal bull markets (Chart I-11). Chart I-10Falling GSR = Rising Manufacturing Activity
Falling GSR = Rising Manufacturing Activity
Falling GSR = Rising Manufacturing Activity
Chart I-11Silver Is More Volatile Than Gold
Silver Is More Volatile Than Gold
Silver Is More Volatile Than Gold
This brings us to the sweet spot for silver. Even if global growth remains tepid over the next few months, due to a rise in infections from the coronavirus, a lot of the bad news is already reflected in a high GSR. This means the potential for upside will have to be nothing short of a deep recession. Relative speculative positioning favors gold, which is positive from a contrarian standpoint. Ditto for relative sentiment. More often than not, a positive signal from both these indicators has been a good timing tool for a selloff in the GSR. If global growth bottoms, then the rise in silver prices could be explosive. Silver fabrication demand benefits from new industries such as solar and a flourishing “cloud” industry that are capturing the new manufacturing landscape. Meanwhile, we are also entering a window where any pickup in demand could lead to a sizeable increase in the physical silver deficit. Bottom Line: A falling GSR provides important information about the battleground between easing financial conditions and a pickup in economic activity. We remain bullish on both gold and silver, but a trading opportunity has opened up for a short GSR position. Housekeeping Chart I-12AUD Will Follow Asian Currencies
AUD Will Follow Asian Currencies
AUD Will Follow Asian Currencies
Our limit buy on the Australian dollar was triggered at 68 cents. We discussed the Aussie at length in our report dated January 17.1 Place an initial target at 0.75 cents and a tight stop at 0.66. The near-term risk to this trade is any escalation in virus infections that will collectively send Asian currencies into a tailspin (Chart I-12). Chester Ntonifor Foreign Exchange Strategist chestern@bcaresearch.com Footnotes 1 Please see Foreign Exchange Strategy Weekly Report, titled "On AUD And CNY," dated January 17, 2020, available at fes.bcaresearch.com Currencies U.S. Dollar Chart II-1USD Technicals 1
USD Technicals 1
USD Technicals 1
Chart II-2USD Technicals 2
USD Technicals 2
USD Technicals 2
Recent data in the US have been positive: The Markit manufacturing PMI fell to 51.7 while the services component increased to 53.2 in January. The Dallas Fed manufacturing index improved from -3.2 to -0.2 in January. Moreover, the Richmond Fed manufacturing index soared to 20 in January. Durable goods orders increased by 2.4% month-on-month in December. The trade deficit widened further to $68.3 billion from $63 billion in December. Annualized GDP growth was unchanged at 2.1% year-on-year in Q4. Initial jobless claims fell to 216K from 223K for the week ended January 24th. The DXY index appreciated by 0.1% this week. While the coronavirus spurred worries about a further slowdown in the global economy, the impact on the US remains to be seen. On Wednesday, the Fed committee voted unanimously to keep interest rates on hold at 1.75% and concluded that the current rate is appropriate to support sustained expansion of the US economy. Report Links: Portfolio Tweaks Before The Chinese New Year - January 24, 2020 On Oil, Growth And The Dollar - January 10, 2020 Updating Our Balance Of Payments Monitor - November 29, 2019 The Euro Chart II-3EUR Technicals 1
EUR Technicals 1
EUR Technicals 1
Chart II-4EUR Technicals 2
EUR Technicals 2
EUR Technicals 2
Recent data in the euro area have been mostly positive: The Markit manufacturing PMI jumped to 47.8 in January while the services PMI fell slightly to 52.2. The German IFO current assessment index increased to 99.1 from 98.8 in January, while expectations component fell to 92.9. The economic sentiment indicator increased to 102.8 from 101.3 in January. The unemployment rate fell further to 7.4% in December from 7.5% the prior month. The euro has been flat against the US dollar this week. Though the German IFO expectations component disappointed, the overall assessment has shown tentative signs of recovery. More importantly, changes in the manufacturing PMI indices, especially in Germany, are staging the V-shaped recovery we have been expecting. Report Links: Updating Our Balance Of Payments Monitor - November 29, 2019 On Money Velocity, EUR/USD And Silver - October 11, 2019 A Few Trade Ideas - Sept. 27, 2019 Japanese Yen Chart II-5JPY Technicals 1
JPY Technicals 1
JPY Technicals 1
Chart II-6JPY Technicals 2
JPY Technicals 2
JPY Technicals 2
Recent data in Japan have been positive: Consumer confidence was unchanged at 39.1 in January. Services PPI increased by 2.1% year-on-year in December. Headline inflation increased to 0.8% year-on-year from 0.5% in December. Both manufacturing and services PMIs increased to 49.3 and 52.1, respectively in January. The Japanese yen appreciated by 0.6% against the US dollar this week. The flare up in risk aversion was a very potent catalyst, given the yen had become unloved and under owned. Persistent global risks, including Mid East tensions, and more recently, the spread of coronavirus, all warrant holding the Japanese yen as a portfolio hedge. Our last weekly report discussed why we prefer the Japanese yen to the Swiss franc as portfolio insurance. Report Links: Portfolio Tweaks Before The Chinese New Year - January 24, 2020 Updating Our Balance Of Payments Monitor - November 29, 2019 Signposts For A Reversal In The Dollar Bull Market - November 1, 2019 British Pound Chart II-7GBP Technicals 1
GBP Technicals 1
GBP Technicals 1
Chart II-8GBP Technicals 2
GBP Technicals 2
GBP Technicals 2
Recent data in the UK have been solid: Both Markit manufacturing and services PMIs soared to 49.8 and 52.9 respectively in January. Nationwide housing prices increased by 1.9% year-on-year in January, compared with 1.4% the previous month. The saucer-shaped bottom in home prices is becoming more and more evident. The British pound has been flat against the US dollar this week. On Thursday, the BoE decided to leave interest rates unchanged at 0.75%. The fact that there were only two dissenters, in line with the previous month, suggests that rising bets for a rate cut were misplaced. The UK is due to leave the EU as of January 31st and enter a transition period that is supposed to last until December 31st 2020. The immediate aftermath of the exit will be business as usual. Trading strategy on the pound should be a buy on dips. We will continue to explore opportunities in GBP in upcoming reports. Report Links: Updating Our Balance Of Payments Monitor - November 29, 2019 A Few Trade Ideas - Sept. 27, 2019 United Kingdom: Cyclical Slowdown Or Structural Malaise? - Sept. 20, 2019 Australian Dollar Chart II-9AUD Technicals 1
AUD Technicals 1
AUD Technicals 1
Chart II-10AUD Technicals 2
AUD Technicals 2
AUD Technicals 2
Recent data in Australia have been mixed: The NAB business conditions index fell to 3 from 4 in December. Moreover, the business confidence index decreased to -2 from 0. Headline inflation increased to 1.8% year-on-year from 1.7% in the fourth quarter. Import prices increased by 0.7% quarter-on-quarter, while export prices plunged by 5.2% quarter-on-quarter in Q4. The Australian dollar fell by 2.1% against the US dollar this week, triggering our limit buy position at AUD/USD 0.68. Despite temporary challenges from the bushfires and the coronavirus, we continue to hold our base case view that global growth is likely to rebound in the next 12-to-18 months, which is bullish for the Aussie dollar. Report Links: On AUD And CNY - January 17, 2020 Updating Our Balance Of Payments Monitor - November 29, 2019 A Contrarian View On The Australian Dollar - May 24, 2019 New Zealand Dollar Chart II-11NZD Technicals 1
NZD Technicals 1
NZD Technicals 1
Chart II-12NZD Technicals 2
NZD Technicals 2
NZD Technicals 2
Recent data in New Zealand have been positive: Headline inflation increased to 1.9% year-on-year in Q4, compared with 1.5% the previous quarter. It also beat expectations of 1.8%. The trade balance shifted to a surplus of NZ$547 million in December. Goods exports rose by 4.8% year-on-year to NZ$5.5 billion, while imports fell by 5.4% year-on-year to NZ$5 billion. Shortly after the rise along with inflation data, the New Zealand dollar fell by more than 2% this week, amid growing risk aversion. New Zealand, as a chief exporter of agricultural products, bore a good brunt of speculative selling. Assuming infections peak in the coming weeks, we remain positive on the kiwi as the Chinese government is likely to inject more stimulus into the economy. Report Links: Updating Our Balance Of Payments Monitor - November 29, 2019 Place A Limit Sell On DXY At 100 - November 15, 2019 USD/CNY And Market Turbulence - August 9, 2019 Canadian Dollar Chart II-13CAD Technicals 1
CAD Technicals 1
CAD Technicals 1
Chart II-14CAD Technicals 2
CAD Technicals 2
CAD Technicals 2
Recent data in Canada have been mostly positive: Retail sales increased by 0.9% month-on-month in November. The Bloomberg Nanos confidence index rose to 56.5 from 56.1 for the week ended January 24th. The Canadian dollar fell by 0.6% against the US dollar this week. As a petrocurrency, the risk of much reduced travel hit the loonie. We have written at length in various reports about the loonie, but the bottom line is that Canada benefits less than other petrocurrencies in oil bull markets. Ergo, the underperformance of short CAD/NOK and long AUD/CAD positions this week is expected. In other news, Trump has signed the new USMCA bill into law this week, leaving Canada the only member of the trilateral deal that has yet to ratify the agreement. Report Links: The Loonie: Upside Versus The Dollar, But Downside At The Crosses Updating Our Balance Of Payments Monitor - November 29, 2019 Making Money With Petrocurrencies - November 8, 2019 Swiss Franc Chart II-15CHF Technicals 1
CHF Technicals 1
CHF Technicals 1
Chart II-16CHF Technicals 2
CHF Technicals 2
CHF Technicals 2
Recent data in Switzerland have been mixed: The trade surplus narrowed for a fourth consecutive month in December, falling to CHF 2 billion. Real exports decreased by 3.4% month-on-month while real imports grew by 0.2% month-on-month. The ZEW expectations index fell to 8.3 from 12.5 in January. The KOF leading indicator jumped to 100.1 from 96.2 in January. The Swiss franc has been more or less flat against the US dollar this week. The fall in exports of chemical and pharmaceutical production was the main driver behind the decrease in the Swiss trade balance in December. The SNB is walking a fine line. The improvement in the KOF leading indicator, along with rising inflation and PMI data is definitely a source of comfort, but the surge in EUR/CHF will hurt competitiveness and warrant stealth intervention. Buy EUR/CHF at 1.06. Report Links: Portfolio Tweaks Before The Chinese New Year - January 24, 2020 Updating Our Balance Of Payments Monitor - November 29, 2019 Notes On The SNB - October 4, 2019 Norwegian Krone Chart II-17NOK Technicals 1
NOK Technicals 1
NOK Technicals 1
Chart II-18NOK Technicals 2
NOK Technicals 2
NOK Technicals 2
Recent data in Norway have been negative: Retail sales fell by 2% month-on-month in December. The Norwegian krone fell by 1.9% against the US dollar this week. The WTI crude oil price plunged by 20% since the peak earlier this month, due to a combination of falling global travel demand, eased Iran tensions and a bearish EIA inventory report. That being said, our Commodity & Energy strategists continue to be bullish energy prices and expect the WTI crude oil price to reach $63/bbl in 2020, based on recovering global demand and supply constraints. This should eventually lift the Norwegian krone. OPEC is scheduled to meet early March, and plunging prices could be a catalyst for the cartel to cut production. Report Links: On Oil, Growth And The Dollar - January 10, 2020 Updating Our Balance Of Payments Monitor - November 29, 2019 Making Money With Petrocurrencies - November 8, 2019 Swedish Krona Chart II-19SEK Technicals 1
SEK Technicals 1
SEK Technicals 1
Chart II-20SEK Technicals 2
SEK Technicals 2
SEK Technicals 2
Recent data in Sweden have been mixed: Producer prices increased by 1.3% year-on-year in December. The trade surplus shrank to SEK 0.3 billion from SEK 2.7 billion in December. Retail sales grew by 3.4% year-on-year in December. Consumer confidence marginally fell to 92.6 from 94.7 in January, while business confidence jumped to 97.4 in January, the highest in seven months. The Swedish krona fell by 1.3% against the US dollar this week. Recent Swedish data has been disappointing given the steep decline during the trade war, but we are beginning to see second-derivative improvements. The trade surplus is rising on a year-on-year basis. Particularly noteworthy was the improvement in business confidence, which has historically led the Swedbank PMI index tick for tick. Report Links: Updating Our Balance Of Payments Monitor - November 29, 2019 Where To Next For The US Dollar? - June 7, 2019 Balance Of Payments Across The G10 - February 15, 2019 Trades & Forecasts Forecast Summary Core Portfolio Tactical Trades Limit Orders Closed Trades
Highlights The intense focus on the weakening of global oil demand expected in the wake of another coronavirus outbreak in China – dubbed 2019-nCoV – obscures likely supply-side responses by OPEC 2.0. The producer coalition likely will rebalance markets by extending production cuts from end-March to at least the end of June when it meets in Vienna March 5-6. OPEC 2.0 producers will be exquisitely sensitive to Asian refiner demand. They will use it as a gauge for how severe 2019-nCoV’s impact will be on EM demand, and adjust production and exports accordingly. On the demand side, it is difficult to analogue the 2019-nCoV outbreak to the 2003 SARS outbreak, given all the conflicting fundamentals at play at that time. Forward curves for the principal benchmark crude oils – Brent and WTI – remain backwardated, in spite of the 2019-nCoV-related sell-off. Longer-dated WTI (out to December 2023) traded below $50/bbl earlier in the week, roughly in line with shale-breakeven costs reported by the Dallas Fed earlier this month. This likely will continue to pressure capex in the US shales, keeping future supply growth constrained. Feature Forward curves for the principal benchmark crude oils – Brent and WTI – remain backwardated, in spite of the 2019-nCoV-related sell-off. Chart of the WeekChina's Oil Demand Drives Global Growth
China's Oil Demand Drives Global Growth
China's Oil Demand Drives Global Growth
Oil markets are rightly focused on the demand implications of the 2019-nCoV outbreak in China.1 Since 2000, China has accounted for 42% of annual oil-demand growth worldwide (Chart of the Week). China is second only to the US in oil demand, accounting for 14% of total global demand of 100.7mm b/d at the end of 2019; its oil imports averaged more than 10mm b/d last year, and are expected to remain strong as it continues to build out its refining sector. Chart 2Asian Air Travel Hit Hard By SARS
Expect OPEC 2.0 To Cut Supply In Response to Demand Shock
Expect OPEC 2.0 To Cut Supply In Response to Demand Shock
Historical analogues for 2019-nCoV are difficult. The immediate analogue is the SARS coronavirus outbreak identified in China in February 2003, which lasted six months and hit Asian air travel especially hard (Chart 2). During the height of the SARS outbreak in April 2003, air-travel passenger demand in Asia plunged 45%, according to the International Air Transport Association (IATA). This pushed jet fuel prices lower in Asia and in other key markets, along with distillate prices generally (Chart 3).2 Chart 3Fundamental Supply-Demand Balances Support Higher Crude Oil Prices
Fundamental Supply-Demand Balances Support Higher Crude Oil Prices
Fundamental Supply-Demand Balances Support Higher Crude Oil Prices
China now is an extremely large share of global jet fuel consumption. Chart 4BCA Models, Base Metals Prices Suggest SARS Effect Was Short-Lived
BCA Models, Base Metals Prices Suggest SARS Effect Was Short-Lived
BCA Models, Base Metals Prices Suggest SARS Effect Was Short-Lived
The industry now is more reliant on Chinese travelers. Since 2003, the number of annual air passengers has more than doubled, with China growing to become the world’s largest outbound travel market. In 2003, close to 7mm passengers from China traveled on international flights. By 2018, that number had grown close to 64mm people, according to China’s aviation authority. As Chart 2 demonstrates, China now is an extremely large share of global jet fuel consumption. Still, oil is a global market – the avoidance of China during the SARS outbreak in 2003 would have impacted global air travel, and, as a result, global jet-fuel prices. Our proprietary EM commodity-demand models and the behavior of base metals prices, which were and remain heavily influenced by China’s economy, suggest China’s GDP growth slowed in 2003 (mainly 1H03) because of the SARS outbreak (Chart 4). The LME’s base metals index fell 9% between February and July 2003, while copper prices fell 11%. By year-end, these markets had fully recovered. Oil-Supply Management Drives Price Evolution In the modern era of the oil market beginning roughly around 2000, there have been numerous demand shocks requiring a supply response from OPEC. During the SARS outbreak in 2003, oil-market fundamentals at the time were complicated by the sudden loss of Venezuelan output in December 2002 to a general strike, which lasted three months and removed more than 2mm b/d from the market, and the US invasion of Iraq on March 2003. Both of these supply-side shocks hit markets just as demand was being hit by SARS. This makes it difficult to extract a pure price response on the demand side to the SARS episode. In the modern era of the oil market beginning roughly around 2000, there have been numerous demand shocks requiring a supply response from OPEC. These including the 9/11 terror attacks in the US in 2001; the SARS outbreak in late 2002-03; the Global Financial Crisis in 2007-08; and the euro debt crisis in 2011-12 (Chart 5).3 Chart 5Demand Shocks Abound In 21st Century
Demand Shocks Abound In 21st Century
Demand Shocks Abound In 21st Century
Chart 6OPEC Lost Key Members' Output During SARS Outbreak
OPEC Lost Key Members' Output During SARS Outbreak
OPEC Lost Key Members' Output During SARS Outbreak
OPEC 2.0’s goal – similar to OPEC’s goal before it – is to avoid an unintended inventory accumulation. Importantly, these demand shocks were accompanied by supply shocks – Venezuela's general strike; the US invasion of Iraq continues to play havoc with global supply; the BP Macondo blowout in the Gulf of Mexico in 2010; the Arab Spring and the loss of Libyan output in 2011 – all of which complicated OPEC’s decision making (Chart 6). Much of OPEC’s adjustment then and now is made by the Kingdom of Saudi Arabia (KSA), which functions as the central bank of the global oil market increasing and decreasing production to balance markets (Chart 7). Chart 7KSA Primarily Balances Markets During Supply, Demand Shocks
Expect OPEC 2.0 To Cut Supply In Response to Demand Shock
Expect OPEC 2.0 To Cut Supply In Response to Demand Shock
OPEC 2.0’s goal – similar to OPEC’s goal before it – is to avoid an unintended inventory accumulation, which would push prices lower and severely alter the forward curves for the principal crude oil pricing benchmarks, WTI and Brent (Chart 8). Chart 8OPEC 2.0’s Goal: Avoid Unintended Inventory Accumulation
Expect OPEC 2.0 To Cut Supply In Response to Demand Shock
Expect OPEC 2.0 To Cut Supply In Response to Demand Shock
Navigating The 2019-nCoV Outbreak Oil prices – like all commodity prices – are a function of supply and demand, which clear the market instantaneously (here and now), and across time as buyers and sellers contract for forward delivery. The relentless focus on the demand-side consequences of the 2019-nCoV outbreak is not helpful in determining how oil prices will trade going forward. Oil prices – like all commodity prices – are a function of supply and demand, which clear the market instantaneously (here and now), and across time as buyers and sellers contract for forward delivery. The discussion above is meant to highlight this, by recalling OPEC’s production management during various demand shocks, not just the SARS outbreak in 2003. OPEC then, and OPEC 2.0 now, is not forced to produce oil and export regardless of the physical realities it confronts. It can adjust production and exports in response to direct demand indications from its refinery buyers and traders lifting its crude oil. Demand slowdowns, all else equal, typically will show up in falling crack-spread differentials between refined products and crude oil prices (Chart 9).4 Chart 9Crack Spreads Inform Crude Oil Production Decisions
Crack Spreads Inform Crude Oil Production Decisions
Crack Spreads Inform Crude Oil Production Decisions
It still is too early to gauge the extent of the fall-off in demand arising from 2019-nCoV, but it will become apparent in cracks and in OPEC 2.0 producers’ responses to lower refiner demand. Falling crack spreads inform crude oil producers they need to throttle back on production – refiners are not able to profitably run all the crude being made available to them and crude and product are backing up in inventory. It still is too early to gauge the extent of the fall-off in demand arising from 2019-nCoV, but it will become apparent in cracks and in OPEC 2.0 producers’ responses to lower refiner demand, which will determine how much production they need to cut in order to balance the market. This will be done against a backdrop of supply concerns that are not too dissimilar to those prevailing during the 2003 SARS crisis – e.g., instability in Iraq and Iran that could threaten production, and the loss of Venezuelan exports. Bottom Line: Markets still are in the process of assessing how damaging 2019-nCoV will be for industrial commodity demand – oil, bulks and base metals, in particular. As has been the case in all such demand shocks, OPEC’s supply response (and now OPEC 2.0’s) will determine how deeply and for how long prices are impacted. Robert P. Ryan Chief Commodity & Energy Strategist rryan@bcaresearch.com Hugo Bélanger Senior Analyst Commodity & Energy Strategy HugoB@bcaresearch.com Commodities Round-Up Energy: Overweight Brent prices fell 8% since last Monday amid the coronavirus outbreak in China. The number of confirmed cases is rapidly expanding, reaching more than 6,000 as of Wednesday which surpasses the trajectory of SARS in the first month of the outbreak in 2003. Nonetheless, the fatality rate remains below that of SARS, estimated at less than 3% vs. ~ 10% for SARS. Separately, the WCS discount to WTI averaged -$23/bbl this month. This is in line with our view that the discount would drop below -$20/bbl in 1Q20. This level is appropriate to incentivize additional rail transportation to the US. We expect the discount will remain close to current levels and for crude-by-rail volumes to pick up this year (Chart 10). Base Metals: Neutral Base metals have been severely impacted this week by the coronavirus outbreak – copper, aluminum, zinc, and lead are down 9%, 4%, 9%, and 5%. A prolonged slowdown in China’s economic activity – the driver of the global industrial activity recovery we expect – would plunge metals’ prices. China’s base metal consumption more than doubled since 2003. Thus, the potential impact of 2019-nCoV is much larger compared to SARS and market participants are pricing in the probability of damaging scenarios to global growth. This explains the pronounced decline in metals’ prices this year vs. 2003. Precious Metals: Neutral Gold was one of the few commodities in the green since last week. The yellow metal rose 1% since last Monday, supported by renewed safe-haven demand flows. Gold and the USD have been rising simultaneously amid the virus outbreak, which is typical of uncertain periods. The spectrum of possible outcomes is wide and negatively skewed. This warrants protection through safe-haven assets. We remain strategically long gold as a portfolio hedge. Our recommendation is up 28% since inception. Ags/Softs: Underweight Corn markets focused on USDA reports of rising exports, highlighted by the sale of 124,355 MT to Mexico. CBOT March corn futures were up 6% Tuesday, reversing earlier losses Monday. Beans remain under pressure, as traders await tangible evidence that China will go ahead with purchases announced in the so-called phase-one deal negotiated between the US and China (Chart 11). Chart 10WCS Discount Under Pressure
WCS Discount Under Pressure
WCS Discount Under Pressure
Chart 11Markets Waiting For China Demand
Expect OPEC 2.0 To Cut Supply In Response to Demand Shock
Expect OPEC 2.0 To Cut Supply In Response to Demand Shock
Footnotes 1 The US Centers for Disease Control and Prevention’s 2019-nCoV website highlights the marked differences between China’s response to the current coronavirus outbreak vs the 2003 SARS outbreak. One notable response by the Chinese government this time around – besides the rapid lockdown on travel – has been the alacrity with which officials posted the genome for the virus to a global research database, which allowed US researchers to quickly compare it to the strain they isolated. Separately, Reuters reported Australian researchers were able to grow the virus in a lab, which could accelerate development of a vaccine. 2 Distillates comprise the so-called middle of the refined barrel, and include jet fuel, diesel fuel and heating oil (also known as gasoil). These are primarily associated with industrial markets – mining and transportation, e.g. – and are key barometers of economic activity generally. 3 The "modern" era for oil began roughly in 2000, when oil prices became a random walk. WTI prices were mean-reverting from 1986 to roughly 2000, then became a random walk. Please see Helyette Geman, (2007), "Mean Reversion versus Random Walk in Oil and Natural Gas Prices," in Advances in Mathematical Finance, Birkhäuser, Boston; and Haidar, I. and C.R. Wolff, "Forecasting crude oil price (revisited)," The proceeding of the 30th USAEE Conference, Washington , D.C. USA. 9-12 October, 2011. 4 The “crack spread” is the USD/bbl difference between refined-product prices and crude-oil prices. It represents the gross margin of refiners. Investment Views and Themes Recommendations Strategic Recommendations Tactical Trades TRADE RECOMMENDATION PERFORMANCE IN 2019 Q4
Expect OPEC 2.0 To Cut Supply In Response to Demand Shock
Expect OPEC 2.0 To Cut Supply In Response to Demand Shock
Commodity Prices and Plays Reference Table Trades Closed in 2019 Summary of Closed Trades
Expect OPEC 2.0 To Cut Supply In Response to Demand Shock
Expect OPEC 2.0 To Cut Supply In Response to Demand Shock