Commodities & Energy Sector
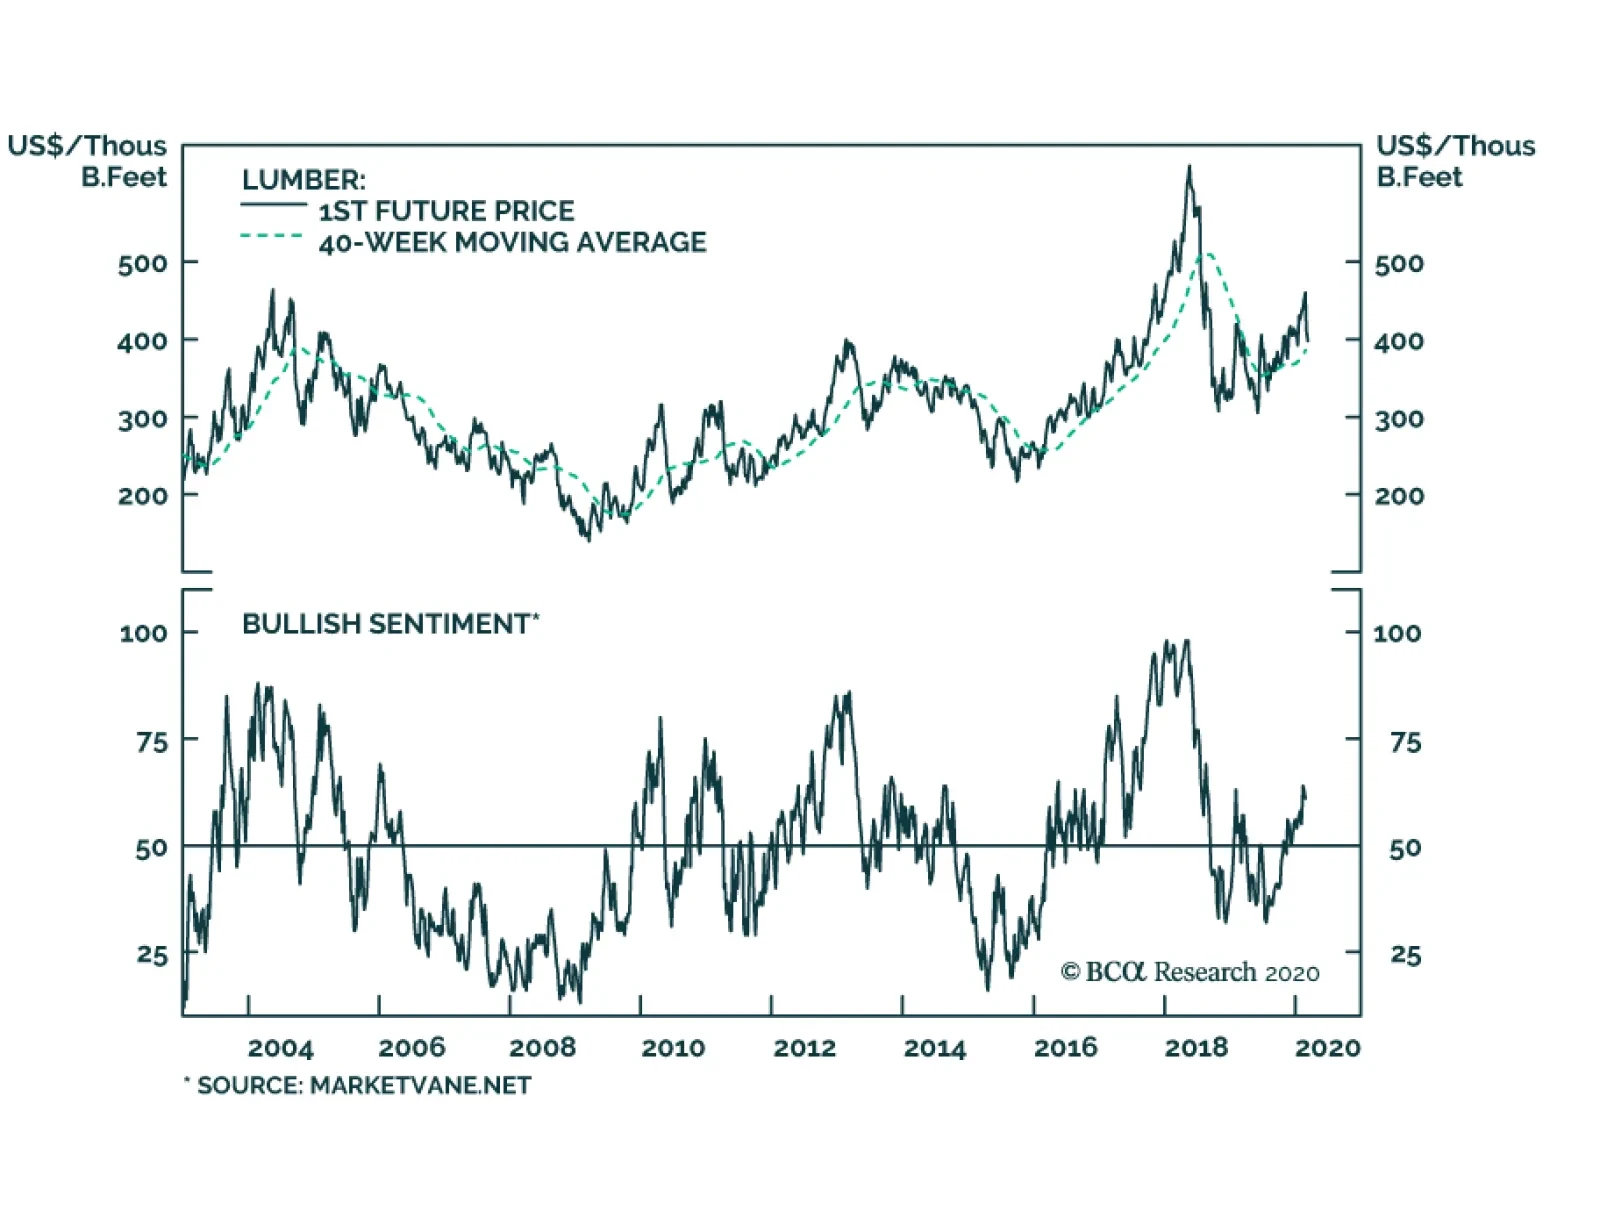
Lumber prices have sharply fallen in sympathy with every asset levered to growth. The recent price decline has purged some of the froth out of that market, which is creating an attractive entry point to buy lumber. Lumber is much less sensitive to global…
Yesterday, BCA Research's Commodity & Energy Strategy service wrote that it expects palladium prices will move higher on the expanding deficit, and backwardation in the forward curve will persist in incentivizing the release of inventories to…

Highlights Supply constraints and unstoppable demand growth – the result of stricter regulations requiring higher loadings in autocatalysts to treat toxic pollution in automobile-engine emissions – will continue to push palladium’s price higher, despite a near-vertical move higher that began in 2H19. South Africa’s power grid is in a state of near-collapse, which will add volatility to mining operations focused on platinum-group metals – chiefly palladium, platinum and rhodium. South Africa accounts for 36% of global palladium production and 73% of platinum production, which makes it difficult to make the case that platinum could be substituted for palladium as its price rises. Palladium stocks are at risk of being further depleted globally as demand from automobile manufacturers in China, the US and Europe remains robust. This will keep palladium forward curves backwardated for the foreseeable future. While pressure to find alternatives for palladium will grow as prices rise, in absolute terms the additional cost resulting from higher prices for the metal – ~ $400 per vehicle – is not yet enough to draw significant investment to this effort. Feature Palladium markets are fundamentally tight and unresponsive to macroeconomic uncertainty. Table 1Top 5 Best Performing Commodities
Epic Palladium Rally Likely Continues
Epic Palladium Rally Likely Continues
In 2019, for the third year in a row, palladium prices outperformed other major commodities, returning an impressive 54% over the year (Table 1). This is the result of a massive 13% increase in demand for the metal – powered by strong autocatalyst demand for gasoline-powered cars in China and Europe, even as collapsing auto production globally and elevated trade uncertainty continue to dog automobile sales (Chart 1). This apparent contradiction is explained by stricter vehicle emissions regulations in major consuming markets – chiefly the Euro 6d, China 6 and US Tier 3 regimes – and power shortages in South Africa, which are introducing considerable volatility on the supply side in the second-largest producing country for the metal. Chart of the WeekSurging Autocatalyst Palladium Demand
Epic Palladium Rally Likely Continues
Epic Palladium Rally Likely Continues
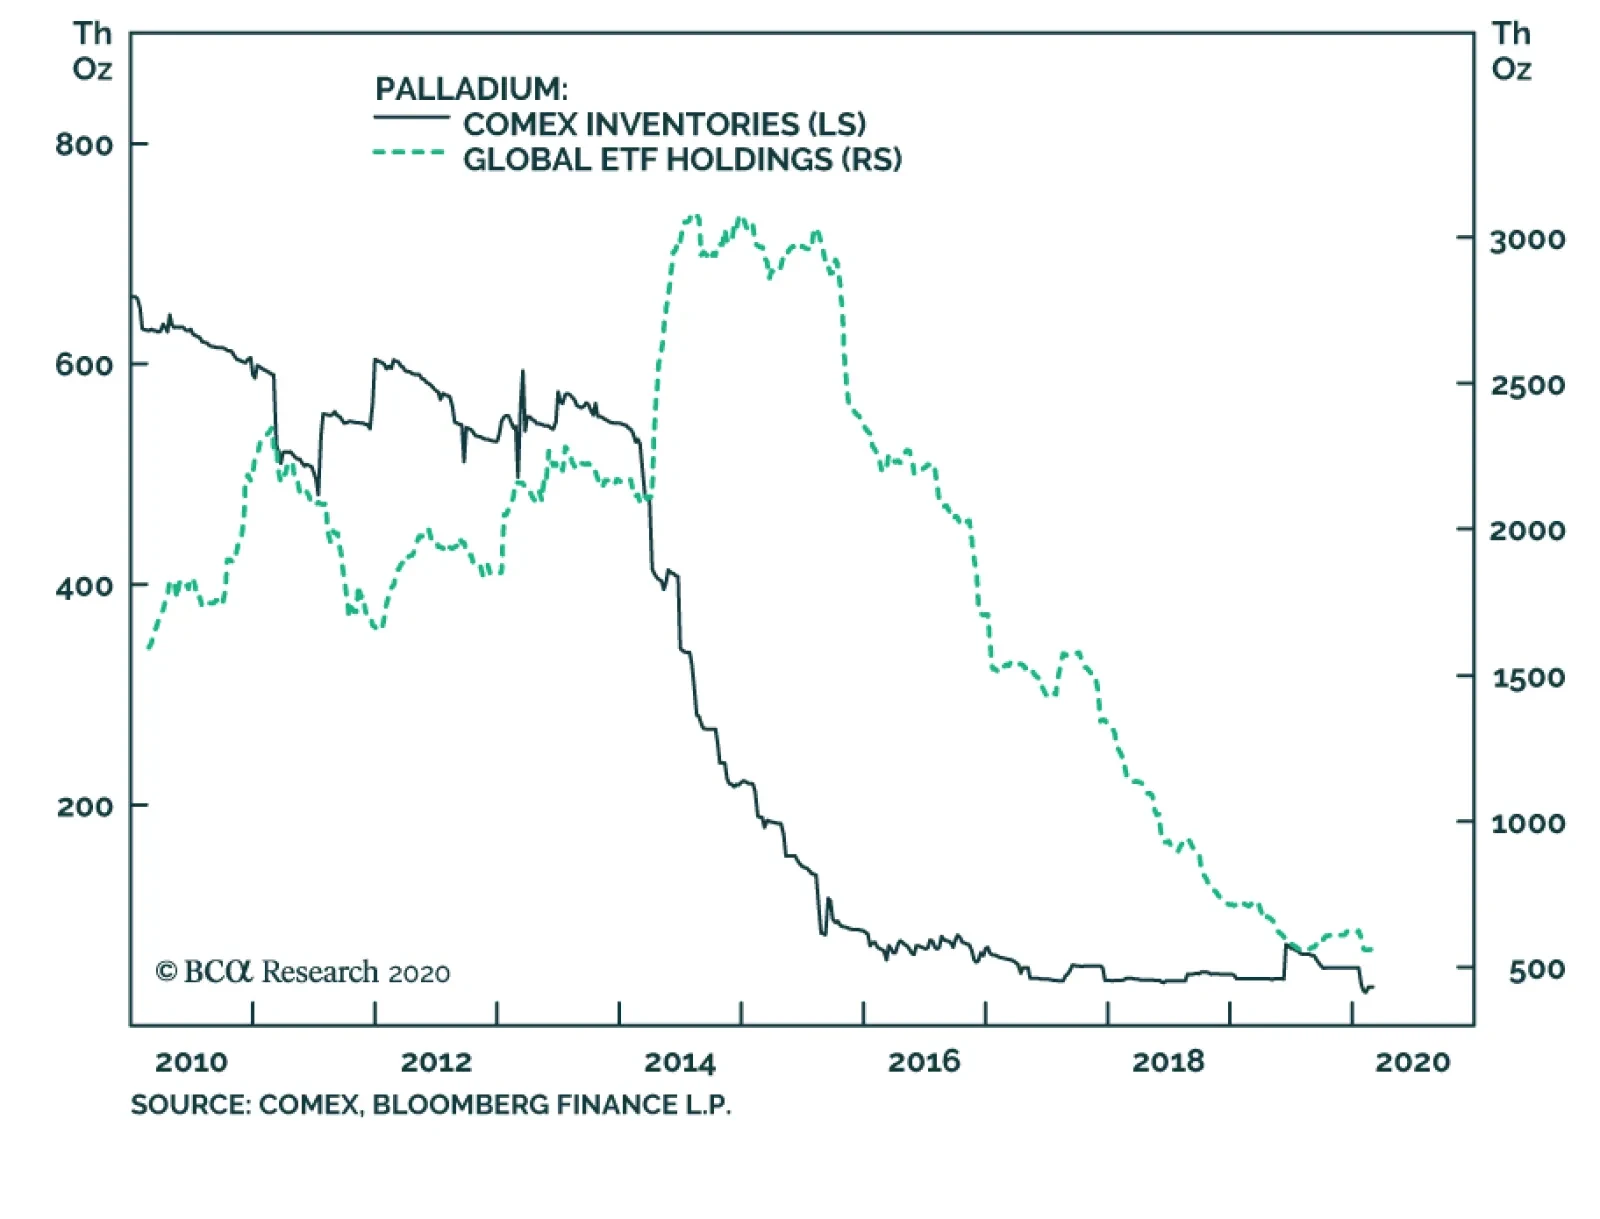
Again this year, palladium markets are fundamentally tight and unresponsive to macroeconomic uncertainty. Palladium prices soared 39% YTD, its fastest 40-day increase since 2010. Unlike other commodity markets, palladium is completely disregarding the COVID-19 outbreak that originated in China late last year. Favorable supply-side fundamentals continue to drive the palladium rally: The metal’s decade-long physical supply deficit intensified in 2019 and we expect it to widen this year (Chart 2, panel 1). On the demand side, Chinese consumption is at risk. China is the world’s largest auto manufacturing market. Hubei Province – COVID-19’s epicenter – is a large car manufacturing hub, accounting for ~ 10% of the country’s annual automobile output. In the wake of COVID-19, the country’s car production is expected to fall 10% in 1Q20. In addition, the virus had infected more than 80,000 people globally, and has spread rapidly outside Hubei into Asia, Europe, the Middle East, Africa, and North America, raising the odds of a pandemic. Interestingly, speculative positioning and ETF investment demand is subdued, and is not inflating prices (Chart 2, panel 2). Chart 2Palladium Deficit To Widen This Year
Epic Palladium Rally Likely Continues
Epic Palladium Rally Likely Continues
Palladium Demand Soars As Auto Production Collapses Strong global automobile catalyst demand drove the rally in palladium prices last year. This occurred as car production fell by 9%, 8%, and 15% in US, China, and India – an unusual divergence in fundamentals. The culprit: Technical changes to autocatalysts from stricter emissions regulations. In China, the latest phase of car emissions regulations – China 6 – was gradually introduced in high-population centers, which also suffer from high levels of pollution. These centers accounted for ~ 60% of annual Chinese car sales in 2019. China 6 represents a major shift in emissions regulations and will make the Chinese auto fleet compliant with Europe’s best practices. As a result, palladium loadings in conforming light-duty gasoline vehicles reportedly increased by ~20% in 2019. This pushed China’s autocatalyst consumption up by 570k oz despite the drop in annual car sales, which created the rare dislocation between the country’s car production and palladium prices (Chart 3). We expect this trend to continue this year: China 6 is on track to be enforced countrywide – i.e., the remaining 40% of car sales – by mid-year, providing an additional ~ 10% boost in loadings of the metal. Chart 3Stricter Regulations Support Prices Amid Falling Car Production
Epic Palladium Rally Likely Continues
Epic Palladium Rally Likely Continues
In Europe, the introduction of Euro 6c legislation in September 2018 and the extension to all new vehicles of Euro 6d-TEMP regulations in September 2019 – mainly the real driving emissions (RDE) testing procedure adopted in the wake of the Volkswagen “dieselgate” scandal in 2015 – pushed palladium loading in autocatalysts up by ~ 25% from 2017 to 2019.1 The regulations became stricter in January 2020, putting additional stress on manufacturers to comply with the new standards, which will continue to support higher palladium loadings. We expect the COVID-19 outbreak to delay the recovery in global gasoline-powered vehicle production and consumption to 2H20. Lastly, in the US – which remains an important market for autocatalyst palladium demand (Chart 4) – the ongoing implementation of the Tier 3 legislation will continue to gradually increase palladium content in autocatalysts until 2025. For 2020, we do not expect this to significantly boost loadings per vehicle and are factoring in 2% growth. These legislative changes in major automotive markets produced a structural break in our palladium demand model (Chart 5). After adjusting our estimates for greater palladium content in gasoline aftertreatment systems, our model suggests that demand provides strong support to palladium prices, but also suggests other factors – i.e. supply and inventory – are at play. Chart 4North America's Auto Sector Remains A Large Share Of Palladium Demand
Epic Palladium Rally Likely Continues
Epic Palladium Rally Likely Continues
Chart 5Higher Palladium Loadings Largely Explains Last Year's Price Surge
Epic Palladium Rally Likely Continues
Epic Palladium Rally Likely Continues
In the US and Europe, consumers can absorb higher vehicle sales despite being close to saturated in terms of vehicle ownership. We expect the COVID-19 outbreak to delay the recovery in global gasoline-powered vehicle production and consumption to 2H20. In China, we expect the government will overstimulate its economy to meet its long-term goal of doubling its GDP and per capita income by 2020.2 Automobile ownership and vehicle sales there are low vs. DM economies, suggesting more upside for sales in China (Chart 6). In the US and Europe, consumers can absorb higher vehicle sales despite being close to saturated in terms of vehicle ownership. Car sales move in cycles around long-term demographic trends: The longer the current economic expansion, the further above-trend car sales can rise (Chart 7). Chart 6China: Structural Outlook For Autos Is Bright China Car Consumption Will Rebound In 2H20...
Epic Palladium Rally Likely Continues
Epic Palladium Rally Likely Continues
Chart 7... Likewise For Europe And US
Epic Palladium Rally Likely Continues
Epic Palladium Rally Likely Continues
Bottom Line: The combination of stricter environmental regulations in key gasoline-powered automobile markets and the post-coronavirus rebound in global auto consumption will push the palladium market further in deficit this year as it faces an inelastic supply, critically low inventories and low substitutability over the short-term (more on this below). Palladium Supply In 2020: Weak growth And Low Price-Elasticity Palladium supply is highly constrained. The largest supplies are concentrated in Russia (42%), South Africa (36%) and North America (14%). From 2015 to 2019, supply and capex grew by a very subdued 7% and 15.2% respectively, completely disregarding the 200% rise in prices (Chart 8, panel 1). This illustrates palladium supply’s extremely low price-elasticity.3 Palladium supply growth will remain muted for the foreseeable future, as Eskom begins long-delayed maintenance to refurbish its derelict generation fleet. Primary supplies declined by close to 2% last year on falling shipments from Russia and record electricity load-shedding – i.e. blackouts – in South Africa (Chart 8, panel 2).4 As tight as palladium markets are fundamentally, South Africa’s crippled power grid – long in need of upgrading and repair – has been, and remains, a key driver of short-term platinum-group metals (PGM) prices.5 Following the breakdown of close to 25% of the country’s generating capacity, Eskom – the nation’s utility monopoly responsible for ~ 90% of its electricity generation – has been forced to implement rolling blackouts to balance power supply and demand and prevent permanent damage to the country’s power grid. Palladium supply growth will remain muted for the foreseeable future, as Eskom begins long-delayed maintenance to refurbish its derelict generation fleet. Consequently, Stage 6 load-shedding events likely will become more frequent. These efforts are complicated by massive debt – ~ $30 billion – which has required government bailouts and forced the company to take loans from a Chinese industrial bank. Chart 8Top Palladium Producers' Capex Price-Elasticity Is Low
Epic Palladium Rally Likely Continues
Epic Palladium Rally Likely Continues
This is playing havoc with PGM supplies. During the unmatched Stage 6 load-shedding in December 2019 – cutting power to 37% of grid users – PGM supplies were reduced by 50%. Stockpiles covered the loss, but persistent blackouts lasting years could push markets into an actual shortage of palladium as inventories would rapidly be depleted. This is a significant risk: Eskom itself warned rolling blackouts will persist for the next 18 months.6 Elevated local currency PGM prices are postponing announced shafts closures, as miners seek to profit from the favorable pricing environment (Chart 9). But insufficient electricity capacity will weigh on mine supply growth over the next few years as companies hold-back on much-needed long-term investments. The final units of Eskom’s Medupi and Kusile projects are expected to be completed over the next two years – adding 4800MW to its installed capacity. This can partially alleviate South Africa’s electricity difficulties, but these units are not enough to support a rebound in economic and mine production growth. South Africa is in profound need of large-scale investments in its power sector. Close to 5000MW of power capacity is scheduled to shut down over the next five years (Chart 10). Chart 9Favorable Domestic Metal Prices For South African Miners
Epic Palladium Rally Likely Continues
Epic Palladium Rally Likely Continues
Chart 10South Africa Needs Additional Power Generation Capacity
Epic Palladium Rally Likely Continues
Epic Palladium Rally Likely Continues
After years of pressure from mining companies, South Africa’s minister of Mineral Resources and Energy announced it would allow companies to generate unlimited electricity for their own activities. The current political and economic climate is not constructive for meeting this challenge. The World Bank recently slashed South Africa’s 2020 GDP growth forecast to 0.9% from 1.5% previously on the back of electricity and infrastructure constraints impeding domestic growth and weak external demand. Likewise, rating agency Moody's signaled – ahead of its review of South Africa’s Baa3 credit rating in March – it could downgrade the country to speculative grade, citing the detrimental impact of recurring power outages on manufacturing and mining output. After years of pressure from mining companies, South Africa’s minister of Mineral Resources and Energy announced it would allow companies to generate unlimited electricity for their own activities. This will provide much-needed help to the country’s power sector. According to the Minerals Council South Africa, mining companies could bring an additional ~ 1500MW capacity online in the next 9 to 36 months. But doubts remain with regard to the timeline for companies to obtain the necessary licenses and if these can easily be acquired. Johnson Matthey expects supply growth in Russia – the largest producer – will be capped this year as Nornickel’s processing of old mines' copper concentrate – which boosted the company’s palladium supply over the past few years – is finalized. Still, a paltry 1% gain is possible from expected efficiency gains at existing mines, according to Nornickel. The company also announced it will increase production at its Talnakh and South Cluster mines, but this additional supply will only reach markets gradually as processing capacity constraints won’t be resolved until 2023, according to Johnson Matthey. Bottom Line: Growth prospects in the top two palladium-producing countries are weak in 2020. This will not suffice to meet the soaring autocatalyst demand. Higher recycling and inventory releases – both incentivized by higher prices – will be needed to balance the market. Palladium Stockpiles Are Dangerously Low We expect palladium prices will move higher on the expanding deficit, and backwardation in the forward curve will persist to incentivize the release of inventories to market (Chart 11). Yet, global palladium stockpiles have been declining since 2014 and are now at critically low levels, raising the risk of a disrupting shortage of the metal:7 ETF and exchange inventories now stand at a paltry 600k oz (Chart 12). These are the most price-elastic stocks and will get close to zero as prices increase. Chart 10Expect Backwardation To Persist
Epic Palladium Rally Likely Continues
Epic Palladium Rally Likely Continues
Chart 12Price-Sensitive Stockpiles Are Dangerously Low
Epic Palladium Rally Likely Continues
Epic Palladium Rally Likely Continues
Exhaustion of inventory would spike prices until demand destruction or additional supply – both inelastic in the short-run – are able to balance the market. The Russian Ministry of Finance’s reserves – a state secret – are now almost exhausted, according to Russia’s Norilsk Nickel, the largest supplier of physical palladium in the world. Last year, Norilsk Nickel held an estimated 1mm oz of the metal in its Global Palladium Fund, and signaled it is increasingly using its reserves to balance markets and provide needed liquidity. Earlier this year, the company released 3 MT of palladium to the market from stocks. Complete exhaustion of inventory would spike prices until demand destruction or additional supply – both inelastic in the short-run – are able to balance the market. Don’t Count On Substitution, Yet Switching to platinum requires significant capital- and resource-intensive R&D and appears to be beyond the current capabilities of automakers. We expect platinum prices to rise in 2020 supported by improving fundamentals, growing safe-haven demand, and markets pricing in increasing anticipation of substitution from palladium to platinum. Unlike palladium, platinum is also affected by safe-haven demand and gets bid up with gold and silver prices in periods of high uncertainty (Chart 13). With gold prices now above $1,600/oz, platinum will benefit from safe-haven flows due to its relative price advantage (Chart 14). Chart 13Safe-Haven Flows Support Platinum Prices
Epic Palladium Rally Likely Continues
Epic Palladium Rally Likely Continues
Chart 14Platinum Is Cheap Relative To Gold
Epic Palladium Rally Likely Continues
Epic Palladium Rally Likely Continues
We believe substitution will commence over the coming years, but this is a gradual process. Substitution from expensive palladium to low-priced platinum in industrial applications is the largest risk to our positive view on the palladium-to-platinum (Pd-to-Pt) ratio (Chart 15). This started in smaller and more price-elastic segments (e.g. dental, jewelry and diesel autocatalyst). However, to have a real impact on overall demand and thus the price ratio, substitution needs to take place in gasoline autocatalyst technology. The discount has been at a level consistent with substitution for more than a year, but the urgency to upgrade current designs to meet new environmental legislation and RDE regulations in China, Europe, and the US is the main focus of automakers this year. Switching to platinum requires significant capital- and resource-intensive R&D and appears to be beyond the current capabilities of automakers scrambling to meet the latest anti-pollution regulations globally. Moreover, large-scale substitution will take place only if automakers’ cost-benefit analysis points to significant long-term profits from switching. That said, platinum’s supply security remains a risk in the long-term: South Africa accounts for 73% of global production and our analysis suggests output growth there likely will remain weak over the next few years, especially as Eskom rebuilds its failing power grid. This lack of diversity increases sourcing risks for automakers, who, not without reason, would not want to switch over to platinum only to find that supply is also in doubt down the road. The overall platinum market is 26% smaller than that of palladium. Assuming a one-for-one substitution of Pd to Pt in gasoline catalyzers, a 1.2mm oz reduction in Pd demand – the amount required to reduce palladium’s deficit to zero – would send platinum markets to a 1.4mm oz deficit.8 Without substantial production growth, platinum prices would spike, reducing the profitability of investing in these new catalysts. Thus, substitution will eventually impact the price ratio, but will not be large enough to overturn absolute price level trends. In addition, the amount of PGMs in the typical autocatalyst – ~ 5 grams – adds $400 to the cost of the average automobile (Chart 15, lower panel). We do not believe this cost drives automakers' decisions, which is another reason the substitution of Pt for Pd likely will remain a topic of discussion more than action. Chart 15Palladium's Price Surge Adds ~0 Per Gasoline Car
Epic Palladium Rally Likely Continues
Epic Palladium Rally Likely Continues
Bottom Line: We believe substitution will commence over the coming years, but this is a gradual process and it will not happen on a meaningful scale this year. Thus, we expect the continuation of relative demand and inventory trends will provide a favorable setting for the Pd-to-Pt ratio this year (Chart 16). Chart 16Pd-to-Pt Price Ratio Will Increase Again in 2020
Epic Palladium Rally Likely Continues
Epic Palladium Rally Likely Continues
Hugo Bélanger Associate Editor Commodity & Energy Strategy HugoB@bcaresearch.com Robert P. Ryan Chief Commodity & Energy Strategist rryan@bcaresearch.com Commodities Round-Up Energy: Overweight Brent and WTI crude oil lost 5% and 4% this week, as fears of a global pandemic in the wake of the COVID-19 outbreak gripped markets. Reports of outbreaks in Asia ex-China, the Middle East and Europe fueled these concerns. Against this backdrop, OPEC 2.0 will be meeting in Vienna March 5 and 6 to consider cuts of 600k b/d recommended by its technical committee earlier this month. We continue to expect the full coalition to approve these cuts at the upcoming meetings. Saudi Arabia, Kuwait and the United Arab Emirates reportedly are considering an additional 300k b/d of cuts to offset the global demand hit delivered by COVID-19. The IEA estimates the COVID-19 outbreak will reduce Chinese refining throughput by 1.1mm b/d, and will reduce the call on OPEC crude by 1.7mm b/d in 1Q20. Base Metals: Neutral Iron ore prices weakened, following global equities lower, as the COVID-19 outbreak spread around the world. However, traders continue to report lower stocks of iron ore, which should keep prices supported, according to MB Fastmarkets (Chart 17). We remain long December 2020 high-grade iron ore (65% Fe) vs. short the benchmark 62% Fe contract on the Singapore Commodity Exchange, which we initiated November 7, 2019. This recommendation was up 5.3% as of Tuesday’s close, when we mark to market. Precious Metals: Neutral After retreating slightly from its run toward $1,700/oz earlier this week, gold remains well supported by safe-haven demand (Chart 18). In addition, actual and expected policy stimulus – e.g., Hong Kong's “helicopter money” drop of USD 1,200 to all permanent residents over the age of 18 – and expectations of additional central bank easing globally to offset the global spread of COVID0-19 will keep gold and precious metals generally supported. Markets should start pricing in higher inflation expectations as additional stimulus starts to roll in. Ags/Softs: Underweight Global grain markets could be set to rally sharply, as unusually wet weather in the Middle East and East Africa spawned by higher-than-usual cyclone activity produces perfect breeding conditions for desert locusts in the region over the next two months. According to National Geographic, by June the locusts could increase their populations “400-fold compared with today, triggering widespread devastation to crops and pastures in a region that’s already extremely vulnerable to famine.” This could put more than 13mm people in East Africa at risk of “severe acute food insecurity,” and imperil millions more. Chart 17China's Iron Ore Stocks Tight
Epic Palladium Rally Likely Continues
Epic Palladium Rally Likely Continues
Chart 18Safe Havens Gold, USD Well Bid
Epic Palladium Rally Likely Continues
Epic Palladium Rally Likely Continues
Footnotes 1 Please see New legislation planned in response to dieselgate, published by Autocar June 9, 2016. See also Johnson Matthey’s February 2020 Pgm Market Report. 2 Our view of strong Chinese fiscal and monetary stimulus was discussed in detail in our February 13, 2020 weekly report titled Iron Ore, Steel Poised For Rally. 3 Historically produced as an inferior byproduct from nickel, gold, and platinum mines, the price incentive from palladium alone isn’t enough to generate the needed investments in new mine production. According to Nornickel, this is slowly changing, palladium is an increasingly large part of mining companies’ revenues, making the metal a valuable co-product. This could improve mines investments’ responsiveness to movement in palladium prices over the medium term. 4 According to Eskom, “Load shedding is aimed at removing load from the power system when there is an imbalance between the electricity available and the demand for electricity. If we did not shed load, then the whole national power system would switch off and no one would have electricity.” The company’s load-shedding program includes 8 stages, where each stage represents the removal of 1000MW of demand – e.g., stage 5 removes 5000MW. This is done by shutting down specific sections of the grid. 5 The PGMs are ruthenium, rhodium, palladium, osmium, iridium, and platinum. 6 Things got worse after the December load-shedding event. Less than a month later, Reuters noted more than two times the power shed in December went “offline because of plant breakdowns. 7 This can be seen in the close to 12mm oz. decline in UK and Switzerland – home of the largest secured vaults of Palladium and Platinum – net imports. 8 Technological improvement in palladium catalysts has made the metal more efficient in for gasoline-powered engines vs. platinum. It has superior properties in terms of thermal durability and NOx reduction. Thus, the conversion could be greater than 1-to-1 and would imply a smaller share of palladium autocatalyst substitution could be absorbed by existing platinum supplies. Investment Views and Themes Recommendations Strategic Recommendations Tactical Trades TRADE RECOMMENDATION PERFORMANCE IN 2019 Q4
Epic Palladium Rally Likely Continues
Epic Palladium Rally Likely Continues
Commodity Prices and Plays Reference Table Trades Closed in 2020 Summary of Closed Trades
Epic Palladium Rally Likely Continues
Epic Palladium Rally Likely Continues
Highlights Investors’ hunt for yield over the past few years has increasingly led them to view emerging markets debt (EMD) as an attractive component of portfolios. EMD should not be viewed as one homogeneous asset class. Investors should distinguish between its key segments: hard-currency sovereign debt, hard-currency corporate debt, and local-currency sovereign debt. EMD allows investors to own bonds with higher yields than DM sovereign or corporate bonds. But it comes with specific risks that investors need to understand. EMD, being a highly cyclical asset class, should perform well in an environment of accelerating global growth – which we expect to see during 2020. Within this asset class, we favor EM hard-currency sovereign bonds over both EM hard-currency corporate debt and local-currency sovereign bonds. However, the coronavirus outbreak makes us reluctant to pull the trigger on this recommendation now. Rather, we are placing EM hard-currency sovereign debt on upgrade watch. Feature Emerging markets debt (EMD) as an asset class has grown over the past decades to over US$24 trillion in bonds outstanding – becoming an integral part of the global investment universe, and presenting an interesting investment opportunity for investors. The EMD universe, which was previously dominated by sovereign issues in hard currencies, has become more diverse, and consequently, difficult for investors to ignore. In this Special Report, we identify the segments that make up EMD and the various exposures that investors face when allocating to it. We analyze their risk-return characteristics and the drivers contributing to their returns, and compare EMD to other asset classes. We conclude by identifying any diversification benefits that investors can reap as the hunt for yield continues. Introduction Estimates value total debt in emerging markets at over $24 trillion as of Q2 2019. This includes both sovereign and corporate debt, in both local and hard currencies (Chart 1).1 The bulk of EMD, however, is in local currencies – almost 90%. Chart 1Estimates Of Total EMD
Understanding Emerging Markets Debt
Understanding Emerging Markets Debt
In this Special Report, we focus on the following three segments of emerging markets debt (EMD): Sovereign debt issued in hard currency – the majority of which is USD denominated – estimated at $2 trillion. I. We distinguish between “pure” sovereigns and quasi-sovereign bonds. Corporate debt2 issued in hard currency – mainly in USD – estimated to be $1.5 trillion. Sovereign debt issued in local currency – estimated at $10.3 trillion. We do not cover local-currency corporate debt, as more than half of it – estimated to be $8.1 trillion – is issued by Chinese firms and is hard to access for most investors. Each of these segments offers an array of opportunities, is driven by different dynamics, and bears risks that investors must recognize before allocating to it. We recommend clients view the segments of EMD as different asset classes, rather than an aggregate. Hard-Currency Debt Hard-currency EMD refers to debt issued by governments and firms in emerging markets that is denominated in a currency other than their local currency. Estimates suggest 90%-95% of total hard-currency debt is USD denominated, with the remaining in euros and yen. The main feature of hard-currency EMD is that it provides investors with protection against currency depreciation risk. Nevertheless, it is important to highlight that currency movements can affect spreads, default risk, as well as liquidity. If a country’s currency depreciates, its ability to service its foreign debt deteriorates. This is crucial, as exemplified by currency crises over the past few years in countries such as Argentina, Turkey, Egypt, and Venezuela. Hard-Currency Sovereign Debt Since 2004, EM hard-currency sovereign bond investors have enjoyed an annualized total return of 7.4%, much higher than the 3.2% from the global Treasury index. Even on a risk-adjusted return basis, the incremental performance compensates for the additional 1.7% of annualized volatility. Investing in EM hard-currency sovereigns allows investors to find higher-yielding debt than government bonds in developed economies. Since 2004, the average yield on EM hard-currency sovereign debt was 6.1%, 3.8 percentage points higher than the 2.3% on their DM counterparts. Investors received positive returns even in real terms, as inflation in DM and the US have averaged 2.2% and 2.1% respectively, since 2004 (Chart 2). This has been extremely useful, particularly in the past few years, when bond yields in many developed economies reached zero or turned negative, and investors increasingly hunted for yield. The risk profile of the aggregate EM sovereign debt index is balanced between the safer Middle Eastern economies such as Saudi Arabia, UAE, and Qatar, and the riskier Latin American economies such as Mexico, Brazil, and Argentina. Those two buckets each comprise approximately 30% of the index, with the remainder of the index split between Asia, Emerging Europe, and Africa at 17%, 11%, and 10%, respectively (Chart 3). Other portfolios are benchmarked to J.P. Morgan’s indexes where Gulf countries have very little weight. Chart 2EM USD-Sovereigns Provide Value To DM Investors
Understanding Emerging Markets Debt
Understanding Emerging Markets Debt
Chart 3Risk Profile Of EM USD-Sovereigns
Understanding Emerging Markets Debt
Understanding Emerging Markets Debt
We believe it is reasonable to compare hard-currency EM sovereign debt to US investment-grade bonds due to their shared characteristics. Both have comparable duration (approximately eight years) and similar credit qualities, despite EM sovereign debt being a little riskier on average than the US corporate market (Chart 4). Nevertheless, since 2004, EM sovereign hard-currency debt has outperformed US investment-grade bonds by 40% – although its outperformance has lost steam over the past few years (Chart 5). Chart 4EM USD-Sovereigns Are Slightly Riskier Than US Investment-Grade Bonds
Understanding Emerging Markets Debt
Understanding Emerging Markets Debt
Chart 5EM USD-Sovereigns Have Outperformed US IG Bonds...
Understanding Emerging Markets Debt
Understanding Emerging Markets Debt
This does not mean that EM debt is immune to problems.3 The cumulative average default rate of EM foreign-currency sovereign debt – while lower than US corporates – remains high and is more pronounced as one goes down the credit-rating curve (Table 1). Idiosyncratic country risks can skew the data. If one excludes Argentina – currently weighted at only 3.5% – from the index, almost 100 basis points of spread get shaved off (Chart 6). Table 1…However, Beware Of The Default Rates
Understanding Emerging Markets Debt
Understanding Emerging Markets Debt
Chart 6Excluding Argentina, Spreads Are Much Lower
Understanding Emerging Markets Debt
Understanding Emerging Markets Debt
Given that most of our clients invest through passive vehicles, throughout this report, we focus on the EM aggregate indexes rather than on specific countries. However, it is important to identify over/undervalued countries, given the wide-ranging risk-profile spectrum of emerging economies. By drawing a US corporate credit curve, based on credit ratings and breakeven spreads, one can spot over- or undervalued countries relative to US investment-grade bonds. Currently, the sovereign bonds of Poland, UAE, Qatar, and Saudi Arabia appear to be more attractively valued than those of Russia, Hungary, and Brazil. The charts also show the transition of these countries across time (Chart 7, A,B,C,D). Chart 7Country Selection Is Important…
Understanding Emerging Markets Debt
Understanding Emerging Markets Debt
Chart 8...With The UAE And Saudi As Good Examples
Understanding Emerging Markets Debt
Understanding Emerging Markets Debt
For example, South African sovereign bonds – given their current credit rating and spreads – have moved from being overvalued relative to US corporates to undervalued over the past five years. This implies a buying opportunity, or simply that they are getting cheaper ahead of a potential downgrade. For investors with less restricted mandates, country selection can be very valuable. For example, the UAE and Saudi Arabia, two highly rated economies at Aa2 and A1 respectively, trade at 23 and 30 basis points over similarly rated US corporate bonds (Chart 8). We find that EM hard-currency sovereign spreads are mainly driven by global growth cycles, something BCA Research’s Emerging Market strategists have often highlighted.4 We rely on several key indicators to gauge where we are in the cycle. These include Germany’s IFO manufacturing business expectations, global and emerging market PMIs, as well as OECD’s Leading Economic Indicators (LEI) (Chart 9). Upward moves in these indicators have historically led to a tightening in EM sovereign spreads. Chart 9Spreads Will Tighten Once Global Growth Picks Up
Understanding Emerging Markets Debt
Understanding Emerging Markets Debt
Quasi-Sovereign Bonds Chart 10Quasi-Sovereigns Are Focused In The Energy Sector
Understanding Emerging Markets Debt
Understanding Emerging Markets Debt
Investors need to differentiate between EM sovereign bonds and quasi-sovereign bonds. While formal definitions vary among market participants and academics, the most common definition of “quasi-sovereign” is bonds issued by an entity where the government either fully owns the institution, controls more than 50% of its equity, or has a majority of its voting rights.5 Examples of such companies include Brazil’s Petrobras, Mexico’s Pemex, and Venezuela’s PDVSA. One reason why we highlight quasi-sovereigns is the rapid growth in the amount of such debt outstanding.6 As of January 2020, the quasi-sovereign bond market has grown by over US$630 billion throughout the past decade to US$714 billion and it now makes up over 42% of the combined EM Sovereign amd Quasi-Sovereign Bloomberg Barclays index. The oil & gas sector represents over a third of quasi-sovereign entities (Chart 10). Chart 11Quasi-Sovereigns...A Defensive Play On Corporate Bonds
Understanding Emerging Markets Debt
Understanding Emerging Markets Debt
Some investors assume that a quasi-sovereign entity would have the full backing of its government. While that is true in most cases, the majority of quasi-sovereign bonds only have an “implicit” backing from the issuer’s government, meaning that the government holds no legal liability in case of default. Dubai World, a state-owned conglomerate, was a perfect example of this during the aftermath of the Global Financial Crisis. The government stood on the sidelines as the firm went through financial distress, forcing billions of dollars of debt to be restructured.7 Given this additional level of uncertainty and corporate risk, EM quasi-sovereign bonds trade at higher spreads than their sovereign counterparts (Chart 11). Nonetheless, bonds with even the simplest implicit backing from the government are considered a more defensive play than “pure” corporate bonds, which trade at even higher spreads. Hard-Currency Corporate Debt The increase in quasi-sovereign issuance has been a big factor in the growth of the hard-currency corporate-debt universe – a segment that became of interest to investors in the early 2000s. The outstanding amount of hard-currency corporate debt has surpassed hard-currency sovereign debt, according to the Bank Of International Settlements (BIS) (Chart 1). The EM corporate debt index8 has similar sector exposure to the MSCI EM equity index. Almost 69% of the bond index is concentrated in the Industrials category,9 with the Financial/Banking and Utilities sectors making up the remaining 26% and 5%, respectively (Chart 12). The Technology sector is an exception – comprising only 5% of the corporate bond index compared to over 16% in the equity index. The country exposure, however, is less skewed to Asian economies compared to equities (Chart 13). Chart 12EM Corporates Provide Similar Sector Exposure To Equities…
Understanding Emerging Markets Debt
Understanding Emerging Markets Debt
Chart 13…Yet With Different Country Exposure
Understanding Emerging Markets Debt
Understanding Emerging Markets Debt
Chart 14EM Corporates: A Defensive Play On Equities...
Understanding Emerging Markets Debt
Understanding Emerging Markets Debt
The overlap in sector coverage can be advantageous to investors who want quasi-exposure to EM equities but with much lower volatility. The same can be said for DM corporate bonds, whose return is highly correlated to equities but with about one-third the beta.10 The correlation between EM corporate bonds and EM equities is currently close to its post-2003 average of 0.61, and the beta of EM corporate bonds to EM equities has averaged only 0.13 (Chart 14). Despite having a lower annualized return11 than EM equities, 5.6% versus 8.3%, EM corporate bonds had almost half the realized volatility, and so outperformed equities on a risk-adjusted basis. In fact, since late 2007, they have generally outperformed EM equities even in absolute terms, despite a few periods of EM equity outperformance. Like sovereigns, EM corporate bonds provided investors with a cushion against equity downside risk. For example, during the 2015/2016 slowdown in China and emerging economies, EM equities fell by almost 28%, whereas EM corporate bonds fell by only 5% (Chart 15). Chart 15...With Lower Drawdowns
Understanding Emerging Markets Debt
Understanding Emerging Markets Debt
On a valuation basis, however, EM corporate bonds have looked unattractive relative to EM equities, providing investors with 4% real yield, compared to an equity earnings yield of 7% since 2004 (Chart 16). Nevertheless, the current level of spreads points to moderate returns for the asset class, slightly below 4% annualized over the next five years, assuming that historical default and recovery rates remain the same, and no change in spreads (Chart 17). This implies that exposure to emerging markets via corporate bonds should be more attractive than equities on a risk-adjusted basis.12 Chart 16EM Corporate Bonds Are Unattractive Compared To Equities
Understanding Emerging Markets Debt
Understanding Emerging Markets Debt
Chart 17Forward Returns Driven By The Spread
Understanding Emerging Markets Debt
Understanding Emerging Markets Debt
EM corporate debt is similar to its sovereign counterpart in the range of risk profiles of its constituents. Default figures vary significantly by region and during different crises. For example, the hard-currency corporate default rate for Argentinian corporates peaked at slightly over 50% during the 2001/2002 sovereign debt crisis, while for Chile and Mexico it remained below 10%. Surprisingly, default rates in emerging market corporate speculative-grade debt have on average been below those of both the US and Europe (Chart 18). Additionally, the 12-month trailing default rate for the overall EM corporate universe, as measured by Moodys’ Investors Service, at the end of 2018 was lower than for advanced economies – at 1.4% versus 1.6%.13 Chart 18Default Rates In EM Are Surprisingly Lower Than In DM
Understanding Emerging Markets Debt
Understanding Emerging Markets Debt
Chart 19EM Corporates Suffer From Weaker Balance Sheets
Understanding Emerging Markets Debt
Understanding Emerging Markets Debt
EM corporate spreads are driven by a few main variables – revenue and profit growth, the business cycle, and the exchange rate. The health of EM corporates is also an important factor. This is an area of concern as corporate leverage levels have risen since 2010, and EM firms’ ability to service debt – gauged by their interest-coverage ratio – has fallen to below 2008 levels (Chart 19). Political turmoil can upset markets. Even though investors do not face the risk of currency depreciation with hard-currency debt, EM corporates with revenues mostly in local currency, face higher debt-repayment risk during a slowdown in their economies. Local-Currency Sovereign Debt Chart 20There Is Value In EM Local-Currency Bonds
Understanding Emerging Markets Debt
Understanding Emerging Markets Debt
Emerging-market governments, to avoid foreign currency liquidity crunches, have in recent years shifted some of their debt issuance to their own currency. However, to attract investors, yields on local-currency sovereign bonds have to compensate for the added layer of currency risk as well as conventional sovereign risk. Over the lifetime of the index,14 since 2003, yields on local-currency sovereign debt have averaged 6.7%, compared to 2.5% for the US Treasury index, 2.4% for the euro area treasury index, and 0.63% for the Japanese treasury index (Chart 20). Since 2004, EM local sovereign bonds have provided investors with attractive returns. On an annualized basis, they have returned 8.4% and 6.8% in local terms and dollar terms, respectively, albeit with higher volatility than their hard-currency counterparts on a common-currency basis (Table 2). However, those returns remain higher than those of government bonds in developed economies such as Germany and Japan, both in local- currency terms and on an unhedged basis from a USD perspective. Table 2EM Local-Currency Bonds Outperforming Other DM Government Bonds In USD And Local Currency Terms
Understanding Emerging Markets Debt
Understanding Emerging Markets Debt
Investors allocating to this segment assume a simple yet plausible notion: that EM economies will never default on debt issued in their own currency, as they can easily “print more money”. This is partially correct: default rates across rated EM sovereign local debt remain lower than for foreign-currency sovereign debt (Table 3). Table 3Default Rates: Local-Currency Debt Versus Hard-Currency Debt
Understanding Emerging Markets Debt
Understanding Emerging Markets Debt
Most interestingly, the gap in default rates between B- and CCC-rated bonds illustrates the “near certainty” of default for low-credit-rated sovereigns ahead of time. However, proponents of the notion that governments will not default neglect the consequences those economies will suffer if they monetize public debt: currency devaluation and high inflation, which turn into weak economic growth and tightening monetary policy, leading to a further weakening in growth. The case of Argentina between 1998 and 2002 is a perfect example of this mechanism. The economy was hurting under an uncompetitive pegged currency as well as a large debt burden. The government’s move to increase taxes, as a solution to boost government revenues, triggered a cascade of events which resulted in faltering economic growth, increased unemployment, abandonment of the currency peg, and interest rates as high as 100%, ultimately leading to Argentina’s default on its local-currency sovereign debt (Chart 21). Chart 21Argentina: A Case Study
Understanding Emerging Markets Debt
Understanding Emerging Markets Debt
Chart 22Country Breakdown Of Local-Currency EM Sovereigns
Understanding Emerging Markets Debt
Understanding Emerging Markets Debt
Argentina was recently removed from J.P. Morgan’s EM local-currency sovereign index due to the capital controls the authorities have instituted. As of mid-February, Mexico was the largest issuer in the index along with Indonesia, Brazil, and Thailand close behind (Chart 22). J.P. Morgan also announced that it would gradually add Chinese government bonds to its local sovereign bond indexes over a period of 10 months starting February 2020, up to the 10% country cap.15 This move is likely to push the index’s yield lower as Chinese yields are below the current yield on the index. There is some overlap between the drivers of local- and hard-currency sovereign spreads. The most important factor for investors to consider is the direction of emerging market currencies versus the US dollar. This relationship closely tracks inflation differentials between the US and EM economies (Chart 23). Chart 23The Link Between EM Currencies And Inflation
Understanding Emerging Markets Debt
Understanding Emerging Markets Debt
Chart 24The USD Is The Most Important Factor To Consider
Understanding Emerging Markets Debt
Understanding Emerging Markets Debt
The top panel in Chart 24 emphasizes this point. It shows that EM local-currency sovereign bonds from a USD perspective have returned -2.8% since the peak in EM currencies in early 2013. This coincides with a time when EM currencies, on a real effective exchange rate basis, weakened against the US dollar (Chart 24, bottom panel). Other drivers of local-currency sovereign yields include commodity prices, global trade, and EM sovereign bond yields. However, this year has witnessed a significant decoupling between local bond yields and these drivers (Chart 25). Chart 25Sustainable Divergence?
Understanding Emerging Markets Debt
Understanding Emerging Markets Debt
Chart 26Investors Continue To Hunt For Yield In Emerging Markets
Understanding Emerging Markets Debt
Understanding Emerging Markets Debt
Our EM strategists wonder whether we are seeing a “new normal” for EM local bond yields – a paradigm in which they fall, not rise, during periods of slowing global growth and behave similarly to DM yields.16 This, however, would imply that investors view EM local debt as a safe haven rather than a risky asset class. We agree with their conclusion that the recent rally in EM local sovereign bonds – hence the decline in yields – was due, rather, to investors’ hunt for yield in an environment of over $10 trillion of negative-yielding debt (Chart 26). This trend is likely to continue in the short term until there is a sustained pickup in global growth. Once that happens, long-term yields are likely to rise in tandem (Chart 27). Chart 27ALong Term Yields Will Rise When Global Growth Picks Up
Understanding Emerging Markets Debt
Understanding Emerging Markets Debt
Chart 27BLong Term Yields Will Rise When Global Growth Picks Up
Understanding Emerging Markets Debt
Understanding Emerging Markets Debt
Diversification And Portfolio Impact Investors with a broad mandate can think about EMD as part of their overall portfolios. We analyze how the addition of EMD to a monthly rebalanced “conventional” portfolio, consisting of 50% global equities, 30% global treasurys, and 20% global corporate debt (split equally between investment-grade and high-yield bonds), would have performed since 2003. We found that the incremental additions of each of the three segments of EMD – from 5% to 20% each – produced a higher portfolio risk-adjusted return relative to the conventional portfolio. In all cases, replacing global equities, treasurys, and corporate bonds with EM debt, led either to a higher annualized portfolio return, reduced volatility, or sometimes both (Table 4). Unsurprisingly, given the cyclicality of EM assets, the “enhanced” portfolios have a higher correlation with global equities, as well as with DM corporate bonds (Table 5). Table 4Portfolio Simulation: Risk-Return Profiles (Feb. 2003 – Feb. 2020)
Understanding Emerging Markets Debt
Understanding Emerging Markets Debt
Table 5EMD Is Highly Correlated With Global Equities And Corporate Bonds
Understanding Emerging Markets Debt
Understanding Emerging Markets Debt
It is important to note, however, that most of the outperformance from the enhanced portfolios – particularly in the most heavily EMD-tilted portfolios – occurred before the slowdown in emerging economies beginning in 2013 (Chart 28). Since 2013, as the USD appreciated against EM currencies, allocating to EM local-currency sovereign bonds detracted from portfolio returns. During this period other EM risk assets, such as equities and corporate bonds, also underperformed their DM counterparts. Chart 28Allocating To EMD Adds Some Value
Understanding Emerging Markets Debt
Understanding Emerging Markets Debt
Our Current View Over the past few years, GAA has been structurally negative on EM risk assets – both equity and debt. Productivity levels, far below historical averages, have been a key reason for this view (Chart 29). In a previous Special Report, we argued that productivity needs to mean-revert to its historical average for emerging markets to perform well, but that this is unlikely without structural reform. 17 Chart 29Global Productivity Growth Levels
Understanding Emerging Markets Debt
Understanding Emerging Markets Debt
Chart 30Divergence Between Spreads And Growth
Understanding Emerging Markets Debt
Understanding Emerging Markets Debt
Tactically, however, there are times when EM assets can outperform despite the structural headwinds (2016-2017 was an example of this). This could happen again later this year, if global growth continues to rebound. Nonetheless, this optimistic view is on hold due to the risk to global growth in the short term from the coronavirus outbreak. Our global strategists expect global growth to fall to zero in the first quarter of 2020, before picking up throughout the rest of the year – assuming the outbreak is contained within the next few weeks.18 Providing this happens, and our view of global growth reaccelerating pans out, EMD should perform well. Within the asset class, segment selection is key. The environment is likely to be more favorable for EM hard-currency sovereign debt than hard-currency corporate debt or local-currency sovereign bonds. The recent divergence between hard-currency sovereign spreads and growth metric could point to an attractive entry point for investors (Chart 30). We remain cautious on EM corporate bonds, which are vulnerable in the face of sluggish domestic demand in most emerging economies, leading to contracting profits (Chart 31). A weaker USD, when global growth recovers, helped by a dovish stance from the Fed, should keep US financial conditions loose and help EM local-currency sovereign debt perform well (Chart 32). However, relative financial conditions between the US and emerging markets are just as important to monitor. If growth in EM economies fails to pick up, EM currencies could depreciate, putting downward pressure on local-currency sovereign bonds. Chart 31EM Corporates Face Weak Domestic Demand
Understanding Emerging Markets Debt
Understanding Emerging Markets Debt
Chart 32Easier US Financial Conditions Lead To Better EM LC Sovereign Returns
Understanding Emerging Markets Debt
Understanding Emerging Markets Debt
We will wait to pull the trigger on this recommendation until we get further clarity regarding the impact on growth of the coronavirus outbreak. Conclusion EMD has grown to become an interesting asset class for allocators, allowing them to capitalize on bonds with higher yields than their DM counterparts. Not only has EMD provided higher returns, it gives equity-like exposure to emerging markets with significantly reduced downside during recessions and market selloffs. We recommend clients view EMD as three separate segments – hard-currency sovereign debt, hard-currency corporate debt, and local-currency sovereign debt – due to the different dynamics that influence each segment. Global growth, the direction of EM currencies versus the US dollar, and EM domestic demand are the three most important overall factors to consider when allocating to any of the segments of EMD. Amr Hanafy, Senior Analyst amrh@bcaresearch.com Footnotes 1We use the BIS’s definition of international debt securities (IDS) for hard-currency debt, and domestic debt securities (DDS) for local-currency debt. 2Includes both financial and nonfinancial corporations. 3For the purpose of assessing this segment, we use the broad EM and regional Bloomberg Barclays USD Aggregate Sovereign Indices, which track USD-denominated bonds issued by EM governments. Another commonly used index is the J.P. Morgan Chase & Co.’s EMBI Global Diversified Index, which tracks EM hard-currency sovereign debt, as well as fully owned and explicitly guaranteed quasi-issuers. Additionally, J.P. Morgan Chase & Co’s suite of indices following EM Sovereign debt includes their EMBI+ index. This index is primarily focused on EM sovereign issuers, however with a stricter liquidity requirement for inclusion. The reason why we do not rely on this index is due to its tilt towards LATAM and away from Middle Eastern and Asian economies. 4Please see Emerging Markets Strategy Special Report titled, “A Primer On EM External Debt,” available at ems.bcaresearch.com. 5Commercial index providers treat such distinctions by separating quasi-sovereign entities that are/are not fully owned by governments. For example, J.P. Morgan Chase & Co.’s EMBI Global Diversified Index, probably the most widely used index in tracking EM hard-currency sovereign debt, includes sovereign debt as well as fully owned and explicitly guaranteed quasi-issuers in its index. 6Please see “Fears mount over rise of sovereign-backed corporate debt,” Financial Times, dated January 5, 2016. 7Please see “Dubai World secures deal to restructure $14.6bn debt” Financial Times, dated January 12, 2015. 8For the purpose of assessing this segment, we use the broad EM and regional USD Aggregate Corporate Indices, which track USD-denominated bonds issued by EM corporates. 9Includes Basic Industry, Capital Goods, Communication, Consumer Cyclical, Consumer Non-Cyclical, Energy, Technology, and Transportation sectors. 10Please see Global Asset Allocation Special Report, “High-Yield Bonds: Low Volatility Equities?”, available at gaa.bcaresearch.com 11Annualized returns since 2004. 12Please see Global Asset Allocation Special Report, “Return Assumptions – Refreshed and Refined,” available at gaa.bcaresearch.com 13Please see “Emerging market corporate default and recovery rates, 1995 – 2018,” Moody’s Investors Service, dated January 30, 2019. 14For the purpose of assessing this segment, we use the J.P Morgan GBI-EM global diversified index, an investable benchmark accessible to most investors. This index tracks local-currency bonds issued by EM governments. 15Please see “JP Morgan to add China bonds to GBI-EM indexes from February 2020,” Reuters, dated September 4, 2019. 16Please see Emerging Markets Strategy Weekly Report titled, “EM Local Bonds: A New Normal?”, available at ems.bcaresearch.com. 17Please see Global Asset Allocation Special Report titled, “Return Assumptions – Refreshed and Refined,” available at gaa.bcaresearch.com. 18Please see Global Investment Strategy Report titled, “Markets Too Complacent About The Coronavirus,” available at gis.bcaresearch.com.
Hunker Down
Hunker Down
Overweight Global bourses broke down yesterday, succumbing to immense pressure from the coronavirus epidemic gripping South Korea, Italy and Iran. Finally, lower profit growth expectations are weighing on extreme equity market optimism. We remain cautious on the prospects of the broad US equity market and reiterate our January 13 boost to overweight in the global gold mining index versus the MSCI All Country World Index. This portfolio position is already up 16% since the mid-January inception and more gains are in store on the back of the collapse in interest rates and increasing likelihood of fed funds rate cuts. Importantly, in order to gauge the relative attractiveness of this portfolio position at the current juncture, it is instructive to juxtapose global versus US policy uncertainty. Historically, this ratio has been closely correlated with relative share prices and signals that the path of least resistance is higher for gold miners compared with the broad market. Shinning global gold miners are impressive especially given the recent spike in the greenback. As a reminder, the US dollar also flexes its muscles when global uncertainty trumps US uncertainty (bottom panel). Finally, the recent hook up in US economic surprises versus the rest of the world also underpins relative share prices (middle panel). Bottom Line: Stay overweight the global gold mining index via the long GDX:US / short ACWI:US exchange traded funds. From a risk management perspective and in order to protect profits we are setting a trailing stop at the 10% return mark, since inception.
Global energy stocks are nudging into their 12th year anniversary of a bear market in relative performance terms. This represents a 65% peak to trough decline, with the latest selloff symptomatic of a capitulation phase. We rarely recommend catching a falling…
Highlights The COVID-19-induced demand shock in China – and a stronger USD – will reduce growth in global crude oil consumption to just over 1mm b/d this year, vs. earlier expectations of ~ 1.4mm b/d. Significant fiscal and monetary stimulus from China will be required to put economic growth back on track over the critical 2020-21 interval. An accommodative monetary-policy backdrop globally also will support demand. On the supply side, OPEC 2.0 likely will cut output by an additional 600k b/d in 2Q20, which will remove 2.3mm b/d off member states’ official quotas. For 2H20, we expect the coalition to revert to its 1.7mm b/d in cuts to keep markets balanced. US shale-oil output growth will continue to slow under market-imposed capital discipline. We are revising our baseline price forecasts in 2020 lower to $62/bbl and $58/bbl for Brent and WTI, respectively (Chart of the Week). This is down $5/bbl vs our previous forecast. Price risk is to the upside, however. 2021 Brent and WTI forecasts remain at $70/bbl and $66/bbl, respectively, as we do not expect long-lived demand destruction from the COVID-19 outbreak. A growing consensus around policy stimulus and production cuts makes us leery. Feature Chart of the WeekCOVID-19 Knocks Oil Forecasts Lower
COVID-19 Knocks Oil Forecasts Lower
COVID-19 Knocks Oil Forecasts Lower
COVID-19 continues to hammer Chinese oil demand, forcing refiners there to drastically reduce output. This crude oil is ending up in inventories, but, so far at least, overall storage capacity in China is not being maxed out by the unintended accumulations of crude and product inventories. Data are difficult to come by, but there are a few observations that provide some insight into the state of the refining market in China as the COVID-19 episode unfolds. Platt’s reported independent refiners in Shandong Province, which has ~ 3.4mm b/d of refining capacity, cut runs to a four-year low of ~ 40% of capacity this month, down from a January rate of 63.5%. Shandong refiners represent 50%-60% of China’s independent refining capacity.1 We estimate EM demand – led by downward revisions in China – will fall by ~900k b/d in 1Q20 – when most of the damage to the economy likely will occur – and by an average 300k b/d for the year vs. our previous estimates. Ursa Space Systems’ radar satellite monitoring of inventories close to coastal refineries indicated Chinese oil storage at the beginning of the month was at 60% of capacity.2 This figure likely is higher, given refinery runs remain low, but it does not yet suggest storage capacity in China will be exhausted in the near future. In our modeling of the COVID-19 impact on oil demand, we estimate EM demand – led by downward revisions in China – will fall by ~900k b/d in 1Q20 – when most of the damage to the economy likely will occur – and by an average 300k b/d for the year vs. our previous estimates. This leads us to believe EM oil demand will increase by 1mm b/d this year, down from our earlier expectation of 1.26mm b/d pre-COVID-19. For DM economies, demand growth also will disappoint, revised down by 100k b/d on the back of a warmer-than-expected winter and stop-and-go growth in manufacturing induced by COVID-19. Policy Stimulus Will Revive Chinese Demand The COVID-19 outbreak will result in a significant hit to China’s GDP, which will require substantial stimulus to put growth back on a 6% p.a. track this year. This growth rate is required for the Chinese Communist Party (CCP) to deliver on its pledge to double GDP and per-capita income over 2010-20, a pledge that was memorialized in writing following the Party’s 2012 Congress. In addition, next year marks the 100th anniversary of the founding of the CCP, and, we believe, it is an all-but-foregone conclusion the Party’s leadership will not want a faltering economy on display as it celebrates this important milestone. Given these considerations, the possibility policymakers will over-stimulate the economy to get it back on track is a non-trivial upside risk.3 We do not think it is unreasonable to expect policymakers to lean into reviving growth this year and next with policy stimulus. Our baseline 2020 forecast envisions prices will falter somewhat versus our previous expectation – with Brent averaging $62/bbl this year, and WTI trading $4/bbl below that, vs. $67/bbl and $63/bbl previously. We are mindful of the impact Chinese policy stimulus can have on the global oil markets. The effects on GDP growth following demand shocks of past stimulus can be seen in the response of China’s GDP following the 2003 SARS outbreak; the 2008-09 GFC; the 2011-12 eurozone debt crisis; and even in China’s 2015-16 slowdown (Chart 2). For this reason, we do not think it is unreasonable to expect policymakers to lean into reviving growth this year and next with policy stimulus. And it is for this reason that we believe price risk tilts to the upside this year. Our updated Ensemble price forecast includes two additional demand-side simulations to assess its sensitivity to changes in EM oil demand: Chart 2Chinese Stimulus Will Support Oil Demand
Chinese Stimulus Will Support Oil Demand
Chinese Stimulus Will Support Oil Demand
Higher EM demand scenario (20% weight): We model the impact of the coronavirus as short-lived, with only a temporary impact on China’s economy. Consumer demand and industrial production in China converge to pre-COVID-19 levels rapidly in 2H20. Chinese policymakers overstimulate in 2Q20, over fears the virus could have severe long-term consequences on the economy. This scenario assumes EM demand increases by 100k b/d vs. our base case in 2020 and 2021. Lower EM demand scenario (10% weight): We model the impact of the coronavirus as a severe and long-lasting event. This triggers a negative feedback loop for EM oil demand; collapsing demand forces production lower, which reduces employment and pushes demand further down. This reverberates to other EM economies and affects global supply chains. This scenario assumes EM demand decreases by 240k b/d in 2020 and returns to our base case in 2021, supported by China stimulus. Oil-Demand Reduction (Not Destruction) The outbreak also is contributing to greater global economic uncertainty, which continues to support the USD broad trade-weighted index (TWIB). The COVID-19 outbreak in China caused us to reduce our expectation for global oil demand growth by ~ 360k b/d, taking 2020 year-on-year growth to ~ 1.04mm b/d, versus our earlier expectation of 1.4mm b/d. The outbreak also is contributing to greater global economic uncertainty, which continues to support the USD broad trade-weighted index (TWIB). Dollar strength produces a headwind for EM GDP growth, which suppresses oil-demand growth. The combination of the COVID-19-induced demand reduction and the stronger USD TWIB likely will compel OPEC 2.0 to maintain its production discipline until the global policy uncertainty abates and the USD TWIB retreats. Such a reversal in trend would become a tailwind for commodity demand (Chart 3). Chart 3Global Economic Uncertainty Keeps A Bid Under USD TWIB
Global Economic Uncertainty Keeps A Bid Under USD TWIB
Global Economic Uncertainty Keeps A Bid Under USD TWIB
Global supply growth will continue to be constrained by demands from investors to return capital to shareholders. We expect the hit to global demand to be offset by increased production cuts from OPEC 2.0, which will be agreed next month. OPEC 2.0 production also will be impacted by continued output losses in Iran and Venezuela, which have seen y/y production fall by ~ 1.8mm b/d in 2019. Global supply growth will continue to be constrained by demands from investors to return capital to shareholders – via stock buybacks – and for steady and increasing dividends to make their equity competitive with alternative sectors (e.g., tech). These capital-market pressures – in addition to growing pressure from Environmental, Social and Governance (ESG) investors – will continue to have a profound effect on capital availability for oil and gas E+P companies for decades to come. This is a theme we will return to often in future research. We summarize these supply-demand dynamics in Chart 4. For OPEC 2.0, the 1.7mm b/d reduction in output the coalition agreed for 1Q20 remains in place, as do losses from Iran and Venezuela. For 2Q20, we assume the coalition adds another 600k b/d of production cuts. After that, we assume OPEC 2.0 reverts to its earlier production cuts of 1.7mm b/d for 2H20. In 2021, we assume OPEC 2.0 takes production cuts back down to 1.2mm b/d in January 2021, then gradually increases its production over 1H21 to balance the market and to avoid spiking prices. We also expect the Kingdom of Saudi Arabia (KSA) to remove 300k b/d of overcompliance next year, as markets tighten. In 2H21, we see OPEC 2.0 production levels remaining flat at ~ 44.8mm b/d (Table 1). Table 1BCA Global Oil Supply - Demand Balances (MMb/d, Base Case Balances)
Oil Demand Should Recover In 2H20
Oil Demand Should Recover In 2H20
Chart 4Supply-Demand Balances
Supply-Demand Balances
Supply-Demand Balances
Chart 5Global Oil Inventories Will Resume Drawing
Global Oil Inventories Will Resume Drawing
Global Oil Inventories Will Resume Drawing
For 2021, we are leaving our Brent forecast unchanged at $70/bbl, and WTI at $66/bbl. For the US, we reduced our Lower 48 production assumptions, and now have 740k b/d growth in 2020 and 300k b/d in 2021. Shales account for almost all of this increase. We also include a scenario in which US production comes in lower in our ensemble forecast. These fundamentals combine to put global oil inventories back on a downward trajectory in 2H20 (Chart 5). That said, there is an important caveat going into 2H20: If the US Economic Policy Uncertainty Index starts rising in 2H20 on the back of US election risks, markets will continue to price in a stronger USD in 2020 vs. what we now expect. For 2021, we are leaving our Brent forecast unchanged at $70/bbl, and WTI at $66/bbl. Odds favor a return to the pre-COVID-19 price trajectory for oil next year, with continued upside risk from Chinese fiscal and monetary stimulus, and a globally accommodative monetary-policy backdrop. Higher Spare Capacity Reduces Risk Premium The market remains partly balanced by OPEC 2.0’s production cuts. This means that the group’s spare capacity is increasing, reducing the risk premium the market typically includes in crude oil prices to reflect sudden output losses. The risk premium in oil prices evaporated following the drop in demand and the increase in spare capacity due to the large OPEC 2.0 cuts. When China’s economy resumes its normal activity, demand will pick up and the market will balance, increasing the impact of possible supply disruptions. However, the market remains partly balanced by OPEC 2.0’s production cuts. This means that the group’s spare capacity is increasing, reducing the risk premium the market typically includes in crude oil prices to reflect sudden output losses. In addition, if production capacity of ~ 300k-500k b/d in the Neutral Zone shared by KSA and Kuwait is restored, the risk premium could drop even lower, given this production is expected to be retained as spare capacity. If this is the case we could have lower prices in 2020 vs. our current forecast (down to ~ $60/bbl). We will be exploring the changes in OPEC 2.0 spare capacity and the consequences for overall production in future research. Bottom Line: Assisted by Chinese policy stimulus, oil demand will recover this year from the COVID-19-induced demand shock. On the supply side, the combination of deeper OPEC 2.0 production cuts – which we expect will be settled at the upcoming March meeting – and capital-market-imposed reduction in US oil production will push oil markets to a supply deficit. The ongoing demand shock forces us to reduce our 2020 Brent price forecast to $62/bbl from $67/bbl previously. For 2021, we maintain our $70/bbl target. Risks to our view are mounting. Three crucial pieces to our 2020 and 2021 expectations remain uncertain: The duration and magnitude of the impact of the coronavirus shock, The level of production cuts by OPEC 2.0 and the degree of compliance by all members, and The trajectory of the US dollar – if global economic policy uncertainty remains elevated the USD could remain well bid, which would continue to pressure EM GDP growth – and commodity demand – at the margin. Our base case remains that prices will rise from here, but our conviction level is slightly lower. One reason for this is the apparent consensus emerging around the likelihood of Chinese stimulus and OPEC 2.0 production cuts. If either of these assumptions prove wrong, oil prices likely would move lower. Robert P. Ryan Chief Commodity & Energy Strategist rryan@bcaresearch.com Hugo Bélanger Associate Editor Commodity & Energy Strategy HugoB@bcaresearch.com Commodities Round-Up Energy: Overweight As of Tuesday’s close, Brent prices were up 8% from their Feb 10 low of $53.27/bbl, supported by receding COVID-19 fears and rising expectations OPEC 2.0 will deepen its production cuts at its March meeting. Earlier this week, oil prices received an additional lift from the newly-imposed US sanctions on Rosneft Trading SA – a subsidiary of Russia’s state-own company – for its activities with Venezuela’s PDVSA. Rosneft Trading intensified its involvement in Venezuela’s oil sector and now handles the majority of the country’s crude exports, providing vital support to the Maduro government. The US restrictions include a 90-day wind-down period for companies to end their activities with Rosneft Trading. Base Metals: Neutral Chinese steel consumption – which accounts for ~50% of global demand – has been hit hard by the coronavirus outbreak. Steel and iron ore prices in China plunged 11% and 3% YTD (Chart 6). Steel mills’ inventories increased to record levels, reaching full capacity. Mills are now forced to export their surplus at reduced prices – flooding seaborne steel markets – or to cut output. Accordingly, more than 33% of steel mills are considering cutting steel production, according to a recent Platts survey. Margins at producing mills are declining and could harm high-grade iron ore prices. This is a short-term risk to our view. Precious Metals: Neutral Gold prices surged past $1,600/oz on Tuesday – overlooking positive manufacturing data in the US. Silver shadowed gold’s movement, closing at $18.13/oz. Precious metals are bought as insurance against risks of a wider-than-expected spread of the coronavirus and should remain well bid until uncertainty dissipates. Gold is somewhat overbought based on sentiment, momentum and technical indicators (Chart 7). If, as we expect, the daily increase in confirmed cases ex-Hubei slows meaningfully over the coming months, gold and silver prices will lose some steam. Ags/Softs: Underweight CBOT March wheat futures surged 4.4% on Tuesday after Australia’s government sharply lowered its estimate of the country’s wheat harvest as severe drought affected crops. The Australian agricultural agency said the crop totaled 15.17 mm MT, the lowest since 2008, paving the way for stronger US exports. Corn also moved higher, with the prompt contract gaining 1.26% on the back of a new round of Chinese tariff exemptions on US goods. A USDA report showed US soybean export inspections bound for China were still half of last year's volumes. Soybeans futures closed 1.25 cents lower at $8.915/bu as markets await large Chinese purchases of US soybeans. Chart 6Increasing Inventories Pressure Steel and Iron ore Prices
Increasing Inventories Pressure Steel and Iron ore Prices
Increasing Inventories Pressure Steel and Iron ore Prices
Chart 7Gold Technical Indicators Signal Overbought Market
Gold Technical Indicators Signal Overbought Market
Gold Technical Indicators Signal Overbought Market
footnotes 1 Please see China's Shandong independent refiners cut run rates to 4-year low of 40% in Feb, published by S&P Global Platts February 13, 2020. 2 Please see Oil demand falls on coronavirus: how much will inventories rise? posted by Ursa Space Systems February 7, 2020. 3 Please see Iron Ore, Steel Poised For Rally, published January 13, 2020, for a discussion of the significance of 2020 vis-à-vis the Communist Party’s pledge to double GDP and per-capita income vs. 2010 levels, memorialized by the CCP at its 2012 Peoples Congress. We also discuss the 100th anniversary of the Party’s founding next year, which also will be a significant milestone for the CCP – and another reason the Party will not want the Chinese economy faltering as it is celebrated. Investment Views and Themes Recommendations Strategic Recommendations Tactical Trades TRADE RECOMMENDATION PERFORMANCE IN 2019 Q4
Oil Demand Should Recover In 2H20
Oil Demand Should Recover In 2H20
Commodity Prices and Plays Reference Table Trades Closed in 2020 Summary of Closed Trades
Oil Demand Should Recover In 2H20
Oil Demand Should Recover In 2H20
The broad commodity complex is oversold, but there has been a stark divergence in the performance of the underlying subsectors. Sentiment towards energy-related commodities such as crude oil and natural gas has soured, while precious metals are fast becoming…
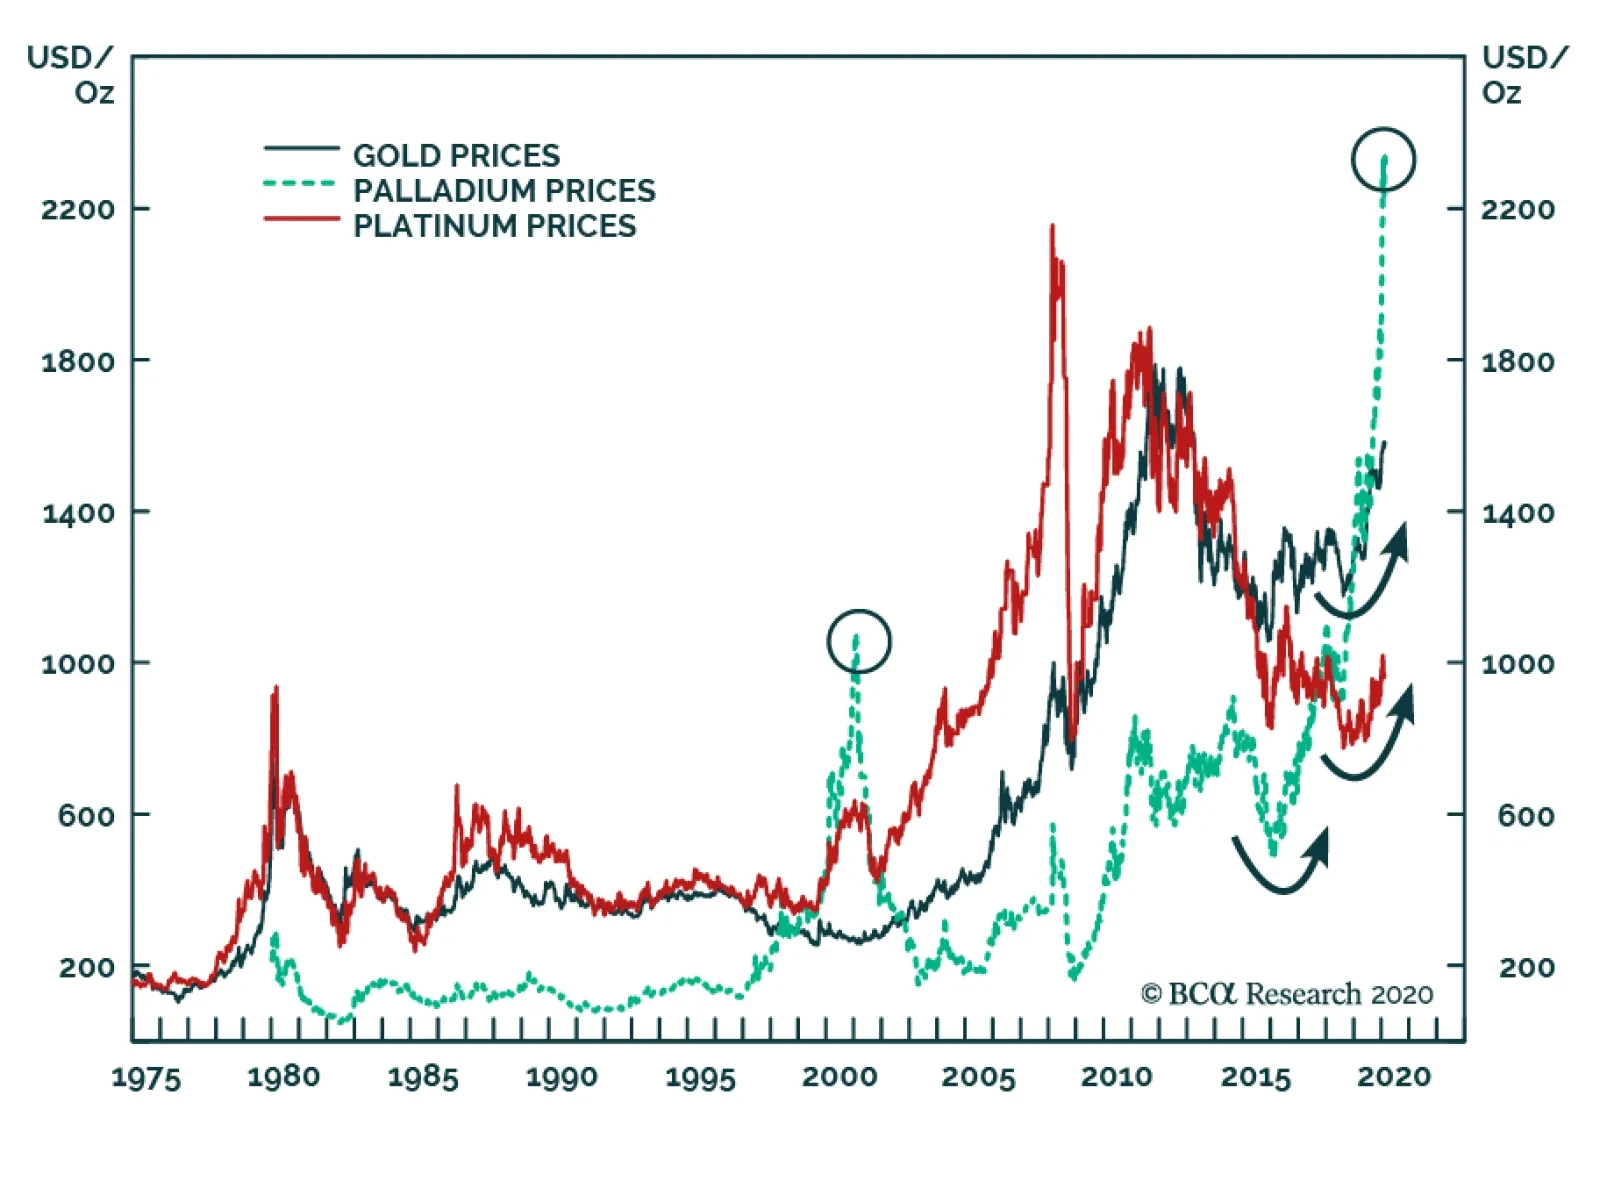
Palladium prices bottomed at $167/oz in the aftermath of the financial crisis and have since skyrocketed to $2458/oz, making it the most expensive precious metal in the PGM space. In annual terms, this constitutes a total return of 28% per year, easily…
The rally in gold prices has been relentless, but tactically, the yellow metal is due for a correction. Gold prices are a negative function of real interest rates and a positive function of inflation expectations. Moreover, gold has a strong momentum…