Commodities & Energy Sector

Highlights The path of least resistance for the DXY remains up. The internal dynamics of financial markets remain constructive for the DXY. We explore more key indicators to complement the analysis in our February 28 report. Our limit buy on NOK/SEK was triggered at parity. We were also stopped out of our long petrocurrency basket trade, which we will re-establish in the coming weeks. Feature Riot points in capital markets usually elicit a swathe of differing views. But more often than not, the internal dynamics of financial markets usually hold the key to a sober view. Given market action over the past few weeks, we are reviewing a few of the key indicators we look at for guidance on buying opportunities as well as false positives. In short, it is a story of standing aside on the DXY for now, while taking advantage of a few opportunities at the crosses. Currency Market Indicators Chart I-1The Dollar Has Scope To Rise Further
The Dollar Has Scope To Rise Further
The Dollar Has Scope To Rise Further
Many currency market signals continue to point to a higher DXY index for the time being. One of our favorite risk-on/risk-off pairs is the AUD/JPY cross. Not surprisingly, it tends to correlate very strongly with the dollar, which is a counter-cyclical currency. The AUD/JPY cross has consistently bottomed at the key support zone of 70-72 since the financial crisis. This defensive line held notably during the European debt crisis, China’s industrial recession, and more recently, the global trade war. The latest market moves have nudged it decisively lower (Chart I-1). This pins the next level of support in the 55-57 zone, at par with the recessions of 2001 and 2008. The yen appears headed towards 100. A rising yen is usually accompanied by a dollar rally against other procyclical currencies. Outside of the Fukushima crisis, this was a key indicator that the investment environment was becoming precarious (Chart I-2). We laid out our conviction last week as to why we thought 100 is the resting spot for the yen.1 That said, in our trades, our 104 profit target for short USD/JPY was hit this week. We are reinstating this trade with a target of 100, but tightening the stop to 105.4. Chart I-2The Yen Rally Usually Stalls At 100
THe Yen Rally Usuallyy Stalls At 100
THe Yen Rally Usuallyy Stalls At 100
The recent drop in the dollar is perplexing to most, but it fits the profile of most recessions we have had in recent history. As the world’s reserve bank, the Federal Reserve tends to be the most proactive during a crisis. This means US interest rates drop faster than in the rest of the world, which tends to pressure the dollar lower. Eventually, as imbalances in the economic system come home to roost, the dollar rallies (Chart I-3). 62% of global reserves are still in dollars, suggesting it remains the currency of choice in a crisis. Currencies such as the Norwegian krone and Swedish krona that were already quite cheap are still selling off indiscriminately. Granted, the Norwegian krone has been hit especially hard due to the fallout of the OPEC cartel. But the Swedish krona and Australian dollar that were equally cheap are selling off as well. This suggests the currency market is making a binary switch from fundamentals to sentiment, as we highlighted last week. Chart I-3The Dollar And ##br##Recessions
The Dollar And Recessions
The Dollar And Recessions
Chart I-4Carry Trades: Long-Term Bullish, Short-Term Cautious
Carry Trades: Long-Term Bullish, Short-Term Cautious
Carry Trades: Long-Term Bullish, Short-Term Cautious
Correspondingly, high-beta currencies such as the RUB/USD, ZAR/USD and BRL/USD are plunging into uncharted territory. These currencies are usually good at sniffing out a change in the investment landscape, specifically one becoming precarious for carry trades. The message so far is that the drop in US bond yields may not have been sufficient to make these currencies attractive again (Chart I-4). On a similar note, it is interesting that the USD/CNY is still holding near the 7-defense line. We suggested in a previous report that this represented a handshake agreement between President Xi and President Trump during the trade negotiations. Should USD/CNY break decisively above 7.15 (for example, if Trump’s reelection chances dwindle), it will send Asian currencies into the abyss. The velocity of asset price moves is both surprising and destabilizing. At this rate, previously solvent countries can rapidly step into illiquid territory, especially those with already huge levels of external debt. Granted, this is more a problem for emerging markets than for G10 currencies. So far, it is encouraging that cross-currency basis swaps for the dollar (a measure of currency hedging costs) remain muted (Chart I-5). Chart I-5Hedging Costs Remain Contained
Hedging Costs Remain Contained
Hedging Costs Remain Contained
In a nutshell, the message from currency markets warns against shorting the DXY for now. Bottom Line: Our profit target on short USD/JPY was hit at 104 this week. We are reinstating this trade with a new target of 100 and a stop-loss at 105.4. Currency market dynamics suggest the DXY is headed higher in the near term. The Message From Equity And Commodity Markets Equity and commodity market indicators continue to suggest the path of least resistance for the DXY remains up over the next few weeks. Since the 2009 lows, the S&P 500 has respected a well-defined upward-sloped trend line, characterized by a series of higher highs and lows. Given this defense line has been tested (and broken), it could pin the S&P 500 around 2200-2400 (Chart I-6). A further drop of this magnitude is likely to unravel financial markets as stop losses are triggered and reinforced selling is supercharged. Non-US equity markets have a much higher concentration of cyclical stocks in their bourses. Thus, whenever cyclical sectors are underperforming defensives at the same time as non-US markets are underperforming US ones, it is a clear sign that the marginal dollar is rotating towards the US (in this case fixed income). During the latest downdraft, what has been clear is that cyclical (and non-US) markets have been underperforming from already oversold levels (Chart I-7A and Chart I-7B). As contrarian investors, we tend to view this development positively, but catching a falling knife before eventual capitulation can also be quite painful. Chart I-6A Break Below The Defense Line Is Bearish
A Break Below The Defense Line Is Bearish
A Break Below The Defense Line Is Bearish
Chart I-7ANot A Bullish Configuration For Cyclical Currencies
Not A Bullish Configuration For Cyclical Currencies
Not A Bullish Configuration For Cyclical Currencies
Chart I-7BNot A Bullish Configuration For Cyclical Currencies
Not A Bullish Configuration For Cyclical Currencies
Not A Bullish Configuration For Cyclical Currencies
The 2015-2016 roadmap was instructive on when such a capitulation might occur. Even as the market was selling off, certain cyclical sectors such as industrials started to outperform defensives ones (Chart I-8). So far, it appears that selling pressure in cyclical markets have not yet been exhausted. Chart I-8Equity Market Internals Are Worrisome
Equity Market Internals Are Worrisome
Equity Market Internals Are Worrisome
In commodity markets, the copper-to-gold and oil-to-gold ratios continue to head lower from oversold levels. Together with the fall in government bond yields, it signifies that the liquidity-to-growth transmission mechanism is impaired (Chart I-9). The speed and magnitude of the latest drop could signify capitulation, but since the European debt crisis there has been ample time to catch the upswings, since they tend to be powerful and durable. Earnings revisions continue to head lower across all markets. Bottom-up analysts are usually spot on about the direction or earnings. Not surprisingly, the downgrades have been driven by emerging markets, meaning that return on capital will be lower in cyclical bourses. Chart I-9Commodity Market Internals Are Worrisome
Commodity Market Internals Are Worrisome
Commodity Market Internals Are Worrisome
A selloff in equity markets has tended to occur in cycles. The speed and intensity of the first selloff usually wipes out stale longs, especially those that bought close to the recent market peak. It is fair to assume with yesterday’s selloff that the process is near complete. The next wave comes from medium-term investors, making a judgment call on whether they are at the cusp of a recession. Unfortunately, this phase usually involves a cascading selloff with capitulation only evident a few weeks or months later. The fact that cheap and deeply oversold currencies like the Norwegian krone and Australian dollar are still falling suggests we are stepping into the second wave of selloffs. What remains peculiar about the dollar is that it continues to be whipsawed between relative fundamentals and sentiment. Bottom LIne: Equity market internals continue to suggest we have not yet hit a capitulation phase for pro-cyclical currencies. Stand aside on the DXY for now. On Interest Rates, The Euro, And Petrocurrencies Chart I-10The Bear Case For The US Dollar
The Bear Case For The US Dollar
The Bear Case For The US Dollar
What remains peculiar about the dollar is that it continues to be whipsawed between relative fundamentals and sentiment. For example, interest rate differentials across much of the developed world have risen versus the dollar, in stark contrast with the drop in their exchange rates (Chart I-10). The risk is that as a momentum currency, a surge in the dollar triggers a negative feedback loop that tightens global financial conditions, reinforcing the same negative feedback loop. A few questions we have fielded this week have been in surprise to the rise in the euro. What has been remarkable is that the drop in Treasury yields has wiped out the carry from being long the dollar for a number of countries. For example, the German bund-US Treasury spread continues to collapse. The message is that at least initially, room for policy maneuvering remains higher at the Fed, which corroborates the market view of a disappointing European Central Bank meeting this week. A drop in oil prices is also a huge dividend on the European economy, which partly explains recent strength in the euro. Within this sphere of multiple moving parts, one key question is what to do with oil plays. Usually recessions are triggered by rising oil prices that impose a tax on the domestic economy. But rather, oil prices have fallen dramatically in recent weeks as the pseudo-alliance between Russia and OPEC appears to have broken down. Our commodity and geopolitical strategists believe that while some sort of resolution will ultimately be reached, the path of least resistance for oil prices in the interim is down, as market share wars are re-engaged.2 Risks to oil demand are now also firmly tilted to the downside. Oil demand tends to follow the ebb and flows of the business cycle. Transport constitutes the largest share of global petroleum demand, and the rising bans on travel will go a long way in curbing consumption (Chart I-11). Balance-of-payment dynamics also tend to deteriorate during oil bear markets. Altogether, these forces combine to become powerful headwinds for petrocurrencies. A fall in oil prices tends to be bullish for the US dollar. This is because falling oil prices reduce government spending in oil-producing countries, which depresses aggregate demand and leads to easier monetary policy. Meanwhile, a fall in oil prices also implies falling terms of trade, which further reduces the fair value of the exchange rate. Balance-of-payment dynamics also tend to deteriorate during oil bear markets. Altogether, these forces combine to become powerful headwinds for petrocurrencies. Chart I-11Oil Demand Will Collapse Further
Oil Demand Will Collapse Further
Oil Demand Will Collapse Further
Chart I-12Resell CAD/NOK NOK Will Outperform CAD
Resell CAD/NOK NOK Will Outperform CAD
Resell CAD/NOK NOK Will Outperform CAD
We were stopped out of our long petrocurrency basket trade for a small loss of 0.9% (on the back of a positive carry). We are standing aside on this trade for now. We were also stopped out of our short CAD/NOK trade which we are reinstating this week. Further improvement in Canadian energy product sales will require not only rising oil prices, but an improvement in pipeline capacity and a smaller gap between Western Canadian Select (WCS) and Brent crude oil prices. With the US shale revolution grabbing production market share from both OPEC and non-OPEC producing countries, the divergence between the WCS (and WTI) price of oil versus Brent is likely to remain wide (Chart I-12). Rebuy NOK/SEK Our limit buy on long NOK/SEK was triggered at parity this week. Relative fundamentals, especially from an interest rate perspective, still favor the cross. The cross has approached an important technical level, with our intermediate-term indicator signaling oversold conditions. Should the NOK/SEK pattern of higher lows and higher highs in place since the 2015 bottom persist, we should be on the cusp of a reversal (Chart I-13). Interest rate differentials continue to favor the NOK over the SEK (Chart I-14). Meanwhile, Norway mainland GDP growth continues to outpace that of Sweden. Chart I-13Rebuy NOK/SEK Rebuy NOK/SEK
Rebuy NOK/SEK Rebuy NOK/SEK
Rebuy NOK/SEK Rebuy NOK/SEK
Chart I-14A Yield Cushion
A Yield Cushion
A Yield Cushion
The risk to this trade is that we have not yet seen a capitulation in oil prices. This will largely be driven by geopolitics. But given that the cross is already trading near the 2016 lows in oil prices, this has already largely been priced in. We are placing a tight stop at 0.94 to account for volatility in the coming weeks. Housekeeping Our short CHF/NZD trade briefly hit our stop loss of 1.75. We are reinstating this trade today, with a new entry level of 1.74 and a stop-loss of 1.76. We were also stopped out of our short USD/NOK trade, and we will look to rebuy the krone in the near future. Chester Ntonifor Foreign Exchange Strategist chestern@bcaresearch.com Footnotes 1 Please see Foreign Exchange Strategy Weekly Report, titled “Are Competitive Devaluations Next?”, dated March 6, 2020, available at fes.bcaresearch.com. 2 Please see Commodity & Energy Strategy Special Report, titled “Russia Regrets Market-Share War?”, dated March 12, 2020, available at ces.bcaresearch.com. Currencies U.S. Dollar Chart II-1USD Technicals 1
USD Technicals 1
USD Technicals 1
Chart II-2USD Technicals 2
USD Technicals 2
USD Technicals 2
Recent data in the US have been positive: Nonfarm payrolls increased by 275 thousand and average hourly earnings grew by 3% year-on-year in February. The NFIB business optimism index ticked up to 104.5 in February. Core CPI grew by 2.4% year-on-year from 2.3% in February. The DXY index appreciated by 0.8% this week. Core inflation has consistently printed at or above 2% for the last two years, but with inflation expectations plunging to new lows, the February print is likely to mark an intermediate-term high in CPI. As a counter-cyclical currency, the DXY is likely to continue getting a bid in the near term, even if we get more aggressive stimulus from the Fed. Report Links: Are Competitive Devaluations Next? - March 6, 2020 The Near-Term Bull Case For The Dollar - February 28, 2020 On The DXY Breakout, Euro, And Swiss Franc - February 21, 2020 The Euro Chart II-3EUR Technicals 1
EUR Technicals 1
EUR Technicals 1
Chart II-4EUR Technicals 2
EUR Technicals 2
EUR Technicals 2
Recent data in the euro area have been mixed: GDP grew by 1% year-on-year in Q4 2019, from 0.9% in Q3. The Sentix investor confidence index plummeted to -17.1 from 5.2 in March. Industrial production grew by 2.3% month-on-month in January from a contraction of 1.8% in December. The euro appreciated by 0.5% against the US dollar this week. The European Central Bank (ECB) kept rates unchanged at its Thursday meeting but implemented measures that support bank lending to small and medium-sized enterprises and injected liquidity through longer-term refinancing operations. The ECB also introduced additional net asset purchases of EUR 120 billion until the end of the year. This will help ease financial conditions in the euro area, but until global demand picks up, the exodus of capital from cyclical European stocks could continue. Report Links: On The DXY Breakout, Euro, And Swiss Franc - February 21, 2020 Updating Our Balance Of Payments Monitor - November 29, 2019 On Money Velocity, EUR/USD And Silver - October 11, 2019 Japanese Yen Chart II-5JPY Technicals 1
JPY Technicals 1
JPY Technicals 1
Chart II-6JPY Technicals 2
JPY Technicals 2
JPY Technicals 2
Recent data in Japan have been negative: The current account surplus increased to JPY 612.3 billion from JPY 524 billion while the trade balance went into a deficit of JPY 985.1 billion from a surplus of JPY 120.7 billion in January. Machine tool orders contracted by 30.1% year-on-year in February. The outlook component of the Eco Watchers survey plummeted to 24.6 from 41.8. The Japanese yen appreciated by 2.2% against the US dollar this week. An increase in foreign investments boosted the current account surplus, helping offset the deficit in goods trade. The government announced a package totaling JPY 430.8 billion to support financing for small businesses squeezed by the virus. The sharp rally in the yen could begin to garner discussions from both the MoF and BoJ on further actions. Report Links: The Near-Term Bull Case For The Dollar - February 28, 2020 Building A Protector Currency Portfolio - February 7, 2020 Currency Market Signals From Gold, Equities And Flows - January 31, 2020 British Pound Chart II-7GBP Technicals 1
GBP Technicals 1
GBP Technicals 1
Chart II-8GBP Technicals 2
GBP Technicals 2
GBP Technicals 2
Recent data in the UK have been negative: GDP growth was flat month-on-month in January. Industrial production contracted by 2.9% year-on-year in January, from a contraction of 1.8% the previous month. The total trade balance shrank to GBP 4.2 billion from GBP 6.3 billion in January. The British pound depreciated by 2.2% against the US dollar this week. The Bank of England (BoE) responded to the Covid-19 shock with an emergency rate cut of 50 basis points. This dovetailed with the government’s announcement of a GBP 30 billion stimulus package financed largely by additional borrowing. With the policy rate at 0.25%, the BoE has ruled out negative rates so further easing will likely come in the form of QE if rates go to zero. Report Links: Updating Our Balance Of Payments Monitor - November 29, 2019 A Few Trade Ideas - Sept. 27, 2019 United Kingdom: Cyclical Slowdown Or Structural Malaise? - Sept. 20, 2019 Australian Dollar Chart II-9AUD Technicals 1
AUD Technicals 1
AUD Technicals 1
Chart II-10AUD Technicals 2
AUD Technicals 2
AUD Technicals 2
Recent data in Australia have been negative: The Westpac consumer confidence index fell to 91.9 from 95.9 in February, a five-year low. National Australia Bank business confidence decreased to -4 from -1 while business conditions fell to 0 from 2 in February. Home loans grew by 3.1% month-on-month in January, from 3.6% the previous month. The Australian dollar depreciated by 3.9% against the US dollar this week. The Australian government joined other economies in announcing a stimulus package worth more than $15 billion that includes an extension of asset write-offs and measures to protect apprenticeships across the country. Reserve Bank of Australia Deputy Governor Debelle confirmed that the bank would consider quantitative easing if necessary. Report Links: On AUD And CNY - January 17, 2020 Updating Our Balance Of Payments Monitor - November 29, 2019 A Contrarian View On The Australian Dollar - May 24, 2019 New Zealand Dollar Chart II-11NZD Technicals 1
NZD Technicals 1
NZD Technicals 1
Chart II-12NZD Technicals 2
NZD Technicals 2
NZD Technicals 2
Recent data in New Zealand have been negative: Manufacturing sales grew by 2.7% quarter-on-quarter in Q4 2019. The preliminary ANZ business confidence numbers plummeted to -53.3 from -19.4 in March. Export intentions, at -21.5, hit an all-time low in March. Electronic card retail sales grew by 8.6% year-on-year in February, picking up from 4.2% in January. The New Zealand dollar depreciated by 1.9% against the US dollar this week. The government is planning a business continuity package that will be ready in coming weeks. Reserve Bank of New Zealand Governor Orr stated that the bank would consider unconventional policy such as negative rates, interest rate swaps, and large scale asset purchases only if policy rates hit the effective zero bound. Report Links: Updating Our Balance Of Payments Monitor - November 29, 2019 Place A Limit Sell On DXY At 100 - November 15, 2019 USD/CNY And Market Turbulence - August 9, 2019 Canadian Dollar Chart II-13CAD Technicals 1
CAD Technicals 1
CAD Technicals 1
Chart II-14CAD Technicals 2
CAD Technicals 2
CAD Technicals 2
Recent data in Canada have been mixed: Average hourly earnings grew by 4.3% year-on-year and 30.3 thousand new jobs were added to the Canadian economy in February. Imports fell to CAD 49.6 billion, exports fell to CAD 48.1 billion, and the deficit in international merchandise trade swelled to CAD 1.47 billion in February. The Ivey PMI decreased to 54.1 from 57.3 on a seasonally-adjusted basis in February. The Canadian dollar depreciated by 3% against the US dollar this week. The petrocurrency sold off as oil plunged in its biggest decline since the Gulf War in 1991. Exports of motor vehicles and energy products were down, contributing to the widening deficit. Supply and demand factors are bearish for oil, which will put a floor under our long EUR/CAD trade. Report Links: The Loonie: Upside Versus The Dollar, But Downside At The Crosses Updating Our Balance Of Payments Monitor - November 29, 2019 Making Money With Petrocurrencies - November 8, 2019 Swiss Franc Chart II-15CHF Technicals 1
CHF Technicals 1
CHF Technicals 1
Chart II-16CHF Technicals 2
CHF Technicals 2
CHF Technicals 2
There were scant data out of Switzerland this week: The unemployment rate remained flat at 2.3% in February. Foreign currency reserves increased to CHF 769 billion from CHF 764 billion in February while total sight deposits ticked up to CHF 598.5 billion from CHF 503.6 billion in the week ended March 6. The Swiss franc appreciated by 0.7% against the US dollar this week. The franc was driven by safe-haven flows at the beginning of the week but sold off as the market posted a tentative rally. Sight deposit and reserve data suggest the Swiss National Bank (SNB) intervened to keep EUR/CHF above the key 1.06 level. The ECB’s decision to hold rates will take some pressure off the SNB. Report Links: On The DXY Breakout, Euro, And Swiss Franc - February 21, 2020 Currency Market Signals From Gold, Equities And Flows - January 31, 2020 Portfolio Tweaks Before The Chinese New Year - January 24, 2020 Norwegian Krone Chart II-17NOK Technicals 1
NOK Technicals 1
NOK Technicals 1
Chart II-18NOK Technicals 2
NOK Technicals 2
NOK Technicals 2
Recent data in Norway have been negative: Headline CPI grew by 0.9% from 1.8% while the core figure grew by 2.1%, slowing from 2.9%, in February. Manufacturing output contracted by 1.4% month-on-month in January. The PPI contracted by 7.4% year-on-year in February, deepening the contraction of 3.9% the previous month. The Norwegian krone depreciated by 8.2% against the US dollar this week. As expected, the currency was hit hard by tumbling oil prices. The government is set to present emergency measures which will target bankruptcies and layoffs in sectors hit hard by Covid-19, such as airlines, hotels, and parts of the manufacturing industry. There may also be scope for the government to directly stimulate demand in the oil industry. Report Links: Building A Protector Currency Portfolio - February 7, 2020 On Oil, Growth And The Dollar - January 10, 2020 Updating Our Balance Of Payments Monitor - November 29, 2019 Swedish Krona Chart II-19SEK Technicals 1
SEK Technicals 1
SEK Technicals 1
Chart II-20SEK Technicals 2
SEK Technicals 2
SEK Technicals 2
There were scant data out of Switzerland this week: The current account surplus shrank to SEK 39 billion from SEK 65 billion in Q4 2019. The Swedish krona depreciated by 3% against the US dollar this week. The Swedish government announced a SEK 3 billion supplementary budget bill to combat the shock from Covid-19, in addition to preexisting tax credits and an extra SEK 5 billion promised to local authorities in the upcoming spring mini-budget. Riksbank Governor Ingves emphasized the need to maintain liquidity via more generous terms for loans to banks or direct purchases of securities. A rate cut, however, does not seem to be on the table. Report Links: Updating Our Balance Of Payments Monitor - November 29, 2019 Where To Next For The US Dollar? - June 7, 2019 Balance Of Payments Across The G10 - February 15, 2019 Trades & Forecasts Forecast Summary Core Portfolio Tactical Trades Limit Orders Closed Trades
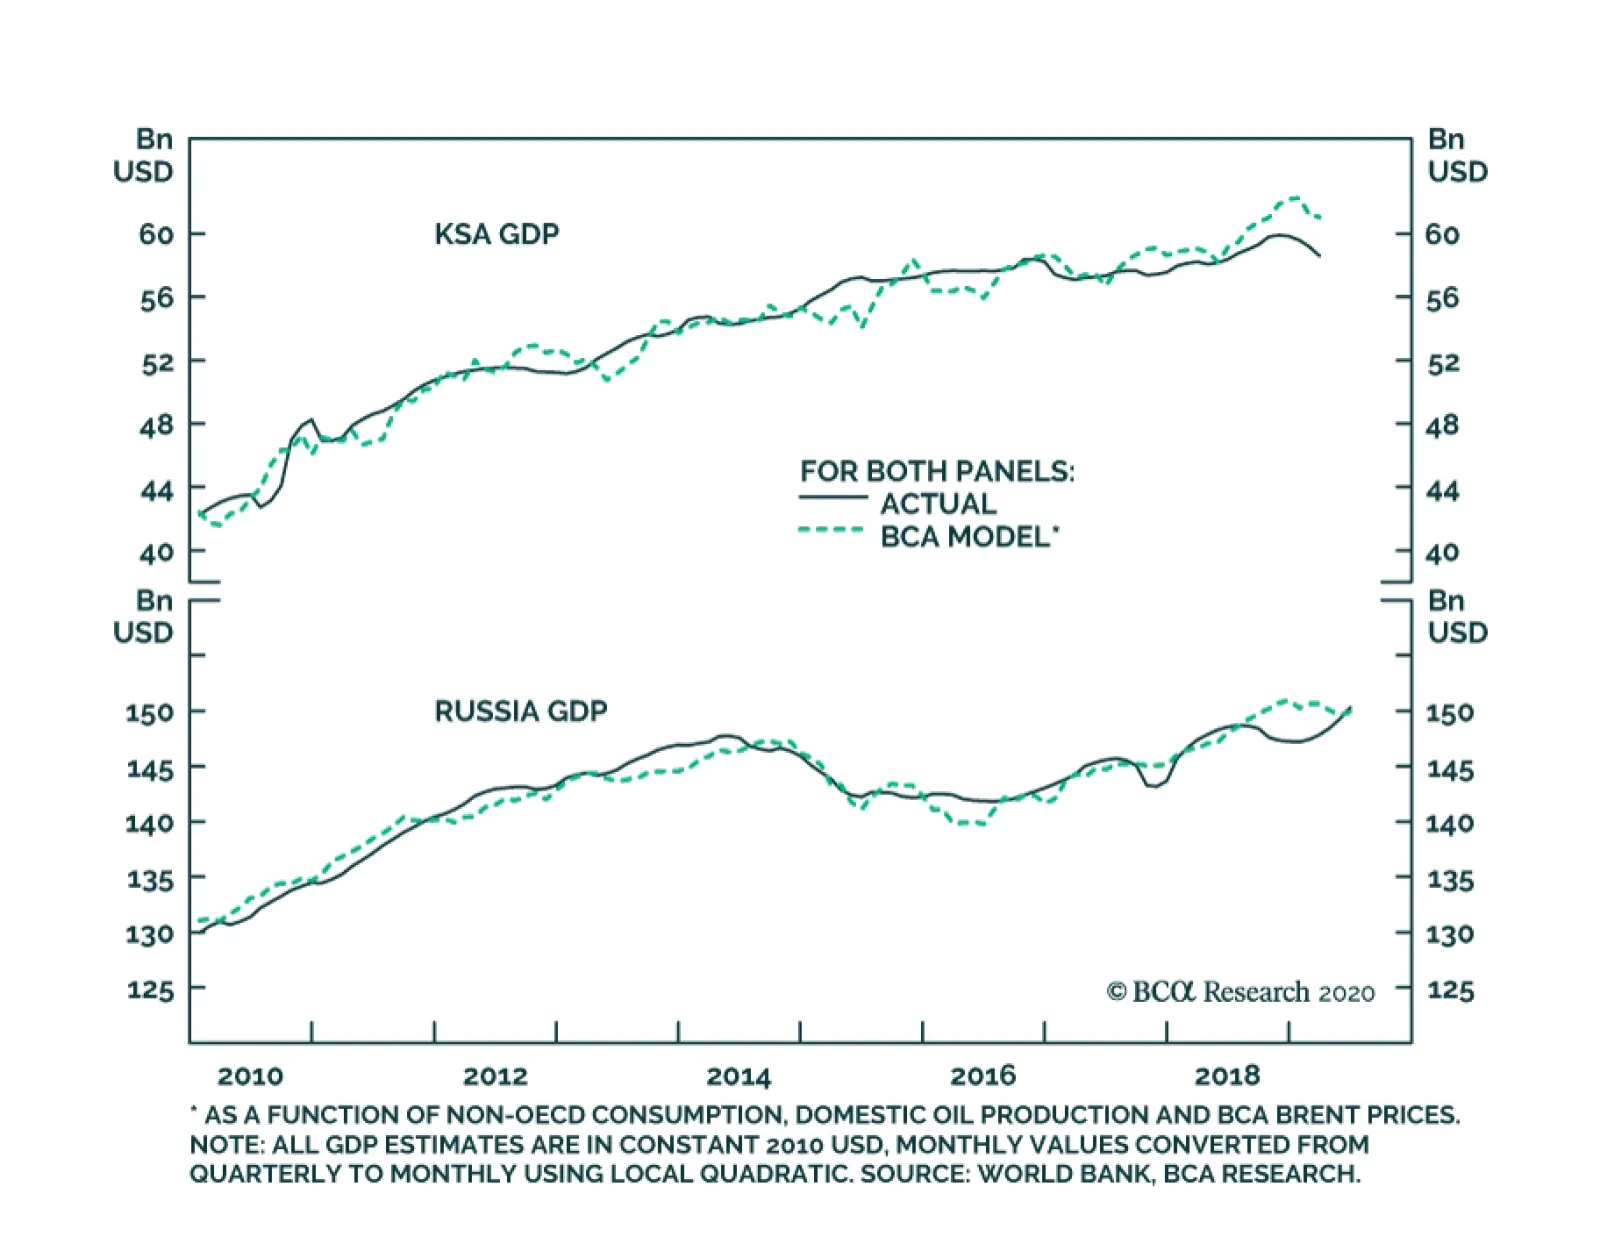
Highlights While not exactly conciliatory, Russian officials are signaling they will re-consider the declaration of a market-share war with the Kingdom of Saudi Arabia (KSA). KSA upped its shock-and-awe rhetoric promising to lift maximum sustainable capacity to 13mm b/d, which has kept prices under pressure (Chart of the Week) and will resonate into 3Q20, even if a market-share war is averted. Failure to stop a market-share war will fill global oil storage, and Brent prices again will trade with a $20 handle by year-end. Demand forecasts by the IEA and prominent banks are tilting toward the first contraction in global oil demand since the Global Financial Crisis (GFC). Central banks and governments are rolling out fiscal and monetary stimulus to counter the expected hit to global aggregate demand in the wake of COVID-19. Given the extraordinary uncertainty surrounding global oil supply and demand, our balances and prices forecasts are highly tentative. We are reducing our 2020 Brent forecasts to $40/bbl for 2Q-3Q20, and $50/bbl for 4Q20. For 2021, we are expecting Brent to average $60/bbl. WTI trades $3-$4/bbl below Brent in our estimates. Feature Russian officials appear to be seeking a resumption of talks with OPEC. Since the declaration of a market-share war following the breakdown of OPEC 2.0 negotiations to agree a production cut to balance global oil markets, Russian officials appear to be seeking a resumption of talks with OPEC.1 Putting such a meeting together before the expiration of OPEC 2.0’s 1.7mm b/d production-cutting deal at the end of this month will be a herculean lift for the coalition, but it can be done. All the same, it may require a quarter or so of re-opened floodgates from KSA and its GCC allies to focus everyone’s attention on the consequences of market-share wars. To that end, the Kingdom announced it will lift production above 12mm b/d, and supply markets out of strategically placed storage around the world. It was joined by the UAE with a pledge to raise output to 4mm b/d. Chart of the WeekMessy OPEC 2.0 Breakdown Crashes Benchmark Crude Prices
Messy OPEC 2.0 Breakdown Crashes Benchmark Crude Prices
Messy OPEC 2.0 Breakdown Crashes Benchmark Crude Prices
Assessing Uncertain Fundamentals While the dramatis personae on the supply side maneuver for advantage, markets still are trying to form expectations on the level of demand destruction in EM and DM wrought by COVID-19. Given the elevated uncertainty around this issue, modeling our ensemble forecast has become more complicated. On the demand side, we are modeling three scenarios for 2020: Global demand growth falls 200k b/d y/y, flat growth, and growth of 600k b/d. Our previous expectations had growth increasing 1mm b/d in 2020 and 1.7mm b/d in 2021. We maintain the rate of growth for next year – 1.7mm b/d – but note it is coming off a lower 2020 base for consumption. On the supply side, it’s a bit more complicated. We have three scenarios: In Scenario 1, we model the OPEC 2.0 breakdown, i.e., OPEC 2.0 gradually increases production by 2.5mm b/d between Apr20 and Dec20. Compared to our previous estimates it also removes the 600k b/d we previously expected would be added to the cuts in 2Q20, which produces a supply increase of 2.5mm b/d + expectation of 600k b/d vs. our previous balances. In Scenario 2, we run our previous balances expectation, which cuts production by a total of 2.3mm b/d in 2Q20, 1.7mm b/d in 2H20, and 1.2mm b/d in 2021.2 Scenario 3 models the additional cuts as recommended by OPEC last in week in Vienna of 1.5mm b/d on top of the 1.7mm b/d already agreed on for 1Q20. These cuts are realized gradually, moving to 2.3mmm b/d in 2Q20 and 3.2mm b/d in 2H20. For 2021, our supply assumptions revert to the OPEC 2.0 production cuts of 1.2mm b/d that prevailed last year. The price expectations generated by these scenarios can be seen in Table 1 and in Charts 2A, 2B, and 2C, which show our supply-side scenarios with the three demand-side scenarios above. We show our balances estimates given these different scenarios in Charts 3A, 3B, and 3C, and our inventory estimates in Charts 4A, 4B, and 4C. Table 1Unstable Brent Price Forecasts
Russia Regrets Market-Share War?
Russia Regrets Market-Share War?
It may require a quarter or so of re-opened floodgates from KSA and its GCC allies to focus everyone’s attention on the consequences of market-share wars. Chart 2AOil Price Scenarios Driver: OPEC vs. Russia Price War
Oil Price Scenarios Driver: OPEC vs. Russia Price War
Oil Price Scenarios Driver: OPEC vs. Russia Price War
Chart 2BOil Price Scenarios Driver: Pre-OPEC 2.0 Breakdown
Oil Price Scenarios Driver: Pre-OPEC 2.0 Breakdown
Oil Price Scenarios Driver: Pre-OPEC 2.0 Breakdown
Chart 2COil Price Scenarios Driver: Proposed OPEC Cuts
Oil Price Scenarios Driver: Proposed OPEC Cuts
Oil Price Scenarios Driver: Proposed OPEC Cuts
Chart 3AOil Balances Scenarios Driver: OPEC vs. Russia Price War
Oil Balances Scenarios Driver: OPEC vs. Russia Price War
Oil Balances Scenarios Driver: OPEC vs. Russia Price War
Chart 3BOil Balances Scenarios Driver: Pre-OPEC 2.0 Breakdown
Oil Balances Scenarios Driver: Pre-OPEC 2.0 Breakdown
Oil Balances Scenarios Driver: Pre-OPEC 2.0 Breakdown
Chart 3COil Balances Scenarios Driver: Proposed OPEC Cuts
Oil Balances Scenarios Driver: Proposed OPEC Cuts
Oil Balances Scenarios Driver: Proposed OPEC Cuts
Chart 4AOECD Inventory Scenarios Driver: OPEC vs. Russia Price War
OECD Inventory Scenarios Driver: OPEC vs. Russia Price War
OECD Inventory Scenarios Driver: OPEC vs. Russia Price War
Chart 4BOECD Inventory Scenarios Driver: Pre-OPEC 2.0 Breakdown
OECD Inventory Scenarios Driver: Pre-OPEC 2.0 Breakdown
OECD Inventory Scenarios Driver: Pre-OPEC 2.0 Breakdown
Chart 4COECD Inventory Scenarios Driver: Proposed OPEC Cuts
OECD Inventory Scenarios Driver: Proposed OPEC Cuts
OECD Inventory Scenarios Driver: Proposed OPEC Cuts
Given all of the moving parts in our forecast this month, we will only be publishing a summary of these estimates (Table 1). We will publish our global balances table next week after we have had time to process the EIA’s and OPEC’s historical demand estimates. Given the dynamics of supply-demand and storage adjustments these different scenarios produce, we use them to roughly estimate forecasts for 2Q and 3Q20, 4Q20 and 2021. We are reducing our 2020 Brent forecasts to $40/bbl for 2Q-3Q20, and $50/bbl for 4Q20. For 2021, we are expecting Brent to average $60/bbl. WTI trades $3-$4/bbl below Brent in our estimates. The implicit assumption here is COVID-19 is contained by 3Q20 and is in the market’s rear-view mirror by 4Q20. Obviously, such an assumption is fraught with uncertainty. Russia May Be Re-Thinking Strategy I cannot forecast to you the action of Russia. It is a riddle, wrapped in a mystery, inside an enigma; but perhaps there is a key. That key is Russian national interest. Winston Churchill, BBC Broadcast, October 1, 1939.3 Russia appears to be sending up trial balloons to indicate to OPEC it would not be averse to renewing the OPEC 2.0 dialogue. It is worthwhile noting Russian officials immediately responded to KSA’s first mention of sharply higher output – going to 12.3mm bd from 9.7mm b/d – with their own assertion they will lift current output of ~ 11.4mm b/d by 200k – 300k b/d, and ultimately take that to +500k b/d. Of course, as Churchill’s observation makes plain, it is difficult to interpret Russia’s overtures in this regard, particularly in light of the growing popular dissatisfaction with President Vladimir Putin’s regime within Russia itself. At the outset, it seems to us that the cause of the breakdown in OPEC 2.0 was the collapse in demand from China following the COVID-19 outbreak in Wuhan Province, and Putin’s attempt to secure a longer stay in power.4 The former focused Russia’s oil oligarchs on shoring up market share, and focused Putin on maintaining the support of these important oligarchs. The basis for Russo-Saudi cooperation under the OPEC 2.0 umbrella was rising oil demand, and the simple fact that both sides had exhausted their ability to sustain low prices brought on by the 2014-16 oil-price collapse ushered in by OPEC’s previous market-share war amid the global manufacturing downturn. The slowdown in global demand due to China’s slow-down and the Sino-US trade war in 2019 weakened Russian commitment to OPEC 2.0 by end of year. Putin faced domestic popular discontent and grumbling among the oligarchs (e.g. Igor Sechin, the head of Rosneft), just as he was preparing to extend his term in power. The possibility of a drastic loss of Russian influence over global oil markets – and hence of its own economic independence – emerged at a time when Putin still has the ability to maneuver ahead of the 2021 Duma election and 2024 presidential election which are essential to his maintenance of power. Going into 2020, Russia also had gained monetary and fiscal ammunition over preceding three years that would allow them to challenge KSA within OPEC 2.0, while KSA’s reserves stagnated (Chart 5). The Wuhan Coronavirus pushed things over the edge by hitting Chinese oil demand directly in the gut. Putin gave into the oil sector’s demands for prioritizing market share. As is apparent, this is the critical issue for him and the oligarchs running Russia’s oil and gas companies. Chart 5Foreign Exchange Reserves
Foreign Exchange Reserves
Foreign Exchange Reserves
Russia’s US Focus The fact that US President Donald Trump and Iran are harmed by the oil price collapse is secondary. The Russians may have known that the US and Iran would suffer collateral damage, but their primary objective was not to unseat Trump and definitely not to increase the chances of regime collapse in Iran. It is not unthinkable that President Putin would attempt to upset the US election yet again. Regardless of the relationship between Putin and Trump, Russia benefits from promoting US polarization in general. And the Democrats will impose stricter regulations on US resource industries (including shale). All the same, Russia will suffer from Democrats taking power and strengthening NATO and the trans-Atlantic alliance. A knock on shale is a short-term benefit to Russia, but the loss of Trump as a president who increases geopolitical “multipolarity,” which is good for Russia, would be a long-term loss. President Putin would not have triggered the conflict with Saudi over such a mixed combination. The breakdown of OPEC 2.0 happened after Super Tuesday, so it was clear Biden was leading the US Democratic Party’s bid for the Oval Office come November. Biden is hawkish on Russia and is more likely than Trump to get the Europeans to reduce their energy dependence on Russia. Also, it is possible Trump will benefit from lower oil prices anyway, since it will reduce prices at the pump by November and also help China recover – thus allowing it to boost global demand and follow through on Phase 1 of the Sino-US trade deal. As noted above, market share is primary. The US election, if it is relevant at all, is subsidiary. The Trump administration is furious because the turmoil threatens to upset the US election. As for Iran, Russia does at least consider its position, but is driven by its own needs and, as usual, threw Iran under the bus when necessary. Russia will continue to support the Iranian regime in other ways. And if the consequence of the market-share war is government change in the US, then Iran has its reward. Clearly President Putin was willing to throw President Trump under the bus, as well. It was not surprising to see US officials singling out Russia when discussing the oil-price collapse last week and earlier this week, when US Treasury Secretary Steve Mnuchin and Russia’s foreign minister, Anatoly Antonov, met in Washington. This blame game is consistent with what we think we know: Russia wavered on the deal presented by OPEC. Saudi Arabia was not the instigator.5 Saudi Arabia massively reacted to retaliate against Russia’s declared price war, but it was Russia that refused to agree to more cuts.6 The Trump administration is furious because the turmoil threatens to upset the US election. From Trump’s perspective, oil and gasoline prices weren’t too high, but, now that they are lower, the risk of higher unemployment in key electoral states – even Texas – is elevated. Trump wanted more oil production but not oil market chaos. Trump wanted more oil production but not oil market chaos. This short-term thinking is likely to drive US policy in advance of the election, although from a long-term point of view the US has little reason to regret Russia’s actions as Russia is ultimately shooting itself in the foot. From an international point of view, the breakdown shows that Russia and KSA are fundamentally competitive, not cooperative, and the fanfare over improving relations was dependent on stronger oil demand, not vice versa. Russia’s strategy for decades – in the Middle East and elsewhere – has been to take calculated risks, not to undertake reckless adventures that expose its military and economic weaknesses relative to the United States and Europe. This strategic logic applies to the market-share war as well as to Russia’s various conflicts with the West. The oil price collapse is bad for Russia’s economy and internal stability and hence the door to talks is still open. The immediate risk to both KSA and Russia is a forward oil curve that stays lower for longer, regardless of what the Russian Finance Ministry says. A reconciliation between KSA and Russia to restore the production-management deal would limit the negative fallout. The immediate risk to both KSA and Russia is a forward oil curve that stays lower for longer, regardless of what the Russian Finance Ministry says.7 Bottom Line: The COVID-19 pandemic and the breakdown of OPEC 2.0 last week in Vienna dramatically heightened uncertainty and volatility in oil markets. Although it appears Russian officials are trying to walk back the market-share war declared at the end of last week, events already in train could keep oil prices lower for longer. We lowered our oil-price forecasts for 2020 to reflect the demand destruction and a possible supply surge this year. The underlying assumption of our modeling on the demand side is the COVID-19 pandemic will be contained and the global economy will be back in working order by 4Q20. On the supply side, nothing is certain, but we are leaning to a re-formation of OPEC 2.0, which ultimately restores the production-management regime that prevailed until last week. Both of these assumptions are highly unstable. We lowered our 2020 Brent forecasts to $40/bbl for 2Q-3Q20, and to $50/bbl for 4Q20. For 2021, we are expecting Brent to average $60/bbl. WTI trades $3-$4/bbl below Brent in our estimates. These forecasts will be constantly reviewed as new information becomes available. Commodities Round-Up Energy: Overweight Total stocks of crude oil and products in the US drew another 7.6mm barrels in the week ended March 6, 2020, led by distillates, the EIA reported. Crude and product inventories finished the week at close to 1.3 billion barrels (ex SPR barrels). Total product demand – what the EIA called “Product Supplied” – was up close to 600k b/d, led by distillates (e.g., heating oil, diesel, jet and marine gasoil). Commercial crude oil inventories rose by 7.7mm barrels (Chart 6). Base Metals: Neutral After falling almost to the daily downside limit early on Monday, Singapore ferrous futures staged a recovery on Tuesday when iron ore jumped 33%, as declining inventories of the steelmaking material sparked supply concerns among investors. SteelHome Consultancy reported this week Chinese port-side iron ore stocks dropped to 126.25mm MT, down 3.4% for the year. In addition, China’s General Administration of Customs reported iron ore imports rose 1.5% in the January and February relative to the same period a year ago. The decreasing number of new COVID-19 cases in China should help iron ore and steel going forward as construction and infrastructure projects resume. Precious Metals: Neutral Gold prices are up 9% YTD, supported by accommodative monetary policy globally in the wake of the rapid spread of COVID-19 cases outside of China. Fixed income markets are pricing in 80bps cuts in the Fed funds rate over the next 12 months. Additionally, negative-yielding debt globally – which is highly correlated with gold prices – increased 26% since January 2020. Continued elevated uncertainty stemming from the spread of the coronavirus keeps demand for safe assets buoyant. We estimate the risk premium in gold prices related to this persistent uncertainty is ~$140/oz (Chart 7). Nonetheless, positioning and technical signal it is overbought and vulnerable to a short-term pullback. Ags/Softs: Underweight In its World Agricultural Supply and Demand Estimates (WASDE), the USDA lowered its season-average price expectations for the current crop year for corn to $3.80/bu, down 5 cents, and for soybeans to $8.70/bu, a decrease of 5 cents. The USDA kept its expectation for wheat at $4.55/bu. The Department estimates global soybean production will increase 2.4mm MT, with most of this stemming from increases in Argentina and Brazil. CONAB, Brazil’s USDA equivalent, confirmed this projected increase, saying the country’s soybean output is poised to rise 8% to a record 124.2 Mn Tons this year. May soybean futures were up slightly, as were corn and wheat on Tuesday. Chart 6
US Crude Inventories Are Rising
US Crude Inventories Are Rising
Chart 7
Russia Regrets Market-Share War?
Russia Regrets Market-Share War?
Robert P. Ryan Chief Commodity & Energy Strategist rryan@bcaresearch.com Matt Gertken Geopolitical Strategist mattg@bcaresearch.com Hugo Bélanger Associate Editor Commodity & Energy Strategy HugoB@bcaresearch.com Footnotes 1 Please see Russia keeps door open for OPEC amid threats to raise output, published by worldoil.com; Russian ministry, oil firms to meet after OPEC talks collapse -sources, published by reuters.com March 10, 2020, and Russia says it can deal with pain of a Saudi oil price war published by ft.com March 9, 2020. 2 For non-OPEC 2.0 countries, we also included downward adjustments to Libya and US shale production vs. our previous balances 3 Please see “The Russian Enigma,” published by The Churchill Society. See also Kitchen, Martin (1987), “Winston Churchill and the Soviet Union during the Second World War,” The Historical Journal, Vol. 30, No. 2), pp. 415-436. 4 We also would observe Russian producers never fully abided by the output cuts voluntarily in every instance. Often, compliance was due to (1) seasonal maintenance; (2) extreme temperatures in the winter, and (3) the pipeline contamination incident. Thus, producers were probably close to full capacity most of the time OPEC 2.0's production cuts were in place. This implies that for a minor voluntary production cut, Russia enjoyed prices close to $70/bbl, vs. mid $30s currently. This begs the question why they would provoke a market-share war when they would have been better off continuing to flaut their quotas instead of collapsing prices. 5 Please see Mnuchin wants ‘orderly’ oil markets in talk with Russian ambassador published by worldoil.com March 9, 2020. 6 One could argue that while the Saudis reacted quickly and threatened a massive response, they may have been less fearful of a breakdown given the recognition that it could seriously damage Iran’s economy. 7 The Financial Times noted Russia’s confidence that its National Wealth Fund of ~ $150 billion, equivalent to ~ 9% of GDP, which officials believe allows it “to remain competitive at any predicted price range and keep its market share” – i.e., the state will draw down the fund to cover any difference between low oil prices and domestic oil company’s breakeven prices. Energy Minister Alexander Novak said Russia would “pay special attention to providing the domestic market with a stable supply of oil products and protecting the sector’s investment potential.” Please see Russia says it candDeal with the pain of a Saudi price war, published by ft.com March 9, 2020.
Highlights Bear markets occur in phases, and their narrative can mutate. What began as a selloff caused by the coronavirus outbreak could well mutate into an oil crash-led selloff, and then mutate again into a selloff due to policy omnipotence, or something else. We are reiterating our short positions in the EM equity index and a basket of EM currencies versus the US dollar as well as our defensive positioning in EM domestic bonds and credit markets. We are taking profits on our long gold/short oil and copper trade. Oil prices may stabilize, but risks are still skewed to the downside. We are also booking gains on our long Russian domestic bonds/short oil position. Feature Chart I-1A Record Low Currency VOL Is Followed By Major Market Disturbances
A Record Low Currency VOL Is Followed By Major Market Disturbances
A Record Low Currency VOL Is Followed By Major Market Disturbances
Global financial markets are witnessing the unwinding of the policy put. For the past several years, the consensus in the global investment community was that risk assets could not go down because of policy puts from the Federal Reserve, the US Treasury and President Trump, the European Central Bank and the Chinese authorities. Similarly, crude oil prices had been supported by OPEC 2.0’s put from December 2016 until recently. The latest panic and broad-based liquidation of risk assets has been due not only to fear and uncertainty related to the rapid escalation in COVID-19 cases around the world, but also to investor realization that these policy puts are ineffectual. The Fed’s 50-basis-point intra-meeting rate cut proved incapable of stabilizing global risk assets. Investors have begun to doubt the efficacy of policy puts and have thrown in the proverbial towel. Crucially, the high-speed and intensity of the selloff was due to widespread complacency and overbought conditions in risk assets. In our January 23 report, we quoted Bob Prince, co-CIO of Bridgewater, who stated in Davos that “…we have probably seen the end of the boom-bust cycle.” This comment was consistent with prevalent complacency in global financial markets, reflected in very tight credit spreads worldwide, high US equity multiples and record-low implied volatility in various asset classes. In the same January 23 report, we wrote: “Any time an influential person has made a similar declaration in the past, it marked a major turning point in financial markets. Remarkably, implied volatility for the US dollar has plummeted to a record low, as it has for EM currencies and a wide range of equity markets. Chart I-1 illustrates the implied volatility for EM currencies and the US dollar. Such low levels of implied currency market volatility historically preceded major moves in currency markets and often led to a material selloff in broad EM financial markets.” In that same report , we recommended going long implied EM currency volatility. Since then JP Morgan’s EM currency volatility has risen from 6% to 10%. What began as a selloff caused by the coronavirus outbreak could well mutate into an oil crash-led selloff, and then mutate again into a selloff due to policy omnipotence, or something else. Consistent with this thesis, we reinstated our short EM equity index recommendation in the following week’s report – on January 30. The MSCI EM stock index is down 11% since then. Our target is 800, which is 18% below current levels (Chart I-2, top panel). Chart I-2EM Stocks: A Breakdown In The Making
EM Stocks: A Breakdown In The Making
EM Stocks: A Breakdown In The Making
Market Narratives Mutate Chart I-3VIX Surge In Early 2018 Was A Trigger Not Cause Of Selloff
VIX Surge In Early 2018 Was A Trigger Not Cause Of Selloff
VIX Surge In Early 2018 Was A Trigger Not Cause Of Selloff
Narratives of all large market moves are always expounded in retrospect. Only after a selloff is well-advanced do investors and commentators come up with reasons for it and build a plausible narrative describing it. Critically, bear markets occur in phases, and their narrative can evolve. What began as a selloff caused by the coronavirus outbreak could well mutate into an oil crash-led selloff, and then mutate again into a selloff due to policy omnipotence, or something else. For example, the early 2018 selloff in global equities and industrial commodities was at the time attributed to the spike in US equity volatility (Chart I-3, top and middle panels). In retrospect, January 2018 marked a major top in the global business cycle (Chart I-3, bottom line). Hence, the true reason for the late-January 2018 top in global stocks and industrial commodities was a downturn in global manufacturing and trade and not the surge in the VIX. The key question investors are currently wrestling with is the following: How deep will this selloff be, and how long will it last? Our view is that the selloff in EM and global risk assets is not yet over. As such, we are reiterating our short positions in the EM equity index and a basket of EM currencies versus the US dollar, as well as our defensive positioning in EM domestic bonds and credit markets. Gauging The Downside There is no doubt that global growth will be affected by the spread of COVID-19 and the precautionary measures taken by the authorities, companies and households around the world to contain the outbreak. Further, growth visibility is extremely low, and that uncertainty is raising the risk premiums that investors demand. The latter is weighing on risk assets in general and global share prices in particular. Presently, precise forecasts for GDP growth and a potential trajectory of COVID-19 cases are not credible, and hence cannot be relied upon to formulate a sound investment strategy. If the current bloodbath in risk assets persists, a market bottom could be reached well before bad economic data are released or COVID-19 infection cases peak. Given the uncertainty related to both the global growth trajectory and the Covid-19 epidemic, the only way for investors to gauge a market bottom is to continuously examine valuations, technicals and market internals. With respect to valuations and technicals, we have the following observations: The EM equity index seems to breaking below its major support lines. If this breakdowns transpires, there is an air pocket until the index reaches its next technical support, which is 18% below its current level (please refer to the top panel of Chart I-2 on page 3). If the EM MSCI equity index drops to this support range, it would be trading at 11 times its trailing earnings (please refer to the bottom panel of Chart I-2 on page 3). At those levels, the EM equity index would be discounting a lot of bad news, making it immune to dismal economic data and general uncertainty. For the S&P 500, if the current defense line – which held been during 2011, 2015 and 2018 selloffs – is violated, the next long-term technical support is around 2400-2500 (Chart I-4). Inflows to EM fixed-income funds were enormous in 2019. Meanwhile, EM corporate and sovereign spreads have broken out (Chart I-5). Provided this selloff commenced from very overbought and expensive levels, the odds are that liquidation forces will not abate right now and that the selloff in EM fixed income has further to go. Chart I-4S&P 500: Where Technical Support Lies?
S&P 500: Where Technical Support Lies?
S&P 500: Where Technical Support Lies?
Chart I-5EM Sovereign And Corporate Spreads Have Broken Out
EM Sovereign And Corporate Spreads Have Broken Out
EM Sovereign And Corporate Spreads Have Broken Out
In a nutshell, we suspect that EM local currency bonds and credit markets received a lot of inflows from European investors in recent years because yields were negative across European fixed-income markets. A weak euro was a boon for European investors investing in EM. That, however, is reversing. Since the recent sharp appreciation in the euro and the nosedive in EM currencies, EM financial market returns in euros have collapsed. This will likely prompt an exodus of European investors from EM financial markets. Chart I-6A Major Breakdown In This Cyclical Indicator
A Major Breakdown In This Cyclical Indicator
A Major Breakdown In This Cyclical Indicator
Even though the EM equity index is not expensive or overbought, rising EM USD and local currency bond yields herald lower share prices, as we discussed at length in last week’s report. Our Risk-On/Safe-Haven currency ratio1 has plummeted below its major technical support and the next level is significantly lower. In other words, this indicator is also in an air pocket (Chart I-6). Given it is extremely well-correlated with EM share prices, the latter will not bottom until this indicator stabilizes. Technical configurations of high-beta and cyclical segments of the global equity universe are consistent with failed breakouts. Such a profile is typically not followed by a correction, but by a major drawdown. These include the European aggregate equity index, the Nikkei, global industrials and US high-beta stocks (Chart I-7). Chart I-7AFailed Breakouts Are Often Followed By Large Drawdowns
Failed Breakouts Are Often Followed By Large Drawdowns
Failed Breakouts Are Often Followed By Large Drawdowns
Chart I-7BFailed Breakouts Are Often Followed By Large Drawdowns
Failed Breakouts Are Often Followed By Large Drawdowns
Failed Breakouts Are Often Followed By Large Drawdowns
Chart I-8The Global Stocks-To-Bonds Ratio Is Back To 2011 Levels
The Global Stocks-To-Bonds Ratio Is Back To 2011 Levels
The Global Stocks-To-Bonds Ratio Is Back To 2011 Levels
Finally, the global stock-to-bond ratio has decisively broken below the upward sloping channel that has been in place since 2009 (Chart I-8). Typically, when a market or ratio experiences such a major breakdown, the recovery does not occur quickly and is unlikely to be V-shaped. In short, the structural breakdown in the global stocks-to-bond ratio suggests that global share prices will likely stay under downward pressure for some time. Bottom Line: Odds are that risk assets remain in a liquidation phase and investors should avoid catching a falling knife. The odds are also high that EM share prices in US dollar terms have another 18% downside. We reckon at those levels – where the MSCI EM equity index is around 800 – it would be safe to start accumulating EM equities, even if the global growth outlook remains mired in uncertainty. For now, we recommend playing EM on the short side. What To Do With Oil Plays Despite periodic spikes in crude prices over the past few years, we have held our conviction that oil is in a structural bear market. We doubted the sustainability of the OPEC 2.0 arrangement, arguing that Russia would not cooperate with Saudi Arabia in the long term. Russia did cooperate much longer than we had expected, temporarily supporting oil prices. Ultimately, Russian President Vladimir Putin abandoned the cartel late last week, and the Saudis have hit back with massive price discounts amid large output increases. Consequently, oil prices have crashed and are presently oversold (Chart I-9). Given the uncertainty related to both the global growth trajectory and the Covid-19 epidemic, the only way for investors to gauge a market bottom is to continuously examine valuations, technicals and market internals. However, there will be no rapprochement between the Saudis and the Russians for some time. Given the drop in demand amid sharp increases in supply, crude oil prices may well slide further. Since July 11, 2019, we have been recommending a long gold/short oil and copper trade (Chart I-10). This position has generated a large 40% gain. Today, we are taking profits on this trade. Instead, we are replacing it with a new position: long gold/short copper. Chart I-9A Long-Term Profile Of Oil Prices
A Long-Term Profile Of Oil Prices
A Long-Term Profile Of Oil Prices
Chart I-10Book Profits On Long Gold / Short Oil And Copper Trade
Book Profits On Long Gold / Short Oil And Copper Trade
Book Profits On Long Gold / Short Oil And Copper Trade
Among oil plays, we have been overweight Mexico and Russia within EM, both in fixed income and equity universes. That said, for absolute return investors, we have not been recommending unhedged long positions in either Mexico or Russia because of our expectation of a drop in oil prices and the ensuing broad-based EM selloff. Regarding Russia, for investors who were looking to gain exposure to local currency bonds, we have been recommending that they hedge this position by shorting oil since November 14, 2019. This recommendation has paid off well, and we are closing this position with a 26% gain. We will be looking to buy Russian local bonds unhedged in the weeks ahead. Chart I-11Relative Performance Of Russian And Mexican Domestic Bonds Is Facing Near-Term Headwinds
Relative Performance Of Russian And Mexican Domestic Bonds Is Facing Near-Term Headwinds
Relative Performance Of Russian And Mexican Domestic Bonds Is Facing Near-Term Headwinds
In Mexico, we have also been reluctant to recommend naked exposure to local currency or US dollar bonds because of our bearish view on oil and the risk of large outflows from EM that would hurt the peso. Indeed, the oil crash and outflows from EM have led to a plunge in the Mexican currency. Instead, in Mexico we have been recommending betting on yield curve steepening. The proposition has been that short rates are anchored by a disinflationary backdrop and tight fiscal policy in Mexico while the long end of the curve could sell off in a scenario of capital outflows from EM. As with Russia, we are monitoring Mexican markets and are looking to recommend buying domestic bonds without hedging the currency risk in the weeks or months ahead. Bottom Line: We are taking profits on our long gold/short oil and copper trade. Oil prices may stabilize, but risks are still skewed to the downside. In the near term, the relative performance of Mexican and Russian stocks and local currency bonds versus their respective EM benchmarks could be undermined by capital outflows from EM in general and these countries in particular (Chart I-11). Nevertheless, both nations’ macro fundamentals remain benign, and their fixed-income and equity markets will outperform their EM peers in the medium term. Arthur Budaghyan Chief Emerging Markets Strategist arthurb@bcaresearch.com Footnotes 1 Calculated as ratio of equal-weighted average of total return indices of cad, aud, nzd, brl, idr, mxn, rub, clp & zar relative to average of jpy & chf total returns (including carry); rebased to 100 at January 2000. Equities Recommendations Currencies, Credit And Fixed-Income Recommendations
Highlights Oil prices fell 30% when markets opened Monday morning, following a split between OPEC 2.0’s putative leaders – the Kingdom of Saudi Arabia (KSA) and Russia – over production cuts to balance global oil markets (Chart 1). If KSA and Russia are able to repair the break in what OPEC Secretary General Mohammad Barkindo once called their “Catholic Marriage” the sudden collapse in prices could serve a useful purpose in reminding producers, consumers and investors of the need for full-time management of production and inventories, and restore prices to the $60/bbl neighborhood in 2H20.1 If not, markets could be in for a drawn-out market-share war lasting the better part of this year, with damaging consequences for all involved, with Brent prices remaining closer to $30/bbl (Chart 2). Feature Much as we rely on modeling to guide our expectations, this is purely political at the moment. How Long Will The Oil Price Rout Last? That’s the question that repeatedly is being asked by clients following the breakdown in Vienna last week, and news over the weekend that KSA would engage a market-share war opened by Russian Energy Minister Alexander Novak prior to departing Vienna. Novak gave every impression of renewing a market-share war after Russia rejected the plan put forth by OPEC to remove an additional 1.5mm b/d of production from the market, to combat the demand destruction expected in the wake of COVID-19. The only answer we have to the question: No one knows with certainty. Chart 1Oil Sell-Off Accelerates, As Market-Share War Looms
Oil Sell-Off Accelerates, As Market-Share War Looms
Oil Sell-Off Accelerates, As Market-Share War Looms
Chart 2A Market-Share War Will Keep Oil Prices Depressed
A Market-Share War Will Keep Oil Prices Depressed
A Market-Share War Will Keep Oil Prices Depressed
Neither of the principal actors responsible for the 30% rout in oil prices on Monday morning when markets opened for trading – KSA and Russia – are providing guidance at present. Prices since recovered slightly and were down ~ 20% Monday afternoon. Much as we rely on modeling to guide our expectations, this is purely political at the moment. There are two large personalities involved – Saudi Crown Prince Mohammad bin Salman bin Abdulaziz Al Saud and Russian President Vladimir Putin – who have staked out opposing positions on the level of production cuts needed to balance markets in the short term, as the COVID-19 outbreak spreads beyond China leaving highly uncertain demand losses in its wake.2 If a meeting of OPEC 2.0’s leadership can be arranged before the end of March, a hope expressed by Iran's Oil Minister Bijan Namdar Zanganeh in a Bloomberg interview over the weekend,3 the stage could be set for a rapprochement between KSA and Russia allowing them to repair the rupture in the OPEC 2.0 leadership. Should that occur, the rally in prices could be dramatic – maybe not as dramatic as today's price collapse when markets awoke to the opening rounds of a full-on market-share war between OPEC and Russia. But, over the course of the next few weeks, prices for 2H20 Brent and WTI would begin recovering and moving back toward $60/bbl as markets price in lower inventories on the back of a return to production discipline by OPEC 2.0. If we do not see such a meeting next week, markets will be forced to price in a prolonged price-war that could extend into the end of this year, which will not be easy to arrest. If, as seems to be the case, the Russians' goal is to directly attack shale-oil production in the US with a market-share/price war, the effort most likely will fail. True, there will be an increase in bankruptcies among the shale producers and their services companies. This will set up another round of industry consolidation – i.e., more M&A in the US shales – with the large integrated multinational oil companies that now dominate these provinces adding to their holdings. It is worthwhile remembering that US bankruptcy law recycles assets; it does not retire them permanently. In addition, the acquirers of bankrupt firms’ assets get them at a sharp discount, which greatly helps their cost basis. So, shale assets will change hands, stronger balance sheets will take control of these assets, and a leaner, more efficient group of E+Ps will emerge from the wreckage. What’s Being Priced? It is in neither KSA’s nor Russia’s interest to engage in a prolonged market-share war that keeps Brent prices closer to $30/bbl than to $70/bbl. We estimate oil markets now have to price in the return of ~ 2.8mm b/d of OPEC 2.0 production at the end of this month – i.e., a 10% increase of GCC output, led by KSA’s production getting up to 11mm b/d by year-end; ~ 600k b/d of cuts we were assuming would be approved in last week’s Vienna meetings; and ~ 260k b/d from Russia (Chart 3). This could be understated, as KSA claims 12.5mm b/d of capacity (including its spare capacity). Unchecked supply growth would force inventories to build this year (Chart 4). In fact, absent a return to production-management by OPEC 2.0, oil markets will extrapolate the higher production and low demand into an expectation for steadily rising inventories, that will – once it becomes apparent the supply of storage globally will be exhausted – force prices toward $20/bbl. Weaker-than-expected demand growth would accelerate this process. Chart 3Higher Production Will Overwhelm Demand In Market-Share War
Higher Production Will Overwhelm Demand In Market-Share War
Higher Production Will Overwhelm Demand In Market-Share War
Chart 4Market-Share War Could Exhaust Storage Forcing Production Out of The Market
Market-Share War Could Exhaust Storage Forcing Production Out of The Market
Market-Share War Could Exhaust Storage Forcing Production Out of The Market
It is in neither KSA’s nor Russia’s interest to engage in a prolonged market-share war that keeps Brent prices closer to $30/bbl than to $70/bbl. The apparent unwillingness of Putin and the Russian oligarchs running the country’s oil companies to make relatively small additional production cuts – vis-à-vis what KSA already has delivered – to support prices has not been well explained by Russian producers. The revenue benefits from small production cuts almost surely exceed the additional revenue that would accrue from a 200-300k b/d increase in output and keeping prices in the $30-$40/bbl range, a level that is below Russian producers' cost of production onshore and offshore, according to the Moscow Times. KSA's costs are ~ $17/bbl on the other hand.4 Russia’s economy was wobbly going into the Vienna meetings, which makes sorting this out even more complicated. One thing that can be said for certain is that over the past six months Vladimir Putin has entered into another consolidation phase in attempting to quell public unrest, improve the government’s image, and tighten up control over the country, while preparing for another extension of his time as Russia’s supreme leader. A Battle For Primacy? At one level, it would appear the Russians were pushing back against an apparent demand by OPEC (the old cartel led by KSA) to fall in line. Russia’s rejection of the OPEC proposal could be read as an assertion of their position to show they were, at the very least, KSA’s equal in the coalition. A stronger read of the rejection, given the Russian Energy Minister’s comments following the breakdown in Vienna at the end of last week – "... neither we nor any OPEC or non-OPEC country is required to make (oil) output cuts” – would be Russia was attempting to assert itself as the leader of OPEC 2.0. Giving Russia what amounted to a take-it-or-leave-it ultimatum on production cuts was a high-stakes gamble on KSA’s part. On KSA’s side, it is likely the Saudis grew irritated with the Russian failure to get on board to address a global oil-demand emergency that was spreading beyond China, when they were discussing extending and deepening production cuts in the lead-up to last week’s meetings. Giving Russia what amounted to a take-it-or-leave-it ultimatum on production cuts was a high-stakes gamble on KSA’s part, to say the least. However, as OPEC’s historic kingpin, KSA may have believed its role was to lead the coalition. Russia’s in a better position now relative to KSA in the short term vis-à-vis foreign reserves ($446 billion), budget surplus (~ $8 billion), and its lower fiscal breakeven price for oil ($50/bbl) vs KSA’s ($84/bbl), as we discussed in our Friday alert (Chart 5). However, with Russian per-capita GDP at ~ half that of KSA’s, it is highly likely – if this market-share war is prolonged – its citizens are going to be hit with the consequences of the oil-price collapse in short order: FX markets are selling ruble heavily today, and, in short order this will feed through into higher consumer prices and inflation. Indeed, we estimate a 1 percentage-point (pp) depreciation in the ruble vs. the USD y/y leads to a 0.14pp increase in Russian inflation (Chart 6). Chart 5Foreign Exchange Reserves
Foreign Exchange Reserves
Foreign Exchange Reserves
Chart 6Russian Ruble Sell-Off Presages Inflation
Russian Ruble Sell-Off Presages Inflation
Russian Ruble Sell-Off Presages Inflation
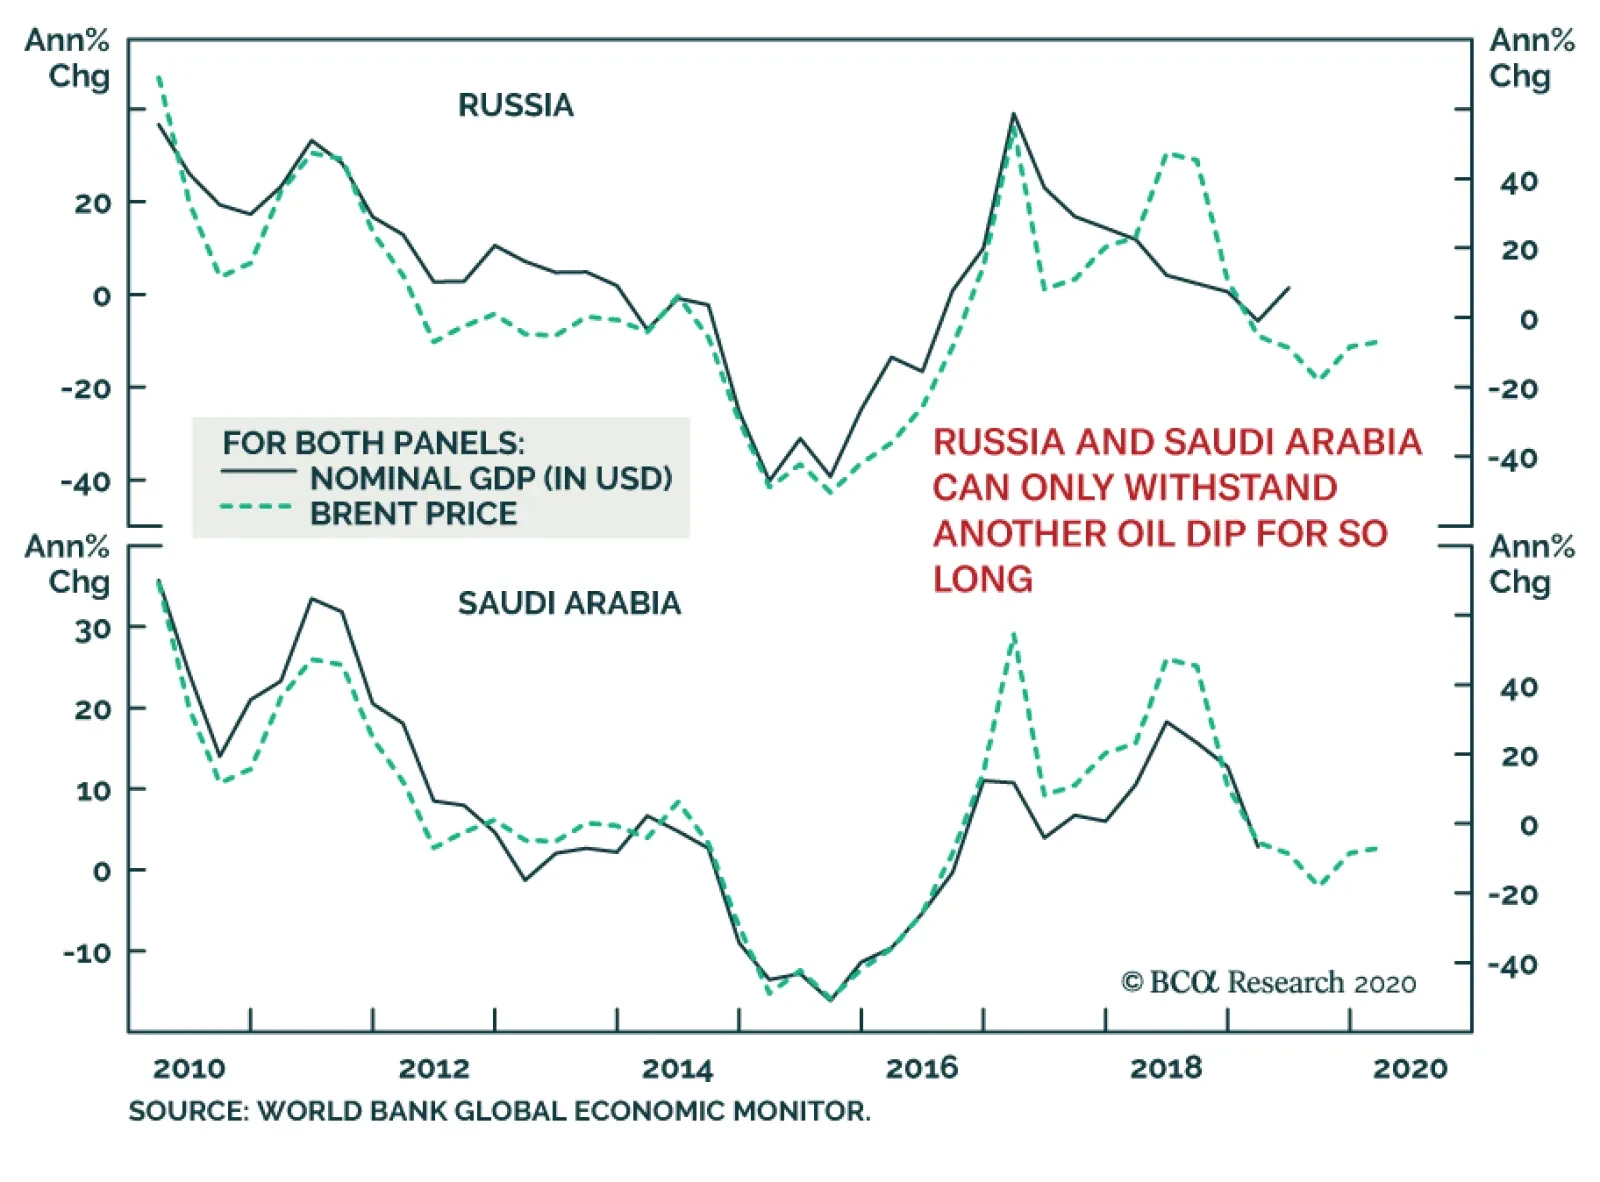
The Saudi riyal is pegged to the USD, and does not move as much as the ruble. However, KSA’s citizens also will be buffeted once again by a collapse in oil prices, as they were during the 2014-16 market-share war when government revenues came under severe stress. Things To Watch The OPEC 2.0 joint market-monitoring committee could meet again next week in Vienna, but that is not a given. If they do meet, the agenda likely will be dominated by trying to find a face-saving way for both sides to resume production management. Arguably, the presumptive target of the Russian strategy – US shale producers – will be severely damaged by this week’s price collapse, and both could argue the short-term tactic of threatening a price war was a success. The Saudis could also go for a quick solution, if their primary objectives are to sort things out with Russia, stabilize the global economy, and keep President Trump in office, rather than to push down prices in an adventurous attempt to escalate Iran’s internal crisis. We believe Russia badly miscalculated, and was too early in making a play for dominance in OPEC 2.0, if that was its intent. If, on the other hand, these large personalities cannot agree, the price collapse begun today will continue until global oil storage – crude and products – is filled, forcing prices through cash costs of all but the most efficient producers in the world. This level is below $20/bbl. These lower prices could redound to the benefit of China, as fiscal and monetary stimulus provided by policymakers there in the wake of COVID-19 to get the economy back on track for 6% p.a. growth gets super-charged by low oil prices. Bottom Line: We believe Russia badly miscalculated, and was too early in making a play for dominance in OPEC 2.0, if that was its intent. Russian GDP has twice the sensitivity to Brent prices that KSA does, which means such a tactic takes a toll on it as well as the shale producers (Chart 7). Capital markets had the US shale producers on the ropes, so it is difficult to argue there was a need to accelerate the process and shock the world. We again note a full-blown market-share war will set up another round of industry consolidation in the US shales, but, over the medium to longer term, the shale assets of bankrupt companies will only be re-cycled to more efficient operators, as we saw following the last market-share war. This will contribute to a stronger shale sector in the US in the medium term. Chart 7Russian GDP More Sensitive to Brent Prices
Russian GDP More Sensitive to Brent Prices
Russian GDP More Sensitive to Brent Prices
The only other consolation for Russia is a higher likelihood of regime change in the US (more political polarization in the US benefits Russia), and yet the Trump administration has been the most pro-Russian administration in years so this is not at all a clear objective. We will be watching very closely for a meeting of OPEC 2.0’s joint committee next week. If we get it and a face-saving resolution is agreed by KSA and Russia we would expect stronger demand growth in 2H20 to absorb whatever unintended inventory accumulation a still-born price war causes. If not, we will expect a price war into the end of the year, after which the economies of oil producers globally will have been sufficiently battered to naturally force production lower and investment in future production to contract sharply. At that point, oil and oil equities will be an attractive investments for the medium and long term. Robert P. Ryan Chief Commodity & Energy Strategist rryan@bcaresearch.com Footnotes 1 Please see Russia and Saudi Arabia Hold 'Catholic Marriage' with Poem and Badges, Form Enormous Oil Cartel published by Newsweek July 3, 2019. 2 We will be updating our demand estimates in Thursday’s publication, after we get fresh historical data from the principal providers (EIA, IEA, OPEC). 3 Please see Iran's Oil Minister Wants OPEC+ Output Cut, Hopes for Russia Meeting Soon published by Bloomberg, March 8 2020. 4 Please see Russian Oil Production Among Most Expensive in World published November 12, 2019 by The Moscow Times.

On Monday, gold suffered from the indiscriminate selling wave prompted by margin calls. In an environment where yields fell to an intraday low of 0.31% and the dollar sold off violently against both the yen and the euro, gold softened by $40 between Sunday…
Yesterday, BCA Research's Commodity & Energy Strategy and Geopolitical Strategy services wrote that the OPEC 2.0 joint market-monitoring technical committee could meet again next week in Vienna. If they do meet, the agenda will be dominated by trying…
Last Friday, BCA Research's Commodity & Energy Strategy service argued that oil markets once again are faced with a possible price collapse – not unlike the swan dive seen when OPEC’s market-share war took prices from more than $110/bbl in mid-2014 to…
Highlights Crude oil prices fell ~ 10% Friday after Russia refused to support additional production cuts agreed by OPEC in Vienna (Chart 1). As we go to press, Brent is trading close to $45/bbl and WTI is trading ~ $41/bbl. OPEC producers could implement the go-to strategy they’ve employed in the wake of past demand shocks and cut production on their own, in order to balance the market. That said, there are indications the Saudis will not shoulder the market-balancing role alone. Russian producers have consistently demanded relief from production restraints since 2017, when OPEC 2.0 took over balancing the market. With shale-oil producers on the back foot owing to parsimonious capital markets, Russia could finally be able to deliver the coup de grâce it has been waiting for. This supply shock hits the market as COVID-19 threatens demand globally. Whatever Russia’s intent – be it removing the near-certainty of a production cut, which it always agreed to in the past, or crippling US shale production – two-way risk has returned to these Vienna meetings. Feature Oil markets once again are faced with a possible price collapse – not unlike the swan dive seen when OPEC’s market-share war took Brent from more than $110/bbl in mid-2014 to $26/bbl by early 2016. The proximate aim of that market-share war – led by the Kingdom of Saudi Arabia (KSA) – was to significantly reduce the revenue Iran would receive when it returned to export markets, following its agreement with the US to end its nuclear program in 2015. Tanking oil prices was the most expedient way of accomplishing this. Secondarily, shale-oil producers also may have been targeted, although such a goal was never clearly articulated by KSA’s leadership. Chart 1Russia's Supply Shock Craters Brent, WTI Prices
Russia's Supply Shock Craters Brent, WTI Prices
Russia's Supply Shock Craters Brent, WTI Prices
OPEC’s market-share war did thin the US oil-shale herd, but it did not destroy the industry. If anything, it forced shale-oil producers to focus on their best drilling prospects with their best rigs and crews. This produced a leaner more productive technology-driven cohort of drillers, which posted record production levels on a regular basis. Indeed, by the end of 2019, US production topped 12.9mm b/d – 8.2mm b/d of which was accounted for by shale-oil output – making the US the largest oil and gas producer in the world. The market-share war also brought KSA and Russia together in November 2016 as the putative leaders of OPEC 2.0. The sole mission of this unlikely coalition was to clear the global inventory overhang left in the wake of the market-share war by managing OPEC and non-OPEC production. Russia’s Coup de Grâce Managing global production and inventories with KSA – while US shale-oil producers continued to raise their output to new records regularly – never sat well with Russia’s oil producers. Managing global production and inventories with KSA – while US shale-oil producers continued to raise their output to new records regularly – never sat well with Russia’s oil producers. Ahead of OPEC 2.0 meetings in Vienna, Russian oligarchs could be counted on to demand higher output levels, and President Vladimir Putin could be counted on to deliver something close to agreed production cuts in time to assuage markets. This semi-annual ritual came to resemble a tightly choreographed set-piece, which may have inured market participants to the oligarchs’ resolve to ultimately increase production levels. Russia certainly was well-prepared when it delivered Friday’s supply shock. Time will tell, but Friday’s breakdown in Vienna could be the coup de grâce Russia’s oligarchs have been waiting to deliver to US shale producers since the formation of OPEC 2.0. Or it could be a well-timed reminder that nothing in oil markets is certain – particularly Russian compliance with production-restraint agreements. The once-certain 11th-hour agreement to adhere to whatever production-cutting agreements OPEC 2.0 came up with is now gone. And with it, the high-probability bet that, regardless of the tensions leading up to the Vienna meetings, a production-management agreement would be delivered, and shale-oil producers would live to fight another day. Chart 2Russia, KSA Foreign Exchange Reserves
Russia, KSA Foreign Exchange Reserves
Russia, KSA Foreign Exchange Reserves
Whatever the case, Russia certainly was well-prepared when it delivered Friday’s supply shock. It has steadily built its foreign-exchange reserves since the price collapse begun in 2014, which now stand at $446 billion, up 45% from their nadir of 2015 (Chart 2). KSA’s foreign-exchange reserves, on the other hand, fell sharply in the wake of the 2014 – 2016 market-share war and have languished at lower levels since. Chart 3Russia, KSA Per-Capita Income
Russia's Supply Shock To Oil Markets
Russia's Supply Shock To Oil Markets
Still, the Kingdom is not without stout resources. It’s gross national income per capita is ~ 2x that of Russia’s (Chart 3), and its days-forward import cover expressed in terms of days of foreign reserves is similarly stout (Chart 4). Chart 4Russia, KSA Import Cover
Russia's Supply Shock To Oil Markets
Russia's Supply Shock To Oil Markets
The economies of both KSA and Russia are exquisitely linked to Brent oil prices (Chart 5). So tempting another market-share or price war is a strategy that could not be sustained by either country for an extended period of time. Chart 5Russia, KSA GDP vs Brent Prices
Russia, KSA GDP vs Brent Prices
Russia, KSA GDP vs Brent Prices
Chart 6Russia, KSA GDP Highly Sensitive To Brent Prices
Russia, KSA GDP Highly Sensitive To Brent Prices
Russia, KSA GDP Highly Sensitive To Brent Prices
The End Of OPEC 2.0? Post-GFC, we estimate Russia’s real GDP elasticity to changes in oil prices is close to twice that of Saudi Arabia. This suggests Russia’s strategy could have dismal consequences for its economy. Oil markets will gnaw on Friday’s breakdown in Vienna, sorting out the signals that were missed in Russian messaging, and figuring out what happens next. Neither Russia nor KSA have the resources to wage an indefinite war of attrition with US shale producers. Both are highly dependent on oil revenues to sustain their economies (Chart 6). Of the two, Russia’s economy is more sensitive to Brent oil prices than KSA’s, as it markets more of its output in trading markets. Post-GFC, we estimate Russia’s real GDP elasticity to changes in oil prices is close to twice that of Saudi Arabia. This suggests Russia’s strategy could have dismal consequences for its economy. Russia’s $50/bbl fiscal breakeven price vs. KSA’s $84/bbl price might give Russia more staying power in the short run, but with per-capita income at roughly half that of Saudi citizens, it will not want to revisit the dire days of 2014-16 when its economy last suffered through an oil-price collapse. Robert P. Ryan Chief Commodity & Energy Strategist rryan@bcaresearch.com
Highlights OPEC 2.0 ministers continue to negotiate oil production cuts to replace those expiring this month. We expect cuts of 1mm b/d – perhaps more – extending to end-June, undertaken to offset COVID-19-induced demand destruction. Making the not-unreasonable assumptions of no change in US sanctions-related output losses – 1mm b/d in Venezuela and 2mm b/d in Iran – and that 1mm b/d of Libyan output stays offline, the 1mm b/d cut coming out of this week’s meeting in Vienna will push average 1H20 OPEC 2.0 outages – planned and unplanned – to ~ 5mm b/d. The US economy is growing ~ 2.7% p.a., suggesting the Fed’s surprise 50bp rate cut this week is aimed at reducing global economic policy uncertainty (GEPU), lowering its accompanying USD safe-haven demand, and guarding against a collapse in US money velocity (Chart of the Week). This will weaken the USD, thereby supporting EM incomes and oil demand. We continue to expect policymakers in China to overshoot on fiscal and monetary stimulus, as they scramble to deliver 6% pa growth this year. Feature In the wake of ongoing negotiations – right into today’s meeting in Vienna – we expect OPEC 2.0 to deliver a production cut of at least 1mm b/d for 2Q20. Maybe more. Gulf Cooperation Council (GCC) states have been lobbying for a large cut – 1mm b/d at least. The Kingdom of Saudi Arabia’s (KSA) consistently lobbied for such cuts, and was instrumental in achieving the 1.7mm b/d output reduction for this quarter when the coalition met at the end of last year in Vienna. KSA’s partner in OPEC 2.0, Russia, has been slow to support production cuts going into this week’s meeting, which is the stance it typically takes during these negotiations. Nonetheless, it did agree in December to cuts, and we expect they will do so again this week. After this go-round, we’re likely to see an agreement to meet in June to determine whether cuts should be extended and/or expanded.1 Chart of the WeekFed Rate Cut Meant To Reduce Uncertainty
Fed Rate Cut Meant To Reduce Uncertainty
Fed Rate Cut Meant To Reduce Uncertainty
The 1mm b/d in planned outages for 2Q20 coming out of this week’s meetings would add to the ~ 4mm b/d of unplanned outages in Venezuela, Iran and Libya this year. If the producer coalition fails to agree to a significant output cut this week, we would expect a sell-off in crude oil that takes Brent prices below $50/bbl, and WTI into the mid-$40s (Chart 2). An agreement to remove at least 1mm b/d of output likely will push Brent into the mid-$50s and WTI into the low-$50s during in 2Q20. Assuming the COVID-19 outbreak subsides by then, we expect Brent to rally in 2H20, with prices trading above $60/bbl and WTI trading $4/bbl below that on average. We will be updating our supply-demand balances and forecasts when we get fresh historical data from the key agencies (EIA, OPEC and IEA). The 1mm b/d in planned outages for 2Q20 coming out of this week’s meetings would add to the ~ 4mm b/d of unplanned outages in Venezuela, Iran and Libya. If these persist to end-June, planned and unplanned OPEC 2.0 production outages would average more than 5mm b/d in 1H20 (Chart 3). Chart 2A Failure To Cut Production Would Push Benchmark Crudes Lower
A Failure To Cut Production Would Push Benchmark Crudes Lower
A Failure To Cut Production Would Push Benchmark Crudes Lower
Chart 3Core OPEC 2.0 Will Agree Cuts
Core OPEC 2.0 Will Agree Cuts
Core OPEC 2.0 Will Agree Cuts
On the demand side, the big global hit to growth from China in 1Q20 should be out of the system by the end of 1H20, assuming the COVID-19 outbreak does not shut down global commerce the way it did in China. We think the odds of such a shutdown are low, given such policies only can be implemented by a central government in which all power is consolidated in a ruling party. Besides, given the massive hit to China’s manufacturing – auto production was down 80% y/y in February, e.g. – such policies are unlikely to be recommended in all but the most dire of circumstances. We continue to expect Chinese policymakers to overshoot on their fiscal and monetary stimulus, as they scramble to get 2020 GDP growth back above a 6% p.a. rate. Our view aligns with BCA’s China Investment Strategy, which last week observed, “It is becoming evident that the Chinese leadership is willing to abandon its financial de-risking agenda in exchange for a rapid economic recovery.”2 Our colleagues go on to note, “Monetary conditions are already more accommodative than during the last easing cycle in 2015/2016. The recently announced policy initiatives on infrastructure, housing, and automobile sectors also resemble policy supports that led to a V-shaped economic recovery in 2016.” Fed Cuts Rates To Reduce Uncertainty The economic pressure arising from a strong USD is particularly acute for EM economies. Even before the COVID-19 outbreak in China at the end of last year, global economic policy uncertainty (GEPU) and the broad trade-weighted USD (USD TWIB) were hitting new highs. This was driven by trade wars, the emergence of left- and right-wing populists globally, uncertainty over the effectiveness of monetary policy, and a host of other issues that drove investors, firms and households to seek safe-haven assets like the dollar (Chart 4). In fact, these variables became highly correlated over the past 3-, 4- and 5-year intervals.3 The novel coronavirus outbreak in China, which literally shut down China’s economy in January and February, added to this uncertainty. It continues to lurk in the background now that the coronavirus has spread globally. This also contributes to safe-haven USD demand. While a rate cut cannot address the COVID-19 directly, it can loosen financial conditions – thus removing some uncertainty at the margin – and reduce USD strength. The economic pressure arising from a strong USD is particularly acute for EM economies, which are the dominant source of commodity demand growth globally (Chart 5). At the margin, this demand for dollars arising from increased global policy uncertainty suppresses oil demand growth in EM economies, by raising its cost in local-currency terms ex-US and ex-GCC producing states with currencies pegged to the dollar. It also incentivizes production at the margin, as local-currency costs are depressed, which reduces local costs, while revenues are realized in USD – the perfect arb. Chart 4Global Uncertainty Was High Before COVID-19 Hit Markets
Global Uncertainty Was High Before COVID-19 Hit Markets
Global Uncertainty Was High Before COVID-19 Hit Markets
Chart 5EM Growth Suppressed By Strong USD
EM Growth Suppressed By Strong USD
EM Growth Suppressed By Strong USD
Exploring The Dominant Currency Paradigm The USD’s dominance of global trade is receiving considerable attention in academia and at the Fed. The USD’s dominance of global trade is receiving considerable attention in academia and at the Fed. One theory we find useful is the “Dominant Currency Paradigm,” which holds the dollar is the dominant currency in the world and is used disproportionally vis-à-vis its GDP weight in the global economy (Chart 6). Its dominance is reflected in (1) invoicing of international trade, (2) bank funding, (3) corporate borrowing, (4) central-bank reserve holdings, and (5) the relatively low expected returns accruing to USD-denominated risk-free assets that violate uncovered interest-rate parity no-arbitrage conditions – i.e., the dollar’s so-called “exorbitant privilege.”4 Chart 6USD Is The Dominant EM Invoicing Currency
OPEC 2.0 Cuts, Fed Rate Cuts Will Support Oil Prices
OPEC 2.0 Cuts, Fed Rate Cuts Will Support Oil Prices
Demand for USD rises when global economic policy uncertainty rises, which is why dollar liquidity is crucial: When demand for safe asset spikes, there is a need for aggressive liquidity (supply) of dollar to avoid a market collapse (Chart 7).5 By cutting US rates now, the Fed is effectively increasing USD supply and/or removing some of the demand for USD relative to other currencies. This will be especially important if global economic policy uncertainty remains strong. This somewhat buffers EM corporates and governments with high levels of USD-denominated debt against a rush to safe-haven USD holdings. We believe this will ease financial conditions in EM economies, which should, all else equal, provide more of a shock absorber for uncertainty generally. Chart 7Dollar Liquidity Mutes US Dollar Appreciation
Dollar Liquidity Mutes US Dollar Appreciation
Dollar Liquidity Mutes US Dollar Appreciation
Our modeling suggests higher global economic policy uncertainty (GEPU) can shock the USD TWIB, US 10-year Treasurys and EM trade volumes directly. In addition, USD-denominated debt is relatively pronounced in some EM economies (Chart 8). USD appreciation increases domestic banks’ liabilities vs. assets. This is negative for bank’s balance sheets and leads to a tightening in financial conditions, which limits growth. EM corporate bond issuers are exquisitely sensitive to USD movements as they affect their capacity to service foreign-currency debt. Chart 8A Strong US Dollar Hurts Vulnerable EM Economies
OPEC 2.0 Cuts, Fed Rate Cuts Will Support Oil Prices
OPEC 2.0 Cuts, Fed Rate Cuts Will Support Oil Prices
It is important to remember the US economy continues to perform relatively strongly against other major economies, with 1Q20 US GDP growth estimated by the Atlanta Fed’s Nowcast at 2.7% p.a. The fact that the Fed surprised markets with a 50bp rate cut suggests to us it is concerned with EM growth slowing sharply if the coronavirus becomes a global threat. The Fed also is likely to be concerned that lower US consumer confidence will lead to a decrease in the velocity of money. This concern also is addressed by increasing money supply pre-emptively. Our modeling suggests higher global economic policy uncertainty (GEPU) can shock the USD TWIB, US 10-year Treasurys and EM trade volumes directly, and that these shocks can persist (Chart 9).6 The Fed's policy action today will, if our modeling is correct, reduce demand for USD as a safe haven, all else equal, reduce long-term US rates and boost EM trade volumes. Bottom Line: We expect OPEC 2.0 to deliver at least 1mm b/d of production cuts in 2Q20, which will be reviewed at the end of June to determine whether they should be extended or deepened. Global economic policy uncertainty remains high, supporting demand for the USD. We believe the Fed’s surprise rate cut this week was directed at alleviating some of the global uncertainty keeping the USD well bid, in an attempt to buffer EM economies affected by USD demand. It also is a safeguard against a collapse in the velocity of money in the US that could occur if uncertainty were to suddenly rise. Chart 9GEPU Shocks Are Transmitted To USD And US Treasurys
OPEC 2.0 Cuts, Fed Rate Cuts Will Support Oil Prices
OPEC 2.0 Cuts, Fed Rate Cuts Will Support Oil Prices
Robert P. Ryan Chief Commodity & Energy Strategist rryan@bcaresearch.com Hugo Bélanger Associate Editor Commodity & Energy Strategy HugoB@bcaresearch.com Commodities Round-Up Energy: Overweight The EIA’s weekly inventory report gives no evidence of a COVID-19-induced backup in crude and product inventories in the US. Total stocks of crude and products fell almost 12mm barrels last week on the back of strong product draws, led by gasoline and distillates, both of which were down close to 5mm barrels on the week. Commercial crude oil inventories were mostly unchanged at ~ 445mm barrels. Crude oil exports rose almost 500k b/d last week to 4.15mm b/d, accounting for most of the 9.73mm b/d of crude and product exports from the US. (Chart 10). Base Metals: Neutral Expectations China will deploy aggressive stimulus targeting infrastructure and manufacturing activities in response to the COVID-19 outbreak, along with Brazil reporting a 15% month-on-month decline in exports of iron ore helped iron ore and steel futures post significant gains earlier this week, with the Singapore Exchange's 62% Fe Iron Ore futures closing 5.6% higher on Monday. However, these gains were short-lived – and will remain capped in the short-term – as weak Chinese demand persists and steel rebar inventories remain at record highs. Precious Metals: Neutral Amid a broader market sell-off gold prices dipped 4.5% on Friday – the worst performance since 2013 – but have since recovered, on the back of the Fed’s surprise rate cut this week. The US central bank delivered an emergency 50bps rate cut on Tuesday, gold erased all the losses with spot prices rising 3.2% at the close, to reach $1645.27/oz. Silver followed a similar pattern rebounding 2.9% on Tuesday, closing at $17.22/oz. We are long both metals and believe more upside is yet to come if central banks around the world coordinate on additional monetary easing (Chart 11). Ags/Softs: Underweight Expectations of a stronger stimulus in response to COVID-19 pushed soybeans higher for a third consecutive day on Tuesday, with prices hitting a 6-week high intraday. Bean prices then retreat and close 0.3% higher than the previous session. Gains were capped by favorable weather conditions in Brazil, leading analysts to expect a record harvest this season. Wheat also rebounded on the Fed’s rate-cut news after a sluggish week that saw prices falling almost 5%. Uncertainty still reigns though, as the Australian Bureau of Agriculture crop report predicts wheat output to recover 41% to 21.4 Mn Mt in 2020, due to rainfall ending a period of severe drought. The most active wheat futures were up 0.8% at Tuesday’s close. Chart 10US Crude Oil Exports Are Rising
US Crude Oil Exports Are Rising
US Crude Oil Exports Are Rising
Chart 11Lower Real Rates Will Support Gold
Lower Real Rates Will Support Gold
Lower Real Rates Will Support Gold
Footnotes 1 We do not rule out the possibility KSA or the GCC core producers shoulder the lion’s share of the cuts they seek, in order to balance the market. 2 Please see China: Back To Its Old Economic Playbook? published by BCA Research’s China Investment Strategy February 26, 2020. It is available as cis.bcaresearch.com. 3 This heightened uncertainty – i.e., the increase in “unknown unknowns” markets are attempting to process – is a recurrent theme in our research. See, e.g., 2020 Key Views: Policy Uncertainty Continues To Drive Commodity Markets published December 19, 2019. It is available at ces.bcaresearch.com. 4 Please see Gopinath, Gita and Jeremy Stein. “Banking, Trade, and the Making of a Dominant Currency,” Working Paper currently under revision for the Quarterly Journal of Economics. 5 Gopinath (2016) finds that the dollar’s share as an invoicing currency for imported goods is approximately 4.7 times the share of U.S. goods in imports. Please see Gopinath, Gita. “The International Price System.” Jackson Hole Symposium Proceedings, published in January 2016. See also Obstfeld, Maurice (2019), “Global Dimensions of U.S. Monetary Policy,” presented at the Federal Reserve Board Conference on Monetary Policy Strategy, Tools, and Communication Practices (A Fed Listens Event) in Washington June 4, 2019. 6 Our results reflect the vector autoregression (VAR) model we use to study the interaction of GEPU shocks and the USD TWIB and US 10-year treasurys. Investment Views and Themes Strategic Recommendations Tactical Trades TRADE RECOMMENDATION PERFORMANCE IN 2019 Q4
OPEC 2.0 Cuts, Fed Rate Cuts Will Support Oil Prices
OPEC 2.0 Cuts, Fed Rate Cuts Will Support Oil Prices
Commodity Prices and Plays Reference Table Trades Closed in 2020 Summary of Closed Trades
OPEC 2.0 Cuts, Fed Rate Cuts Will Support Oil Prices
OPEC 2.0 Cuts, Fed Rate Cuts Will Support Oil Prices
Feature “Bayesian: …statistical methods that assign probabilities or distributions to events…based on experience or best guesses before experimentation and data collection and that apply Bayes' theorem to revise the probabilities and distributions after obtaining experimental data.” — Merriam-Webster Dictionary Markets have reacted pretty rationally to the outbreak of the COVID-19 virus. Equities initially rebounded a few days ahead of the peak of new cases in China (Chart 1). But then, once the number of cases in the rest of the world started to accelerate, stock markets sold off again sharply. The MSCI All Country World Index is now down 13% from its peak on February 12. Recommended Allocation
Monthly Portfolio Update: A Classic Bayesian Dynamic
Monthly Portfolio Update: A Classic Bayesian Dynamic
Chart 1Markets Have Reacted In Line With New COVID-19 Cases
Monthly Portfolio Update: A Classic Bayesian Dynamic
Monthly Portfolio Update: A Classic Bayesian Dynamic
No one knows whether this episode will turn into an unprecedented pandemic, which will kill millions worldwide, last for months, and trigger a global recession. So it is the sort of environment in which Bayesian analysis becomes useful. Our “prior” for the probability of a full pandemic would be around 10-20%. If it doesn’t happen, an attractive buying opportunity for risk assets should present itself soon. But there could be further downside first, especially if the number of cases in major countries such as the US, Germany, and the UK were to accelerate significantly. There are some sign that Chinese activity is beginning to recover. There are some signs that Chinese activity is beginning to recover, as new cases of COVID-19 slow, thanks to the draconian measures taken by the authorities. Big Data can help analyze this. For example, live traffic statistics from TomTom show that by February 28, weekday road congestion in Shanghai was back to 50% of its normal level, compared to 19% on February 14 (Chart 2). The Chinese authorities have relaunched fiscal and monetary stimulus, causing short-term rates to fall to their lowest level since 2010 (Chart 3). Monetary policy has been upgraded from “prudent” to “flexible and moderate.” BCA Research’s China strategists believe there is even an increasing possibility of a stimulus overshoot in the next 6-12 months, as the authorities plan for the worst-case scenario but the economy rebounds.1 Chart 2Chinese People Getting Back On The Roads
Monthly Portfolio Update: A Classic Bayesian Dynamic
Monthly Portfolio Update: A Classic Bayesian Dynamic
Chart 3Chinese Stimulus Pushing Down Rates
Monthly Portfolio Update: A Classic Bayesian Dynamic
Monthly Portfolio Update: A Classic Bayesian Dynamic
In the short-term, it is clear that global growth will weaken, though quantifying this is hard. A 1% quarter-on-quarter decline in Chinese GDP in Q1 would bring growth down to 3.5% year-over-year. Our colleagues in BCA’s Global Investment Strategy estimate this would cause global growth to fall 0.8% below trend in Q1, mainly from a contraction in tourism, but that this would be largely made up in Q2, assuming that the epidemic is over by then (Chart 4).2 Could even a limited epidemic tip the world into recession? We doubt it. Consumer confidence remains strong in developed economies (Chart 5) and the virus is not yet serious enough to stop most consumers going out to spend. The global economy was in the process of bottoming out before COVID-19 hit (Chart 6) and there is little reason to think that we will not return to the status quo ante. Chart 4Global Growth To Slow In Q1, But Rebound In Q2
Monthly Portfolio Update: A Classic Bayesian Dynamic
Monthly Portfolio Update: A Classic Bayesian Dynamic
Chart 5Consumers Remain Confident
Monthly Portfolio Update: A Classic Bayesian Dynamic
Monthly Portfolio Update: A Classic Bayesian Dynamic
Chart 6Before COVID-19, Growth Was Bottoming Out
Monthly Portfolio Update: A Classic Bayesian Dynamic
Monthly Portfolio Update: A Classic Bayesian Dynamic
We see the two biggest risks being: 1) a rise in defaults in China, especially among smaller companies, that the government is unable or unwilling to prevent (Chart 7); and 2) a deterioration in the jobs market in the US, as companies start to postpone hiring, or lay off staff (Chart 8). We will watch these carefully over coming weeks. Chart 7Are Chinese Companies Vulnerable?
Monthly Portfolio Update: A Classic Bayesian Dynamic
Monthly Portfolio Update: A Classic Bayesian Dynamic
Chart 8Is The US Job Market Starting To Wobble?
Monthly Portfolio Update: A Classic Bayesian Dynamic
Monthly Portfolio Update: A Classic Bayesian Dynamic
Chart 9Markets Believe Trump Would Beat Sanders
Monthly Portfolio Update: A Classic Bayesian Dynamic
Monthly Portfolio Update: A Classic Bayesian Dynamic
There is one other risk that might give equity markets an excuse for a further sell-off: November’s US presidential election. The probability that Bernie Sanders wins the Democratic nomination has risen to 60% from 15% over the past two months. The consensus believes that Trump can easily defeat Sanders, which is why the President’s probability of being reelected has risen in tandem (Chart 9). But, if the economy starts to weaken and Trump’s approval rating slips, investors could become nervous about the likelihood of a market-unfriendly Sanders administration. We would not recommend long-term investors sell out of risk assets at this point. There could be an attractive buying opportunity over the next few weeks, and investors who have derisked should be looking for a reentry point. With US 10-year bonds yields at 1.2% and German yields at -60 basis points, it is hard to see much further upside for risk-free bonds. Equities should be able to outperform over the next 12 months, as growth rebounds following the COVID-19 episode. We have been recommending overweights in cash and gold, as hedges, since December, and these still make sense. However, if events over the coming weeks point to the risk of global pandemic being higher than we currently think, then investors should Bayesianally adjust and move more risk-off. Otherwise, a peak in COVID-19 cases ex-China should be a strong signal to buy risk assets again. Chart 10Why Should Long-Run Inflation Expectations Fall?
Monthly Portfolio Update: A Classic Bayesian Dynamic
Monthly Portfolio Update: A Classic Bayesian Dynamic
Fixed Income: US Treasurys have become investors’ safe haven of choice over the past few weeks. A marked drop in long-run inflation expectations (Chart 10), in particular, has pushed the 10-year yield to a record low. This seems somewhat illogical, since the Fed will announce this summer the results of its review of monetary policy, which is likely to lead to a more dovish long-term inflation target (perhaps a commitment to achieve 2% on average over the cycle). The market has also priced in at least three Fed rate cuts by year-end (Chart 11). The Fed will certainly cut rates if US growth falters as a result of COVID-19, but this is by no means a certainty. History shows that Treasury yields jumped sharply once previous viral outbreaks ended (Chart 12). We expect yields to be significantly higher in 12 months, and so are underweight duration and prefer TIPS over nominal bonds. Credit will continue to underperform in the risk-off phase, but some interesting opportunities should arise soon, especially among the lowest-rated credits and in the Energy sector. Chart 11Will The Fed Really Be This Accommodating?
Monthly Portfolio Update: A Classic Bayesian Dynamic
Monthly Portfolio Update: A Classic Bayesian Dynamic
Chart 12After Previous Virus Outbreaks, Rates Leapt
Monthly Portfolio Update: A Classic Bayesian Dynamic
Monthly Portfolio Update: A Classic Bayesian Dynamic
Equities: The sell-off has already put on fire sale some stocks most affected by the epidemic. For example, cruise lines are down by 40% over the past month or so, European oil stocks 25%, some luxury goods makers 30%, and airlines 30%. Opportunistic investors might want to buy a basket of the most oversold quality names. Our overweight on euro area stocks has not worked in the sell-off. But, as a cyclical, export-oriented market, we continue to expect Europe to outperform when global growth rebounds. Euro area banks, in particular, represent the best call option on a rise in bond yields, since their performance is highly correlated to the shape of the yield curve. We continue to have a somewhat cyclical tilt among our sector weightings (with overweights on, for example, Energy and Industrials), but may adjust this in our Quarterly Portfolio Outlook in early April if we decide to reduce risk. The sell-off has already put on fire sale some stocks most affected by the epidemic. Currencies: The dollar is a safe-haven currency and so, unsurprisingly, has benefitted from the rush to safety in recent weeks. However, it remains overvalued (Chart 13), and interest rate differentials would move further against it if the Fed does cut rates, since other major developed central banks have much less room to move (Chart 14). This suggests that it will probably resume the weakness it experienced from August to December last year as soon as global growth rebounds. Chart 13Dollar Is Overvalued...
Monthly Portfolio Update: A Classic Bayesian Dynamic
Monthly Portfolio Update: A Classic Bayesian Dynamic
Chart 14...And Interest Differentials Have Moved Against It
Monthly Portfolio Update: A Classic Bayesian Dynamic
Monthly Portfolio Update: A Classic Bayesian Dynamic
Chart 15Metals Prices Stabilized In Recent Weeks
Monthly Portfolio Update: A Classic Bayesian Dynamic
Monthly Portfolio Update: A Classic Bayesian Dynamic
Commodities: Industrial metals fell sharply on the outbreak of COVID-19 in China, but have bottomed in line with the stabilization of the situation in that country (Chart 15). Gold has worked predictably as the best hedge in the sell-off. While it is starting to look technically overbought and would be hurt by a rise in bond yields (Chart 16), for prudent investors it remains a useful hiding place amid heightened risk and ultra-low interest rates. Oil is the commodity that has fallen the most surprisingly, with Brent close to the low it reached during the sell-off in December 2018 (Chart 17). It is much less dependent on Chinese demand than metals are, and so is maybe pricing in a global recession – as well as questioning the commitment of OPEC to cut production further. This would suggest upside to the oil price if global growth turns out not to be so bad, oil demand continues to pick up, and supply remains constrained. Chart 16How Much Could Gold Overshoot?
Monthly Portfolio Update: A Classic Bayesian Dynamic
Monthly Portfolio Update: A Classic Bayesian Dynamic
Chart 17Oil Discounting A Global Recession
Monthly Portfolio Update: A Classic Bayesian Dynamic
Monthly Portfolio Update: A Classic Bayesian Dynamic
Garry Evans, Senior Vice President Chief Global Asset Allocation Strategist garry@bcaresearch.com Footnotes 1 Please see China Investment Strategy Weekly Report, “China: Back To Its Old Economic Playbook?” dated 26 February 2020, available at cis.bcaresearch.com 2 Please see Global Investment Strategy Weekly Report, “Market Too Complacent About The Coronavirus,” dated 21 February 2020, available at cis.bcaresearch.com GAA Asset Allocation