You are reading a complimentary report. To find out more about our services,
Highlights
"When you come to a fork in the road, take it."
- Yogi Berra
The last time we invoked the great American philosopher Yogi Berra was in September 2015. Back then, the oil market was at a critical juncture, as the market-share war initiated by OPEC in November 2014 approached its dénouement.1
The signal feature of the oil market in September 2015 was a massive 1.5mm b/d oversupply that was rapidly filling storage globally. We noted this surplus "... either will be cleared gradually or convulsively. ... (H)igh-cost supply either will exit the market rationally ... or via sharp lurches toward cash-breakeven costs, as global inventories fill on the back of slowing demand in an oversupplied market. Either way, markets will balance."
In the event, prices lurched sharply into the left tail of the distribution toward cash-breakevens, with Brent approaching $25/bbl in 1Q16 (vs. more than $100/bbl in mid-2014).
Oil's at a critical juncture again. Only this time, prices are poised to push higher into the right tail of the distribution, ahead of the likely loss of 2mm b/d or more of exports on the back of U.S.-imposed sanctions against Iran, and the all-but-certain collapse of Venezuela's economy. In our modelling, these events - along with constrained U.S. shale oil output due to pipeline bottlenecks in the Permian basin, and still-strong demand assumptions - could send prices above $120/bbl.2
This is not a foregone conclusion, however. Downside risks to global oil demand - largely from tariffs and non-tariff barriers to trade, and the Fed's monetary policy - are building. In this Special Report, we expand our examination of downside risks to oil prices arising from divergent monetary policies at systematically important central banks, particularly their impacts on currency markets, which we began last week.
Feature
Chart of the Week
Oil Prices And USD TWIB Share
Long-Term Trend, Equilibrium
 Fullscreen Fullscreen |
We strongly believe Fed policy will, once again, become a key variable in the evolution of oil prices, mostly via the FX markets. As a result, our regular monthly oil price forecast will be complemented by an additional component: our U.S. trade-weighted dollar (USD TWIB) forecast. In the current market, this is a downside scenario not a revised expectation. The FX simulation we describe below for prices hugs the lower boundary of the 95-percent confidence interval we use to situate our scenarios within. This will allow us to judge our expectation against market-cleared expectations.
Our thesis that the USD's appreciation earlier this year would have a moderate effect on the evolution of oil prices - i.e., that supply-demand fundamentals would dominate this evolution - has been spot-on so far in 2018.3 This is largely due to OPEC 2.0's remarkable production discipline, and strong demand, particularly out of EM economies, which caused global inventories to draw, and kept the forward curves for Brent and WTI backwardated. 4
However, with the U.S. economy powering ahead - growing at a 3.1% rate in 1H18 - and, per our House view, the Fed continuing to lean into its rates-normalization policy, the USD will rise ~ 5% over the next year.5
We have shown in the past how important the USD can be for oil prices. Our oil financial model uses the USD as its main explanatory variable, and shows these variables are cointegrated in the long run - i.e. they share a common long-term trend and are in an equilibrium relationship (Chart of the Week). Consequently, forecasting the U.S. dollar is crucial step in our oil-price forecasting process.
The Fed And Oil Prices
As the Iran sanctions approach, OPEC 2.0 has indicated - not in a particularly clear manner - that it will be increasing production. While it appears the producer coalition will raise output slower than it previously led the market to believe, it is raising output.6 In addition, the U.S. Strategic Petroleum Reserve (SPR) also will be releasing 11mm barrels of oil over the October - November period. This short-term measure will help keep gasoline prices down going into the U.S. mid-term elections.
While OPEC 2.0 calibrates the output required to offset the Iran-Venezuela supply-side risks, demand growth is being threatened by tariff and non-tariff barriers to trade, and the Fed's monetary policy.7
Between tariffs and U.S. monetary policy, we believe Fed policy trumps U.S. trade policy ... at least for now.
Fed Policy Trumps Tariffs
A lot of ink has been spilled on the Sino - U.S. trade war, but so far, the actual damage done to the $17 trillion global trading markets is trivial (Chart 2). Of course, this could quickly change if the U.S. and China step up their tit-for-tat tariffs and both plunge into an all-out trade war.
Fed policy is neither trivial nor local: It is a global macro variable, largely because it impacts the U.S. dollar directly. This is important for EM economies, especially as it pertains to trade. We have shown EM imports and exports are exquisitely sensitive to the USD TWIB.8 This makes the USD TWIB particularly important to commodity markets, since most of the world's traded commodities are priced in USD and EM demand dominates global demand.
When the Fed is tightening, the dollar appreciates, and commodities priced in USD become more costly ex-U.S. at the margin. This lowers demand for goods priced in USD. In addition, a stronger USD lowers the cost of production ex-U.S., which, again, at the margin, incentivizes supply growth, since commodity producers effectively arbitrage their local currency weakness by selling their output for USD. This supply-side effect is tempered somewhat by the degree to which commodity producers ex-U.S. are exposed to dollar strength in their input markets. For example, if a producer's production inputs are priced in USD - e.g., drilling services - its margins suffer, and output increases are constrained or nullified.
The Fed is the only systematically important central bank we follow - the others being the ECB, BoJ and PBoC - implementing and executing an interest-rate normalization policy. This has supported USD strength against the systematically important currencies we follow, as well (Chart 3).
Chart 2
Tariffs Are A Less Threat To Global Growth ...
| Fullscreen |
Chart 3
Important Central Banks Keeping Policies Accommodative
| Fullscreen |
The IMF is encouraging the ECB to maintain its accommodative policy, and the BoJ also is keeping its policy relatively loose.9 The BoJ is keeping policy on hold for now, and is guiding to no rate hikes until 2020. Our colleagues in BCA's FX and Fixed Income desks expect the BoJ to continue with its Yield Curve Control Strategy for the remainder of the year, and most of next year. The absence of monetary tightening will keep Japanese yields lower than other major central banks. The PBoC appears to have moved toward a more accommodative mode, in the wake of the Sino - U.S. trade war. We believe the PBoC will remain accommodative in terms of official lending rates to avoid too-fast a deceleration of the economy, largely because of high private debt levels.10
EM Trade Volumes And Oil Prices
Against a largely accommodative backdrop ex-U.S., the USD TWIB appreciated ~5% y/y, while the JP Morgan Emerging Markets FX index dropped ~11% (Chart 4). In the wake of USD TWIB strength, EM trade volumes have held up reasonably well; but growth rates have been under pressure particularly in Central and Eastern Europe (Chart 5, bottom panel). This is being offset by a turn-around in the Middle East and Africa (third panel).
Chart 4
Fed Policy Drives USD Strength
| Fullscreen |
Chart 5
EM Trade Slowing, But Still Holding Up
| Fullscreen |
Assuming the Fed maintains its existing course re policy-rate normalization, our Fed-policy models indicate the USD TWIB will continue to strengthen (Chart 6).11 On the flip side of that, EM currencies will continue to weaken (Chart 7). This will keep pressure on EM trade volumes, particularly the important import volumes. Over the next year, we expect continued slowing in trade volumes, although, on average, we still expect y/y growth (Chart 8). While growth is slowing in EM trade, the levels of trade will remain high, unless a full-blown global trade war erupts that literally forces trade to contract.
Chart 6
Fed Policy Will Propel USD TWIB Higher...
| Fullscreen |
Chart 7
... And Keep EM Currencies Weaker
| Fullscreen |
Chart 8
Downward Trend In EM Trade Will Continue As USD Strengthens ...
| Fullscreen |
Strong USD, Weak EM Trade := Bearish
Fed policy will strengthen the USD TWIB and weaken EM trade. These factors will tend to pull crude oil prices down, in and of themselves (Chart 9). We do not think these factors will dominate the evolution of crude oil prices over the next six months, however.
That said, the current environment forces us to adapt our modelling procedure in order to account for the possible re-emergence of the USD as a key driver of oil prices. Going forward, our regular monthly oil price forecast will be complemented by our U.S. trade weighted dollar forecast.12 We will be rolling out our new oil-price forecasting models next month, when we update our supply-demand balances and price forecasts.
For the immediate future, we continue to believe upside price risk dominates the oil market: The approaching U.S. sanctions against Iran and the all-but-certain collapse of Venezuela's economy could remove as much as 2mm b/d of exports from oil markets by next year, if not sooner. This would constitute an oil-price shock, pushing prices into the right tail of the price distribution, consistent with the modelling we've done for the past several months (Chart 10).
Chart 9
... Adding A Bearish Factor To
The Evolution Of Brent, WTI Prices
| Fullscreen |
Chart 10
Upside Risks
Still Dominate
| Fullscreen |
We reiterate our conclusion from last week, however, that an oil-supply shock, coupled with slower EM trade growth ultimately will produce strong deflationary impulses.
If markets avoid an oil supply shock, and if the Fed maintains its rates-normalization policy while the rest of the world's systemically important central banks remain accommodative, pressure will build on EM trade - and incomes - that reduces commodity demand, in line with lower aggregate demand from the EM economies.
In either event, the Fed's rates-normalization policy most likely will have to turn accommodative to counter this.
Robert P. Ryan, Senior Vice President
Commodity & Energy Strategy
rryan@bcaresearch.com
Hugo Bélanger, Senior Analyst
Commodity & Energy Strategy
HugoB@bcaresearch.com
- 1 Please see our Special Report entitled "Oil Volatility To Stay Higher Longer," published September 17, 2015. It is available at ces.bcaresearch.com.
- 2 We have written at length regarding this possible price evolution. Please see, e.g., BCA's Commodity & Energy Strategy Weekly Reports from August 16 and August 2, 2018, entitled "OPEC 2.0 Sailing Close To The Wind," and "Calm Before The Storm In Oil Markets." Both are available at ces.bcaresearch.com.
- 3 For more details, please see Commodity & Energy Strategy Weekly Report published February 8, 2018, "OPEC 2.0 Vs. The Fed." It is available at ces.bcaresearch.com.
- 4 OPEC 2.0 is the name we coined for the producer coalition lead by the Kingdom of Saudi Arabia (KSA) and Russia.
- 5 In Jackson Hole last week, Fed Chair Jerome Powell gave a strong endorsement of the Fed's rates-normalization. Please see "Fed Chair Powell: further rate hikes best way to protect recovery," published by reuters.com August 24, 2018.
- 6 On a 4Q19 vs 4Q18 basis, we expect global oil supply to increase just over 1mm b/d, and for demand to rise 1.8mm b/d, leaving the market in a physical deficit in 2H18 and 2019. We expect Brent to average $70/bbl in 2H18 and $80/bbl in 2019. Please see our updated balances estimates and price forecasts in "OPEC 2.0 Sailing Close To The Wind," published August 16, 2018, by BCA Research's Commodity & Energy Strategy. It is available at ces.bcaresearch.com.
- 7 Our $80/bbl forecast for Brent crude next year - and the physical deficit we expect - implicitly assumes OPEC 2.0 either wants to keep the market relatively tight, which will force inventories to draw and backwardate the forward curves, or that it is pushing up against the limits of the production it can readily bring to market.
- 8 We most recently discussed this in our Commodity & Energy Strategy Weekly Report published August 23, 2018, "Trade, Dollars, Oil & Metals ... Assessing Downside Risk." It is available at ces.bcaresearch.com.
- 9 Please see Abdih, Yasser, Li Lin, and Anne-Charlotte Paret (2018), "Understanding Euro Area Inflation Dynamics: Why So Low for So Long?" published by the IMF this month.
- 10 Please see BCA Research's Global Fixed Income Strategy Weekly Report, "An R-Star Is Born," dated August 7, 2018, and Foreign Exchange Strategy Weekly Report, "Rhetoric Is Not Always Policy", dated July 27, 2018, available at gfis.bcaresearch.com and fes.bcaresearch.com.
- 11 We have a suite of models we use to forecast the USD TWIB, many of which use proxies for the Fed's Congressionally mandated policy goals - i.e., maximum employment, stable prices and moderate long-term interest rates. We use cointegrating regressions to estimate these policy-driven models. The R2 coefficients of determination for the models are clustered around 0.95. The out-of-sample results are strong; we use a weighted-average of the five forecasts based on root-mean-square errors to come up with our USD TWIB forecast. We presented our policy-variables USD TWIB models in last week's Commodity & Energy Strategy Weekly Report. Please see "Trade, Dollars, Oil & Metals ... Assessing Downside Risk." It is available at ces.bcaresearch.com.
- 12 With the introduction of these financial and macro variables, our oil price forecast will be a weighted average of our core Fundamental model and the new Financial model - i.e. the final forecast will look like [aFundamental+(1-a)Financial]. The weights - a and (1-a) - are time-varying, and will reflect our Bayesian probabilities for the relative importance of each model's contribution to price action every month. These weights are crucial. We allow them to vary in order to capture periods in which our analysis tells us we should expect the USD effect to be muted by idiosyncratic supply, demand or inventory dynamics.
Investment Views and Themes
| UNDERWEIGHT | NEUTRAL | OVERWEIGHT | NEUTRAL |
| AGS & SOFTS | BASE METALS | ENERGY | PRECIOUS METALS |
| THEME #1: Saudi-Russia Production Pact Likely Endures | |||
| Market Will Test Commitment To Pact | |||
| THEME #2: Low-Cost Iron Ore Producers Gain Market Share | |||
| Avoid/Short Outright Length In Iron Ore And Steel | |||
| THEME #3: Favor Relative-Value In Base Metals | |||
| Neutral Overall For Complex | |||
| THEME #4: Balance Of Risks Favors Gold | |||
| Geopolitical And Inflation Risks Outweigh U.S. Rates Normalization | |||
| THEME #5: Tariffs Will Re-Order Ag Trade Flows | |||
| Argentina Will Increase Grain Exports | |||
| THEME #6: Elevated FX Risk | |||
| Commodities Will React To FX Shifts | |||
| Theme #7: Oil Inventories Will Draw | |||
| Elevated Storage Levels Will Fall In 2019 | |||
| Theme #8: Stay With Relative Value Trades In Ags/Softs | |||
| Oversupply Favors Relative-Value Trades | |||
| THEME #9: Global Inflation Will Lift | |||
| Fiscal And Monetary Stimulus Will Lift Inflation | |||
| THEME #10: Strategically Neutral Natgas | |||
| Natural Gas Markets Are Amply Supplied For 2018 | |||
| THEME #11: Renewables Changing Electricity Markets | |||
| Renewables – Mostly Wind And Solar PV – Continue To Transform Markets | |||
Strategic Recommendations
| POSITION | INCEPTION LEVEL | INITIATION DATE | RETURN | STOP | COMMENTS |
| ENERGY | |||||
| LONG S&P GSCI INDEX | 2405.7 | DEC 07/17 | 0.131 | TOTAL RETURNS | |
| LONG FEB/19 $80/BBL BRENT CALLS | $3.39 PREMIUM | MAY 10/18 | -5.3% | -$1.00/BBL | ICE FUTURES EUROPE COMMODITIES |
| SHORT FEB/19 $85/BBL BRENT CALLS | $2.07 PREMIUM | MAY 10/18 | ICE FUTURES EUROPE COMMODITIES | ||
| LONG AUG/19 $75/BBL BRENT CALLS | $5.71 PREMIUM | MAY 10/18 | 16.0% | $1.00/BBL | ICE FUTURES EUROPE COMMODITIES |
| SHORT AUG/19 $80/BBL BRENT CALLS | $3.90 PREMIUM | MAY 10/18 | ICE FUTURES EUROPE COMMODITIES | ||
| PRECIOUS METALS | |||||
| LONG SPOT GOLD | $1230.25/OZ | MAY 04/17 | -1.8% | -10.0% | |
| OTHER | |||||
| LONG 10-YEAR U.S. TIPS | 0.49 BPs | JUL 27/17 | 1.4% | -5.0% | |
NOTE: THE RECOMMENDATIONS ARE INITIATED BASIS THE CLOSING PRICE ON THE THURSDAY WE PUBLISH. THE STOP-LOSSES AND UPSIDE TARGETS ARE BASED ON CLOSING PRICES. THE MARK-TO-MARKET CALCULATIONS ARE BASED ON TUESDAY CLOSES
Tactical Trades
| TRADES | INCEPTION LEVEL | INITIATION DATE | RETURN | STOP | COMMENTS |
| BASE METALS | |||||
| LONG 1Q19 STEEL REBAR FUTURES | 4008 RMB/MT | AUG 09/18 | 8.4% | -10 | SHANGHAI FUTURES EXCHANGE (SHFE) |
| SHORT 1Q19 IRON ORE FUTURES | 509 RMB/MT | DALIAN COMMODITY EXCHANGE (DCE) | |||
NOTE: THE RECOMMENDATIONS ARE INITIATED BASED ON THE CLOSING PRICE ON THE THURSDAY WE PUBLISH. THE STOP-LOSSES AND UPSIDE TARGETS ARE BASED ON CLOSING PRICES. THE MARK-TO-MARKET CALCULATIONS ARE BASED ON TUESDAY CLOSES.
NB: WE WILL TAKE PROFITS ON THE WTI CALL-OPTION SPREADS IF THE NET PREMIUM EXCEEDS $3.00/BBL BASIS THE CLOSE ON ANY DAY THEY ARE OPEN. OTHERWISE, WE WILL ANNOUNCE WHEN WE ARE CLOSING THESE POSITIONS.
Commodity Prices and Plays Reference Table
| LATEST PRICE | 4-WEEK % CHG | 13-WEEK % CHG | 52-WEEK % CHG | |
| COMMODITY INDEXES | ||||
| Continuous Commodity Index | 399.74 | -3.02 | -8.76 | 0.11 |
| GSCI Commodity Index | 463.33 | -1.29 | -2.88 | 22.91 |
| Bloomberg Commodity Index | 83.36 | -2.37 | -7.66 | -0.07 |
| ENERGY | ||||
| CCI Energy Sub-Index | 508 | 0.36 | 1.57 | 22.96 |
| WTI Crude Oil (US$/bbl) | 68.53 | -3.82 | 2.68 | 47.15 |
| Natural Gas (US$/mmbtu) | 2.98 | 8.36 | 5.53 | 1.71 |
| Gasoline (US$/gallon) | 2.1 | -1.62 | 0.89 | 19.94 |
| Heating Oil (US$/gallon) | 2.09 | 2.66 | 1.67 | 38.15 |
| BASE METALS | ||||
| CRB Base Metal Index | 845.55 | -5.26 | -10.81 | -5.73 |
| LMEX Index | 2997.8 | -0.89 | -10.2 | -4.88 |
| Aluminum (US$/mt) | 2087.75 | 1.69 | -7.61 | -0.39 |
| Copper (US$/mt) | 6135 | -1.42 | -10.38 | -7.72 |
| Lead (US$/mt) | 2064.75 | -3.45 | -15.21 | -10.24 |
| Nickel (US$/mt) | 13591 | -1.27 | -8.44 | 18.95 |
| Tin (US$/mt) | 19100 | -5.21 | -6.78 | -6.62 |
| Zinc (US$/mt) | 2544 | -2.8 | -17.65 | -16.73 |
| PRECIOUS METALS | ||||
| CCI Precious Metal Sub-Index | 701.35 | -3.34 | -9.48 | -14.24 |
| Gold (US$/oz) | 1212.25 | -0.94 | -6.43 | -5.68 |
| Silver (US$/oz) | 14.88 | -4.12 | -9.38 | -14.38 |
| Platinum (US$/oz ) | 805 | -2.54 | -10.95 | -17.44 |
| Palladium (US$/oz ) | 953 | 2.69 | -2.95 | 2.47 |
| SOFT COMMODITIES | ||||
| CCI Grains & Oilseed Sub-Index | 285.37 | -6.88 | -13.16 | 3.6 |
| CCI Livestock & Meats Sub-Index | 298.63 | 3.11 | -8.99 | -3.22 |
| GSCI Agricultural Index | 279.9 | -4.5 | -11.08 | 1.07 |
| COMMODITY PLAYS | ||||
| Global Mining Stock Index | 1131.34 | -6.77 | -9.69 | -6.26 |
| Global Non-Gold Mining Stock Index | 1276.66 | -6.01 | -9.56 | 1.86 |
| Global Gold Mining Stock Index | 761.53 | -11.54 | -15.76 | -24.99 |
| Global Energy Index | 1933.17 | -2.15 | 1.85 | 17.81 |
| Global Basic Materials Index | 1436.95 | -2.94 | -3.21 | 2.39 |
| Global Coal Index | 2556.48 | 0.07 | 1.61 | 7.29 |
| Global Water Index | 4026.33 | -1.76 | -2.56 | -11.7 |
| Global Alternate Sources Index | 76.34 | -1.86 | -13.24 | -11.5 |
| C$/US$ | 0.77 | 0.81 | 0.67 | -3.27 |
| A$/US$ | 0.73 | -0.92 | -2.23 | -7.85 |
| NOK/EUR | 0.1 | -1.81 | -1.65 | -4.54 |
| ZAR$/US$ | 0.07 | -7.53 | -10.78 | -8.22 |
| Fullscreen |
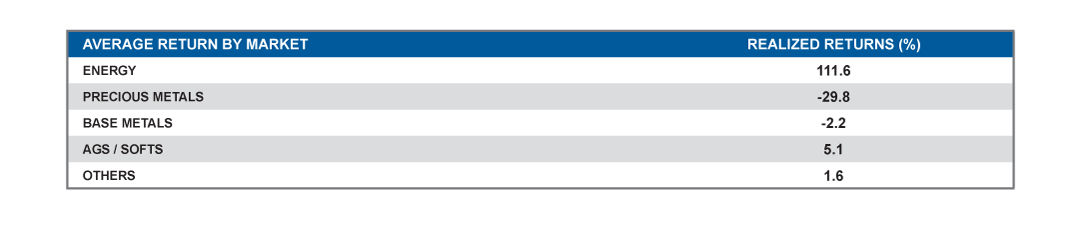
Trades Closed in 2018
| POSITION | INCEPTION LEVEL | INITIATION DATE | CLOSING DATE | REALIZED P&L (%) | TYPE OF TRADE |
| LONG MAY/18 $55/BBL BRENT CALLS / SHORT MAY/18 $60/BBL BRENT CALLS | 2.28 | SEP 21/17 | JAN 11/18 | 110.1 | STRATEGIC |
| LONG JUL/18 $55/BBL WTI CALLS / SHORT JUL/18 $60/BBL WTI CALLS | 1.62 | OCT 19/17 | JAN 11/18 | 129.0 | STRATEGIC |
| LONG JUL/18 $55/BBL WTI CALLS / SHORT JUL/18 $60/BBL WTI CALLS | 2.31 | SEP 21/17 | JAN 18/18 | 64.9 | STRATEGIC |
| LONG JUL/18 $55/BBL WTI CALLS / SHORT JUL/18 $60/BBL WTI CALLS | 1.73 | OCT 19/17 | JAN 18/18 | 85.0 | STRATEGIC |
| LONG 4Q19 $55/BBL BRENT PUTS / SHORT 4Q19 $50/BBL BRENT PUTS | 1.35 | JAN 18/18 | FEB 22/18 | 20.7 | STRATEGIC |
| LONG MAR/18 STEEL REBAR FUTURES | 3963 | JAN 11/18 | MAR 15/18 | 0.5 | TACTICAL |
| LONG JUL/18 WTI / SHORT DEC/18 WTI | 1.35 | NOV 2/17 | MAR 22/18 | 83.7 | STRATEGIC |
| LONG DEC/18 $50/BBL BRENT PUTS / SHORT DEC/18 $45/BBL BRENT PUTS | 0.42 | MAR 22/18 | APR 12/18 | -35.7 | STRATEGIC |
| LONG CORN / SHORT WHEAT | 0.79 | OCT 05/17 | JUN 12/18 | -13.1 | STRATEGIC |
| LONG DEC/18 $65/BBL BRENT CALLS / SHORT DEC/18 $70/BBL BRENT CALLS | 1.94 | FEB 22/18 | JUL 19/18 | 79.9 | STRATEGIC |
| LONG SPOT SILVER | 17.20 | APR 19/18 | JUL 26/18 | -10 | TACTICAL |
| LONG DEC/18 $3.00/LB COPPER CALLS / SHORT DEC/18 $3.20/LB COPPER CALLS | 2.95 | JUL 12/18 | AUG 10/18 | -10.2 | TACTICAL |
| AVERAGE RETURN | 42.1 |