- Three macro "policy puts" are in jeopardy of disappearing or, at the very least, being repriced.
- Fed Put: Rising inflation has made the Fed more reluctant to back off from rate hikes at the first hint of slower growth or falling asset prices.
- China Put: Worries about high debt levels, overcapacity, and pollution all mean that the bar for fresh Chinese stimulus is higher than in the past.
- Draghi Put: Bailing out Italy was a no-brainer in 2012 when the country was the victim of contagion from the Greek crisis. But now that Italy is the source of the disease, the rationale for intervention has weakened.
- These factors, along with additional risks such as mounting protectionism, warrant a more cautious 12-month stance towards global equities and other risk assets. The fact that valuations are stretched across most asset classes only adds to our concern.
- A neutral stance does not imply that we expect markets to move sideways. On the contrary, volatility is likely to increase over the balance of the year, with the next big move for global equities probably being to the downside.
Buckle Up
One of BCA's key ongoing themes is that policy and markets are on a collision course. We are starting to see this impending crash play out across the world.
Higher Inflation Is Tying The Fed's Hands
A slowdown in global growth caused the Fed to abort its tightening plans for 12 months starting in December 2015. Global growth is faltering again, but this time around the Fed is less eager to hit the pause button. In contrast to 2015, the U.S. economy has run out of spare capacity. The unemployment rate fell to a 48-year low of 3.75% in May. For the first time in the history of the Bureau of Labor Statistics' Job Openings and Labor Turnover Survey (JOLTS), there are more job vacancies than unemployed workers (Chart 1).
Average hourly earnings surprised on the upside in May, while the Employment Cost Index for private-sector workers - the cleanest and most reliable measure of U.S. wage growth - rose at a robust 4% annualized pace in the first quarter. Labor market surveys, which generally lead wage growth by three-to-six months, are pointing to a further acceleration in wages (Chart 2).
Chart 1
There Are Now More
Vacancies Than Jobseekers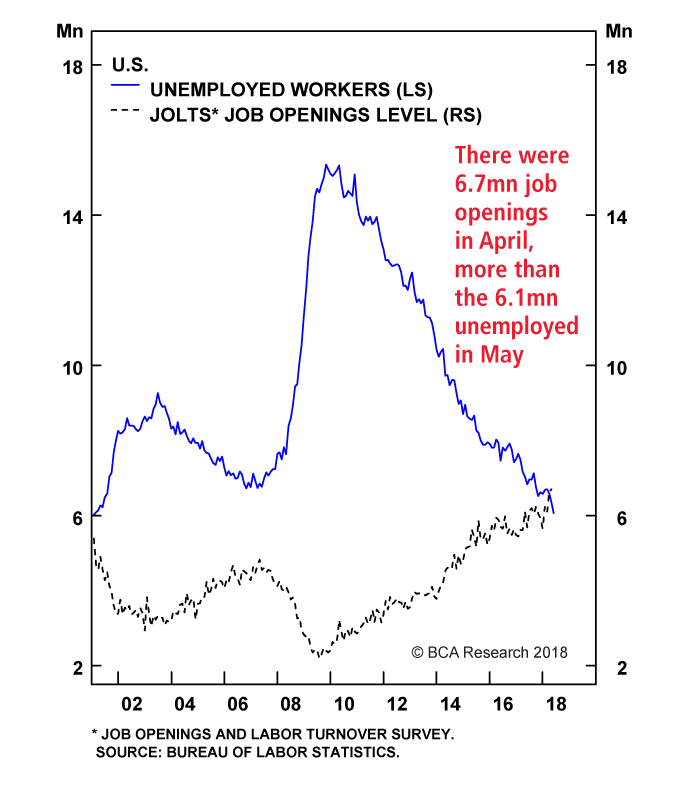
 Fullscreen Fullscreen |  Interactive Chart Interactive Chart |
Chart 2
U.S. Wage Growth Is Set To Accelerate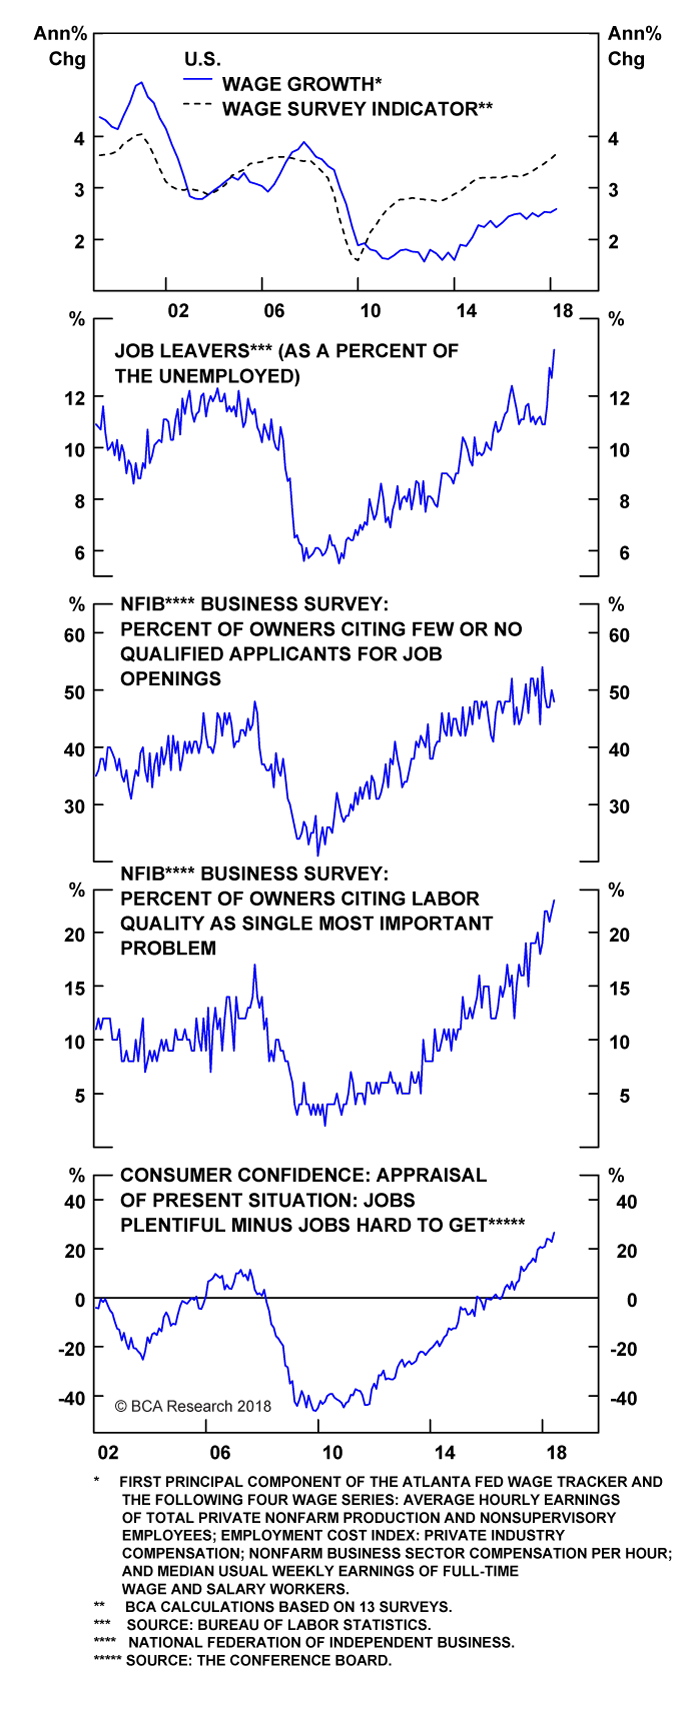
 Fullscreen Fullscreen |  Interactive Chart Interactive Chart |
The Dollar Rally Can Keep Going
Rising wages will put more income into workers' pockets, who will then spend it. Stronger demand can be partly satisfied by imports, but it will take a change in relative prices for that to happen. U.S. imports account for only 16% of GDP. Unless the prices of foreign-made goods decline in relation to the prices of domestically-produced goods, the bulk of any additional household income will be spent on goods produced in the U.S. This means that the dollar needs to strengthen.
The Fed's broad trade-weighted dollar index is up 8% since the start of February. While we are not as bullish on the dollar as we were a few months ago, we still believe that the path of least resistance for the greenback is up. Our long DXY trade recommendation has gained 12.1% inclusive of carry since we initiated it. We are raising the target price from 96 to 98.
A stronger dollar can help deflect some additional spending towards imports, but this won't be enough to fully cool the economy. Services, which generally cannot be imported, account for nearly two-thirds of GDP. Since it takes time to shift resources from goods-producing sectors to service sectors, any rising aggregate demand will boost service prices. Outside of housing, service-sector inflation is already running at 2.4%, a number that is likely to rise further over the coming year (Chart 3). This will keep the Fed on edge.
Hard Times For Emerging Markets
The combination of rising U.S. rates and a stronger dollar is bad news for emerging markets. Eighty percent of EM foreign-currency debt is denominated in dollars. Outside of China, EM dollar debt is now back to late-1990s levels both as a share of GDP and exports (Chart 4).
Chart 3
Faster Wage Growth Will Push
Up Service Inflation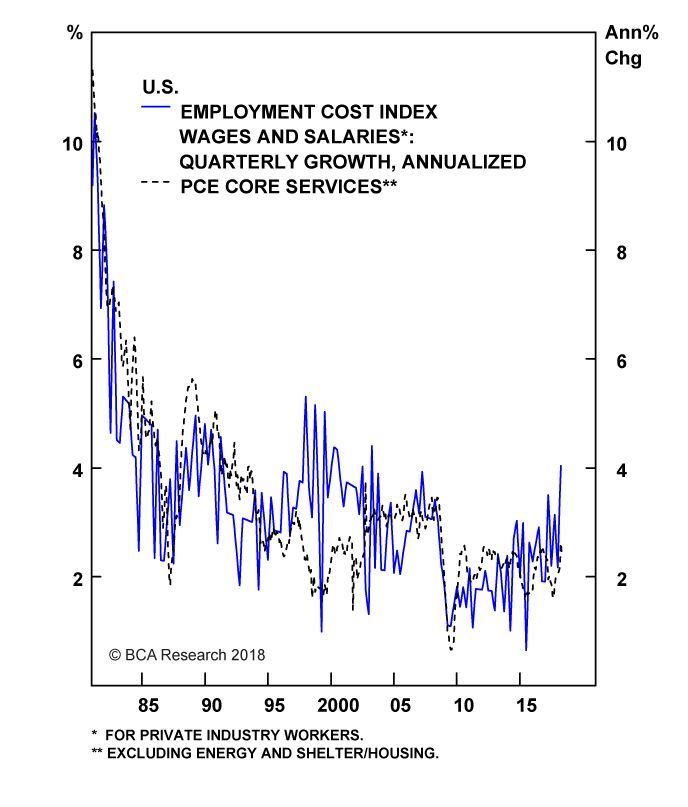
 Fullscreen Fullscreen |  Interactive Chart Interactive Chart |
Chart 4
EM Dollar Debt Back To Late-1990s Levels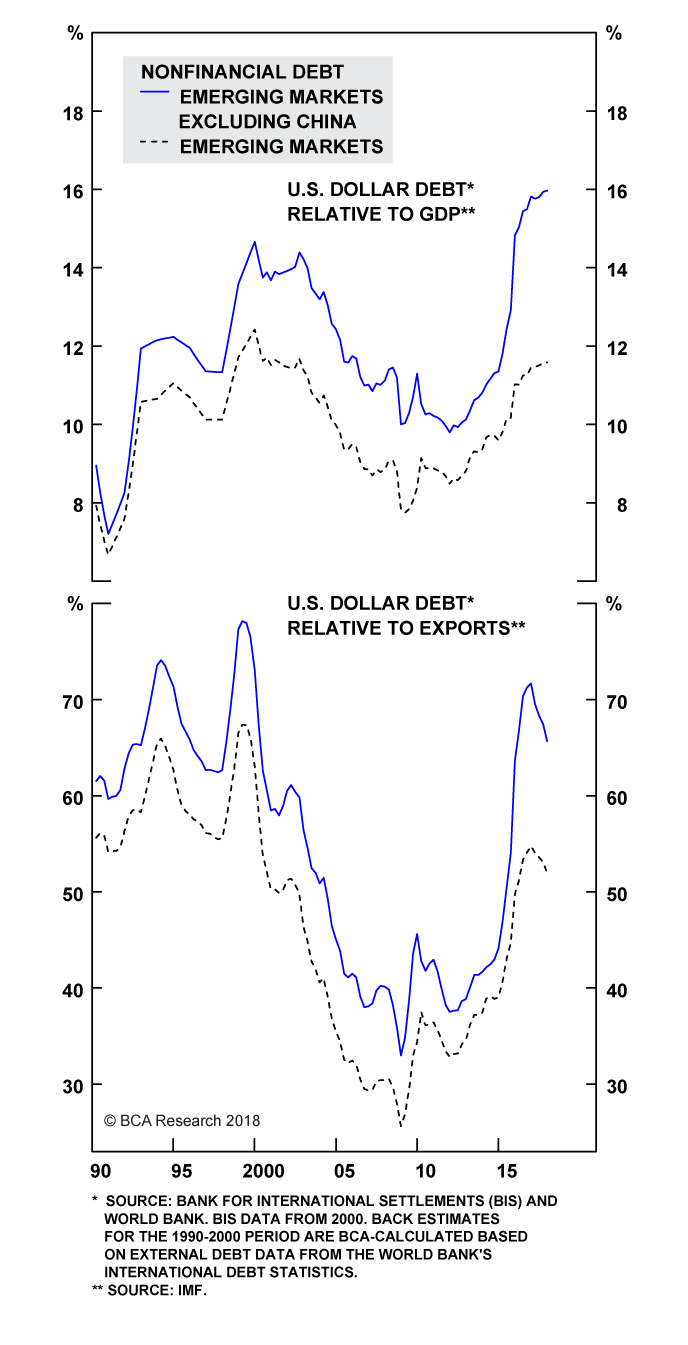
 Fullscreen Fullscreen |  Interactive Chart Interactive Chart |
The wave of EM local-currency debt issued in recent years only complicates matters. If EM central banks raise rates to defend their currencies, this could imperil economic growth and make it difficult for local-currency borrowers to pay back their loans.
Rather than hiking rates, some EM central banks may simply choose to inflate away debt. Consider the case of Brazil. Ninety percent of Brazilian sovereign debt is denominated in reais. The Brazilian government won't default on its debt per se. However, if push comes to shove, Brazil's central bank can always step in to buy government bonds, effectively monetizing the fiscal deficit.
The specter of trade wars only adds to the risks facing emerging markets. A larger U.S. budget deficit will drain national savings, leading to a bigger trade deficit. Rather than blaming his own macroeconomic policies, President Trump will blame America's trading partners. Global trade has already been flatlining for over a decade (Chart 5). Trump's trade agenda will further undermine the global trading system. Emerging markets will bear the brunt of that development.
Chart 5
Global Trade Has Crested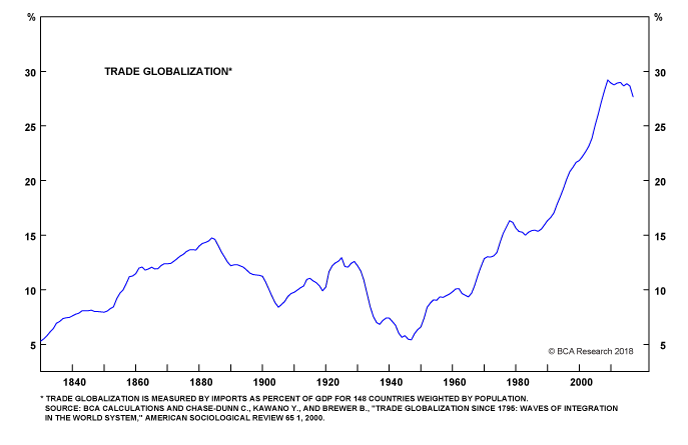
 Fullscreen Fullscreen |  Interactive Chart Interactive Chart |
Chinese Stimulus To The Rescue?
When emerging markets last succumbed to pressure in 2015, China saved the day by stepping in with massive new stimulus. Fiscal spending and credit growth accelerated to over 15% year-over-year. The government's actions boosted demand for all sorts of industrial commodities.
Today, Chinese growth is slowing again. May data on industrial production, retail sales, and fixed asset investment all disappointed. Property prices in tier 1 cities are down year-over-year. Our leading indicator for the Li Keqiang index, a widely followed measure of economic activity, is in a clear downtrend (Chart 6).
So far, the policy response has been fairly muted. Reserve requirements have been cut and some administrative controls loosened, but the combined credit and fiscal impulse has plunged (Chart 7). Onshore and offshore corporate bond yields have increased to multi-year highs. Bank lending rates are rising, while loan approvals are dropping (Chart 8).
Chart 6
Chinese Growth Is Slowing Anew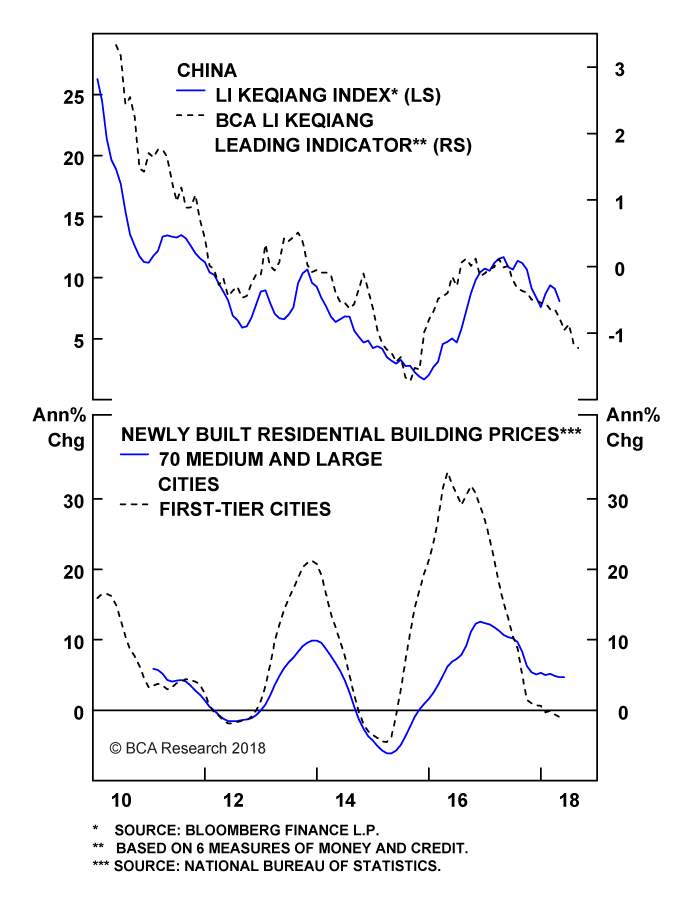
 Fullscreen Fullscreen |  Interactive Chart Interactive Chart |
Chart 7
China: Policy Response To Slowdown
Has Been Muted So Far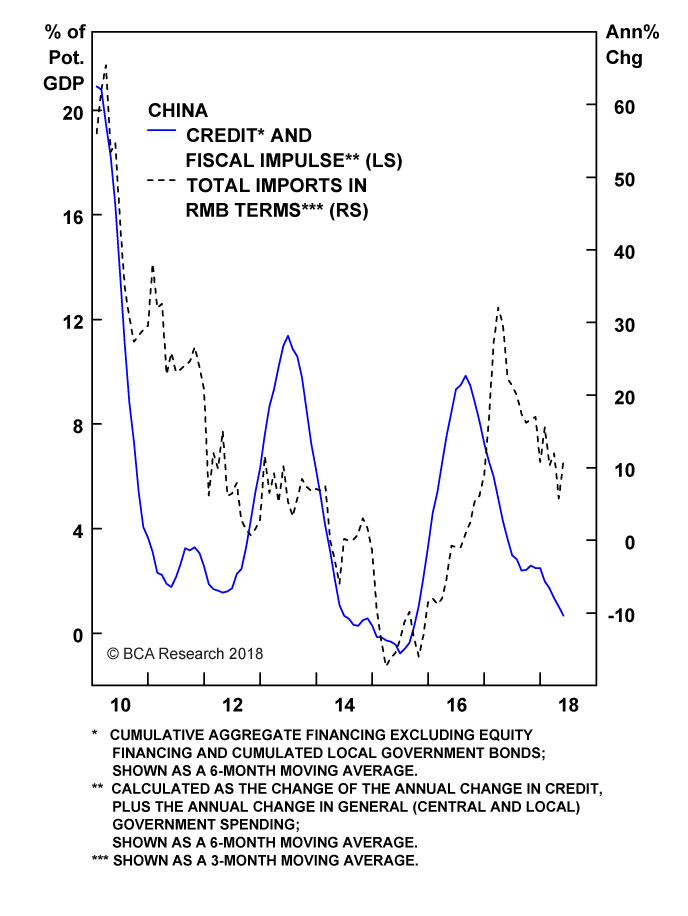
 Fullscreen Fullscreen |  Interactive Chart Interactive Chart |
Chart 8
China: Credit Tightening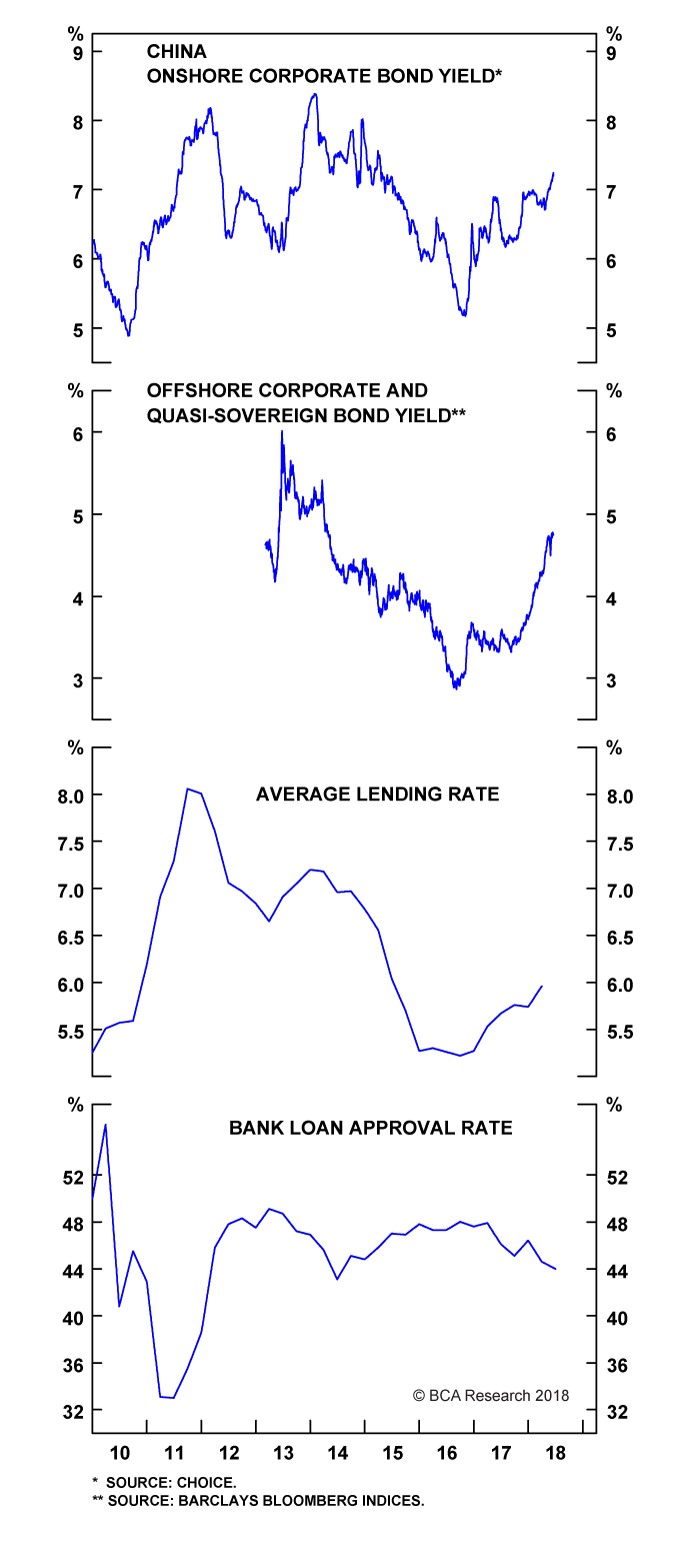
 Fullscreen Fullscreen |  Interactive Chart Interactive Chart |
We have no doubt that China will stimulate again if the economy appears to be heading for a deep slowdown. However, the bar for a fresh round of stimulus is higher today than it was in the past. Elevated debt levels, excess capacity in some parts of the industrial sector, and worries about pollution all limit the extent to which the authorities can respond with the usual barrage of infrastructure spending and increased bank lending. The economy needs to feel more pain before policymakers come to its aid.
Draghi's Dilemma
The Italian economy was showing signs of weakness even before bond yields exploded higher. Domestic demand slowed to a mere 0.3% qoq in Q1. The PMIs, consumer confidence, and the Bank of Italy's Ita-Coin cyclical indicator all decelerated (Chart 9).
Italy would benefit from a more competitive cost structure, but the political will to undertake the sort of reforms Germany implemented in the late 1990s, and that Spain implemented after the Great Recession, has been sorely lacking (Chart 10). Unwilling to take tough actions to improve competitiveness, the Five Star-Lega coalition government has proposed loosening fiscal policy to support demand.
Chart 9
Italy's Economy Is Weakening... Again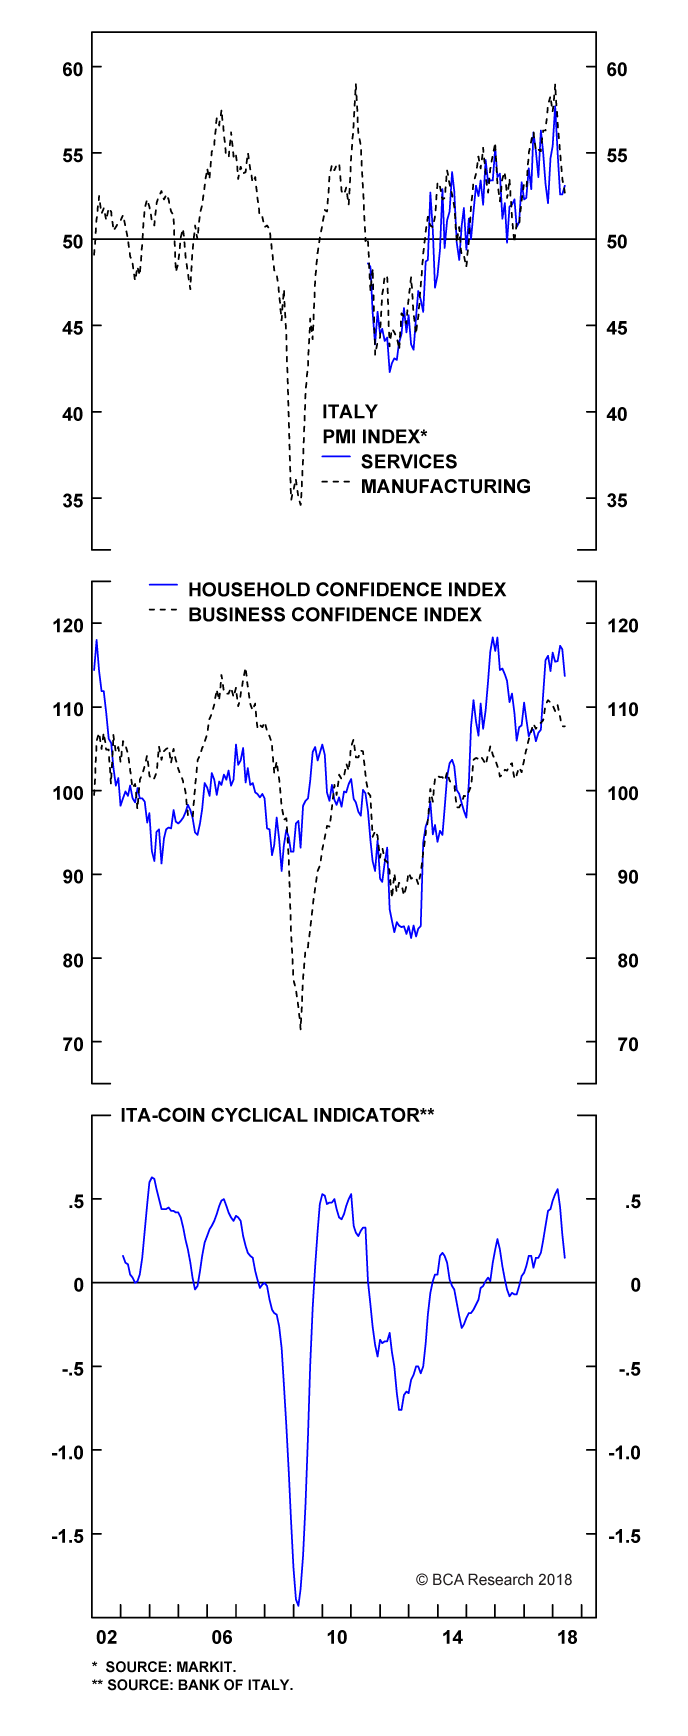
 Fullscreen Fullscreen |  Interactive Chart Interactive Chart |
Chart 10
Italy: More Work Needs To Be Done On
The Labor Competitiveness Front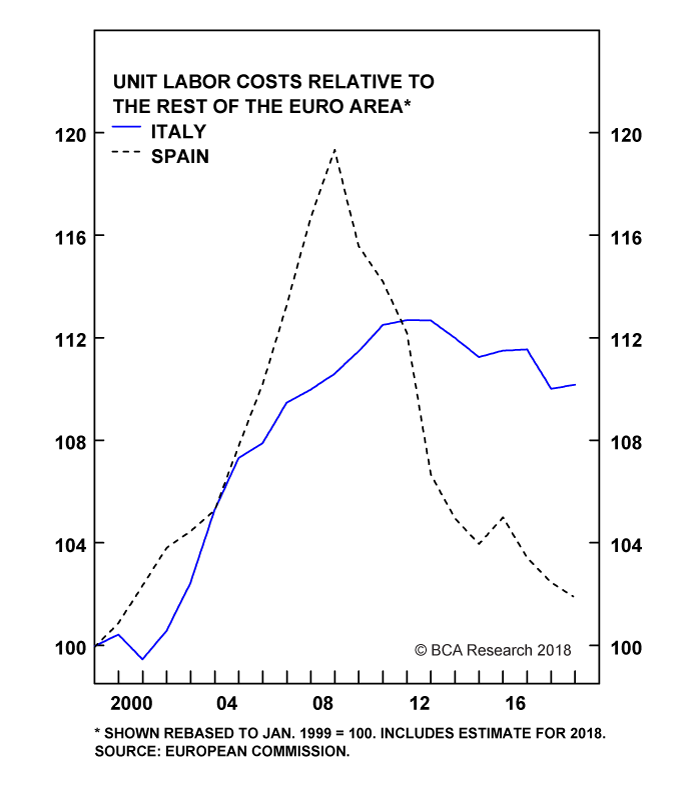
 Fullscreen Fullscreen |  Interactive Chart Interactive Chart |
Italy's shift towards populism is arriving at the same time that the ECB is looking to wind down its asset purchase program. This means that a key buyer of Italian debt is stepping back just when it may be needed the most.
Getting the ECB to bail out Italy will not be as straightforward this time around. Recall that Mario Draghi and Jean-Claude Trichet penned a letter to the Italian government in 2011 outlining a series of reforms they wanted to see enacted as a condition of ongoing ECB support. The contents of the letter were so explosive that they precipitated the resignation of then-PM Silvio Berlusconi when they were leaked to the public. One of the reforms that Mario Draghi demanded - and the subsequent government led by Mario Monti ultimately undertook - was the extension of the retirement age. Italy's current government has explicitly promised to reverse that decision much to the consternation of the ECB and the European Commission.
It was one thing for Mario Draghi to promise to do "whatever it takes" to protect Italy when the country was the victim of contagion from the Greek crisis. But now that Italy is the source of the disease, the rationale for intervention has weakened.
Investment Conclusions
The outlook for global risk assets is likely to be more challenging over the coming months. With that in mind, we are downgrading our 12-month recommendation on global equities and credit from overweight to neutral.
A neutral stance does not imply that we expect markets to move sideways. On the contrary, volatility is likely to increase again over the balance of the year, with the next big move for global equities probably being to the downside.
Although Treasurys could rally in the near term, higher U.S. inflation will push bond yields up over a 12-month horizon. Given that yields are positively correlated across international bond markets, rising U.S. yields will put upward pressure on yields in the rest of the world. As such, we recommend shifting equity allocations towards cash rather than long-duration bonds. We would also reduce credit exposure. Within the commodity complex, the backdrop for crude remains more favorable than for economically-sensitive metals.
Investors should underweight EM equities, credit, and currencies relative to their developed market peers. The Fed needs to tighten U.S. financial conditions to prevent the economy from overheating. Chart 11 shows that EM equities almost always fall when that is happening.
Chart 11
Tighter U.S. Financial Conditions Do Not Bode Well For EM Stocks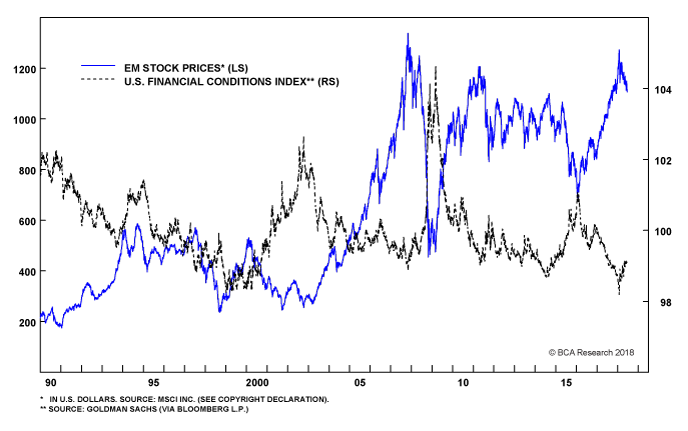
 Fullscreen Fullscreen |  Interactive Chart Interactive Chart |
A stronger dollar will hurt the profits of U.S. multinationals. That said, the sector composition of the U.S. stock market is a bit more defensive than it is elsewhere. On balance, we no longer have a strong view that euro area and Japanese equities will outperform the U.S. in local-currency terms, and hence we are closing our trade recommendation to this effect for a loss of 5.4%.
If macro developments evolve as we expect, we will shift to an outright bearish stance on risk assets later this year or in early 2019 in anticipation of a global recession in 2020. That said, we would consider moving our 12-month recommendation temporarily back to overweight if global equities were to sell off by more than 15% over the next few months or the policy environment becomes markedly more market friendly. But at current prices, the risk-reward trade-off no longer justifies a high degree of bullishness.
Peter Berezin, Chief Global Strategist
Global Investment Strategy
peterb@bcaresearch.com
Strategy & Market Trends
| EQUITY PRICES / WORLD BENCHMARKS** | BOND YIELDS | SHORT RATES | CURRENCY VS. US$ | |
| U.S. | UP | UP | UP | |
| CANADA | FLAT | up | UP | FLAT |
| JAPAN | UP | FLAT | FLAT | FLAT |
| AUSTRALIA | FLAT | up | UP | DOWN |
| U.K. | FLAT | up | UP | FLAT |
| EURO AREA | UP | UP | FLAT | DOWN |
| EMERGING ASIA | DOWN | FLAT | FLAT | DOWN |
| LATIN AMERICA | DOWN | FLAT | FLAT | DOWN |
* EXPECTATIONS FOR THE COMING 12 MONTHS.
**DM EQUITY PRICES RELATIVE TO WORLD BENCHMARK EXPRESSED IN LOCAL CURRENCIES. EM EQUITY PRICES RELATIVE TO WORLD BENCHMARK EXPRESSED IN USD.
NOTE: ITALICIZED AND BOLDED TEXT INDICATES A CHANGE IN THE VIEW.
Tactical Trades
| TRADE | INCEPTION LEVEL | INITIATION DATE | RETURN-TO- DATE | STOP | COMMENTS |
| SHORT AUSTRALIAN DOLLAR / LONG JAPANESE YEN | 87.958 | Feb 01/18 | 7.1% | -5.0% | |
| LONG SWEDISH KRONA/ SHORT SWISS FRANC | 0.1156 | Jul 20/17 | -3.2% | 0.108 |
NOTE: STOPS ARE BASED ON DAILY CLOSING LEVELS. PLEASE NOTE THAT ALL CURRENT TRADE CALCULATIONS INCLUDE COST OF CARRY.
Strategic Recommendations
| POSITION | INCEPTION LEVEL | INITIATION DATE | RETURN-TO- DATE | CHANGE FROM PREVIOUS WEEK | COMMENTS |
| Equity Recommendations | |||||
| LONG MSCI ALL-COUNTRY WORLD VALUE INDEX / SHORT MSCI ALL-COUNTRY WORLD GROWTH INDEX | 100 | Mar 29/2018 | -4.7% | -0.6% | |
| LONG CHINA H-SHARE INDEX / SHORT EM EQUITIES1 | 100 | Feb 23/2017 | -3.3% | -0.2% | |
| SHORT U.S. / LONG EUROPE AND JAPAN EQUITIES2 | 100 | Feb 23/2017 | -5.4% | -1.6% | CLOSE POSITION |
| Fixed Income Recommendations | |||||
| LONG U.S. 30-YEAR GOVERNMENT BOND / SHORT GERMAN 30-YEAR GOVERNMENT BOND (UNHEDGED) | 100 | Mar 01/2018 | 5.1% | -0.2% | |
| LONG 30-YEAR TIPS BREAKEVEN (LONG U.S. 30-YEAR TIPS / SHORT U.S. 30-YEAR TREASURY)3 | 100 | Mar 01/2018 | 1.0% | 0.3% | |
| SHORT JAPAN 20-YEAR / LONG JAPAN 5-YEAR GOVERNMENT BOND | 100 | Aug 24/2017 | -1.3% | -0.3% | |
| LONG JAPANESE 10-YEAR CPI SWAP | 22 BPS | Mar 31/2016 | 33 BPS | 0.0 BPS | |
| LONG GERMAN 10-YEAR CPI SWAP | 151 BPS | Feb 27/2015 | 43 BPS | -0.5 BPS | |
| CURRENCY RECOMMENDATIONS | |||||
| SHORT EURO / LONG BRITISH POUND | 0.9033 | Aug 03/2017 | 3.2% | -0.7% | |
| SHORT EURO / LONG RUSSIAN RUBLE | 68.65 | Jul 06/2017 | -0.1% | -1.7% | |
| SHORT EURO / LONG CANADIAN DOLLAR | 1.5132 | May 18/2017 | 0.0% | -1.3% | |
| LONG U.S. DOLLAR (DXY INDEX)4 | 86.915 | Oct 31/2014 | 9.4% | 0.4% | TARGET PRICE IS 98 |
1 CURRENCY UNHEDGED; THE CORRESPONDING ETFS FOR THIS TRADE ARE THE HANG SENG INVESTMENT INDEX FUNDS SERIES: H-SHARE INDEX ETF (2828 HK), AND THE ISHARES MSCI EMERGING MARKETS ETF (EEM US). THE HANG SENG CHINA ENTERPRISE INDEX COMPRISES OF CHINA H-SHARES (CHINESE STOCKS AVAILABLE TO INTERNATIONAL INVESTORS) CURRENTLY TRADING ON THE HONG KONG STOCK EXCHANGE.
2 EQUALLY-WEIGHTED BASKET. HEDGE CURRENCY EXPOSURE
3 TO TRACK THE PERFORMANCE OF THIS RECOMMENDATION, WE USE THE FOLLOWING SERIES: BLOOMBERG BARCLAYS 30-YEAR TIPS ON-THE-RUN INDEX, AND BLOOMBERG BARCLAYS 30-YEAR TREASURY NOMINAL COMPARATOR INDEX.
4 PERFORMANCE EXCLUDES A CUMULATIVE CARRY OF 2.7%.
NOTE: RETURNS RELATIVE TO BENCHMARK. MSCI WORLD FOR EQUITY RECOMMENDATIONS UNLESS OTHERWISE SPECIFIED. CUSTOM BENCHMARK FOR FIXED-INCOME RECOMMENDATIONS BASED ON GDP-WEIGHTED G10 GOVERNMENT BOND PERFORMANCE.
Closed Trades
| POSITION | INCEPTION LEVEL | INITIATION DATE | CLOSING DATE | REALIZED P&L | TYPE OF TRADE |
| SHORT GOLD | 1225 | DEC 10/14 | JAN 23/15 | -5.0% | TACTICAL |
| LONG S&P 500 / SHORT WTI | 100 | OCT 2013 | FEB 6/15 | 126.5% | STRATEGIC |
| LONG GERMAN 10-YEAR BUNDS / SHORT JAPANESE 10-YEAR JGBS | 100 | JUL 2013 | FEB 27/15 | 13.5% | STRATEGIC |
| LONG GREEK STOCKS | 716.38 | JAN 30/15 | MAR 9/15 | 15.0% | TACTICAL |
| LONG GOLD | 1235 | FEB 6/15 | MAR 9/15 | -5.0% | TACTICAL |
| LONG U.S. DOLLAR / SHORT JAPANESE YEN | 111.94 | OCT 31/14 | APR 10/15 | 7.5% | TACTICAL |
| LONG INDIAN STOCKS / SHORT INDONESIAN STOCKS | 5.29 | OCT 24/14 | APR 24/15 | -5.0% | TACTICAL |
| UNDERWEIGHT COMMODITY-MARKET EQUITIES | 100 | NOV 22/13 | MAY 8/15 | 19.2% | STRATEGIC |
| LONG CRB METALS INDEX / SHORT WTI CRUDE OIL | 100 | MAY 08/15 | JUN 05/15 | -5.0% | TACTICAL |
| LONG S&P DIVIDEND ARISTOCRATS / SHORT NASDAQ | 0.3370 | OCT 24/14 | JUN 05/15 | -5.0% | TACTICAL |
| LONG GLOBAL CYCLICALS / SHORT GLOBAL DEFENSIVES | 100 | MAY 01/15 | JUL 3/15 | -5.0% | TACTICAL |
| LONG CHINA H-SHARE INDEX | 11922.56 | MAY 23/14 | JUL 3/15 | 50.0% | TACTICAL |
| SHORT CHINA A- SHARE INDEX / LONG CHINA H-SHARE INDEX | 100 | JUN 06/15 | JUL 3/15 | 26.4% | STRATEGIC |
| LONG ITALIAN 10-YEAR GOV’T BONDS | 5.878% | AUG 10/12 | JUL 17/15 | 30.5% | STRATEGIC |
| LONG EURO AREA BANK STOCKS | 50.12 | JAN 16/15 | SEP 24/15 | 5.9% | TACTICAL |
| LONG 30-YEAR U.S. TREASURYS / SHORT S&P 500 | 100 | JUN 12/15 | OCT 02/15 | 17.9% | TACTICAL |
| LONG 12-MONTH NDF USD/CNY | 6.4025 | MAR 06/15 | OCT 02/15 | 2.5% | TACTICAL |
| LONG 2.1 UNIT OF U.S. BARCLAYS HIGH YIELD CORPORATE BOND INDEX / SHORT ONE UNIT OF S&P 500 | 100 | OCT 22/15 | NOV 26/15 | -5.0% | TACTICAL |
| SHORT NASDAQ 100 MAR 2016 FUTURES | 4,692.50 | NOV 06/15 | JAN 20/16 | 16.2% | TACTICAL |
| LONG CHINESE A-SHARES AND H-SHARES | 100 | JUL 01/15 | MAY 19/16 | -27.0% | STRATEGIC |
| SHORT EURO / LONG JAPANESE YEN | 139.15 | JUN 01/15 | JUN 16/16 | 19.4% | STRATEGIC |
| SHORT EUROPEAN EQUITIES (U.S. DOLLAR TERMS) | 100 | JUN 09/16 | JUN 24/16 | 8.2% | TACTICAL |
| LONG U.S. 30-YEAR / SHORT U.S. 10-YEAR GOV’T BONDS | 96 BPS | FEB 07/14 | JUL 08/16 | 22.5% | STRATEGIC |
| SHORT BRITISH POUND / LONG SWEDISH KRONA | 13.16 | NOV 12/15 | AUG 11/16 | 19.1% | TACTICAL |
| LONG 10-YEAR U.S. TREASURYS / SHORT 10-YEAR GERMAN BUNDS | 100 | AUG 15/14 | OCT 27/16 | 18.5% | TACTICAL |
| LONG SPANISH 10-YEAR GOV’T BONDS / SHORT ITALIAN 10-YEAR GOV’T BONDS | 16 BPS | OCT 15/15 | DEC 8/16 | 6.2% | TACTICAL |
| LONG CHINESE BANK EQUITIES | 100 | MAY 19/16 | JAN 19/17 | 32.3% | STRATEGIC |
| SHORT U.S. DOLLAR / LONG RUSSIAN RUBLE | 64.59 | NOV 19/15 | JAN 19/17 | 20.1% | STRATEGIC |
| SHORT NASDAQ 100 MAR 2017 FUTURES | 4820.50 | AUG 23/16 | FEB 23/17 | -10.0% | TACTICAL |
| SHORT U.S. / LONG BASKET OF EURO AREA, JAPANESE, AND CHINESE EQUITIES*** | 100 | FEB 6/15 | FEB 23/17 | -10.0% | STRATEGIC |
| SHORT S&P 500 | 2389.52 | MAY 4/17 | JUN 15/17 | -2.0% | TACTICAL |
| SHORT EURO / LONG U.S. DOLLAR | 1.1205 | MAY 25/17 | JUN 29/17 | -1.6% | TACTICAL |
| SHORT JAPANESE, GERMAN AND SWISS 10-YEAR GOV’T BONDS | 100 | JUL 5/16 | JUN 29/17 | 5.3% | STRATEGIC |
| SHORT FED FUNDS JAN 2018 FUTURES | 98.79 | APR 20/17 | JUL 6/17 | 11 BPS | TACTICAL |
| OVERWEIGHT AUSTRALIA (ADD CURRENCY HEDGE)**** | 100 | JAN 23/09 | JUL 20/17 | 59.5% | STRATEGIC |
| OVERWEIGHT NEW ZEALAND (ADD CURRENCY HEDGE)**** | 100 | JAN 23/09 | JUL 20/17 | 74.2% | STRATEGIC |
| LONG BRITISH POUND / SHORT JAPANESE YEN | 132.01 | AUG 11/16 | AUG 3/17 | 9.9% | TACTICAL |
| SHORT FED FUNDS JUN 2018 FUTURES | 98.55 | JUL 6/17 | SEP 7/17 | -18 bps | TACTICAL |
| LONG BRENT OIL DEC 2017 FUTURES | 49.33 | MAY 4/17 | SEP 21/17 | 13.8% | TACTICAL |
| SHORT S&P 500 | 2585.64 | Nov 16/17 | Nov 30/17 | -2.0% | TACTICAL |
| LONG 2-YEAR USD/ SAUDI RIYAL FORWARD CONTRACT | 3.89 | Dec 10/15 | Jan 11/18 | -2.9% | STRATEGIC |
| LONG GLOBAL INDUSTRIAL STOCKS / SHORT GLOBAL UTILITIES | 100 | SEP 29/17 | Feb 1/18 | 12% | TACTICAL |
| LONG AUSTRALIAN DOLLAR / SHORT NEW ZEALAND DOLLAR | 1.0815 | Apr 25/14 | Feb 1/18 | -1.8% | STRATEGIC |
| SHORT ONE UNIT OF EUR/USD & LONG 1.5 UNITS OF 30-YEAR U.S. TREASURYS VERSUS 30-YEAR GERMAN BUNDS | 100 | JAN 25/2018 | Feb 6/18 | -2.5% | TACTICAL |
| SHORT FED FUNDS DEC 2018 FUTURES | 98.6500 | Sep 7/2017 | Feb 6/18 | 70 BPS | TACTICAL |
| LONG S&P 500 / SHORT U.S. BARCLAYS HIGH YIELD CORPORATE BOND INDEX | 100 | Jan 11/2018 | Feb 15/18 | -5.0% | TACTICAL |
| SHORT U.S. 30-YEAR GOVERNMENT BOND | 100 | Jun 29/2017 | Mar 1/2018 | 3.8% | STRATEGIC |
| LONG EUROPE AND JAPAN / SHORT U.S. EQUITIES | 100 | Feb 23/2017 | Jun 19/2018 | -5.4% | STRATEGIC |
| AVERAGE RETURN | - | - | - | 12.3% | - |
| CUMULATIVE RETURN | - | - | - | 555.5% | - |
 You are reading a complimentary report. To find out more about our services,


