Highlights
- A flurry of policy announcements over the past month has given investors the impression that Beijing has turned the policy dial in the direction of supporting growth.
- We agree that China is easing at the margin, but several observations suggest that the stimulus proposed so far falls short of a "big bang" response that would reverse both the looming export shock as well as the underlying slowdown in China's old economy.
- Investors should remain neutrally positioned towards Chinese stocks within a global equity portfolio, and should favor low-beta sectors within the Chinese investable universe.
Feature
There have been several policy-related announcements over the past month in China. This has led many market participants to question whether China is in the process of entering full-blown stimulus mode, and if we are on the cusp of another upswing in Chinese economic activity.
Our answer to both questions is, for now, no. China appears to merely be easing off the brake, rather than pressing hard on the accelerator. Given that export growth will certainly slow to some degree due to the imposition of import tariffs, and that an industrial sector slowdown was already underway in China prior to President Trump's protectionist actions, it is far from clear that any stimulus will be a net positive for the country's "old economy".
In other words, stimulus may counteract an upcoming export shock, but we would need to see more evidence before concluding that it will lead to a renewed cyclical uptrend in China's economy.
A Flurry Of Policy Announcements...
Several policy actions, announcements, and signals have occurred over the past month:
- The RMB has fallen nearly 6% since mid-June, which we have argued has been at least partially policy-driven. As we highlighted in our June 27 report,1 the decline in CNY/USD has been large, has occurred very rapidly, and cannot be explained by its previous relationship with the U.S. dollar (Chart 1).
- The PBOC cut its reserve requirement ratio for both big and small banks at the end of June, following the cut in April (Chart 2). It also provided incentives for banks to buy speculative-rated corporate bonds, clarified that its new asset management rules would permit mutual funds to invest in non-standard assets, and recently injected 500 billion RMB of liquidity into the banking system via its medium-term lending facility (MLF).
Chart 1
An Enormous, At Least Partially Policy-Driven Move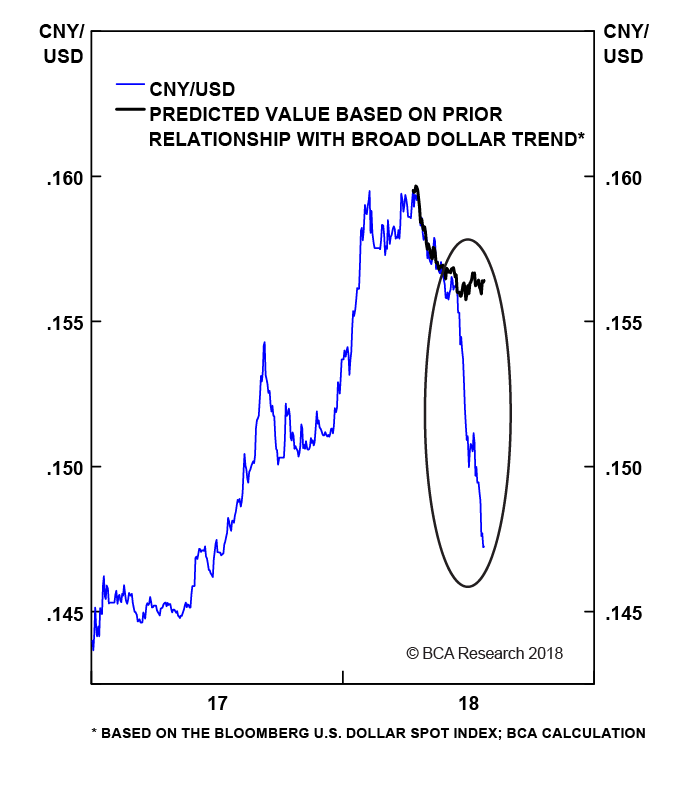
 Fullscreen Fullscreen |  Interactive Chart Interactive Chart |
Chart 2
A Second Cut To Bank Reserve Requirement Ratios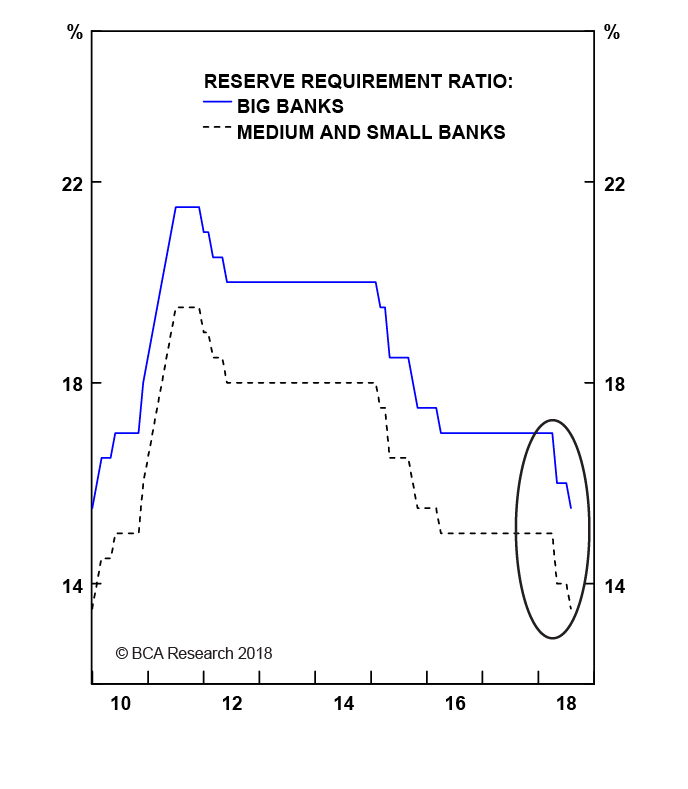
 Fullscreen Fullscreen |  Interactive Chart Interactive Chart |
- The Ministry of Finance (MOF) signaled that it would speed up spending that was planned to occur later in the year, and the State Council signaled that it would accelerate the issuance of 1.4 trillion RMB in local government bonds to support infrastructure investment. It also green-lighted a comparatively small 6.5 billion RMB in tax cuts for corporate R&D.
- China's legislature released a draft version of proposed tax changes that would cut the rate paid for individuals.
The flurry of policy announcements over the past month has given investors the impression that Beijing has turned the policy dial in the direction of supporting growth. We agree that China is easing at the margin, and that these policy announcements are important: without them, the Chinese economy would likely face a substantial deceleration that would risk a serious slowdown in global growth.
...That Will Not Cause A Material Re-Acceleration In The Economy
But several observations suggest that the stimulus proposed so far falls short of a "big bang" response that would reverse both the looming export shock as well as the underlying slowdown in China's old economy:
- Fiscal Stimulus: Chart 3 shows that China's on-budget deficit expanded by 3 percentage points over an 18-month period from 2014 to 2016. An equivalent expansion today would imply a 2.6 trillion RMB rise in the budget deficit, meaning that the local government bond issuance announced on Monday is 40% smaller than the deficit expansion that occurred from 2014 to 2016. If the infrastructure projects financed by these bonds turn out to be multi-year initiatives tied to China's structural reform plans, the intensity of this round of fiscal stimulus will likely turn out to be less than half, or even a fraction, of what occurred previously.
- Fiscal Vs. Credit Expansion: While an increase in fiscal spending was important in catalyzing an economic recovery in 2014/2016, Chart 4 highlights that the expansion of credit was considerably larger. The chart shows on-budget fiscal spending and the change in adjusted total social financing (TSF) as a percent of GDP, and highlights that the latter dwarfs the former. By our calculations, adjusted TSF accelerated by 5 trillion RMB from 2015 to 2016, which from our perspective could only have been achieved by very aggressive monetary easing.
- Currency Depreciation: A simple framework that equates the equilibrium/required currency depreciation to the size of the tariffs imposed as a share of total exports to the U.S. suggests that a 6% decline in CNY/USD may be adequate at negating an export shock if the proposed tariffs stop after the recently proposed new round of 10% tariffs on $200 billion worth of goods. But first, this approach suggests that a further 6-7% decline may be needed if President Trump follows through with his threat to impose tariffs on all imports from China. Second, in either case the currency decline merely addresses the prospective export shock, not the underlying slowdown in China's old economy that has been occurring over the past year.
Chart 3
Bond-Financed Infrastructure Spending Unlikely To Match 2015's Fiscal Expansion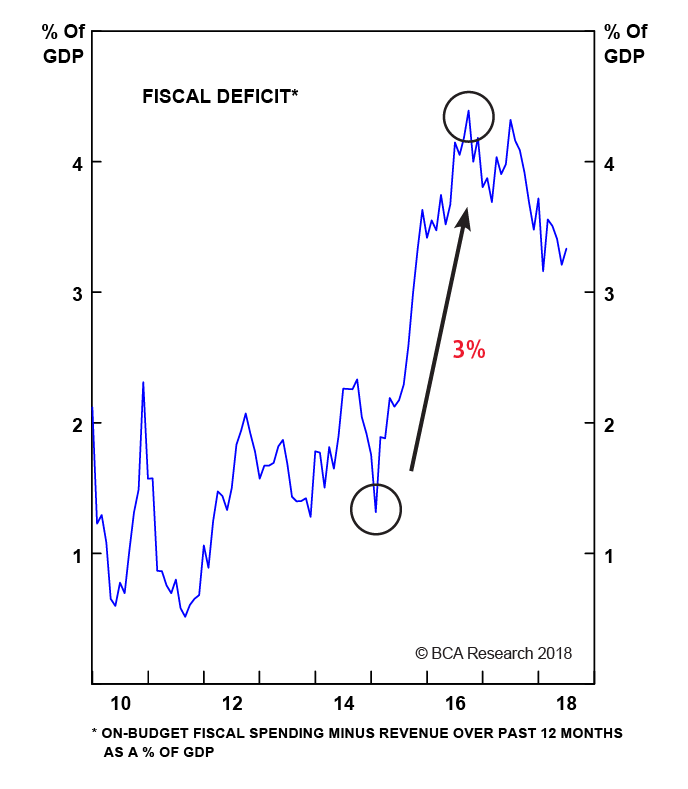
 Fullscreen Fullscreen |  Interactive Chart Interactive Chart |
Chart 4
Three Years Ago, The Expansion In Credit Dwarfed That Of Fiscal Spending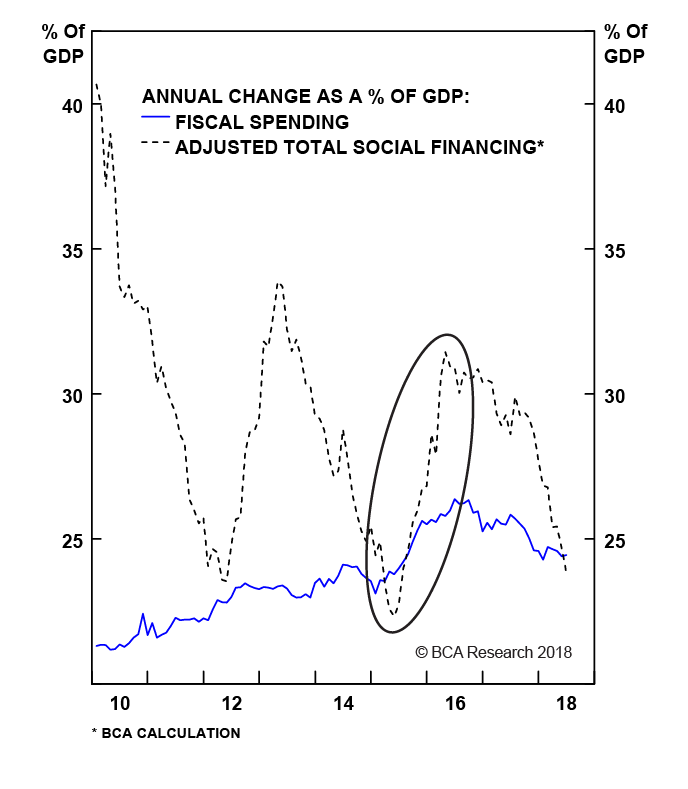
 Fullscreen Fullscreen |  Interactive Chart Interactive Chart |
From our perspective, China's monetary policy actions have so far been the most convincingly stimulative developments in response to the threat to exports. We downplayed China's most recent reserve requirement ratio cut in our June 27 Weekly Report,1 and we acknowledge that this initial assessment was overly pessimistic. Chart 5 shows that the 3-month repo rate, China's de-facto policy rate, has broken meaningfully below the lower band that had prevailed since the beginning of 2017. This suggests that the targeted addition of liquidity, particularly to China's small banks, was at least somewhat effective at easing financial conditions.
Chart 5
The PBOC Has Successfully Lowered The 3-Month Repo Rate...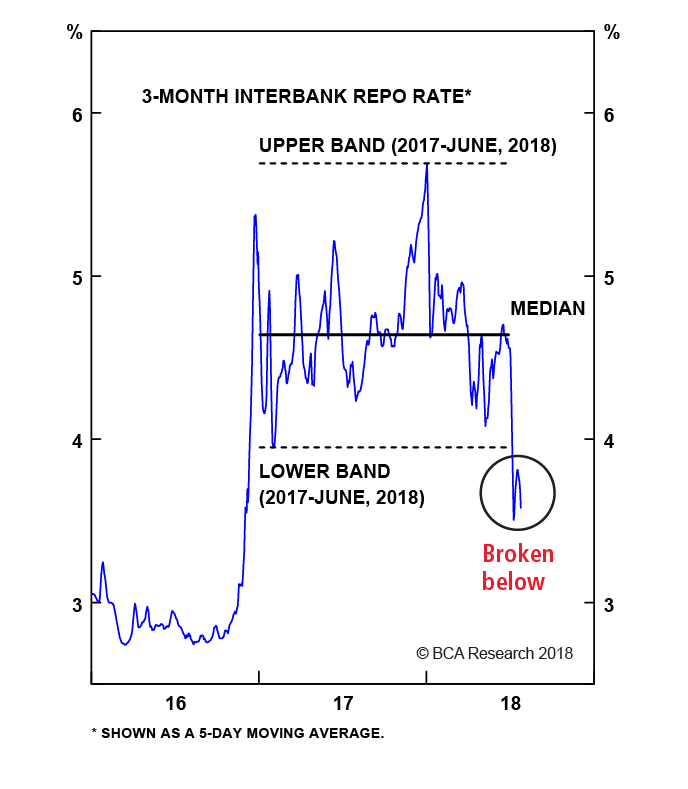
 Fullscreen Fullscreen |  Interactive Chart Interactive Chart |
Chart 6
...But This Is Unlikely to Significantly Drop Average Lending Rates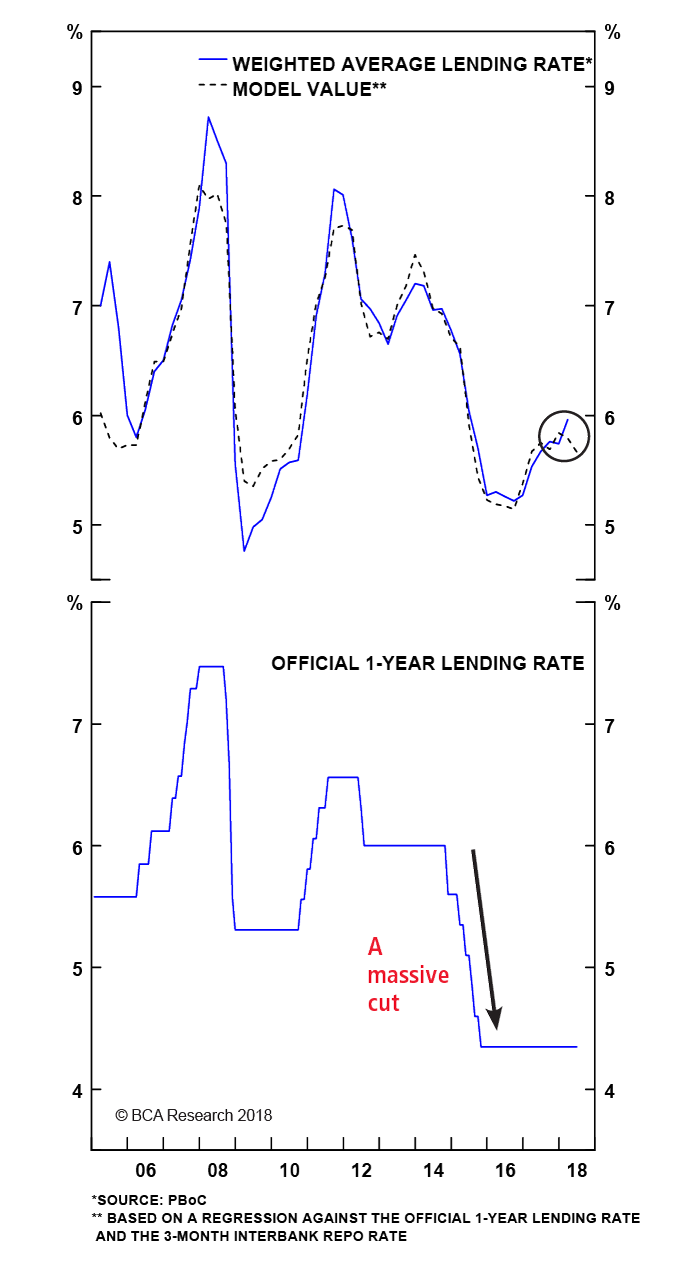
 Fullscreen Fullscreen |  Interactive Chart Interactive Chart |
Still, we remain unconvinced that what has been announced so far is likely to generate an acceleration in credit growth even approaching what occurred three years ago. Chart 6 shows the weighted average lending rate in China, alongside a simple regression model for the rate based on the benchmark lending rate and the 3-month interbank repo rate (China's "old" and "de-facto new" policy rates, respectively). The chart highlights the likely minimal impact of the recent decline in the repo rate on the average lending rate. In fact, Chart 6 underscores an important point about China's stimulus in 2014-2016: a good portion of that episode's reflationary impact appears to have been caused by the PBOC's 170 bps cut to its benchmark lending rate, which has so far remained unchanged (without any hint from policymakers that it might be lowered).
Finally, we are similarly underwhelmed by the PBOC's incentives to banks to buy "junk" corporate bonds: debt securities are a small (albeit fast growing) portion of China's total nonfinancial credit, and junk-rated bonds are a small fraction of that market. We thus see this announcement as an attempt to provide some marginal liquidity support for issuers of these bonds that have upcoming refinancing requirements, rather than a policy of any true macro significance.
Conclusions And Investment Strategy Recommendations
Two important insights emerge from our above analysis. The first is that the intensity and timing of the infrastructure projects alluded to by the State Council are important factors in determining the likely impact of increased government spending. We suspect that any boost to the economy over the coming year from infrastructure spending will be relatively small, but this will be an important element to monitor over the coming months.
The second insight is that we would become considerably more constructive towards China's economy were the PBOC to cut its benchmark lending rate. This would be clear sign that the China is pressing on the accelerator, rather than attempting to simply "fine tune" the economy in the face of an external economic shock.
For now, however, our view is that the stimulative measures that have been announced are not likely to lead to a renewed cyclical uptrend in China's economy. This implies that investors should remain neutrally positioned towards Chinese stocks within a global equity portfolio, and should favor low-beta sectors within the Chinese investable universe. Chart 7 shows that the latter position, which we initiated on June 27, has risen almost 1% in relative terms over the past month, and we expect further gains over the remainder of the year.
Finally, we noted in our July 5 Weekly Report that the selloff in Chinese domestic stocks was advanced,2 and that we would consider implementing a long MSCI China A Onshore index / short MSCI China index trade in response to a 5% rally in relative common currency performance. It is conceivable that "easing off the brake" will be enough for A-shares to rally non-trivially relative to investable stocks, given how much they have fallen since the beginning of the year.
Chart 8 shows that A-shares have approached this threshold in response to recent stimulus announcements, but have yet to break through. We will be watching relative A-share performance closely over the coming weeks for a green light to initiate the position. Stay tuned!
Chart 7
Low-Beta Sectors Are Outperforming China's Investable Market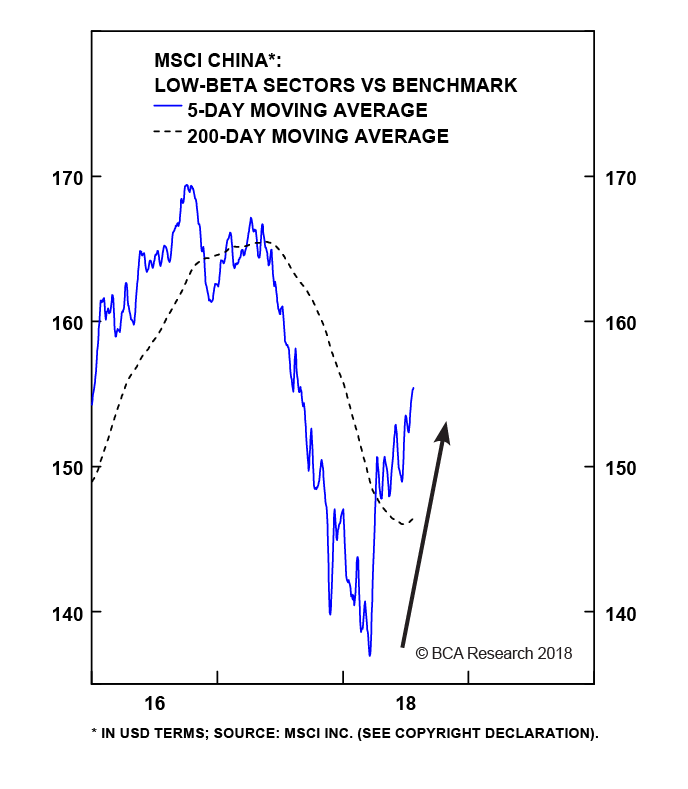
 Fullscreen Fullscreen |  Interactive Chart Interactive Chart |
Chart 8
Conditions May Soon Warrant A Pair Trade Favoring Domestic Stocks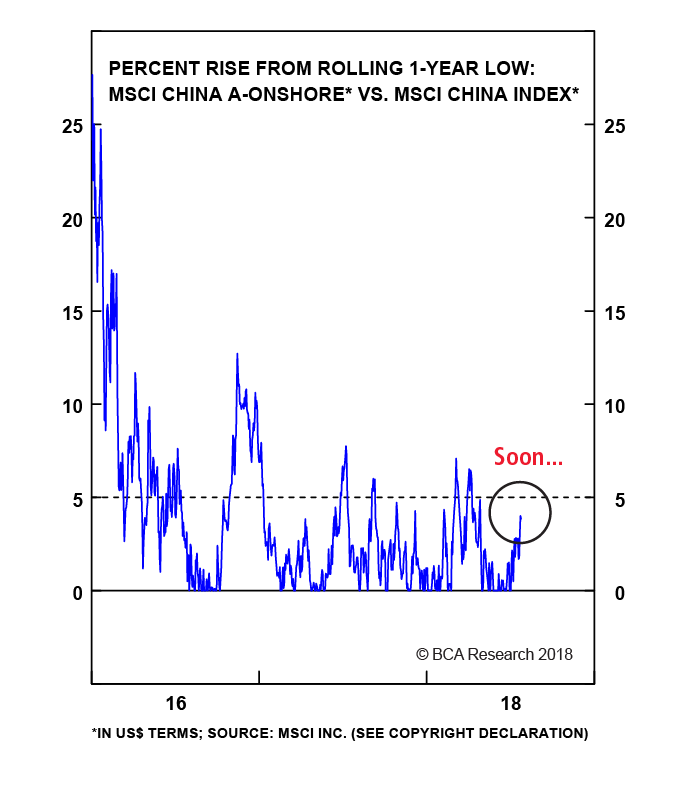
 Fullscreen Fullscreen |  Interactive Chart Interactive Chart |
Jonathan LaBerge, CFA, Vice President
Special Reports
jonathanl@bcaresearch.com
- 1 Pease see China Investment Strategy Weekly Report "Now What?", dated June 27, 2018, available at cis.bcaresearch.com
- 2 Pease see China Investment Strategy Weekly Report "Standing On One Leg", dated July 5, 2018, available at cis.bcaresearch.com
Cyclical Investment Stance
| COUNTRY /SECTOR RECOMMENDATIONS | INITIATE DATE/ LINK TO REPORTS | TOTAL RETURN | NOTE |
| SHORT HONG KONG 10-YEAR GOVERNMENT BOND/US 10-YEAR TREASURY | 15-JAN-14 | 2% | Total return of Hong Kong 10-Year government bond versus U.S. 10-Year Treasury. |
| LONG CHINA ONSHORE CORPORATE BONDS | 22-JUN-17 | 5% | A basket of 5 year AAA and 5 year AA- rated corporate bonds from June 22, 2017 to January 25, 2018; ChinaBond Company Credit Bond Total Return Index after January 25, 2018. |
| LONG MSCI CHINA CONSUMER STAPLES / SHORT MSCI CHINA CONSUMER DISCRETIONARY | 16-NOV-17 | 36.6% | MSCI China consumer staples index versus MSCI China consumer discretionary index (times 10), initiated at 38, currently 51.4. |
| LONG MSCI CHINA ESG LEADERS / SHORT MSCI CHINA | 16-NOV-17 | -3% | MSCI China ESG leaders index versus MSCI China index initiated at 20, currently 19.3. |
| LONG MSCI CHINA LOW-BETA SECTORS / SHORT MSCI CHINA | 27-JUN-18 | 1.2% | MSCI China low-beta sectors versus MSCI China index, initiated at 153.1, currently 155.0. The current sector weights of the portfolio are: Industrials 26%, Telecom Services 24%, Health Care 21%, Consumer Staples 15%, Utilities 15%. |
 You are reading a complimentary report. To find out more about our services,


