資産管理と保管
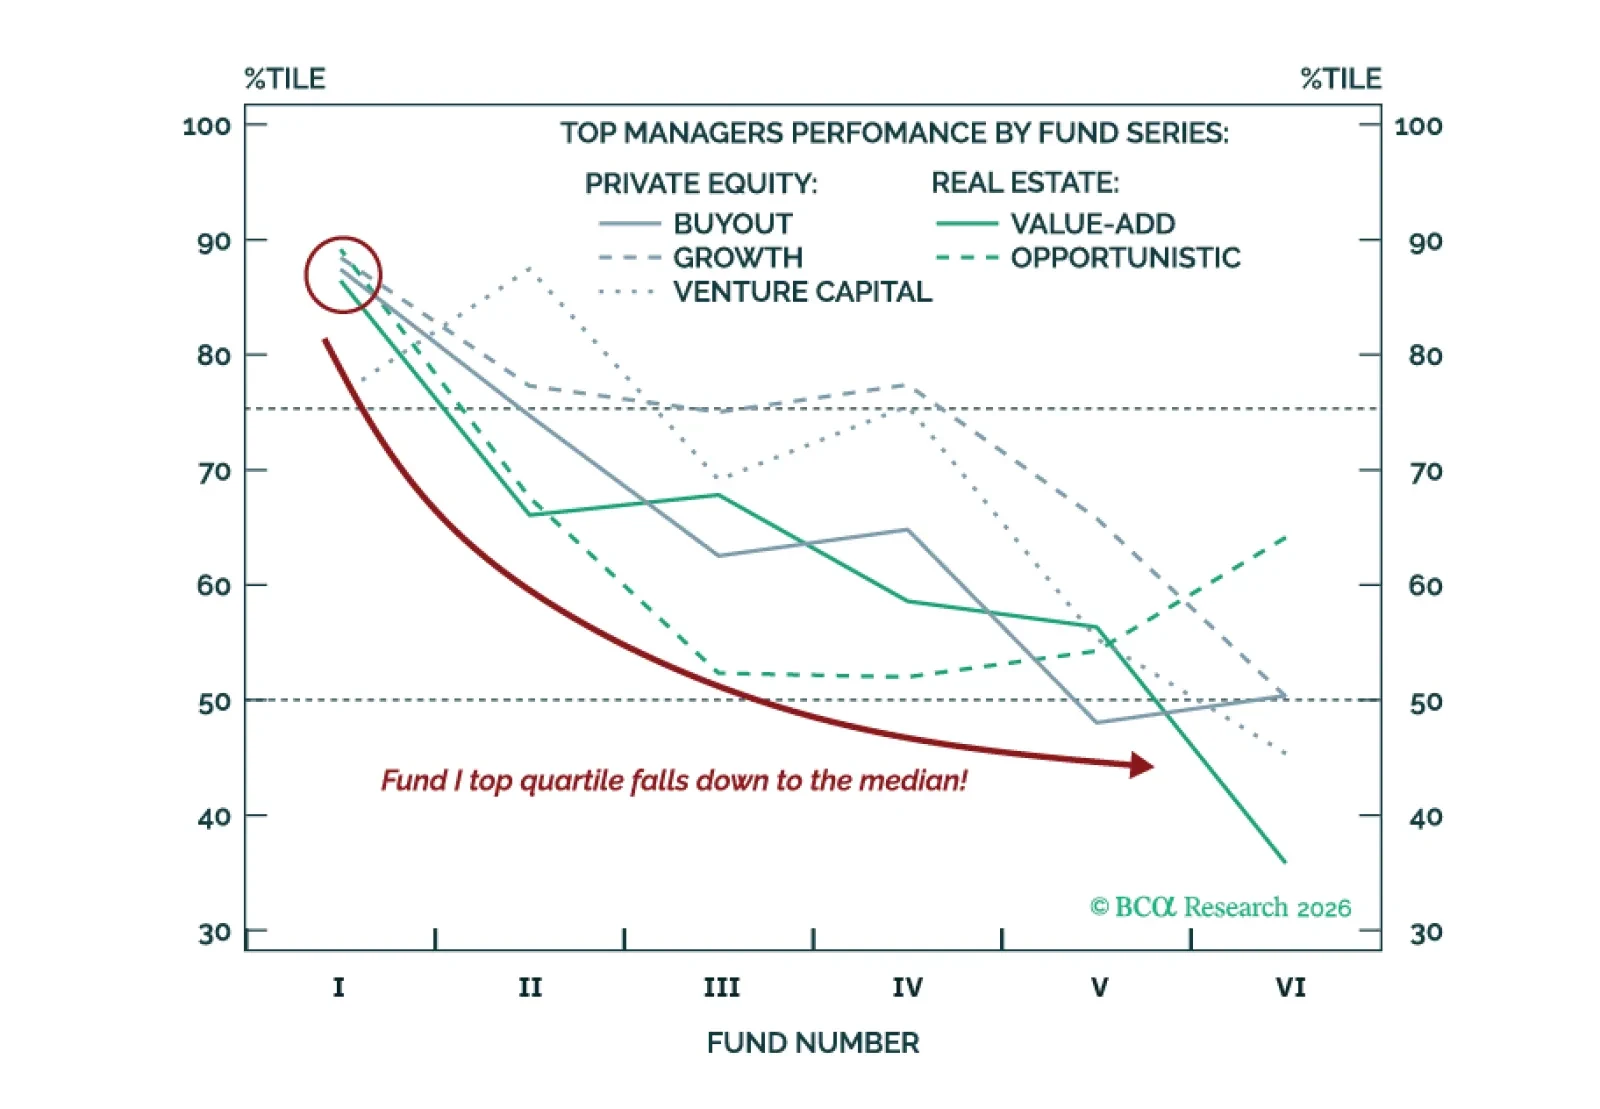
プライベート・マーケットでは、過去の勝者のアウトパフォーマンスはしばしば薄れる。ファンドシリーズが成熟するにつれて、上位四分位のマネージャーはしばしば中央値へ回帰する。次のリアルエステートやプライベート・エクイティのマネージャーを評価する投資家は、ファンドV以降をアンダーウェイト寄りにすることを勧める。
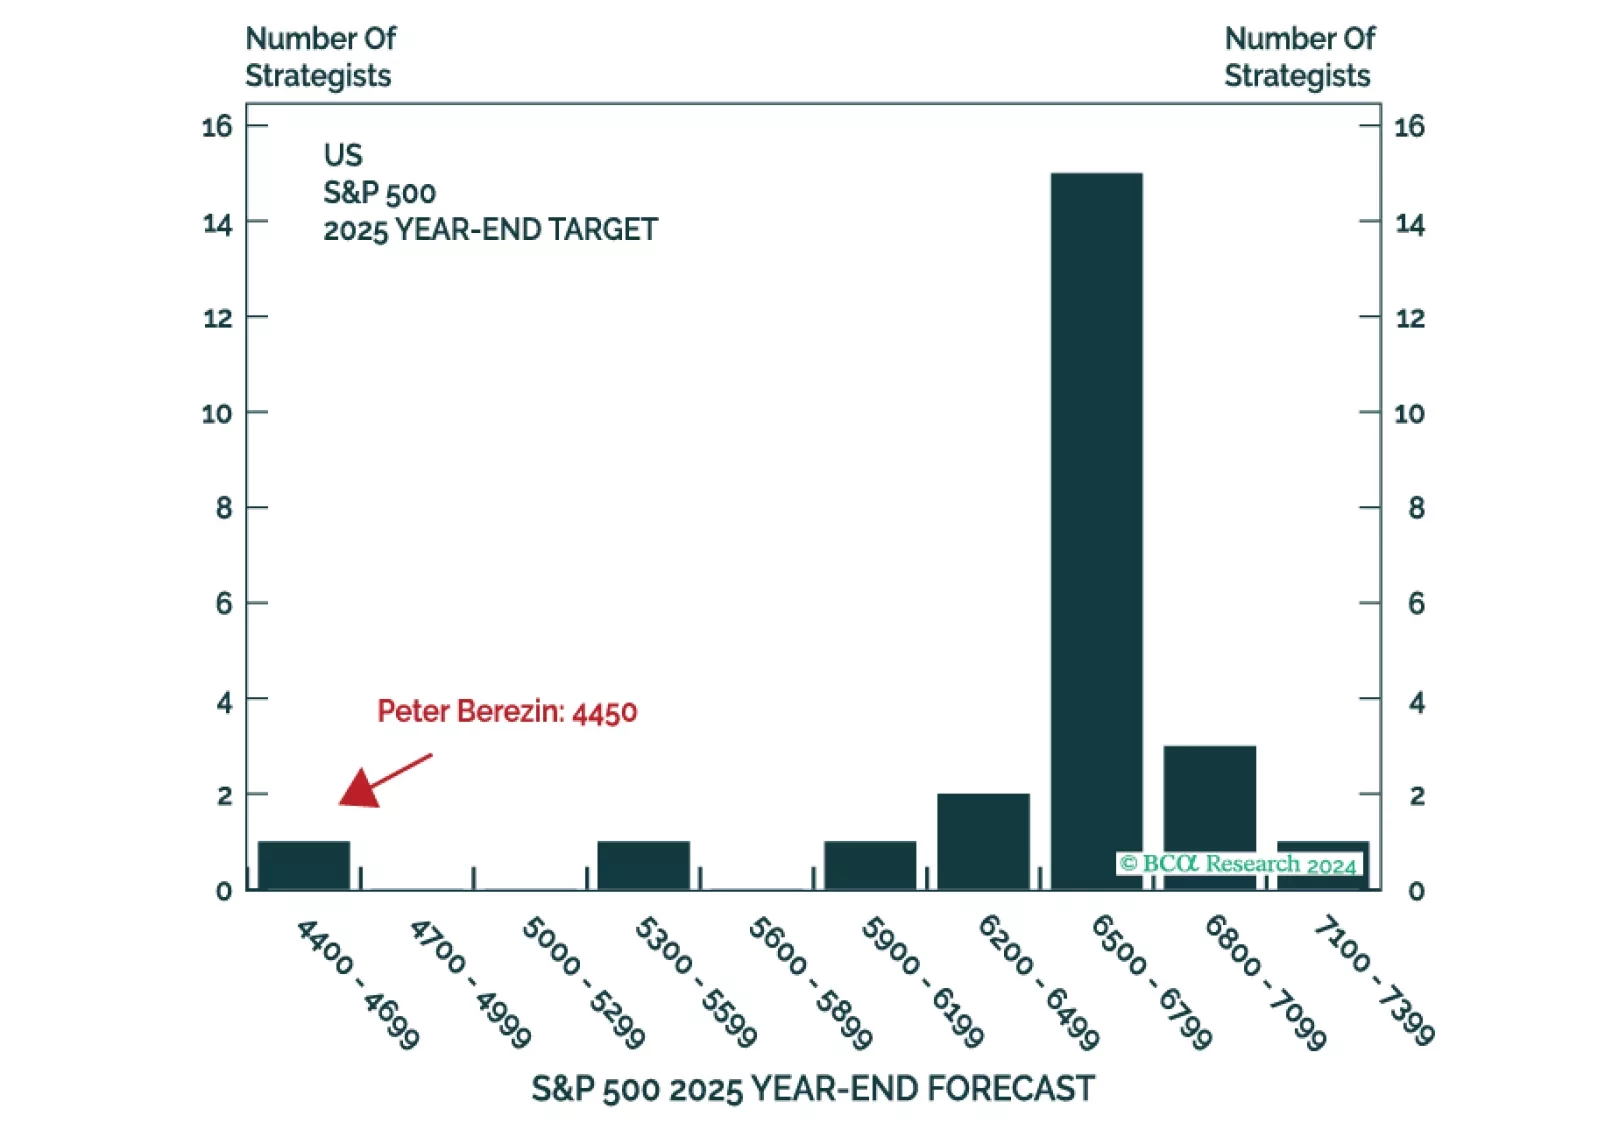
This is the time of the year when strategists are busy sending out their annual outlooks. Here on the Global Investment Strategy team, we decided to go one step further. Rather than pontificating about what could happen in 2025, we decided to harness the power of the multiverse to tell you what did happen (in at least one highly representative timeline).
Next week, please join me for a Webcast on Tuesday, December 17 at 10:30 AM EST (3:30 PM GMT, 4:30 PM CET) to discuss the economy and financial markets.
And with that, I will sign off for the year. I wish you and your loved ones a very happy and healthy 2025. We will be back in the first week of January with our MacroQuant Model Update.

Highlights Portfolio Strategy The hardening insurance market on the back of firming demand for insurance services especially in residential real estate and automobile markets compel us to lift insurers to a benchmark allocation. A resurgent stock-to-bond ratio, the reopening of the economy and receding fiscal policy, election and COVID-19 uncertainties which will further suppress the equity risk premium, all boost the allure of the S&P asset management & custody bank index. Stay overweight. Recent Changes Upgrade the S&P insurance index to neutral and lock in relative gains of 38%, today. This move also augments the S&P financials sector weighting to a modest overweight stance. Table 1 Feature News of a vaccine last Monday turbocharged equities to new intraday all-time highs, following up from a stellar performance the week of the election as odds of a “Blue Wave” collapsed. One of the implications is that the Trump corporate tax cuts will remain in place and investors breathed a sigh of relief (tax policy uncertainty shown inverted, Chart 1). While a smaller fiscal package owing to a split government postponed the rotation trade, the PFE vaccine efficacy news brought it back with a vengeance. This set up caused equities to discount all the good news in a heartbeat as typically happens when uncertainty is sky high and investors stampede into stocks. As we have argued here a VIX with a 40 handle was overdone and thus we crystalized our gains and closed our long VIX December futures trade prior to the election. We have been preparing our portfolio for such a looming rotation and this has been most evident in our long “Back To Work”/short “Covid-19 Winners” equity baskets. Last Monday they went in polar opposite directions and compelled us to put a trailing stop at the 10% return mark in order to protect profits (top three panels, Chart 2). Chart 1Tax Policy Uncertainty Relief Our recent preference of small caps at the expense of large caps that we first recommended a week before the election also depicts the ongoing equity market rotation out of overvalued tech stocks and into beaten down laggard cyclicals (bottom panel, Chart 2). Importantly, the economic reopening trade is still in the early innings, and we remain cyclically bullish on the prospects of the S&P 500 with a fresh end-2021 target of 4,000 that we updated last Monday in a Special Report before news of a vaccine hit the wires. Nevertheless, the recent parabolic rise in equities raises the obvious question: have stocks run too far too fast? Chart 2“Back To Work” Recovery First, there is no doubt that equities are overextended in the near-term as the collapse in the equity put/call (EPC) ratio highlights. Over the past year, the EPC ratio has formed a clearly defined range and a reading below 0.4 suggests overbought conditions (EPC ratio shown inverted, Chart 3). Second, while the violent rotation has pushed the SPX higher despite the deflating tech sector, we doubt that in the coming weeks the SPX will continue to gallop higher without the heavyweight tech sector partially participating in the rally. As a reminder, adding FANG (FB, AMZN, NFLX & GOOGL) weights to the GICS1 tech sector’s weighting results in a roughly 40% market cap weight of tech-related stocks in the S&P 500 (Chart 4). Chart 3No More Hedging Chart 4Tech Is 40% Of The Market Third, according to the American Association of Individual investors (AAII), bulls are back in droves and the AAII bull/bear ratio has slingshot to the highest level since January 2018. This is cause for near-term concern as it has historically served as a reliable contrary signal (Chart 5). Fourth, the knee-jerk equity market reaction on the back of the positive vaccine news has also pushed the percentage of SPX stocks trading above their 200-day moving average to a zenith, warning that the SPX will most likely move laterally (Chart 6). Chart 5Bull Stampede Chart 6Too Far Too Fast? Finally, following a rough September and choppy October, seasonality is now in favor of owing stocks and given diminishing odds of year-end tax loss selling, equities should grind higher as 2020 draws to a close. Netting it all out, in the short-term our going assumption is that, barring exponential moves in the reopening trade similar to what we witnessed last week, the SPX will likely move sideways in order to digest the recent up move and work off overbought conditions. This is especially true if a selloff in the bond market continues to weigh on the tech sector’s still lofty valuation footprint. This week we make a sub-surface financials sector tweak that pushes this early cyclical sector to a modest above benchmark allocation. Time To Lock In Gains On Insurance The shifting macro landscape signals that it no longer pays to be bearish insurance stocks; thus we are upgrading the S&P insurance index to a neutral weighting today, crystalizing relative gains of 38% since inception. This cyclical underweight exposure in insurance stocks – as part of our barbell portfolio strategy within the financials universe – has cushioned the blow from our positive bank exposure and served its hedging purpose. Now that the election uncertainty is waning and given the recent positive PFE news on the effectiveness of their COVID-19 vaccine, insurance stocks will at least catch a bid. The economic reopening underscores that home and auto sales will continue to climb as nonfarm payrolls make a run for the pre-recession highs likely sometime in 2021. Keep in mind that consumers’ plans to buy a new car and a home are recovering smartly according to the most recent Conference Board survey (third panel, Chart 7). This upbeat demand backdrop for these key insurance end-markets should boost industry profits (bottom panel, Chart 7). Already a hardening insurance market (second panel, Chart 8) owing to pent-up residential real estate and automobile demand is a boon for underwriting results. Chart 7Insuring Gains Chart 8Hardening Market Importantly, the latest national account data corroborates firming final demand for insurance services: consumer outlays on insurance are galloping higher. The upshot is that the insurance valuation de-rating will transition to a rerating phase (bottom panel, Chart 8). Our Insurance Indicator does an excellent job in encapsulating all these moving parts and heralds rosier days ahead for relative share prices (second panel, Chart 9). However, there is a caveat that prevents us from swinging all the way to an overweight stance. Insurance CEOs have been anything but disciplined. Headcount is surging and industry wages are also accelerating. While executives may be preparing for a durable rebound in the coming months, a spiking wage bill will eat into insurance margins (third & bottom panels, Chart 9). Netting it all out, a hardening insurance market on the back of firming demand for insurance services especially in residential real estate and automobile markets compel us to lift insurers to a benchmark allocation. Bottom Line: Upgrade the S&P insurance index to neutral today, cementing relative profits of 38% since inception. This upgrade bumps the broad S&P financials sector to a modest overweight stance. The ticker symbols for the stocks in the S&P insurance index are: BLBG: S5INSU - AIG, CB, MET, MMC, PRU, TRV, AFL, AON, ALL, PGR, WLTW, HIG, PFG, L, CINF, LNC, AJG, UNM, AIZ, RE, GL, WRB. Chart 9One Positive And One Risk Stick With Asset Management & Custody Banks While we have moved to the sidelines on the S&P banks and S&P investment banks & brokers groups, we have maintained bank-related exposure via the S&P asset management & custody banks (AMCB) index and today we reiterate our overweight stance in this early cyclical group. Recent news of industry M&A activity has propped up stocks in this index. Any reduction of supply is great news not only because investors have fewer constituents available to deploy capital to, but also because of oligopolistic power with positive industry pricing power knock-on effects. Tack on the recent selloff in the bond market and factors are falling into place for a durable outperformance phase in the S&P AMCB index (top panel, Chart 10). In fact, the stock-to-bond ratio has caught on fire of late forecasting a pickup in momentum in relative share prices (middle panel, Chart 10). Fund flows are also emitting a bullish signal. Historically, increasing bond and equity fund flows have been positively correlated with the relative share price ratio and the current message is positive (bottom panel, Chart 10). Our view remains that the economy will continue to reopen in 2021 and news of the PFE vaccine reiterates our thesis. Thus, as economic uncertainty lifts, it should lead to multiple expansion in this beaten down early cyclical industry (middle panel, Chart 11). More broadly speaking, receding fiscal and election uncertainties should push down the still high equity risk premium and boost the allure of the S&P AMCB index (bottom panel, Chart 11). Chart 10Increasing Flows Are A Boon Chart 11A Play On The Economic Reopening Securities lending is another source of income for the industry. Oscillating margin debt balances are an excellent demand gauge for such income producing services. Recently, margin debt has made a run for all-time highs in level terms, expanding at a near 20%/annum clip, underscoring that an earnings led advance is in the offing (bottom panel, Chart 12). With regard to earnings, there is broad-based skepticism on the industry’s profit growth recovery prospects both on a cyclical and structural time horizon. The middle panel of Chart 13 highlights that over the past two decades every time sell-side extreme pessimism reigned supreme, it was a good contrary signal. More precisely, when relative 12-month profit growth expectations sink to negative double digits, a reflex rebound typically ensues. We doubt this time will prove different. Chart 12Follow The Margin Debt In sum, a resurgent stock-to-bond ratio, the reopening of the economy and receding fiscal and election uncertainties which will further suppress the equity risk premium, all boost the allure of the S&P AMCB index. Chart 13Lean Against Extreme Analyst Pessimism Bottom Line: We continue to recommend an above benchmark allocation in the S&P AMCB index. The ticker symbols for the stocks in this index are: BLBG: S5AMGT – BK, BLK, STT, AMP, NTRS, TROW, BEN, IVZ. Anastasios Avgeriou US Equity Strategist anastasios@bcaresearch.com Current Recommendations Current Trades Strategic (10-Year) Trade Recommendations Size And Style Views October 26, 2020 Favor small over large caps July 27, 2020 Overweight cyclicals over defensives June 11, 2018 Long the BCA Millennial basket The ticker symbols are: (AAPL, AMZN, UBER, HD, LEN, MSFT, NFLX, SPOT, TSLA, V). January 22, 2018 Favor value over growth
Highlights Portfolio Strategy The financials sector's fortunes are linked to the path of 10-year Treasury yields. BCA's view of a selloff in the bond market bodes well for this interest rate-sensitive sector. The S&P banks index is on the cusp of flexing its earnings power muscle. Higher profits will serve as a catalyst for a valuation rerating in this key financials sub-sector. The still unloved S&P asset management & custody banks index has significant catch-up potential. We reiterate our high-conviction overweight status. Recent Changes There are no changes to our portfolio this week. Table 1 Feature The S&P 500 ended last week on a high note, cheering significant progress on the tax bill front and digesting early earnings beats. Given the equity market's lofty valuation starting point, substantial positive profit surprises are now necessary to move the needle in stocks. Encouragingly, IBM's mention of the fall in the U.S. dollar boosting EPS1 may morph into a broad-based theme this earnings season given the currency's mysterious absence we have been flagging in Q2. Beneath the surface, easy fiscal policy prospects coupled with synchronized global growth will likely continue to underpin equities. Importantly, later stages of the business cycle are synonymous with impressive gains in the S&P 500. The unemployment gap, defined as the unemployment rate minus the non-accelerating inflation rate of unemployment (NAIRU), is an excellent leading indicator of the yield curve. Granted, NAIRU is an estimate and we are using the CBO's long-term NAIRU quarterly forecast as an input to the unemployment gap indicator. When the unemployment gap disappears, inflation should start rearing its ugly head, eventually leading the Fed to tighten monetary policy to the point where the yield curve inverts and predicts the end of the business cycle. Empirical evidence suggests that first the unemployment gap closes then the yield curve inverts and the business cycle subsequently ends (Chart 1). However, this indicator has had one miss since the early-1970s, during the second leg of the early-1980s double dip recession. Chart 1Eliminated Unemployment Gap Is Bullish For Equities Table 2 shows the S&P 500 performance from when the unemployment gap clearly closes until the business cycle ends. In all five iterations that lasted, on average, 28 months, the broad market has risen, on average, by 29%. The unemployment gap has been eliminated since February 2017 and if history at least rhymes the next U.S. recession will arrive some time in 2019 as the SPX hits our peak cycle 3,000 target.2 Another later cycle phenomenon is the disappearance of volatility and the plunge in stock correlations as the Fed tightens monetary policy. While large institutional investors aggressively selling volatility this cycle is dampening vol across asset classes, there is another explanation of the non-existence of vol: synchronized global growth. Chart 2 shows that leading up to the prior three recessions, volatility was drifting lower and remained low, and the common denominator was simultaneous global growth in the late-1980s, late-1990s and mid-2000s. BCA's global (40 country) industrial production composite was expanding during the later stages of the business cycle. Similarly, our global (44 country) global EPS diffusion index and the global synchronicity indicator also depict concurrent global growth. Table 2S&P 500 Returns When##br## The Unemployment Gap Closes Chart 2Linking Low Vol To ##br##Synchronized Global Growth During the later stages of the cycle, equity sector correlations also collapse as earnings fundamentals are key performance drivers and sector differentiation generates alpha, as the broad market enters the last stage of the bull market. As we mentioned in our "SPX 3,000?" Weekly Report on July 10th, this does not mean the S&P 500's path is a linear straight line up until the next recession hits. There are high odds of a 5-10% garden variety pullback materializing which we deem a healthy development and our strategy would be to buy the dip, ceteris paribus. This week we update an early cyclical sector and two key sub-components. Financials: In The Shadows Of The Bond Market While financials stocks have cheered the prospects of a tax bill passage sometime in early 2018 (Chart 3), sell-side analysts have been brutally downgrading financials sector EPS estimates, dealing a blow to most sub-indexes net earnings revisions (Chart 4). True, hurricane-related losses may be the culprit, but such indiscriminate downgrades are unwarranted, and we would lean against such pessimism. Recent profit results corroborate our positive sector bias, but we are still early in the earnings season. Chart 3Dissecting Financials Performance Chart 4Extreme EPS Pessimism This early cyclical sector is a core overweight portfolio holding and there are high odds of significant relative gains in the coming quarters. Historically, financials stocks had been almost 100% positively correlated with the yield curve slope (Chart 5): a steepening yield curve gooses financials profits, while a flattening one eats into earnings via narrowing net interest margins. This rang true up until the Great Recession. Since then, unconventional monetary policies likely rendered this multi-decade correlation ineffective. In particular, the fed funds rate's zero lower bound caused a shift in the correlation from the yield curve to the 10-year Treasury yield (Chart 6). In fact, changes in the 10-year Treasury yield are now a carbon copy of relative share price momentum (Chart 6). Chart 5Shifting Correlations Chart 6Financials And UST Yield Are Joined At The Hip Thus, accurately forecasting long term interest rates should also dictate the direction of relative share prices, especially given the still historically low fed funds rate. On that front, the Treasury market is priced for the 10-year yield to hit 2.57% in October 2018 from roughly 2.38% currently. We expect the 10-year yield will rise more quickly than is discounted in the forward curve. Our U.S. bond strategists think core inflation will soon resume its modest cyclical uptrend. A parallel recovery in the cost of inflation protection will impart 50-60 basis points of upside to the 10-year Treasury yield by the time core inflation reaches the Fed's 2% target.3 Chart 7 plots the path of the 10-year Treasury yield discounted in the forward curve alongside a path consistent with BCA's view that inflation is poised to head higher. It also shows what this would mean for the 10-year breakeven inflation rate. If core inflation resumes its uptrend, as BCA expects, then financials will have a stellar return year in 2018, all else equal. Chart 7Lots Of Upside Meanwhile, market participants typically value financials on a price-to-book basis during calamitous times and are very slow in changing metrics once the tremors are behind the sector. We are likely on the cusp of a switch away from P/B and toward forward P/E as a key valuation metric for financials. The current 20% forward P/E discount to the broad market is highly punitive (bottom panel, Chart 5). If the key S&P banks sub-index successfully flexes its earnings power muscle, as we expect, then a valuation rerating phase looms for both banks and financials equities. Banks Hold The Key We remain constructive on the S&P banks index as all three key drivers of bank profits, namely loan growth, price of credit and credit quality, are simultaneously moving in the right direction. Tack on the increasing likelihood of a tax bill becoming law in early 2018, the continued push of the Trump administration to relax bank regulations and pent up demand for shareholder friendly activities including net share retirement and higher dividend payments/payouts, and bank stocks are well positioned to generate impressive returns in the coming quarters. Lower corporate tax rates will boost bank profits directly and indirectly. Fiscal stimulus typically translates into an economic fillip. If small and medium businesses (SME) benefit the most from lower taxes then higher SME profits will lead to a more expansionary mindset and small business owners will likely tap their bankers to finance capital spending plans. As tax certainty increases, so will animal spirits, aiding in kick-starting a virtuous economic cycle. Thus, loan growth is on an upward trajectory. Leading indicators of loan demand are also painting a bright picture for bank profits. C&I and consumer loans, two large credit categories, are both forecast to reaccelerate in the coming months. The ISM manufacturing survey has been on fire lately and consumer confidence has been following closely behind (third & fourth panels, Chart 8). Our credit growth model captures these positive forces and is sending an unambiguously positive message for loan reacceleration in the coming months (Chart 8). Moreover, residential real estate loan origination (the second largest credit category in U.S. dollar terms) should gain steam, underpinned by solid housing market's foundations: house prices are still expanding at a healthy clip (top panel, Chart 9), household formation is running higher than housing starts and mortgage rates are not prohibitive. Chart 8Bright Business And Consumer Credit Outlooks Chart 9Ongoing Valuation Rerating The V-shaped recovery in our U.S. credit impulse corroborates this fertile loan backdrop and is heralding an earnings outperformance phase (Chart 10). On the price of credit front, if BCA's bond view pans out in the next year and the 10-year Treasury yield veers closer to 2.8-3% range with rising inflation expectations in the driver's seat (Chart 11), then bank profits should continue to accelerate. Granted, the Fed will also raise rates next year and, at the margin, push up funding costs for the banking sector. However, our working assumption is that banks will remain linked to the 10-year UST yield's fortunes next year. At some point later in the Fed tightening cycle, the yield curve and bank correlation will likely get re-established. But, a flattening yield curve denting NIMs is a 2019 narrative. Finally, credit quality remains pristine despite some pockets of weakness in, subprime especially, auto loans. At this stage of the cycle, near or at full employment, NPLs will remain muted. Importantly, loan loss reserves have recently crossed above non-current loans in Q2 according to the FDIC, for the first time since 2007. Historically, a rising reserve coverage ratio has been synonymous with increasing valuations and the current message is that the banks rerating phase is in the early innings (Chart 12). Chart 10Heed The Positive Credit Impulse Signal Chart 11Price Of Credit Should Recover Chart 12Pristine Credit Quality Bottom Line: We reiterate our early-May overweight stance in the S&P financials sector and continue to overweight the heavyweight S&P banks sub-index. The ticker symbols for the stocks in this index are: BLBG: S5BANKX - WFC, JPM, BAC, C, USB, PNC, BBT, STI, MTB, FITB, CFG, RF, KEY, HBAN, CMA, ZION, PBCT. A Few Words On Asset Management & Custody Banks The S&P asset management & custody banks (AMCB) index sits atop of our high-conviction return table (see page 15), outperforming the broad market by 7.2% since inception. While it is tempting to monetize some of these profits, we choose to remain patient. Likely more gains are in store in the coming months as this financials sub sector maintains its leadership position. If BCA's bond view of a selloff in the 10-year Treasury market transpires in 2018, then the budding rotation out of bond and into equity products will further accelerate. The stock-to-bond ratio captures this shift and it is currently flashing green (Chart 13). Overall assets under management are also rising and are a boon for the AMCB group's profit prospects, on the back of higher equity prices and also higher flows into stocks in general (bottom panel, Chart 13). Vibrant global economic sentiment, as measured by the IFO's World Economic Survey (top panel, Chart 14), and domestic (and global) manufacturing resurgence should continue to underpin M&A activity and sustain the high levels of margin debt. Both of these factors suggest that AMCB profit drivers are accelerating and will likely serve as a catalyst to unlock excellent value in this still unloved financials sub-group (middle panel, Chart 14). Chart 13Increasing AUMs... Chart 14...And Rising Animal Spirits Are Bullish For AMCB Adding it up, the still undervalued AMCB index has sizable catch-up potential, especially if the equity risk premium (ERP) continues to narrow in the coming quarters, as we expect (ERP shown inverted, bottom panel, Chart 14). Bottom Line: The S&P AMCB index remains a high-conviction overweight. The ticker symbols for the stocks in this index are: BLBG: S5AMGT-BK, BLK, STT, AMP, NTRS, TROW, BEN, IVZ, AMG. Anastasios Avgeriou, Vice President U.S. Equity Strategy & Global Alpha Sector Strategy anastasios@bcaresearch.com 1 Please see BCA U.S. Equity Strategy Weekly Report,"Dollar The Great Reflator" dated September 18, 2017, available at uses.bcaresearch.com. 2 Please see BCA U.S. Equity Strategy Weekly Report,"SPX 3,000?" dated July 10, 2017, available at uses.bcaresearch.com. 3 Please see BCA U.S. Bond Strategy Weekly Report,"Living With The Carry Trade" dated October 17, 2017, available at usbs.bcaresearch.com. Current Recommendations Current Trades Size And Style Views Favor small over large caps and stay neutral growth over value.
Overweight - High-Conviction The S&P asset management and custody banks (AMCB) index has outperformed both the S&P 500 and the broad financials index since we lifted it to a high-conviction overweight in mid-February. The tight correlation between Treasury yields and relative share prices explain a large part of the outperformance (top panel). Given BCA's underweight duration bond view, we still think the outperformance phase is in early days. Historically, the index has also been positively correlated with both the stock-to-bond ratio and the equity risk premium, but has deviated significantly from both in the last four years (second and third panels). The index has also diverged negatively from its own earnings profile, creating a persistent state of undervaluation since 2015. Even modest mean reversion in any of these measures implies substantial outperformance as animal spirits remain upbeat. Bottom Line: The undervalued S&P AMCB index has significant catch-up potential with earnings momentum pointing in the right direction. Stay overweight. The ticker symbols for the stocks in the S&P asset manager & custody banks index are: BLBG: S5AMGT-BK, BLK, STT, AMP, NTRS, TROW, BEN, IVZ, AMG.
The financial sector is regaining some momentum after this year's consolidation, and the S&P asset management and custody bank (AMCB) index has the potential to take a leadership role. AMCB remains one of the most undervalued of all the financial sector groups, even though its main profit drivers are experiencing a synchronized improvement. There is a budding shift from bond to equity products, which should gather steam based on the steady improvement in global economic sentiment, as measured by the stock-to-bond ratio (second panel). The latter is already supporting strong M&A activity and a surge in margin debt to new highs. Both of these factors suggest that AMCB earnings drivers are accelerating. The bottom line is that the undervalued AMCB index has significant catch-up potential, especially if interest rate expectations stabilize near current levels. Stay overweight. The ticker symbols for the stocks in the S&P asset manager & custody banks index are: BLBG: S5AMGT-BK, BLK, STT, AMP, NTRS, TROW, BEN, IVZ, AMG.
Highlights Portfolio Strategy Add the S&P asset manager & custody banks index to the high-conviction overweight list. Prospects for higher interest rates bode well for a catch up phase with the rest of the financials sector. Initiate a long S&P consumer staples/short S&P technology pair trade, a truly out of consensus call. Housing-related equities are likely to gain ground as housing activity should stay resilient amidst rising borrowing costs. Recent Changes S&P Asset Managers & Custody Banks - Added to our high-conviction overweight list on February 16th. Long S&P Consumer Staples/Short S&P Technology - Initiate this pair trade today. Table 1Sector Performance Returns (%) Feature Momentum continues to drive the broad market trend. The drag from a reduction in global liquidity courtesy of depleting foreign exchange reserves continues to be overwhelmed by economic optimism. The latter is fueling a major rotation from bonds to stocks, which is the dominant market force. Valuations have taken a backseat, emblematic of blow-off phases. Two weeks ago we introduced our Complacency-Anxiety Indicator, which hit a new high. Another way to measure greed overwhelming fear is the relentless rise of the forward P/E over the VIX. The spread between these two measures can also gauge complacency. This Indicator has also soared to an all-time high (Chart 1). Chart 2 applies this methodology for the broad S&P sectors, using forward P/E and implied equity volatility, and then standardizes the result to remove biases from perennially low and high P/E sectors. A low reading suggests lower risk, and vice versa. Chart 1Buy At Your Own Risk Chart 2Sector Vulnerabilities And Opportunities At the moment, financials, telecom, utilities, REITs and health care have the lowest implicit vulnerability, while cyclical sectors carry the most risk. How long can this overshoot phase last? There are obviously no easy answers. However, from a purely technical perspective and in the absence of any major monetary, economic and/or geopolitical shocks, an examination of our Composite Technical Indicator (CTI) suggests some running room remains. Our CTI is driven primarily by momentum components. Overbought conditions are signaled once it hits one standard deviation above the mean. Currently, the TI remains slightly below this threshold (Chart 3). Even then, it can cross decisively into the danger zone before the S&P 500 eventually sells off in a meaningful fashion. Chart 3Overbought Conditions Can Persist Importantly, when the CTI swings quickly from deeply oversold to overbought levels, there can be a multi month lead before the broad market crests or suffers a sustained setback (Chart 3), and the bulk of those moves are associated with economic recessions and/or growth disappointments. The implication is that even though extended broad market valuations virtually guarantee paltry long-term returns and economic expectations are now sky-high, technical conditions suggest that momentum may continue to carry the day for a while longer. That does not mean investors should abandon a largely defensive portfolio structure, given that this is where the reward/risk tradeoff is most attractive and timing corrections is inherently difficult. Two weeks ago we recommended buying both gold and packaging stocks. As part of our ongoing rebalancing, this week we are further tweaking our portfolio. We recommend a pair trade to position for the inevitable sub-surface mean reversion heralded by our Indicators in the coming 3-6 months. Asset Managers: Shifting To High-Conviction Status The interest rate and market-sensitive S&P asset managers & custody banks index (AMCB) has lagged most other financials sub-indexes at a time when macro forces are lining up bullishly, particularly in view of the sector's attractive ranking on a forward P/E to volatility basis. While the capital markets and banks groups are seen as having higher torque to these positive forces, these three groups tend to move together. Lately, a divergence has opened, but a number of factors point to an imminent AMCB catch up phase (Chart 4), especially given that AMCB is not levered to overall credit growth, which has dried up. Fed Chair Yellen's testimony last week was interpreted to be slightly more on the hawkish side. That, coupled with the recent upside surprise in core inflation, raises the possibility of more 2017 tightening than currently discounted. That would provide further relief for custody banks, as ultra-low interest rates have been an anchor on this group's profitability as fees earned on funds held in trust have been minimal. The increase in short-term Treasury yields heralds a share price rally (Chart 5, top panel). Chart 4Catch Up Ahead Chart 5Time To Rally Moreover, the boost in economic expectations signals scope for an increase in fee generating activity, such as M&A, stock issuance and even stock lending. BCA's Global Economic Sentiment Index also indicates that the share price ratio has undershot (Chart 5). Most importantly, the asset preference shift from bonds to stocks reverses another major drag on profitability (Chart 5, third panel). Fixed income products carry lower margins than equity products, so as equity assets under management grow, profit margins should expand. If so, then we would anticipate a relative valuation re-rating, especially if the pace and scale of financial sector deregulation disappoints. The latter has been a key factor propelling capital markets and banks, and any disappointment could cause a capital rotation into the lagging AMCB index. Bottom Line: We are already overweight the S&P asset management & custody banks index, and added it to our high-conviction list in a daily Sector Insight on February 16th. New Pair Trade This week we are recommending what can be considered a highly contrarian pair trade: long the S&P consumer staples sector and short the S&P technology sector. It may be difficult to swallow executing such a non-consensus position while the broad market is going gangbusters. However, the objective message from our Indicators and increasing odds of a vicious, un-telegraphed correction, argue that the reward/risk trade-off is too attractive to ignore. As outlined in last week's Cyclical Indicator Update, the technology sector's relative earnings profile has deteriorated, because the corporate sector is not spending much yet and tech companies have suffered a serious loss of pricing power. Conversely, the consumer staples sector has a better chance of earnings outperformance, according to our model (Chart 6). Both sectors appear to have discounted the opposite outcome. Moreover, from a technical perspective, tech stocks are overbought and consumer staples are extremely oversold (Chart 6). Even a simple technical/momentum renormalization would imply a sharp jump in the share price ratio. Both sectors lose competitiveness when the U.S. dollar rise, but given that the technology sector's share of foreign sales (58%) is much higher than that of consumer staples (28%), the pain is disproportional. Importantly, consumer staples exports are accelerating, whereas tech exports are shrinking (Chart 7). Chart 6Contrasting Profiles Chart 7The Strong Dollar Is Worse For Tech Non-durable consumer goods are less sensitive to emerging market prospects, and thus when their currencies weaken, momentum in the consumer staples/tech share price ratio tends to accelerate (EM currencies shown inverted and advanced, bottom panel, Chart 7). Moreover, a strong U.S. dollar tends to reduce input costs for many consumer staples vendors, both through lower commodity prices and a reduced cost of imported goods sold. We have shown that tech stocks fare poorly toward the latter stages of a U.S. dollar bull market, when consumer staples start to shine. This dynamic reflects the economic fallout abroad from a strong U.S. dollar, particularly on developing economies, as well as the drag on U.S. corporate profits, and by extension, capital spending. While the U.S. dollar and stocks have risen in tandem in recent months, that cannot continue indefinitely, and when the correlation breaks down, the defensive consumer staples sector should outperform. In terms of economic dynamics, this share price ratio tends to accelerate when consumer spending outperforms capital spending. Consumer confidence is outpacing business confidence (Chart 8, top panel), signaling such an environment ahead. That sentiment mismatch has already translated into faster consumption than business investment on tech goods (Chart 8, second panel). Unless the gap between the return on and cost of capital reverses course and widens anew, then this trend is likely to persist. As a result, the surge in consumer staples vs. technology pricing power will continue, ultimately flattering the share price ratio through relative profit performance (Chart 8, bottom panel). The message is that consumer staples profits can have the upper hand over tech even when overall GDP growth is positive, provided the underlying driver is consumption rather than capital spending. From an external standpoint, it is notable that consumer staples have a better track record than tech stocks during inflationary periods. Chart 9 shows that the uptrend in long-term inflation expectations and increase in actual inflation both forecast a revival in this pair trade. Chart 8Unsustainable Divergences Chart 9Inflation Pressures? Buy This Ratio Rising inflation ultimately heralds tighter monetary policy, which is a precursor to elevated broad market volatility and a rise in the discount rate, to the detriment of long duration sectors. History shows that the high priced tech sector is more vulnerable than the safe haven staples sector in such an environment. In sum, the time is ripe for a contrary pair trade favoring consumer staples vs. technology. Notable risks to this trade are that the U.S. dollar weakens meaningfully and/or global capital spending re-accelerates decisively, relative to consumer spending. Bottom Line: We recommend a market neutral long consumer staples/short technology pair trade. The time horizon for this trade is 3-6 months. Will Housing Stocks Go Through The Roof? Housing-related stocks have delivered positive earnings surprises, but anxiety about rising mortgage rates challenges the outlook. While the latter is a risk, cheap valuations and consumers' underappreciated ability to absorb rising borrowing costs offset these concerns. Sensitivity analysis shows that even a 200 basis point (bps) spike in interest rates from current levels would fail to push housing affordability back to the long-term average (Chart 10). Moreover, mortgage payments as a percentage of incomes and effective borrowing costs would also remain below their respective historic means even with such a spike. Importantly, housing market fundamentals are improving. Lumber prices are on fire. Lumber has been the best performing commodity year-to-date. This is a real time indicator of housing demand (Chart 11). Similarly, railroad carloads of lumber are also firming, signaling that the price rise is demand-driven rather than a speculative bet in the trading pits. Sustained house price inflation, solid housing turnover and the acceleration in building permits reinforce that housing activity remains robust (Chart 11). Chart 10Higher Rates Are Not A Show Stopper Chart 11Lumber Strength Is Housing Bullish The credit tap to sustain strong activity is still open. According to the latest Fed Senior Bank Loan Officer Survey, banks are willing and able to extend residential mortgage credit (bottom panel, Chart 11). This contrasts with many other credit categories, where banks are tightening the screws and credit demand is faltering: C&I loans have shrunk over the past three months, as has total bank credit. First time home buyers are also reappearing and anecdotes of increased house flipping activity signal a vibrant market with unobstructed access to credit. All of this should continue to support earnings-led outperformance from both homebuilders and home improvement retailers (HIR). The bullish outlook for the S&P homebuilding index rests on four pillars. The latest National Association of Home Builders (NAHB) survey revealed that sales expectations remain over 20 points above the boom/bust line and just shy of recent cyclical highs (Chart 12). Homebuilders are clearly still seeing strong traffic. New home prices are still expanding at a healthy clip (Chart 12). Sales growth and new home price inflation are tightly linked. The mortgage application purchase index has picked up steam despite the mortgage rate increase, confirming that first time homebuyers are entering the market after a long hiatus as the financial motivation to buy vs. rent has improved. This optimism is causing an aggressive re-rating in earnings estimates from chronically bearish levels (Chart 12), a harbinger of further gains in relative share prices. The S&P HIR index also has a concrete foundation. Higher lumber prices flow straight to the bottom line, because HIR companies typically earn a set margin on lumber-related sales. Moreover, higher housing turnover is a boon for industry sales volumes (Chart 13). Historically, home sales momentum has been an excellent leading indicator of renovation activity. Chart 12Buy Homebuilders... Chart 13... And Building Supply Retailers Encouragingly, the NAHB remodeling survey is still in expansion territory, and tends to follow the trend in home sales, underscoring that home renovation activity is set to improve (Chart 13). Our HIR model encapsulates many of these key drivers, and has climbed anew (Chart 13). The message is that profits, and share prices, are on track to outperform. Adding it all up, the housing backdrop remains attractive, and even a steady increase in borrowing costs should not disrupt momentum. The time to become concerned will be if inflation becomes a serious risk, causing the Fed to get 'tight' and credit availability to dry up. The next few interest rate hikes won't move the monetary settings to that phase yet. Until then, we recommend erring on the bullish side. Bottom Line: We reiterate our high-conviction overweight in the S&P home improvement retail index (HD, LOW) and continue to recommend an above benchmark allocation in the S&P homebuilding index (PHM, DHI, LEN). Current Recommendations Current Trades Size And Style Views Favor small over large caps. Favor growth over value (downgrade alert).
The S&P asset manager and custody bank index is in a prime position for a catch up rally. This interest rate and market-sensitive financial sector group has lagged most others at a time when macro forces are lining up bullishly. Fed Chair Yellen slightly more hawkish commentary this week raised the possibility of an earlier than expected interest rate hike. That would provide further relief for custody banks, as ultra-low interest rates have been an anchor on profitability. Moreover, the boost in global economic sentiment indicates increased scope for fee generating activity, such as M&A, issuance and even stock lending. Most importantly, the asset preference shift from bonds-to-stocks represents a potential boost to profit margins (bottom panel), which would warrant a valuation re-rating. We are already overweight, and are adding this group to our high-conviction list today. The ticker symbols for the stocks in this index are: BLBG: S5AMCB - BK, BLK, STT, AMP, NTRS, TROW, BEN, IVZ, AMG.
After the Trump election victory, we immediately upgraded our financial sector view to neutral to protect against the benefit of rising interest rates and the potential for a clear asset preference shift in favor of stocks over bonds. Trump's inflationist policy rumblings have kickstarted a steep advance in the total return of equity vs. bonds (E/B). BCA's strategists believe that this trend has long-term staying power. The E/B ratio has an excellent track record in heralding the relative performance of the S&P asset manager & custody bank (AMCB) index. If investors shift assets from bond products and into equity mutual funds and ETFs, from the current extremely depressed skew (bottom panel), then there is scope for cyclical profit margin upside at asset management firms. Current valuations do not fully discount such a shift, and we recommend an overweight position in the S&P AMCB index. The ticker symbols for the stocks in this index are: BLBG: S5AMGT - BK, BLK, STT, TROW, AMP, NTRS, BEN, IVZ, AMG.