Sorry, you need to enable JavaScript to visit this website.
Saltar al contenido principal

Government

China’s November PMIs were mixed, and reflected very low growth. The official composite PMI was unchanged at 50.8, driven by a small uptick in manufacturing to 50.3 and a small downtick of services to 50. The Caixin manufacturing PMI jumped to 51.5 from 50.3.…

The post-COVID recovery has been one of excesses. Government deficits have ballooned, tight labor markets have led to a windfall of consumer spending, and equity valuations have soared on the back of lofty growth expectations. But these excesses will no longer be sustainable in 2025. Our theme for next year is Thin Is Back In. Government budgets, economic growth, and equity valuations will be leaner than investors expect. We discuss this the reasoning behind this macro view and the asset allocation implications that follow from it.

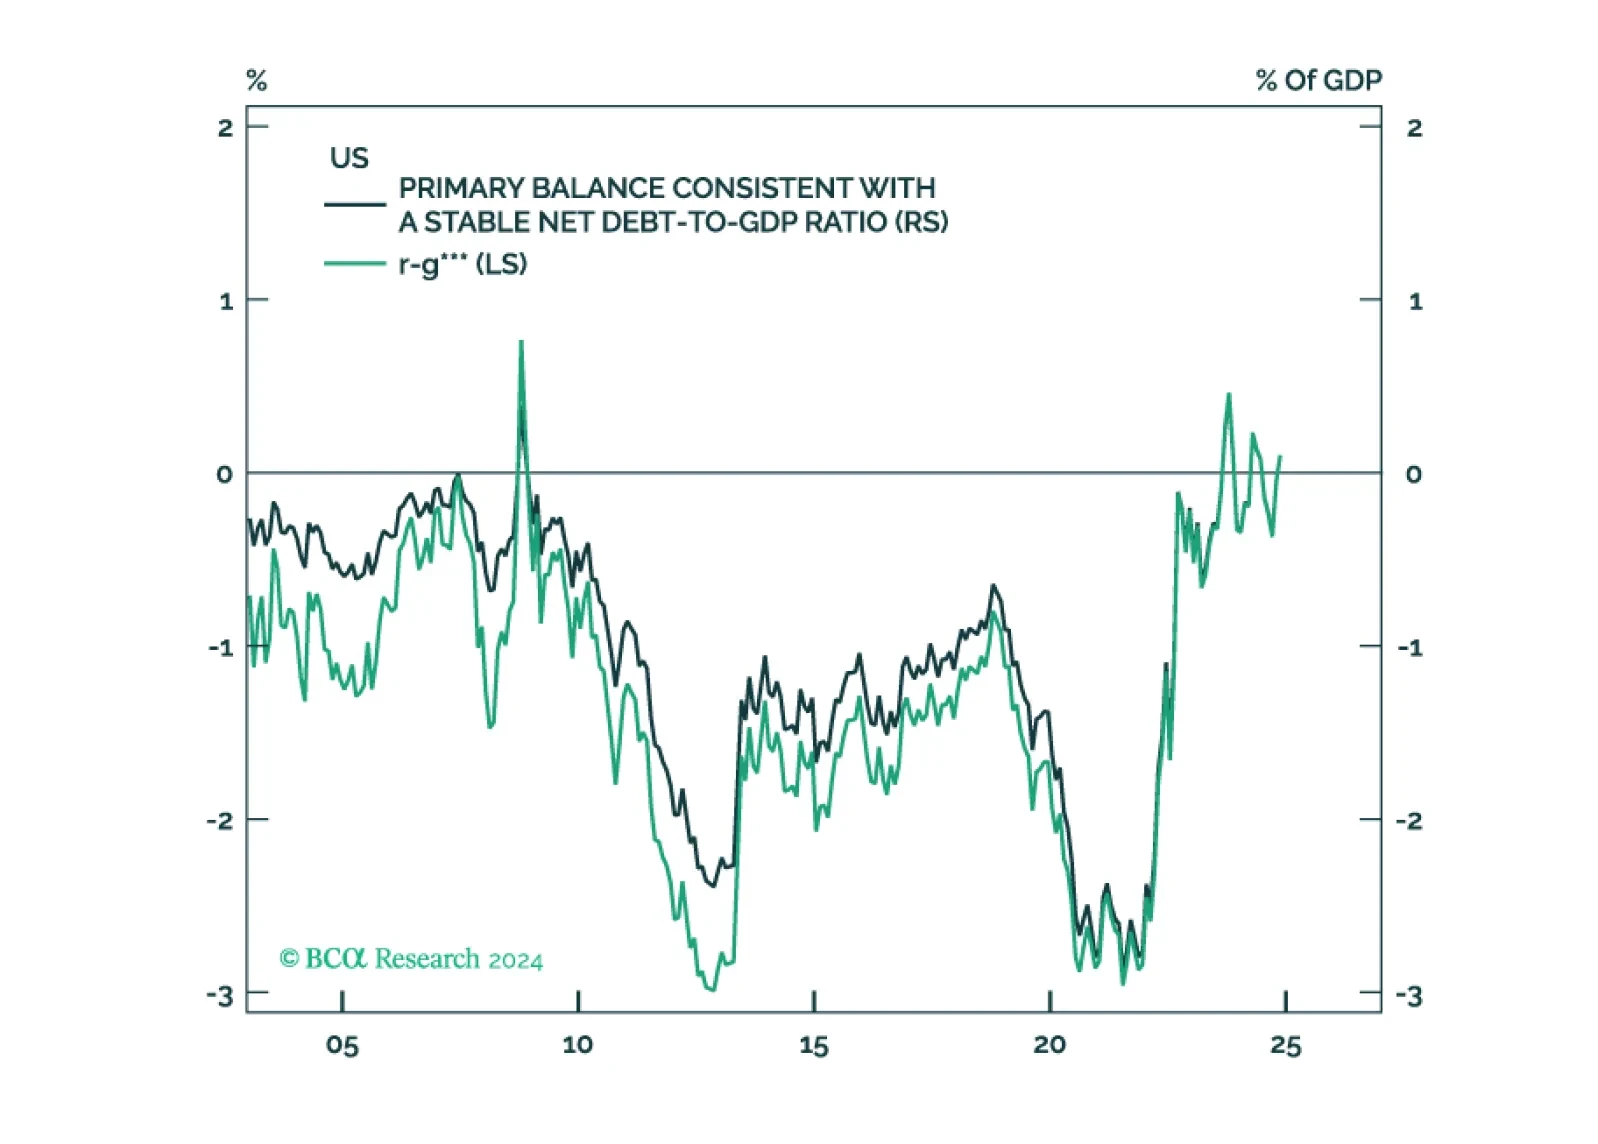
Executive Summary The US Needs To Reduce Its Primary Budget Deficit By Nearly 4% Of GDP To Stabilize Debt Rising government debt in the US has heightened the risk of a fiscal crisis. If interest rates stay where they are, the US primary budget balance would need to improve by nearly 4% of GDP to stabilize the debt-to-GDP ratio.The good news is that bond yields would probably fall if the US government were to bring down the budget deficit, thus allowing for a somewhat smaller fiscal adjustment. The bad news is that many of Trump’s stated policies would lead to larger, not smaller, deficits.That said, interest rates are much higher now than during Trump’s first term. This means that Trump may need to rely more on tariff revenue than investors are currently expecting.He may also allow Republicans in Congress to repeal large parts of the Inflation Reduction Act (IRA), while permitting sharp cuts to social spending.Social spending has a bigger fiscal multiplier than corporate tax cuts. Consequently, even if the federal budget deficit were to rise over the next few years, aggregate demand could still weaken in response to shifts in fiscal policy. With state spending already set to decline, bond yields would probably fall.While government debt is very high in Japan, interest rates remain below nominal GDP growth, which reduces the odds of a crisis. In China, the challenge is to shift the debt burden from local governments to the central government. In peripheral Europe, debt-to-GDP ratios have declined over the past few years but remain dangerously elevated.Bottom Line: Higher interest rates will increase the pressure on governments to trim deficits. In the US, the Trump administration will rely on tariffs to partially pay for tax cuts, while also delivering deeper-than-expected social spending cuts. This will result in lower bond yields over time.The Fundamental Equation of Debt SustainabilityOver the past few decades, most major economies have responded to macroeconomic shocks by easing fiscal policy. In the US, the shift towards bigger budget deficits was exacerbated by a series of tax cuts – such as those in 2001, 2003, and 2017 – which were not offset by lower spending. As a result, government debt stands near historic highs in most economies (Chart 1). Chart 1AGovernment Debt Is Near Historically High Levels In Many Developed Economies (I)  Chart 1BGovernment Debt Is Near Historically High Levels In Many Developed Economies (II) How significant are the risks of a major fiscal crisis in the US and elsewhere?To address this question, it is useful to start with the fundamental equation of debt sustainability, which specifies the value of the primary balance (the budget balance excluding interest payments) that is consistent with a stable debt-to-GDP ratio (see Appendix A for a derivation):  Where p is the primary budget balance, expressed as a share of GDP; r is the real interest rate; and g is the growth rate of the economy.The US: An Unsustainable Fiscal Outlook Chart 2The US Needs To Reduce Its Primary Budget Deficit By Nearly 4% Of GDP To Stabilize Debt Given that US real bond yields are approximately equal to trend growth, the US would need a primary budget balance of close to zero to stabilize the debt-to-GDP ratio (Chart 2). The Congressional Budget Office (CBO) estimates that the primary budget deficit will be 3.9% of GDP in 2024. This implies that fiscal consolidation of nearly 4% of GDP is required to put government debt on a sustainable trajectory.The good news is that bond yields would probably fall if the government sought to bring down the deficit. If the 10-year TIPS yield were to drop to 1% from its current level of around 2%, 2.9% of GDP in fiscal tightening would be necessary to stabilize the debt-to-GDP ratio.The bad news is that most of Trump’s stated policies would lead to larger, not smaller, deficits. According to the non-partisan Committee for a Responsible Federal Budget, Trump’s proposed spending and revenue measures would raise federal debt by an additional $7.75 trillion over the next 10 years in a central scenario (Table 1). This would cause the debt-to-GDP ratio to rise to 143% of GDP by 2035 – a 44 percentage-point increase from current levels (Chart 3).Why Fiscal Consolidation May Happen, Even Under TrumpGiven what transpired under Trump’s first term, it is understandable that most investors expect the federal budget deficit to only widen further over the coming years. However, there is an important limiting factor to higher budget deficits that was not present during Trump’s first term in office: The 10-year TIPS yield was close to zero when he assumed the presidency in early 2017, and then fell into negative territory once the pandemic began. Back then, the market simply did not care about large budget deficits.This is not the case anymore. Net interest payments on federal government debt have risen from 1.3% of GDP in 2016 to 3.1% of GDP as of 2024. Even under current policy – which unrealistically assumes the personal tax cuts in the Tax Cuts & Jobs Act (TCJA) will sunset at the end of 2025 – interest costs are projected to swell to 4.1% of GDP in 2034, equal to 23% of all government revenue (Chart 4).Table 1Trump's Proposed Fiscal Policies Would Increase The Budget Deficit Chart 3Federal Debt Would Continue To Surge Under Trump's Proposed Policies  Chart 4Rising Interest Payments Will Force Fiscal Austerity  Chart 5Little Evidence So Far That Productivity Growth Has Shifted Into Higher Gear Faster Productivity Growth? Hopefully, But Don’t Bet on It Chart 6Capital Spending Remains Downbeat The US could get lucky and experience much faster productivity growth. As the fundamental equation of debt sustainability highlights, this would allow for a larger budget deficit.Unfortunately, there is little evidence so far that productivity growth has shifted into higher gear. While the productivity numbers have improved somewhat over the past few quarters, this follows a period where output-per-hour shrank outright. Averaging the productivity numbers since the start of the decade, we are still close to the pre-pandemic trend (Chart 5).Meanwhile, key drivers of productivity growth, such as capital spending, remain downbeat (Chart 6).In any case, economic theory suggests that faster productivity growth should raise the rate of return on capital. Increased competition for private-sector savings should, in turn, push up the interest rate at which the government borrows. As per the debt sustainability equation, this would necessitate a higher primary budget balance. Yield Curve Control Is Not As Easy As It SeemsOne possible strategy to keep interest costs down, while still running large budget deficits, is for the Fed to purchase bonds which trade above a certain prespecified yield. This is exactly what the Bank of Japan did with its Yield Curve Control (YCC) policy.Let us put aside the issue of the Fed’s independence. In the unlikely case that the Fed could be cajoled into pursuing such a scheme, it would still run into a major problem: inflation.The Bank of Japan was able to cap yields because the economy was suffering from deflation. Even in the absence of the rate cap, yields would probably not have risen very much.If the Fed were to try to cap yields – effectively monetizing government debt – inflation expectations would rise. Higher inflation expectations would push down real yields, increasing the incentive for firms to borrow and for households to spend more in advance of higher prices. Such a dynamic would cause the economy to overheat, leading to even higher inflation expectations.As the last few years have demonstrated, inflation is very unpopular. Whereas higher unemployment mainly hurts those who lose their jobs, inflation hurts everyone. Thus, pursuing any strategy that produced higher inflation would be political suicide.The Multiplier-Weighted Fiscal Thrust Will Probably Be Negative Next YearIt is highly likely that the Trump administration will push through a full extension of the TJCA. However, this will just maintain the status quo. It will not represent new stimulus. Chart 7Manufacturing Construction May Be Peaking Additional stimulus could come in the form of eliminating taxes on tips, which was one of Trump’s signature campaign promises. Such a move would reduce revenue by a relatively modest $300 billion over 10 years. Exempting overtime income and social security benefits from taxation would be much more costly – worth a combined $3.3 trillion over 10 years. However, Trump did not emphasize these measures very heavily on the campaign trail and so they will probably be dropped.Trump did mention cutting the corporate tax rate further from 21% to 15%. However, such a step may run afoul with populists in the Republican Party and their derision for “woke capital.” Trump himself mused earlier in the campaign that he would be content to just cut the corporate tax rate to 20% (a “nice round figure” as he called it).On the flipside, Trump could increase tariffs significantly, raising $2-to-$4.3 trillion over 10 years. Contrary to Trump’s claims, tariffs would be a regressive tax on households. Moreover, to the extent that half of global trade is in intermediate goods, higher tariffs would effectively boost taxes on businesses.In order to keep bond yields from rising further, Trump may let the Republicans in Congress take an ax to government spending. This could mean repealing large parts of the Inflation Reduction Act (IRA) (Chart 7). It could also mean sharp cuts to social spending. Trump’s promise this week to eliminate the Department of Education – whose $238 billion annual budget largely consists of doling out assistance to low-income students – is a good example of what may lie ahead.Social spending has a large fiscal multiplier because the poor generally spend whatever income they receive. Corporate tax cuts, in contrast, have a smaller multiplier since they disproportionately benefit highly profitable companies that are not liquidity constrained. Consequently, even if the federal fiscal deficit were to rise over the next few years, aggregate demand could still weaken in response to shifts in fiscal policy.In such a scenario, bond yields would likely decline. Lower aggregate demand would prompt the Fed to cut rates more than is currently discounted. While a larger deficit would entail more Treasury issuance, higher after-tax private-sector savings would be able to absorb most of that debt.A Word on State and Local Government SpendingMost people focus on fiscal policy at the federal level. However, it is worth remembering that state and local government spending is half as large as overall federal spending and double that of discretionary federal spending.State and local government spending jumped during the pandemic on account of the transfers that those lower levels of government received from Washington. Having spent most of the money, expenditures will decline. The Association for State Budget Officers reckons that state spending will fall by about 6% in 2025, the first annual decline since the GFC (Chart 8).Debt Sustainability Outside the USGovernment debt in Japan remains the highest in the G7. Although this debt is a source of vulnerability, it needs to be seen in the context of the debt sustainability equation discussed at the outset of this report.The 10-year Japanese government bond yield currently stands at 1.07%. This is less than nominal GDP growth, which clocked in at 2.9% year-over-year in Q3 2024. The IMF expects nominal GDP growth to average 2.8% over the next five years, which should bring net debt down from 156% of GDP to 151% of GDP (Chart 9). Chart 8State Spending Is Expected To Shrink  Chart 9If Sustained, The Recent Acceleration In Japanese Nominal GDP Growth Should Mitigate The Risks Of A Fiscal Crisis Government revenue in Japan, as a share of GDP, is the second lowest in the G7 after the US (Chart 10). The Japanese government would sooner raise taxes than allow a debt crisis.In China, debt levels are high in the corporate sector and among local governments. Household debt rose sharply in the pre-pandemic period but has been broadly flat over the past few years (Chart 11). Chart 10Japan's Government Has Room To Raise Revenue  Chart 11Breakdown Of Chinese Debt One distinguishing feature of China’s economy is that it generates large amounts of savings. The national savings rate is close to double that of most other major economies (Chart 12). The flipside of this excess savings is inadequate spending. Insufficient demand is fueling deflation, leading to anemic nominal GDP growth (Chart 13).What China ultimately needs is more spending. Unfortunately, the fiscal impulse is currently close to zero against a budgeted target of 2.2% of GDP (Chart 14). Local governments account for nearly 90% of overall government spending but have been hamstrung by falling land sales. Chart 12China Saves Too Much  Chart 13Deflation Risks Have Risen In China Efforts by the central government to replace debt issued by local government financing vehicles (LGFVs) with central government-backed liabilities are welcome. However, this may only bring spending back towards where it should have been all along. Chart 14Chinese Government Spending Is Well Below Target  Chart 15Debt-To-GDP Ratios Have Declined In Europe's Periphery Over The Past Few Years But Remain Dangerously Elevated Turning to Europe, the peripheral economies have made some progress in bringing down debt-to-GDP ratios in the aftermath of the pandemic (Chart 15). However, government debt is still very high, and in the case of Italy, the IMF expects the debt-to-GDP ratio to start rising again over the next few years. Although the ECB will take the necessary steps to preclude another crisis, peripheral Europe will need to pursue fiscal austerity for years to come.Trade UpdatesWe were stopped out of our long US health care/short S&P 500 trade, with the appointment of RFK Jr. being the coup de grâce. There is a reasonably high probability that he will not be confirmed by the Senate, so we are reinstating the trade, but this time against consumer discretionary stocks. Consumer discretionary companies are particularly vulnerable to a trade war and a potential US recession next year.Meanwhile, we are maintaining our bearish bias on stocks by being long the June 30, 2025 SPY ETF put with a strike price of $550, which has risen 25% since we initiated the position last week. Peter BerezinChief Global Strategistpeterb@bcaresearch.comPlease follow me onLinkedIn & Twitter APPENDIX AThe Arithmetic Of Debt SustainabilityGlobal Investment Strategy View MatrixThe Global Investment Strategy team (GIS) summarizes its views via a matrix featuring recommendations over a tactical 1-to-3 month horizon and a cyclical 6-to-12 month horizon. While GIS uses the MacroQuant model as one of several inputs into its decision-making process, the GIS views shown in this matrix may differ from the MacroQuant model's recommendations shown in the dedicated monthly MacroQuant reports.Special Trade Recommendations 
Informe especial

Investors are overstating the positive fiscal impact of the Trump presidency. The bond market will have something to say about the scope for further deficit expansion via tax cuts. As such, the trade after the trade of the Trump 2.0 administration may involve less growth out of the US, not more. In the interim, however, investors should continue to expect higher yields and increased equity volatility. There are plenty of risks ahead, including geopolitics, trade, and uncertainty surrounding fiscal policy.

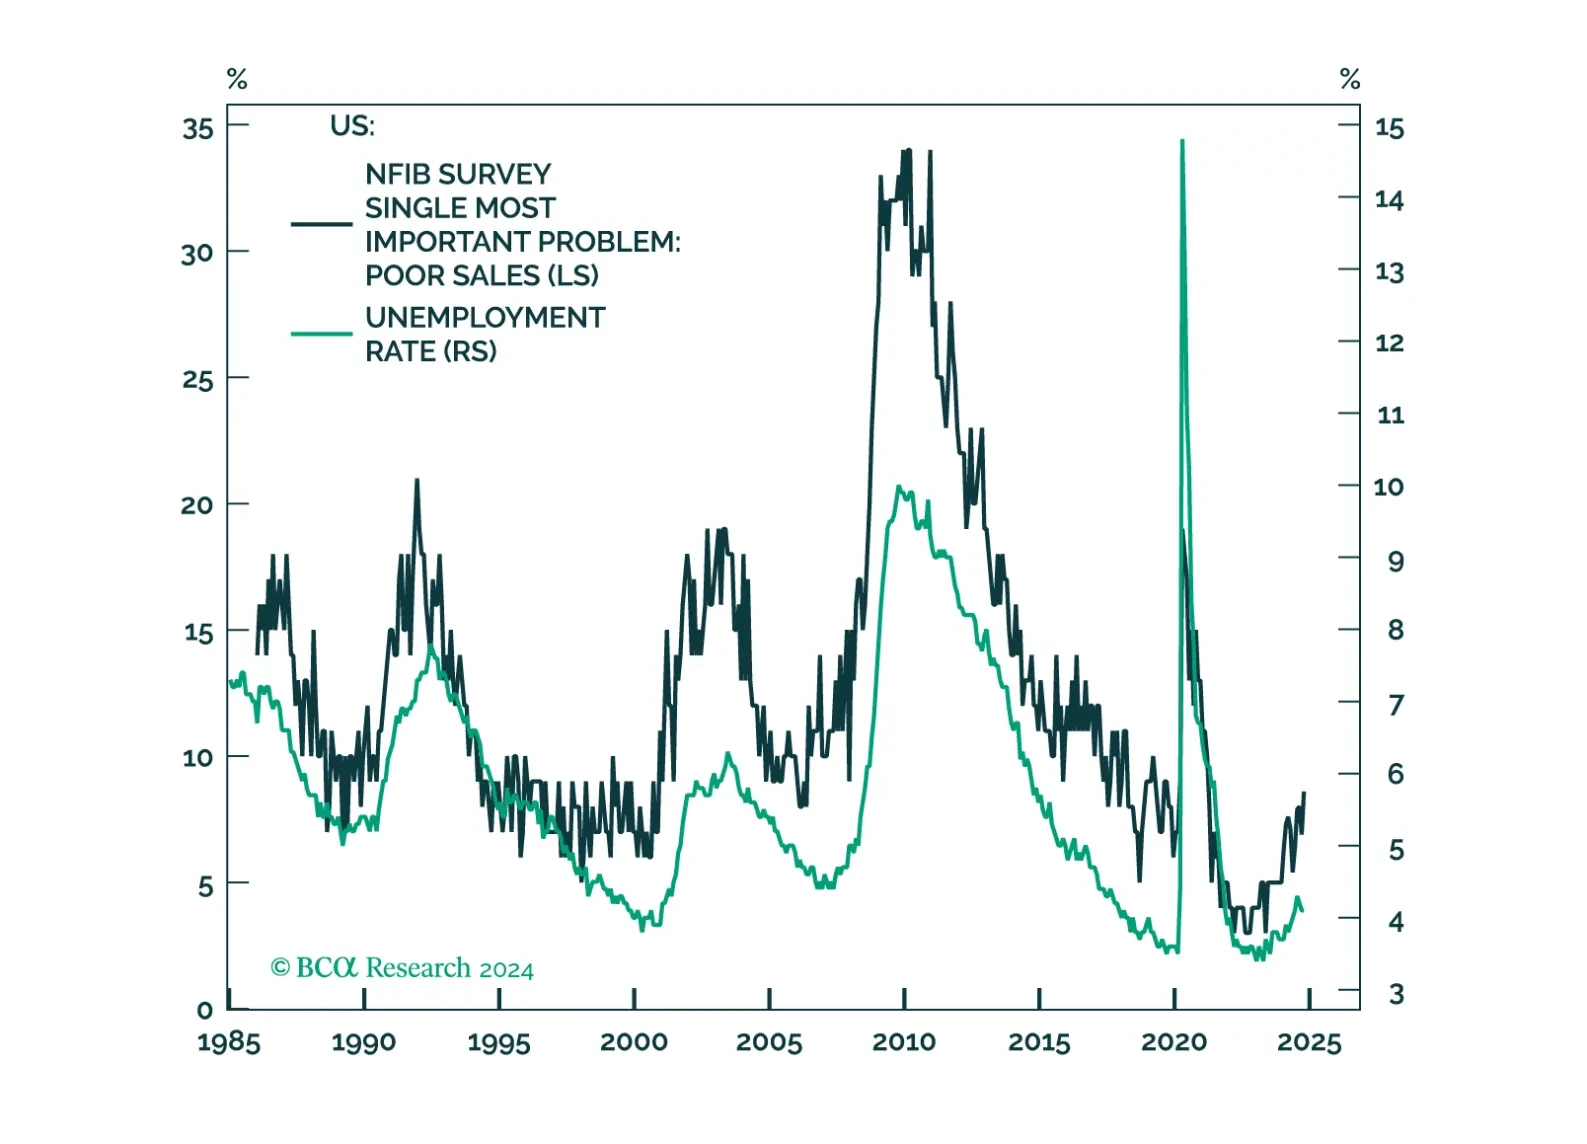
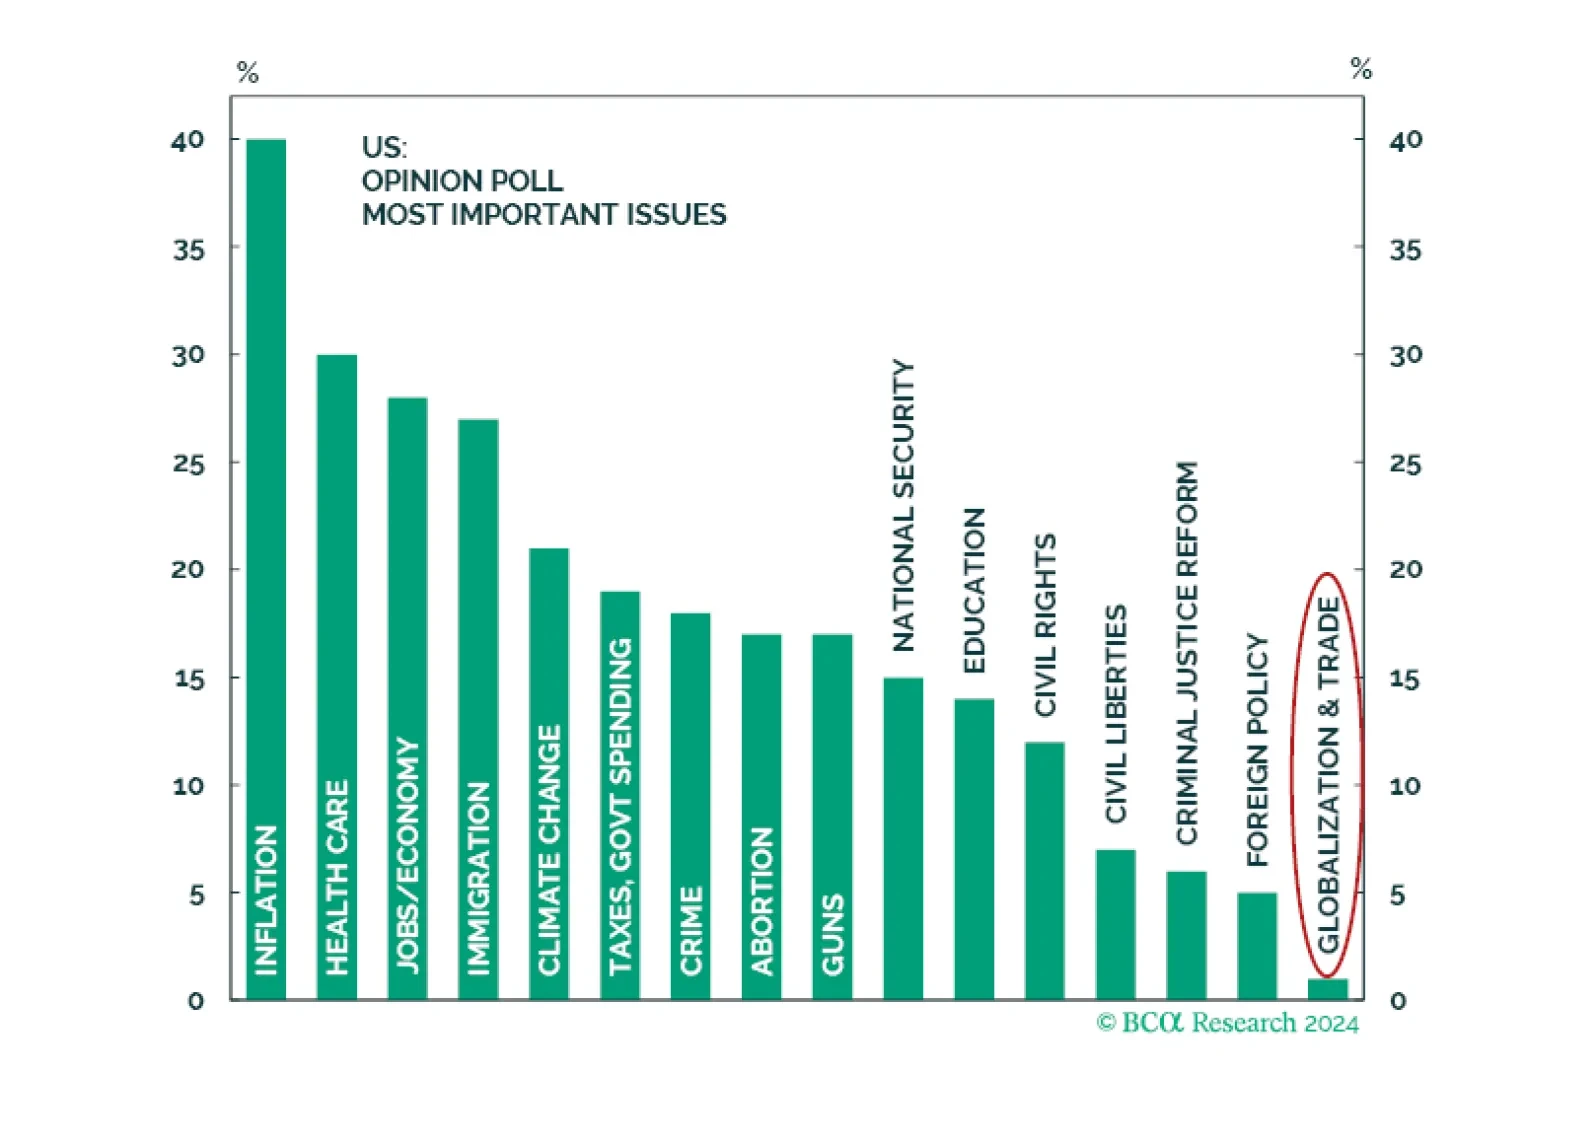
Ultimately, 2024 is not 2016 — a seemingly obvious point, but one with market relevance. In 2016, voters gave Trump a strong mandate for nominal GDP growth. It is not clear if this is the case today. Inflation is the most important issue, least relevant is trade and globalization. As such, Trump’s renewed mandate is for supply side reforms, not more populism and protectionism.

Informe especial La victoria contundente de Trump trae un mandato popular que garantiza la desregulación y aranceles comerciales más altos. Un mayor déficit presupuestario y una reforma migratoria también están en el horizonte, ya que los republicanos parecen poder lograr por poco una estrecha mayoría en la Cámara de Representantes. La política exterior se volverá más unilateral, con los activos estadounidenses rindiendo mejor al principio.
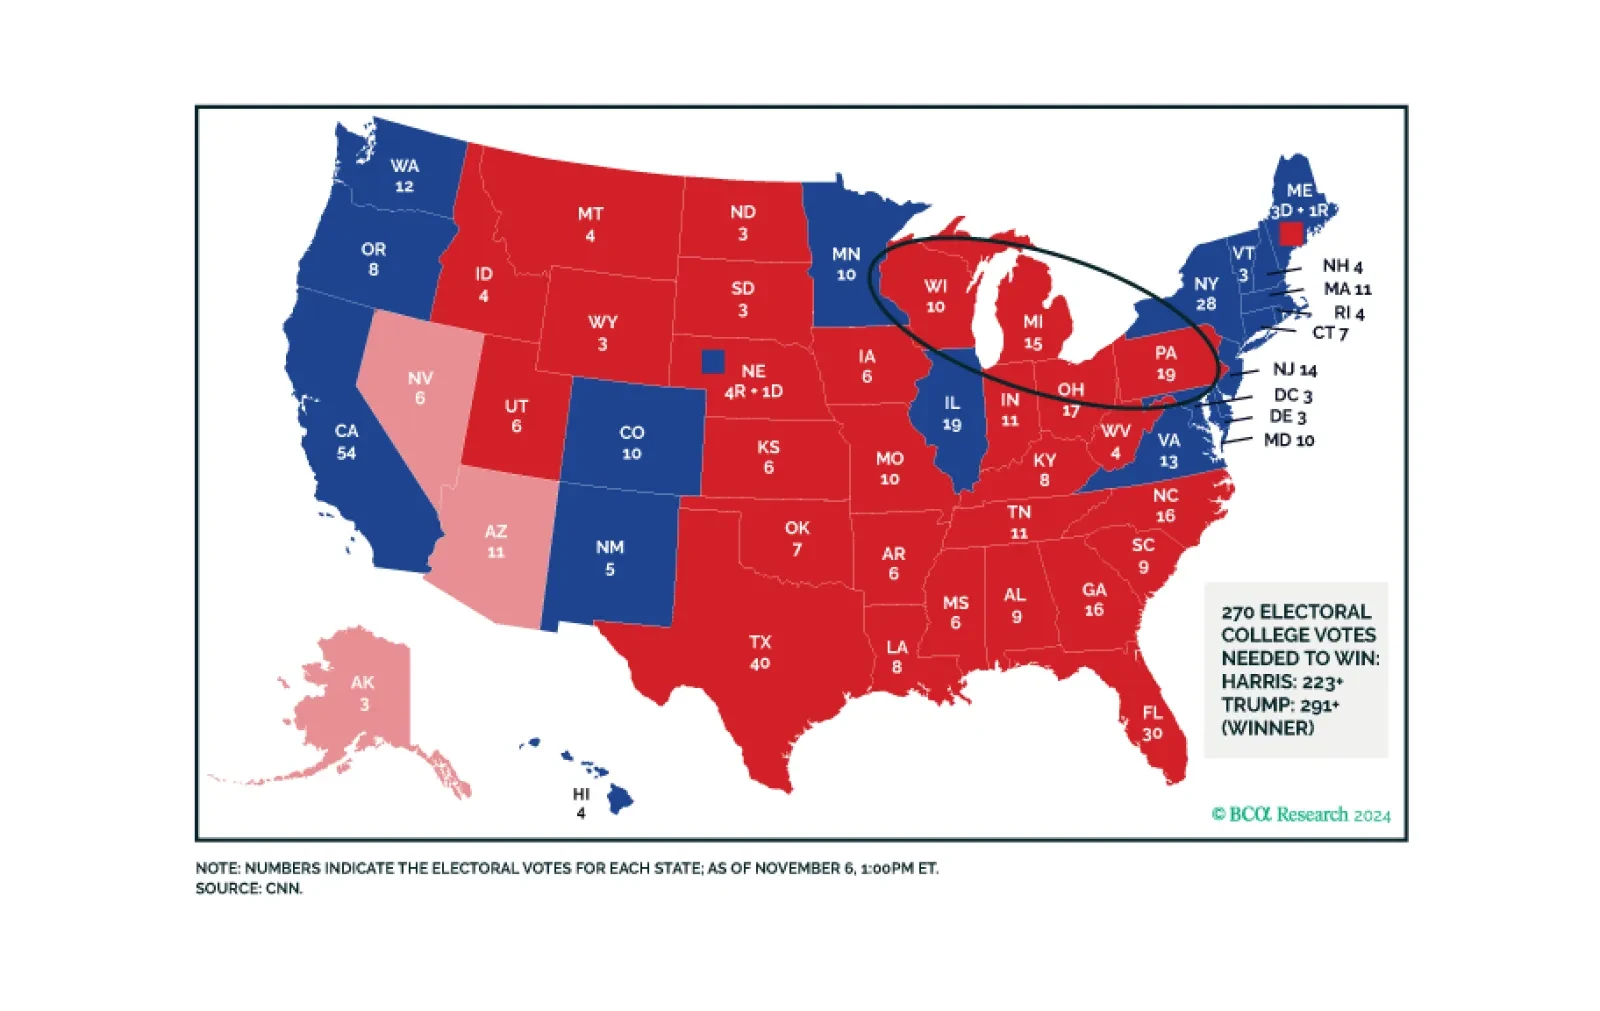
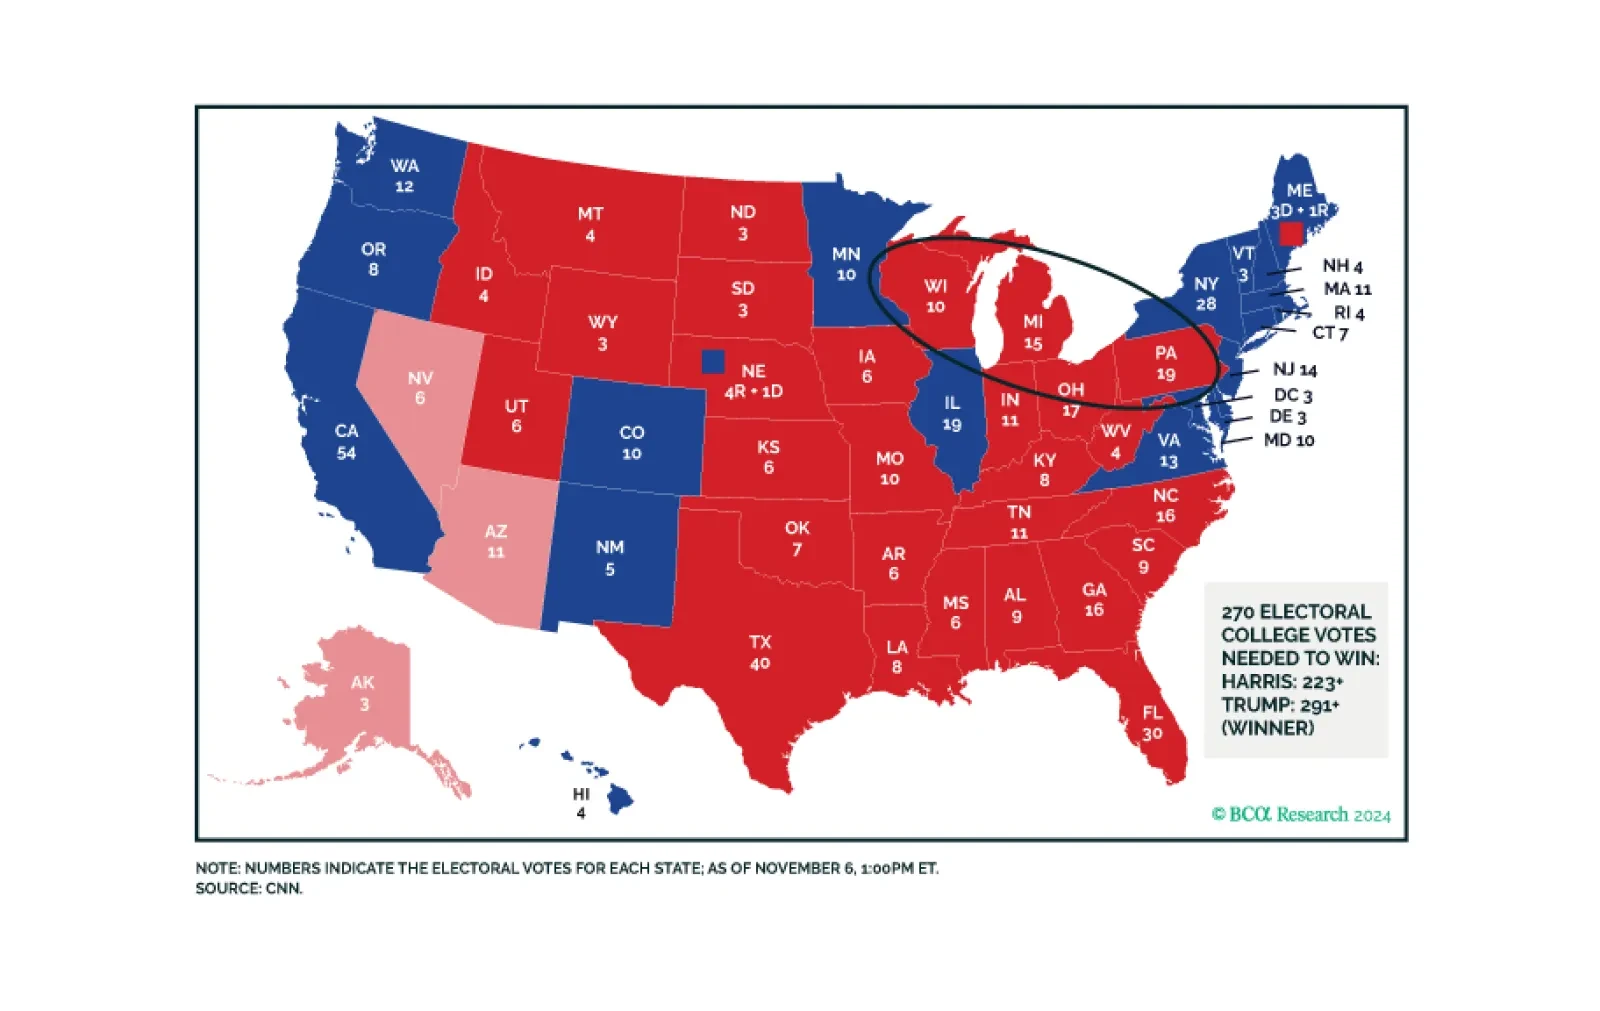
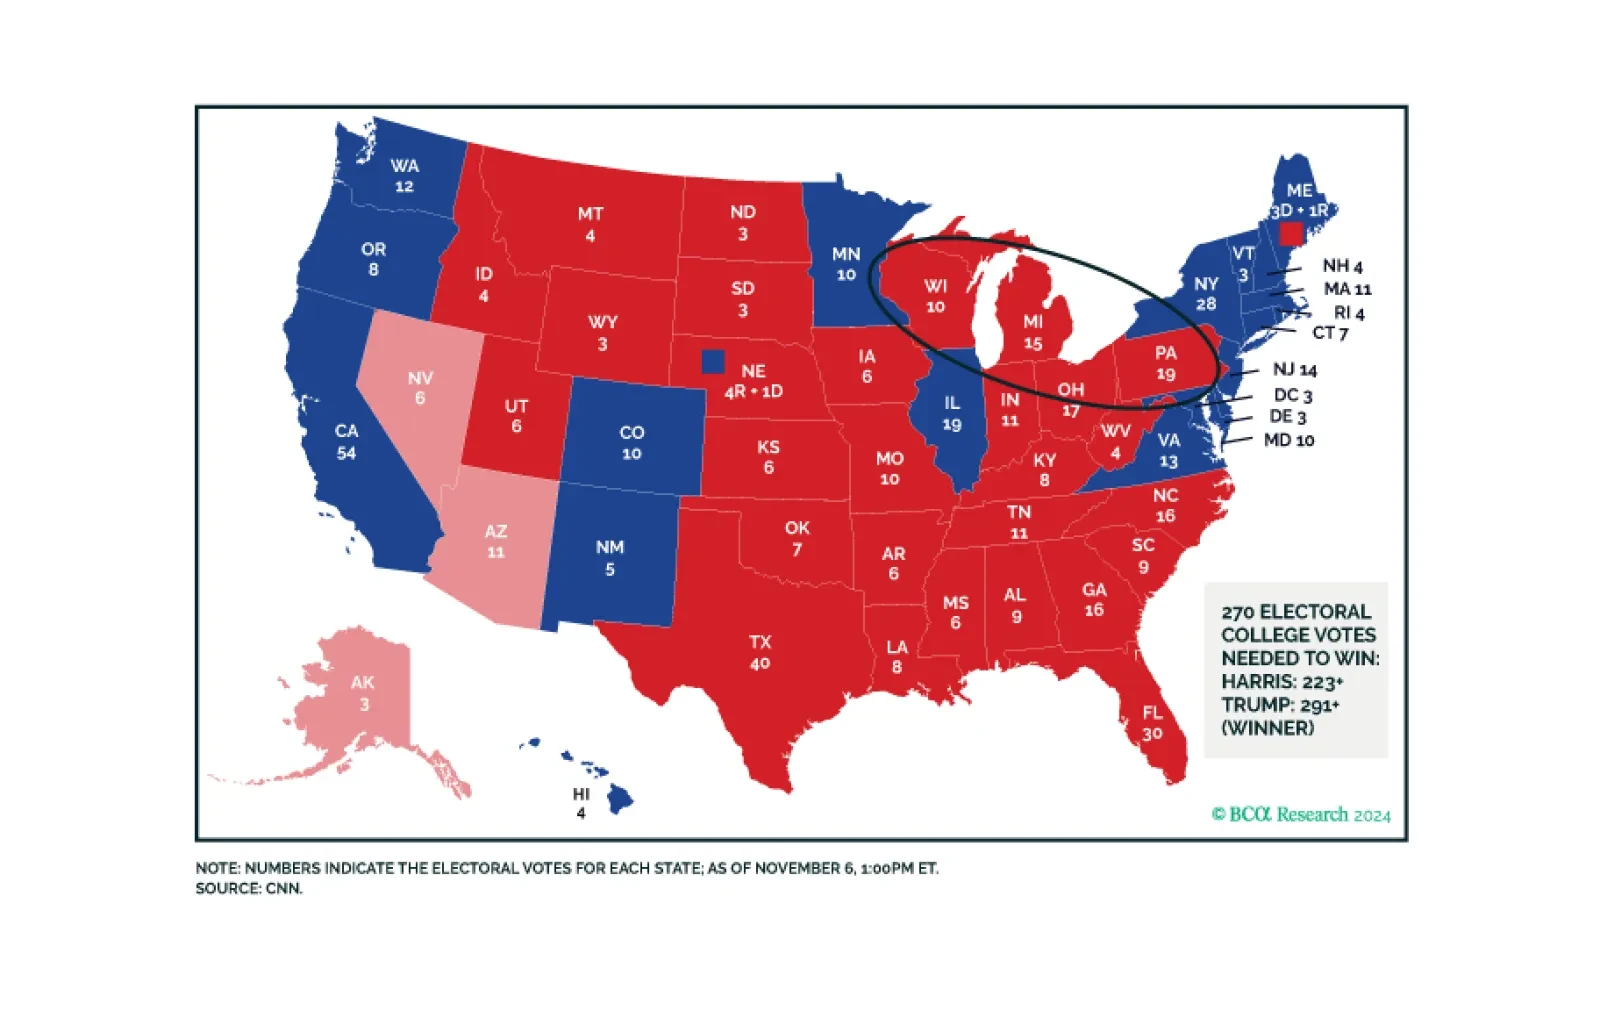
Informe especial La aplastante victoria de Trump trae un mandato popular que asegura la desregulación y aranceles comerciales más altos. También están en el horizonte un mayor déficit presupuestario y una reforma migratoria, ya que los republicanos parecen poder conseguir una mayoría ajustada en la Cámara de Representantes. La política exterior se volverá más unilateral, con los activos estadounidenses rindiendo mejor inicialmente. Los inversores deben esperar que el repunte de alivio en el mercado de valores continúe a corto plazo, pero adoptar un enfoque escéptico a medida que gane impulso, y mirar 2025 con extrema cautela. El cambio de gobierno traerá incertidumbre el próximo año, especialmente si el partido republicano sobreestimula una economía ya en pleno empleo. El histórico regreso de Trump: lo que nos llama la atención El presidente Trump ganó la Casa Blanca con el 51% del voto popular, un logro importante para un partido que con frecuencia lucha por obtener una mayoría absoluta y para un candidato por tercera vez cuya mayor participación hasta ahora había sido del 46.9%. Trump obtuvo 292 votos electorales, convirtiéndose en el primer y único presidente desde el demócrata Grover Cleveland en 1892 en ganar un segundo mandato no consecutivo. Trump no solo ganó los estados soleados, sino que también barrrió el “Muro Azul” o los estados del Rust Belt de Pensilvania, Michigan y Wisconsin, haciendo eco de su victoria de 2016 y vindicando su estrategia electoral de nacionalismo económico: es decir, apelando a la clase trabajadora y pidiendo la revivificación de la base industrial de Estados Unidos (Mapa 1). Mapa 1 Trump recupera el Muro Azul El regreso histórico de Trump: lo que nos llama la atención El regreso histórico de Trump: lo que nos llama la atención     Gráfico 1 La economía del Medio Oeste se quedó rezagada respecto al resto (otra vez) La economía del Medio Oeste quedó rezagada respecto al resto (otra vez) La economía del Medio Oeste quedó rezagada respecto al resto (otra vez)   Los republicanos ganaron el Senado con al menos 52 escaños y quizá 54 o 55. Los candidatos republicanos al Senado sorprendieron al alza en Pensilvania y Nevada, posiblemente en Michigan. Si bien el crecimiento económico nacional se mantuvo, estos estados continuaron rezagándose respecto al promedio nacional y sufrieron por la recesión manufacturera global, una situación reminiscentede a la victoria de Trump en 2016 (Gráfico 1). Estos estados vieron un retroceso del crecimiento de cara a las elecciones. La actividad estatal de Michigan ya está en contracción. Los votos para la Cámara de Representantes aún se están contando, pero los republicanos han ganado cinco escaños mientras que los demócratas solo han ganado dos. Esperamos que los republicanos obtengan una mayoría ajustada acorde con una marea roja que barrió el país. La posesión de la Cámara es extremadamente importante para el panorama político en 2025-26. La inflación más que el desempleo impulsó el voto contra el partido gobernante: es el factor único más importante detrás de la rotunda victoria republicana. El aumento acumulado del nivel general de precios desde 2021 es del 20.5%, resultando en salarios reales negativos, especialmente en los estados que Joe Biden ganó en 2020 (Gráfico 2). El 76% de los votantes dijo que la inflación causó “dificultades” y Trump ganó a más de la mitad de esos votantes: ganó el 73% de quienes dijeron que causó dificultades extremas (Gráfico 3).   Gráfico 2 Salarios reales negativos durante la mayor parte del mandato de Biden Salarios reales negativos durante la mayor parte del mandato de Biden Salarios reales negativos durante la mayor parte del mandato de Biden     Gráfico 3 La inflación, una carga, según los votantes El regreso histórico de Trump: Lo que nos llama la atención El regreso histórico de Trump: Lo que nos llama la atención   Trump ganó el 80% de quienes dijeron que la situación financiera de su hogar empeoró en los últimos cuatro años, pero no ganó entre quienes dijeron que se mantuvo igual o mejoró. Ganó el 68% de quienes dijeron que la economía estaba “no tan bien” o “mala”. Ganó el 49% de los votantes que ganan menos de $50,000 o $100,000 al año frente al 48% de Harris. Ganó el 54% de los votantes sin educación universitaria (Gráfico 4). Obtuvo el 45% del voto latino, frente al 13% en 2020 y al 17% en 2016 (Gráfico 5).   Gráfico 4 Trump gana a los votantes de clase trabajadora y sin educación universitaria El regreso histórico de Trump: Lo que nos llama la atención El regreso histórico de Trump: Lo que nos llama la atención     Gráfico 5 Latinos inclinándose hacia el Partido Republicano por motivos económicos El regreso histórico de Trump: lo que nos llama la atención El regreso histórico de Trump: lo que nos llama la atención   En más del 70% de las elecciones en todo el mundo desde que la inflación regresó en 2022, el partido gobernante ha perdido escaños, y solo en la mitad de los casos el partido gobernante se ha mantenido en el poder (Tabla 1). Las elecciones de Estados Unidos y Japón en las últimas dos semanas reforzaron el hecho de que la inflación es negativa para los partidos incumbentes, y en el caso de Estados Unidos fue letal. Tabla 1 Los incumbentes en todo el mundo perdieron la reelección El regreso histórico de Trump: lo que nos llama la atención El regreso histórico de Trump: lo que nos llama la atención     Gráfico 6 Las amenazas a la democracia se anularon mutuamente El histórico regreso de Trump: lo que nos llama la atención El histórico regreso de Trump: lo que nos llama la atención   Si bien las encuestas a pie de urna muestran que la democracia fue el tema principal en la elección, con el 35% de los votantes diciendo que importaba más frente al 31% que indicó la economía, los votantes estaban divididos sobre cómo interpretaron la amenaza a la democracia. Entre quienes pensaban que la democracia estaba “muy amenazada” en lugar de “algo amenazada”, el 50% votó por Trump y el 48% votó por Harris (Gráfico 6). En otras palabras, los votantes reaccionaron tan negativamente, o incluso más negativamente, a los intentos de la administración Biden de encarcelar al presidente Trump como a los alborotadores del Capitolio del 6 de enero de 2021. Con la opinión dividida sobre la democracia, la economía resultó decisiva aunque inusualmante ocupó el segundo lugar en importancia. Las mujeres no salvaron el día para Harris. La decisión de la Corte Suprema de recortar el acceso al aborto tuvo un impacto importante en 2022, pero fue un viento a favor que se desvaneció en 2024, debido a mayores preocupaciones por la economía (Gráfico 7).   Gráfico 7 La identidad de género por sí sola no pudo salvar a Harris (ni a Clinton) El regreso histórico de Trump: lo que nos llama la atención El regreso histórico de Trump: lo que nos llama la atención     Gráfico 8 Harris perdió a las mujeres blancas, incluso en suburbios críticos El regreso histórico de Trump: lo que nos llama la atención El regreso histórico de Trump: lo que nos llama la atención   Los votantes separaron la elección presidencial de la cuestión del aborto, tanto en general como en estados específicos que tuvieron referendos sobre el aborto. En general, los votantes aprobaron restricciones a los abortos de término tardío pero rechazaron propuestas estrictas contra el aborto; y en los estados azules ampliaron el acceso al aborto. Pero Harris perdió a las mujeres blancas por 5 puntos porcentuales frente a Trump, y a las mujeres blancas suburbanas por cuatro puntos porcentuales, un golpe demoledor para su estrategia de campaña (Gráfico 8). Hemos planteado esta elección como una elección entre “liderazgo” y “consenso”, o el gobierno del “hombre fuerte” frente al gobierno por comité. Los estadounidenses claramente eligieron a Trump, con todos sus defectos bien conocidos, en lugar de Harris, una representante poco inspiradora del grupo intelectual del Partido Demócrata. La mayoría de los votantes dijo que eligieron en función de quién podía liderar y quién podía traer el cambio necesario, más que por quién tenía buen juicio o se preocupaba por ellos personalmente. Trump ganó ambas categorías anteriores (Gráfico 9). Los picos históricos de polarización y división política han llevado a una demanda de un tomador de decisiones.   Gráfico 9 Los votantes querían a un ‘hombre fuerte’, no a un ‘comité secreto’ El regreso histórico de Trump: Lo que llama nuestra atención El regreso histórico de Trump: Lo que llama nuestra atención   Este punto, y el estatus de Trump como presidente en su segundo mandato no elegible para la reelección, sugiere que es probable que ejerza la autoridad ejecutiva de forma agresiva tanto en el país como en el extranjero, para bien o para mal. Implicaciones para la inversión Las implicaciones para la inversión dependen en gran medida del control de la Cámara, pero una trifecta republicana es cada vez más probable en este punto, incluso si su margen en la Cámara es pequeño. Sabemos que Trump utilizará el poder ejecutivo para desregular la economía así como para imponer aranceles al comercio exterior. El S&P 500 sube un 2% al momento de escribir. Trump definitivamente podrá extender sus recortes fiscales de 2017, que expiran en 2025, a raíz de la reelección. El resultado sería al menos una leve flexibilización fiscal (Gráfico 10).   Gráfico 10 El déficit presupuestario de Trump crecerá mucho si hay una barrida total, poco si los demócratas ganan la Cámara El déficit presupuestario de Trump crecerá mucho si hay una barrida total, y poco si los demócratas ganan la Cámara de Representantes. El déficit presupuestario de Trump crecerá mucho si hay una barrida total, y poco si los demócratas ganan la Cámara de Representantes.   Suponiendo que el Partido Republicano gane la Cámara, la relajación fiscal se ampliará significativamente, ya que los republicanos podrían usar el procedimiento de reconciliación presupuestaria para cumplir algunas de las promesas de campaña de Trump de recortar impuestos sobre los ingresos del Seguro Social, a las empresas, a las horas extra y a las propinas y gratificaciones. Si se le da el control total, Trump recortaría el gasto gubernamental para ayudar a pagar las reducciones de impuestos. Se dice que nombrará al empresario tecnológico Elon Musk para supervisar un gran esfuerzo para agilizar el gobierno y recortar costos. Marko Papic, director de nuestro nuevo servicio GeoMacro, argumenta que la salvaje expansión fiscal de los años de Covid-19 se revertirá al menos por el momento. En última instancia, sin embargo, la administración Trump no reducirá el gasto más de lo que reduce los ingresos, o de lo contrario impondrá un lastre fiscal a la economía y la desacelerará. Por lo tanto, los inversores pueden contar con al menos un déficit presupuestario algo mayor, y por ende el movimiento alcista en los rendimientos está justificado como una reacción a corto plazo. Como presidente en un segundo mandato, Trump puede asumir mayores riesgos que en su primer mandato. Pero su legado depende de un auge económico y de una victoria republicana en 2028. Así que los inversores pueden asumir que el proyecto de ley fiscal republicano aumentará el déficit en términos netos para estimular la economía al menos de forma marginal. Tiene sentido que el rendimiento del Treasury a 10 años haya subido 17 puntos básicos de la noche a la mañana y que la curva de rendimientos se haya empinado, con los rendimientos de corto plazo subiendo 3 puntos básicos (Gráfico 11).   Gráfico 11 Rendimientos del Treasury suben, curva se empina por Trump Rendimientos del Tesoro suben, la curva se empina por Trump Rendimientos del Tesoro suben, la curva se empina por Trump     Gráfico 12 La inmigración será restringida, más o menos El regreso histórico de Trump: lo que nos llama la atención El regreso histórico de Trump: lo que nos llama la atención     Los republicanos también probablemente aprobarán una ley de inmigración con su probable control de la Cámara. La decisión de Trump de tumbar el proyecto bipartidista negociado por Biden a principios de este año dio resultado. Esto puede convertirse en una victoria rápida en 2025, incluso si su margen en la Cámara es estrecho, ya que el apetito de los demócratas por obstruir disminuirá dado que la inmigración ha probado ser una de sus talones de Aquiles. Solo el 11% de los votantes dijo que la inmigración fue el tema principal en esta elección: no fue lo que produjo la victoria de Trump. Solo el 39% de los votantes dijo que los inmigrantes ilegales deberían ser deportados (Gráfico 12). Esto demostró que el proyecto de ley moderado ya negociado es más probable que pase y que Trump puede obtener una victoria rápida en la frontera. Los inversores deberían referirse a nuestras recientes “hojas de referencia” para conocer las principales perspectivas (Tabla 2), proporcionadas por nuestra estratega de acciones de EE. UU. Irene Tunkel y nuestro estratega de Daily Insights Felix Vezina-Poirier. Nuestra propia hoja de referencia sobre los dos candidatos destaca el impacto generalmente negativo de Trump en el mercado de bonos y nuestra visión de que el conflicto en Oriente Medio se intensificará más temprano que tarde y eventualmente causará importantes shocks en el suministro de petróleo (Tabla 3). Tabla 2 Hoja de referencia de acciones de EE. UU. El regreso histórico de Trump: lo que nos llama la atención El regreso histórico de Trump: lo que nos llama la atención   Tabla 3 Por qué a los tenedores de bonos no les gustará Trump El regreso histórico de Trump: lo que nos llama la atención El regreso histórico de Trump: lo que nos llama la atención   Estados Unidos ha dado no solo un mandato electoral sino también un mandato popular a una agenda de unilateralismo y nacionalismo económico que implica al menos algo de estímulo en el país y un eventual aumento de las barreras arancelarias que inicialmente causará un shock negativo al crecimiento en el extranjero. Los inversores deberían favorecer tácticamente los activos estadounidenses y luego reevaluar una vez que estos desarrollos estén convincentemente descontados, lo cual en el caso de los aranceles podría ocurrir tan pronto como el Día Uno. Matt Gertken Estratega político jefe de EE. UU.mattg@bcaresearch.com  Sígueme enLinkedIn & X  

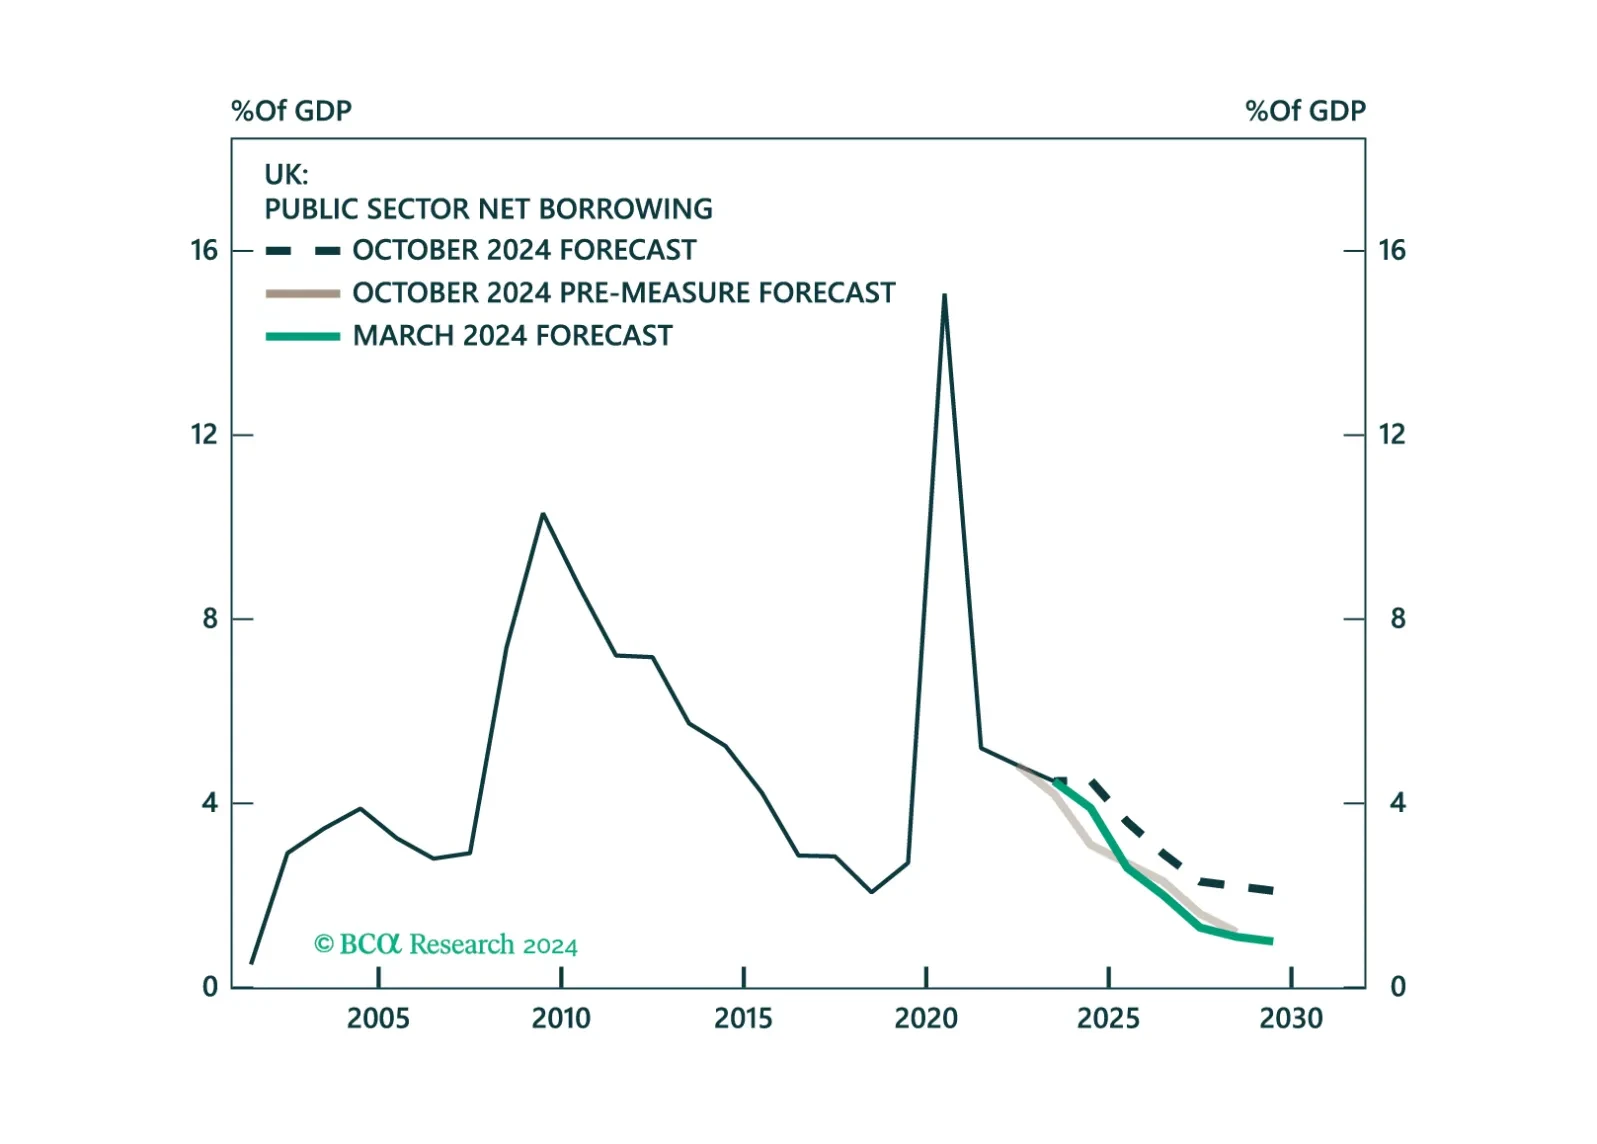
Este Strategy Insight presenta nuestra opinión sobre el recorte de tipos de interés anunciado hoy por el Bank of England, así como sobre el presupuesto anunciado por el gobierno del Reino Unido la semana pasada.

Our thoughts on the bond market’s reaction to the election and this afternoon’s FOMC meeting.

Trump’s resounding victory brings a popular mandate that ensures deregulation and higher trade tariffs. Higher budget deficit and immigration reform are also in the cards as the Republicans look like they may squeak a thin margin in the House of Representatives. Foreign policy will become more unilateral, with US assets outperforming initially.

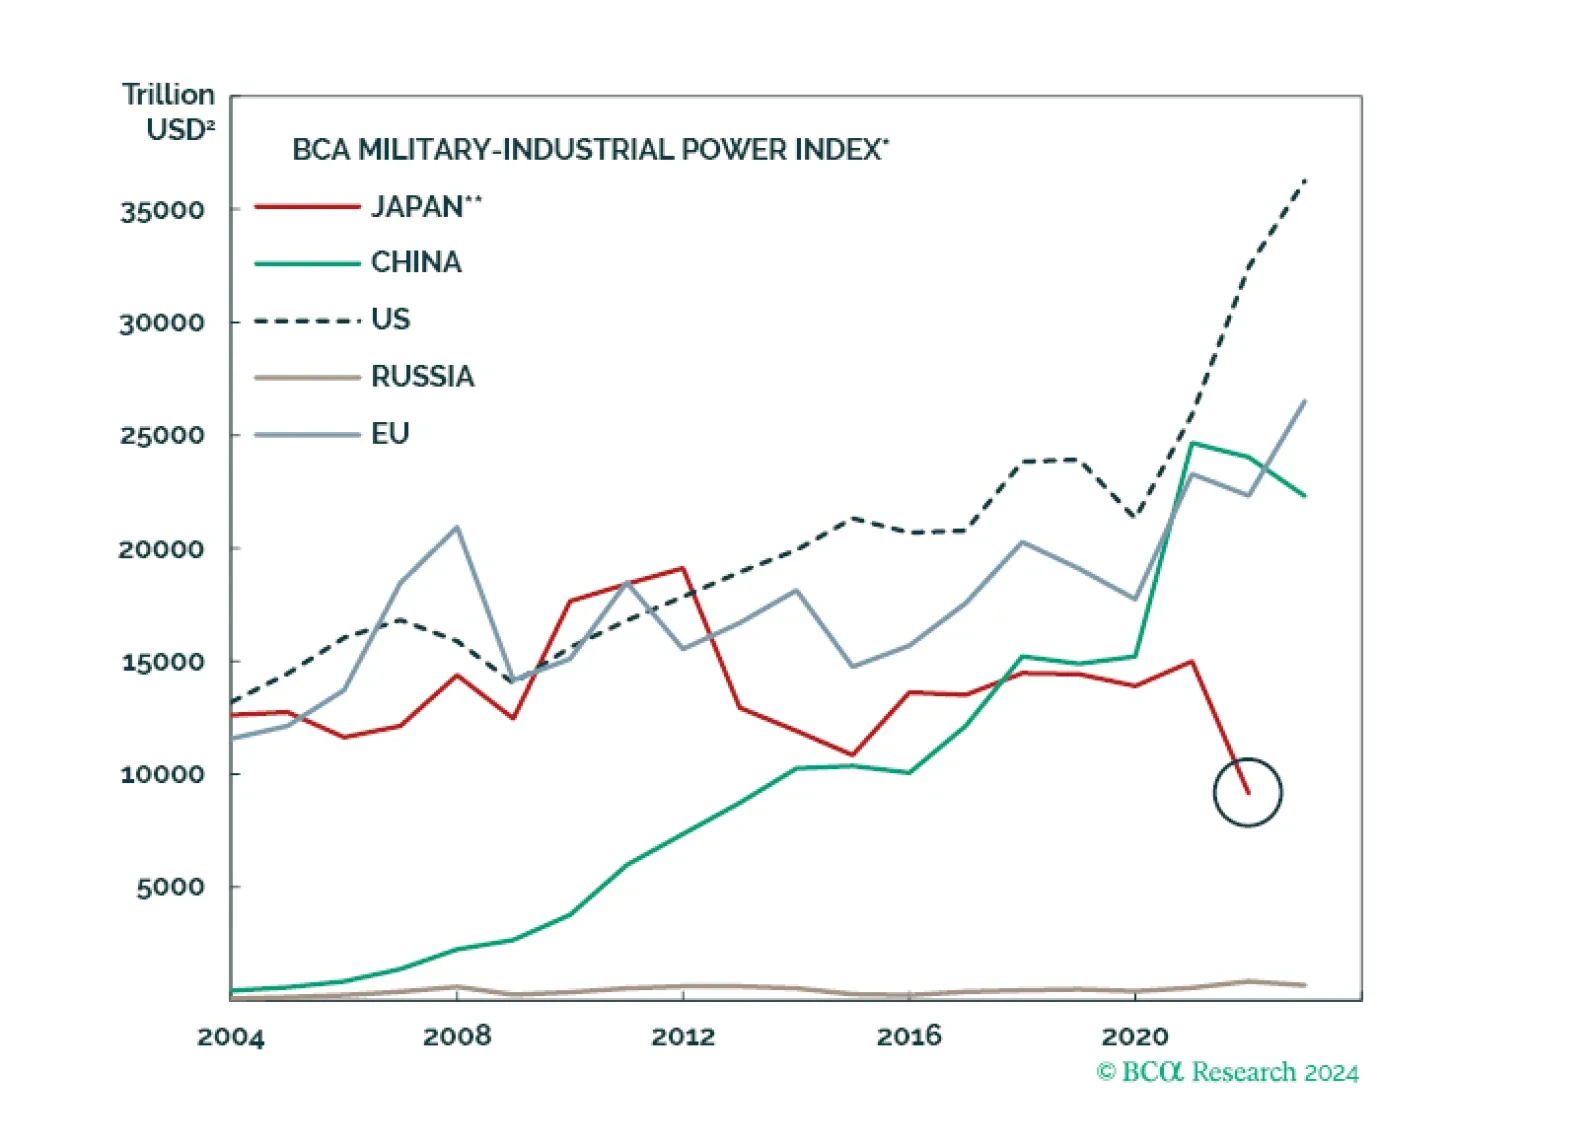
En los próximos meses, el nuevo gobierno de Japón relajará la política fiscal, lo que mejorará la demanda interna marginalmente. La política monetaria puede endurecerse más a corto plazo, pero no demasiado a largo plazo. El contexto geopolítico empuja a Japón hacia una política económica acomodaticia.