Sorry, you need to enable JavaScript to visit this website.
Saltar al contenido principal

Fiscal

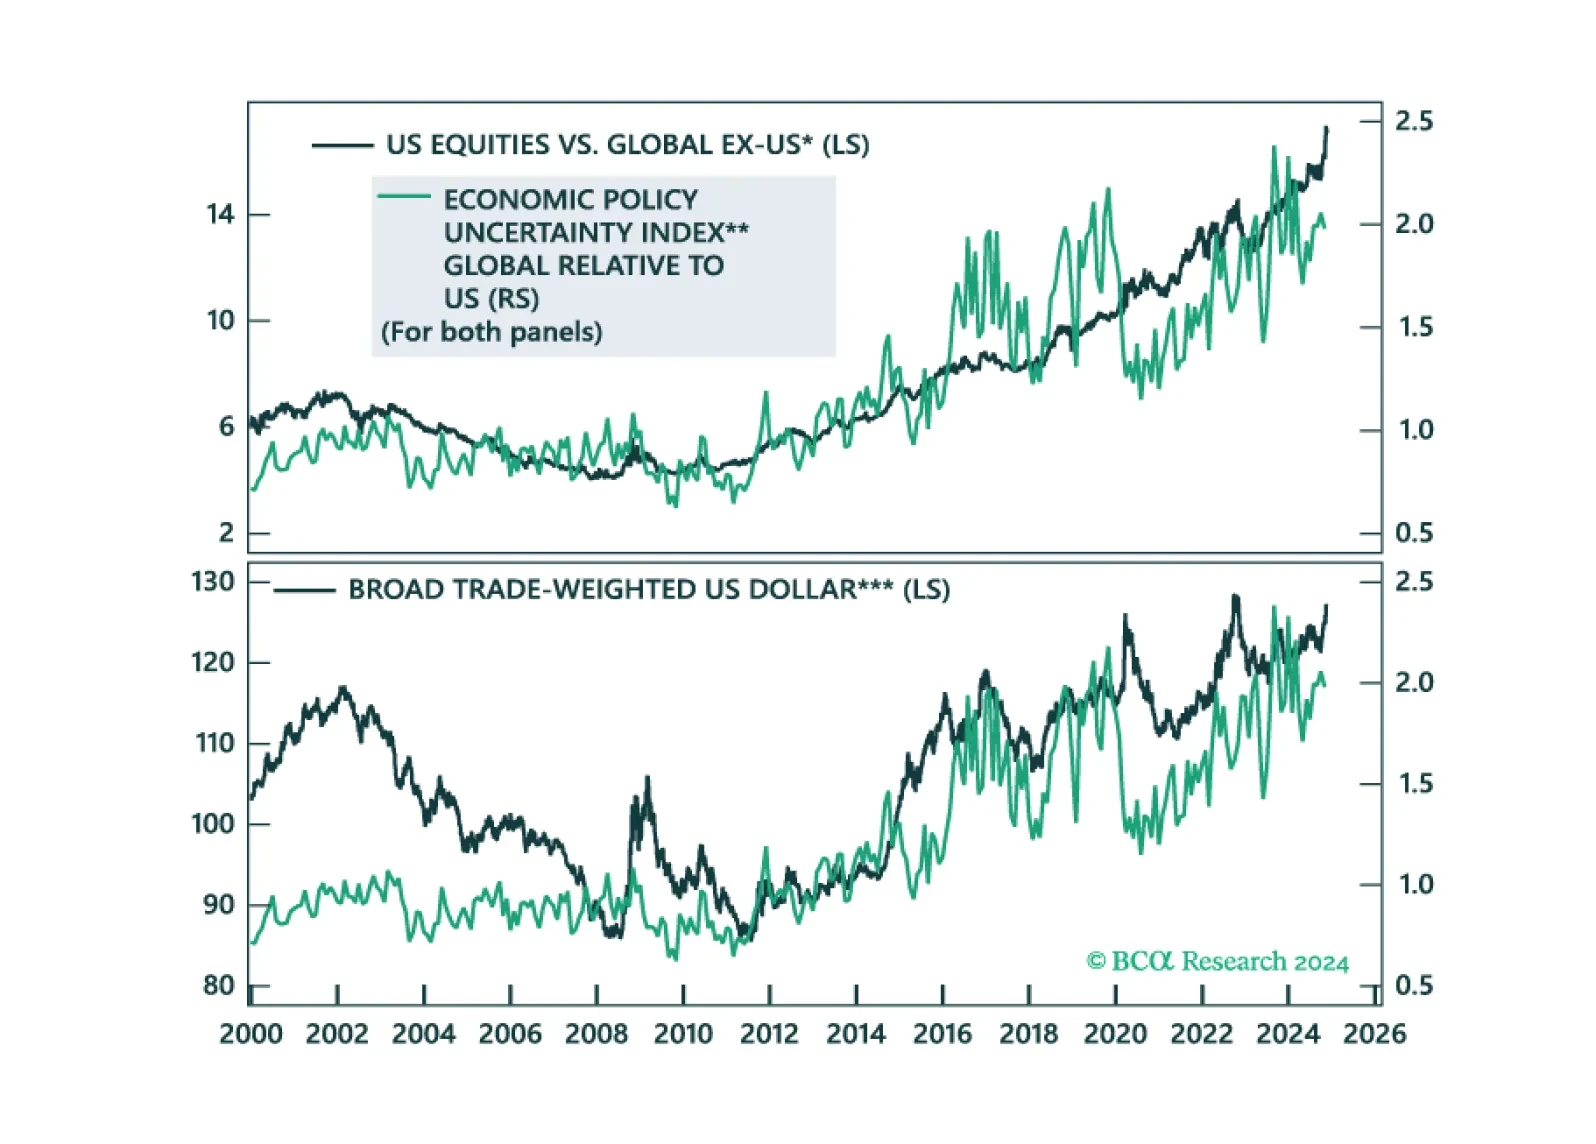
Executive Summary Political Uncertainty And The Dollar The consensus is that Republicans will blow out the budget deficit, leading to a higher fiscal risk premium on the dollar. That seems unlikely for now. If the deficit does not blow out, that path of least resistance for the dollar remains up, for now. The US economy is already outperforming the rest of the world, so does not need outsized tax cuts to keep the economy humming. Longer term, what matters are expected rates of return, and the US stock market will likely see outflows in the coming years. However, the bond market matters more for currencies, and real yields remain elevated in the US.  Short-term investors should remain long the greenback. Longer-term investors should start bottom-fishing opportunities in non-currency adjusted terms where valuations are becoming very compelling. Bottom Line: Stay long the US dollar. Feature The standard economic theory is that Republicans will blow out the budget deficit, so that should be negative for the dollar, as it pushes up inflation expectations and depresses real interest rates. This is also true given a campaign trail of deregulation, tax cuts and siphoning off US competitors, via tariffs, which all sound inflationary. So far, Republicans have been rather budget friendly. For example, one of the most contested issues amongst Democrats and Republican has been what should be done around social security and Republicans are giving in to social security cuts (Chart 1). While too early to tell, the budget deficit is unlikely to be much wider under a Trump administration. Chart 1What Rising Budget Deficit? Deficits And Risk Premia Chart 2Deficits And Risk Premia Bond volatility has tended to rise as risks of a rising fiscal deficit increase. We might well end up in world where the US budget deficit does blow out, and investors will require a bigger risk premium to hold US bonds or the dollar. We are not there yet. It is true that the rise in the VIX and corporate bond spreads could be attributed to concerns about a widening deficit in the US (Chart 2), but a strong dollar tells us those concerns are premature for now. Putting President elect Donald Trump’s policies into perspective, the effective corporate tax rate in the US will be in line with many other countries (Chart 3). This means the prospect of an administration that fans the US inflationary wave is plausible, but not probable for now. That should keep US real interest rates high for now. Chart 3No Outsized Tax Cuts In The US Putting everything together, the US runs a fiscal deficit of around 8% of GDP, while the unemployment rate only sits around 4.1% (Chart 4). Ergo, this is not an economy that needs more fiscal stimulus. Most economists on the Trump administration will consider this point. Chart 4The US Does Not Need More Fiscal Stimulus The External Balance The exorbitant privilege of the dollar has meant that the US has earned more on its assets, than it has paid on its liabilities. That remains the case today, suggesting that the short-term outlook for the greenback remains positive from the basis of the US external balance (Chart 5). Ergo, more inflows into the US. That said, this is one area we are very concerned about when it comes to the dollar. For one, we know that payments on US liabilities are rising and will especially explode if we have a fiscal crisis in the US. This is worth monitoring. For now, real interest rates in the US are very positive suggesting that there should be little appetite for a massive capital flight from US Treasury securities (Chart 6). Chart 5The US External Balance Chart 6Real Interest Rates And The Dollar Chart 7Prospective Equity Returns Another source of risk is also the US equity market. US stocks are overbought and over owned, and a massive outflow from this market is a source of risk for the dollar. Over a five-to-ten-year horizon, valuations are a perfect guide for what happens in both equity, fixed income and currency markets. The message from our valuation models is that US securities are overvalued, and we should be using dollar strength to diversify into cheaper markets like Japan (Chart 7). The bottom line is that the US market remains defensive and will likely attract inflows in a global market selloff. US bonds are also a high-yielding vehicle for many foreign investors. That is bullish the dollar. Longer-term, these factors will be outweighed by valuation concerns and rising opportunities in other markets. What Should Investors Do? Here is what we know. When global policy uncertainty is rising, especially vis-à-vis the US, American stocks perform better and the dollar soars (Chart 8). With a Trump presidency baked in the cake, the potential source of any uncertainty could come from outside the US. This will keep the dollar bid. Carry trades have been a big trend in currency markets, and with EM volatility rising, a lot of these trades could still be unwound (Chart 9). EM currencies typically have a higher carry, and the yen was the perfect vehicle to fund these trades. That said, these have blown up. Within the rubble, some interesting opportunities like the Mexican Peso and the Norwegian krone that are no longer market darlings, are emerging. Stay tuned. Chart 8Political Uncertainty And The Dollar Chart 9Rising Risks In EM Currencies Chart 10Our Trading Model Is Short The USD A final note on our US dollar trading model – it remains short the greenback. The model has underperformed our recommendations since August but keeps us grounded in the methodology we use to analyze FX markets. We are excited about a new version of this model, that is more tactical in nature. That said, the blueprint of the original model was capital preservation which will remain an important tenet of any changes (Chart 10). Chester Ntonifor Foreign Exchange/ Global Fixed Income Strategist chestern@bcaresearch.com Trades & Forecasts Strategic View Cyclical Holdings (6-18 months) Tactical Holdings (0-6 months) Limit Orders Forecast Summary
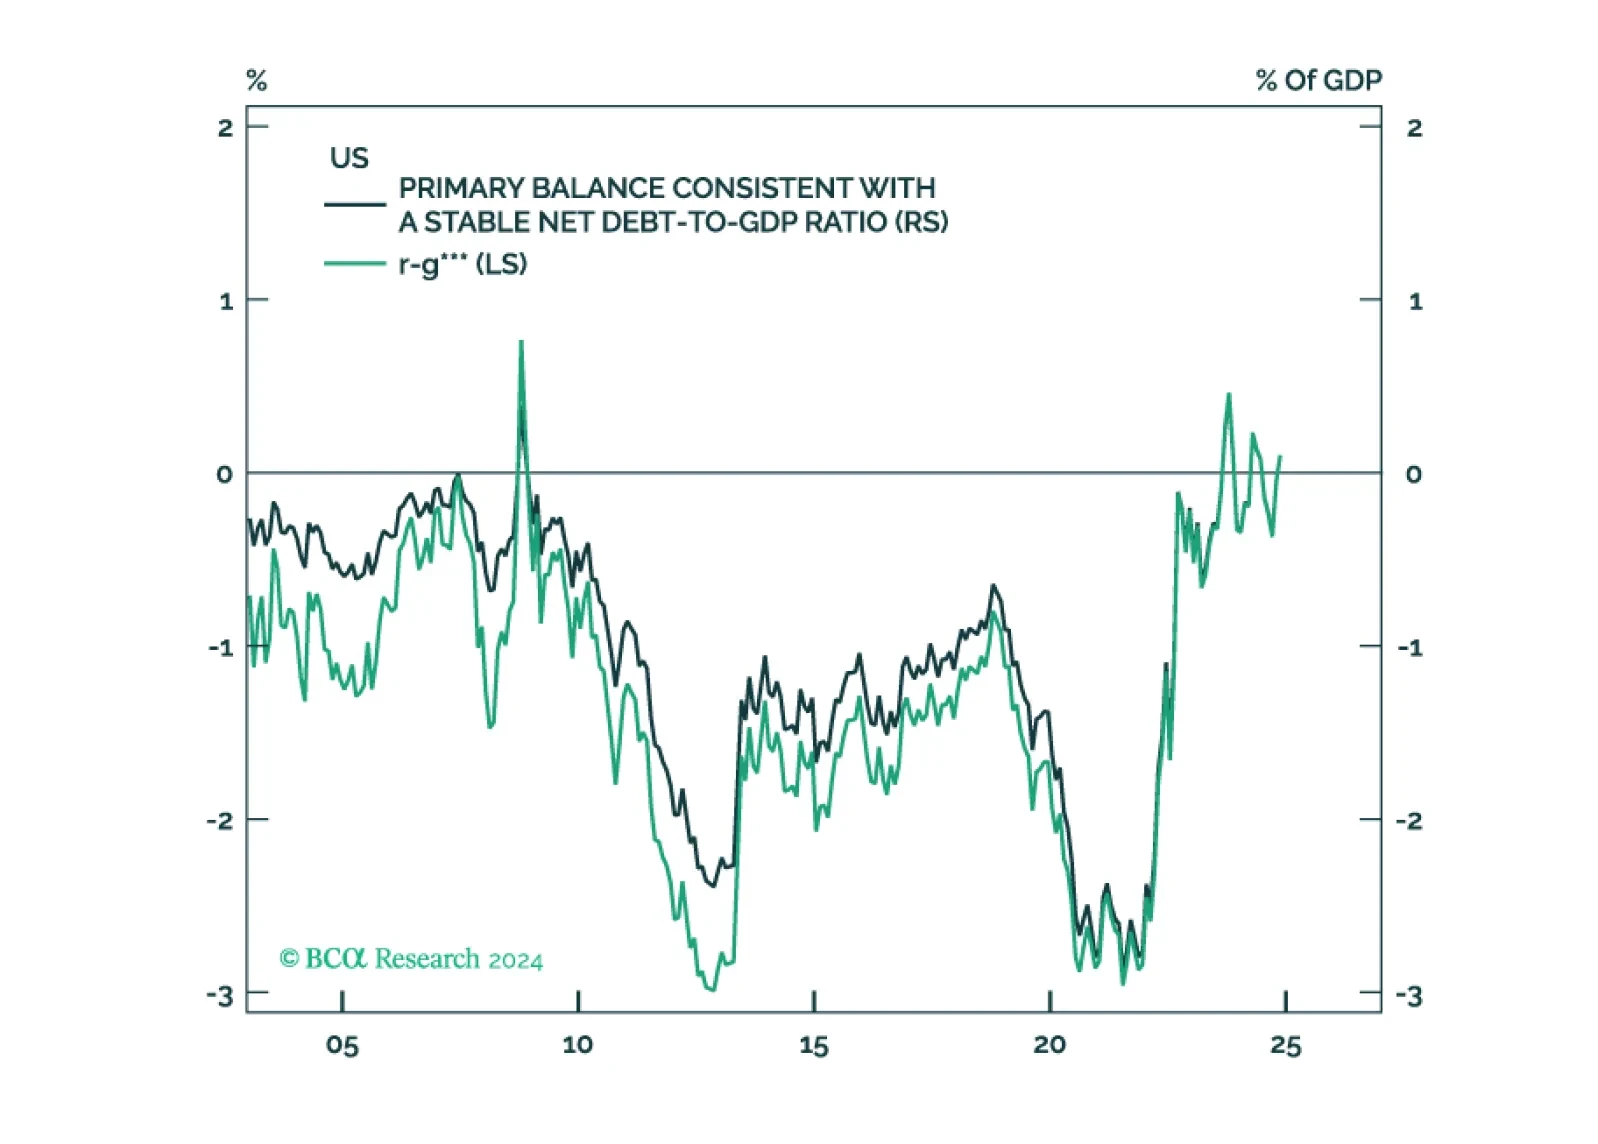
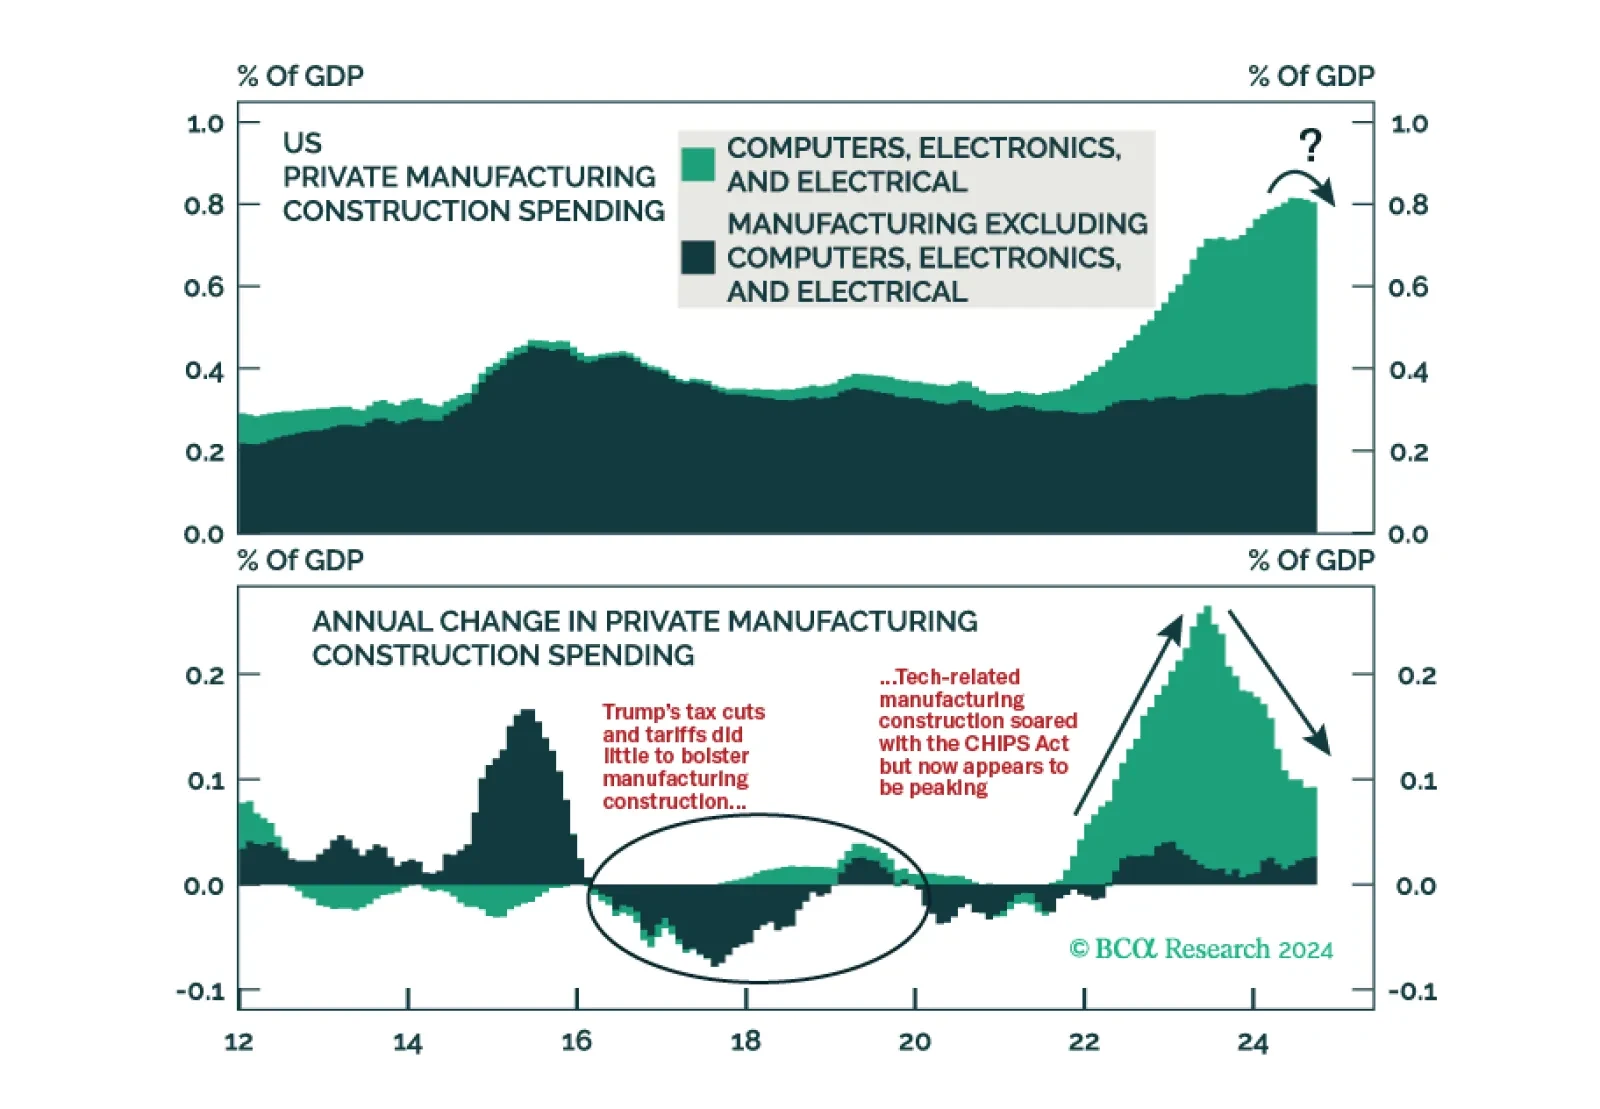
Executive Summary The US Needs To Reduce Its Primary Budget Deficit By Nearly 4% Of GDP To Stabilize Debt Rising government debt in the US has heightened the risk of a fiscal crisis. If interest rates stay where they are, the US primary budget balance would need to improve by nearly 4% of GDP to stabilize the debt-to-GDP ratio.The good news is that bond yields would probably fall if the US government were to bring down the budget deficit, thus allowing for a somewhat smaller fiscal adjustment. The bad news is that many of Trump’s stated policies would lead to larger, not smaller, deficits.That said, interest rates are much higher now than during Trump’s first term. This means that Trump may need to rely more on tariff revenue than investors are currently expecting.He may also allow Republicans in Congress to repeal large parts of the Inflation Reduction Act (IRA), while permitting sharp cuts to social spending.Social spending has a bigger fiscal multiplier than corporate tax cuts. Consequently, even if the federal budget deficit were to rise over the next few years, aggregate demand could still weaken in response to shifts in fiscal policy. With state spending already set to decline, bond yields would probably fall.While government debt is very high in Japan, interest rates remain below nominal GDP growth, which reduces the odds of a crisis. In China, the challenge is to shift the debt burden from local governments to the central government. In peripheral Europe, debt-to-GDP ratios have declined over the past few years but remain dangerously elevated.Bottom Line: Higher interest rates will increase the pressure on governments to trim deficits. In the US, the Trump administration will rely on tariffs to partially pay for tax cuts, while also delivering deeper-than-expected social spending cuts. This will result in lower bond yields over time.The Fundamental Equation of Debt SustainabilityOver the past few decades, most major economies have responded to macroeconomic shocks by easing fiscal policy. In the US, the shift towards bigger budget deficits was exacerbated by a series of tax cuts – such as those in 2001, 2003, and 2017 – which were not offset by lower spending. As a result, government debt stands near historic highs in most economies (Chart 1). Chart 1AGovernment Debt Is Near Historically High Levels In Many Developed Economies (I)  Chart 1BGovernment Debt Is Near Historically High Levels In Many Developed Economies (II) How significant are the risks of a major fiscal crisis in the US and elsewhere?To address this question, it is useful to start with the fundamental equation of debt sustainability, which specifies the value of the primary balance (the budget balance excluding interest payments) that is consistent with a stable debt-to-GDP ratio (see Appendix A for a derivation):  Where p is the primary budget balance, expressed as a share of GDP; r is the real interest rate; and g is the growth rate of the economy.The US: An Unsustainable Fiscal Outlook Chart 2The US Needs To Reduce Its Primary Budget Deficit By Nearly 4% Of GDP To Stabilize Debt Given that US real bond yields are approximately equal to trend growth, the US would need a primary budget balance of close to zero to stabilize the debt-to-GDP ratio (Chart 2). The Congressional Budget Office (CBO) estimates that the primary budget deficit will be 3.9% of GDP in 2024. This implies that fiscal consolidation of nearly 4% of GDP is required to put government debt on a sustainable trajectory.The good news is that bond yields would probably fall if the government sought to bring down the deficit. If the 10-year TIPS yield were to drop to 1% from its current level of around 2%, 2.9% of GDP in fiscal tightening would be necessary to stabilize the debt-to-GDP ratio.The bad news is that most of Trump’s stated policies would lead to larger, not smaller, deficits. According to the non-partisan Committee for a Responsible Federal Budget, Trump’s proposed spending and revenue measures would raise federal debt by an additional $7.75 trillion over the next 10 years in a central scenario (Table 1). This would cause the debt-to-GDP ratio to rise to 143% of GDP by 2035 – a 44 percentage-point increase from current levels (Chart 3).Why Fiscal Consolidation May Happen, Even Under TrumpGiven what transpired under Trump’s first term, it is understandable that most investors expect the federal budget deficit to only widen further over the coming years. However, there is an important limiting factor to higher budget deficits that was not present during Trump’s first term in office: The 10-year TIPS yield was close to zero when he assumed the presidency in early 2017, and then fell into negative territory once the pandemic began. Back then, the market simply did not care about large budget deficits.This is not the case anymore. Net interest payments on federal government debt have risen from 1.3% of GDP in 2016 to 3.1% of GDP as of 2024. Even under current policy – which unrealistically assumes the personal tax cuts in the Tax Cuts & Jobs Act (TCJA) will sunset at the end of 2025 – interest costs are projected to swell to 4.1% of GDP in 2034, equal to 23% of all government revenue (Chart 4).Table 1Trump's Proposed Fiscal Policies Would Increase The Budget Deficit Chart 3Federal Debt Would Continue To Surge Under Trump's Proposed Policies  Chart 4Rising Interest Payments Will Force Fiscal Austerity  Chart 5Little Evidence So Far That Productivity Growth Has Shifted Into Higher Gear Faster Productivity Growth? Hopefully, But Don’t Bet on It Chart 6Capital Spending Remains Downbeat The US could get lucky and experience much faster productivity growth. As the fundamental equation of debt sustainability highlights, this would allow for a larger budget deficit.Unfortunately, there is little evidence so far that productivity growth has shifted into higher gear. While the productivity numbers have improved somewhat over the past few quarters, this follows a period where output-per-hour shrank outright. Averaging the productivity numbers since the start of the decade, we are still close to the pre-pandemic trend (Chart 5).Meanwhile, key drivers of productivity growth, such as capital spending, remain downbeat (Chart 6).In any case, economic theory suggests that faster productivity growth should raise the rate of return on capital. Increased competition for private-sector savings should, in turn, push up the interest rate at which the government borrows. As per the debt sustainability equation, this would necessitate a higher primary budget balance. Yield Curve Control Is Not As Easy As It SeemsOne possible strategy to keep interest costs down, while still running large budget deficits, is for the Fed to purchase bonds which trade above a certain prespecified yield. This is exactly what the Bank of Japan did with its Yield Curve Control (YCC) policy.Let us put aside the issue of the Fed’s independence. In the unlikely case that the Fed could be cajoled into pursuing such a scheme, it would still run into a major problem: inflation.The Bank of Japan was able to cap yields because the economy was suffering from deflation. Even in the absence of the rate cap, yields would probably not have risen very much.If the Fed were to try to cap yields – effectively monetizing government debt – inflation expectations would rise. Higher inflation expectations would push down real yields, increasing the incentive for firms to borrow and for households to spend more in advance of higher prices. Such a dynamic would cause the economy to overheat, leading to even higher inflation expectations.As the last few years have demonstrated, inflation is very unpopular. Whereas higher unemployment mainly hurts those who lose their jobs, inflation hurts everyone. Thus, pursuing any strategy that produced higher inflation would be political suicide.The Multiplier-Weighted Fiscal Thrust Will Probably Be Negative Next YearIt is highly likely that the Trump administration will push through a full extension of the TJCA. However, this will just maintain the status quo. It will not represent new stimulus. Chart 7Manufacturing Construction May Be Peaking Additional stimulus could come in the form of eliminating taxes on tips, which was one of Trump’s signature campaign promises. Such a move would reduce revenue by a relatively modest $300 billion over 10 years. Exempting overtime income and social security benefits from taxation would be much more costly – worth a combined $3.3 trillion over 10 years. However, Trump did not emphasize these measures very heavily on the campaign trail and so they will probably be dropped.Trump did mention cutting the corporate tax rate further from 21% to 15%. However, such a step may run afoul with populists in the Republican Party and their derision for “woke capital.” Trump himself mused earlier in the campaign that he would be content to just cut the corporate tax rate to 20% (a “nice round figure” as he called it).On the flipside, Trump could increase tariffs significantly, raising $2-to-$4.3 trillion over 10 years. Contrary to Trump’s claims, tariffs would be a regressive tax on households. Moreover, to the extent that half of global trade is in intermediate goods, higher tariffs would effectively boost taxes on businesses.In order to keep bond yields from rising further, Trump may let the Republicans in Congress take an ax to government spending. This could mean repealing large parts of the Inflation Reduction Act (IRA) (Chart 7). It could also mean sharp cuts to social spending. Trump’s promise this week to eliminate the Department of Education – whose $238 billion annual budget largely consists of doling out assistance to low-income students – is a good example of what may lie ahead.Social spending has a large fiscal multiplier because the poor generally spend whatever income they receive. Corporate tax cuts, in contrast, have a smaller multiplier since they disproportionately benefit highly profitable companies that are not liquidity constrained. Consequently, even if the federal fiscal deficit were to rise over the next few years, aggregate demand could still weaken in response to shifts in fiscal policy.In such a scenario, bond yields would likely decline. Lower aggregate demand would prompt the Fed to cut rates more than is currently discounted. While a larger deficit would entail more Treasury issuance, higher after-tax private-sector savings would be able to absorb most of that debt.A Word on State and Local Government SpendingMost people focus on fiscal policy at the federal level. However, it is worth remembering that state and local government spending is half as large as overall federal spending and double that of discretionary federal spending.State and local government spending jumped during the pandemic on account of the transfers that those lower levels of government received from Washington. Having spent most of the money, expenditures will decline. The Association for State Budget Officers reckons that state spending will fall by about 6% in 2025, the first annual decline since the GFC (Chart 8).Debt Sustainability Outside the USGovernment debt in Japan remains the highest in the G7. Although this debt is a source of vulnerability, it needs to be seen in the context of the debt sustainability equation discussed at the outset of this report.The 10-year Japanese government bond yield currently stands at 1.07%. This is less than nominal GDP growth, which clocked in at 2.9% year-over-year in Q3 2024. The IMF expects nominal GDP growth to average 2.8% over the next five years, which should bring net debt down from 156% of GDP to 151% of GDP (Chart 9). Chart 8State Spending Is Expected To Shrink  Chart 9If Sustained, The Recent Acceleration In Japanese Nominal GDP Growth Should Mitigate The Risks Of A Fiscal Crisis Government revenue in Japan, as a share of GDP, is the second lowest in the G7 after the US (Chart 10). The Japanese government would sooner raise taxes than allow a debt crisis.In China, debt levels are high in the corporate sector and among local governments. Household debt rose sharply in the pre-pandemic period but has been broadly flat over the past few years (Chart 11). Chart 10Japan's Government Has Room To Raise Revenue  Chart 11Breakdown Of Chinese Debt One distinguishing feature of China’s economy is that it generates large amounts of savings. The national savings rate is close to double that of most other major economies (Chart 12). The flipside of this excess savings is inadequate spending. Insufficient demand is fueling deflation, leading to anemic nominal GDP growth (Chart 13).What China ultimately needs is more spending. Unfortunately, the fiscal impulse is currently close to zero against a budgeted target of 2.2% of GDP (Chart 14). Local governments account for nearly 90% of overall government spending but have been hamstrung by falling land sales. Chart 12China Saves Too Much  Chart 13Deflation Risks Have Risen In China Efforts by the central government to replace debt issued by local government financing vehicles (LGFVs) with central government-backed liabilities are welcome. However, this may only bring spending back towards where it should have been all along. Chart 14Chinese Government Spending Is Well Below Target  Chart 15Debt-To-GDP Ratios Have Declined In Europe's Periphery Over The Past Few Years But Remain Dangerously Elevated Turning to Europe, the peripheral economies have made some progress in bringing down debt-to-GDP ratios in the aftermath of the pandemic (Chart 15). However, government debt is still very high, and in the case of Italy, the IMF expects the debt-to-GDP ratio to start rising again over the next few years. Although the ECB will take the necessary steps to preclude another crisis, peripheral Europe will need to pursue fiscal austerity for years to come.Trade UpdatesWe were stopped out of our long US health care/short S&P 500 trade, with the appointment of RFK Jr. being the coup de grâce. There is a reasonably high probability that he will not be confirmed by the Senate, so we are reinstating the trade, but this time against consumer discretionary stocks. Consumer discretionary companies are particularly vulnerable to a trade war and a potential US recession next year.Meanwhile, we are maintaining our bearish bias on stocks by being long the June 30, 2025 SPY ETF put with a strike price of $550, which has risen 25% since we initiated the position last week. Peter BerezinChief Global Strategistpeterb@bcaresearch.comPlease follow me onLinkedIn & Twitter APPENDIX AThe Arithmetic Of Debt SustainabilityGlobal Investment Strategy View MatrixThe Global Investment Strategy team (GIS) summarizes its views via a matrix featuring recommendations over a tactical 1-to-3 month horizon and a cyclical 6-to-12 month horizon. While GIS uses the MacroQuant model as one of several inputs into its decision-making process, the GIS views shown in this matrix may differ from the MacroQuant model's recommendations shown in the dedicated monthly MacroQuant reports.Special Trade Recommendations 
Informe especial

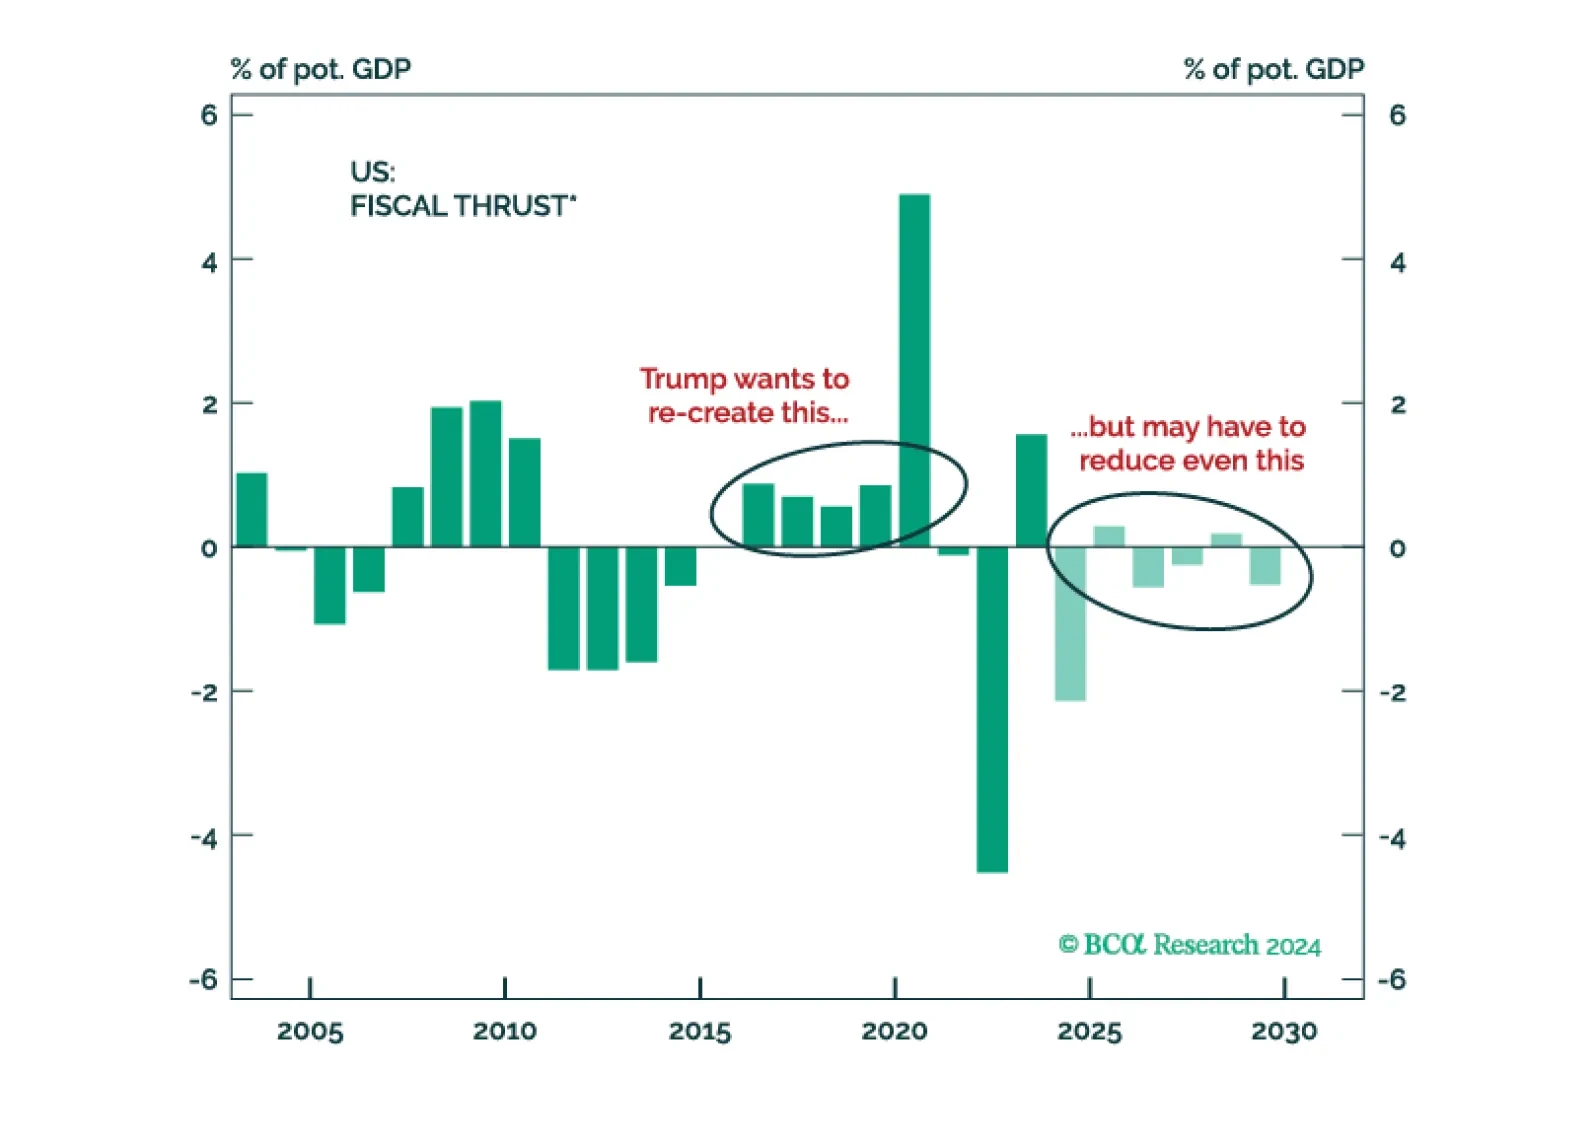
Investors are overstating the positive fiscal impact of the Trump presidency. The bond market will have something to say about the scope for further deficit expansion via tax cuts. As such, the trade after the trade of the Trump 2.0 administration may involve less growth out of the US, not more. In the interim, however, investors should continue to expect higher yields and increased equity volatility. There are plenty of risks ahead, including geopolitics, trade, and uncertainty surrounding fiscal policy.

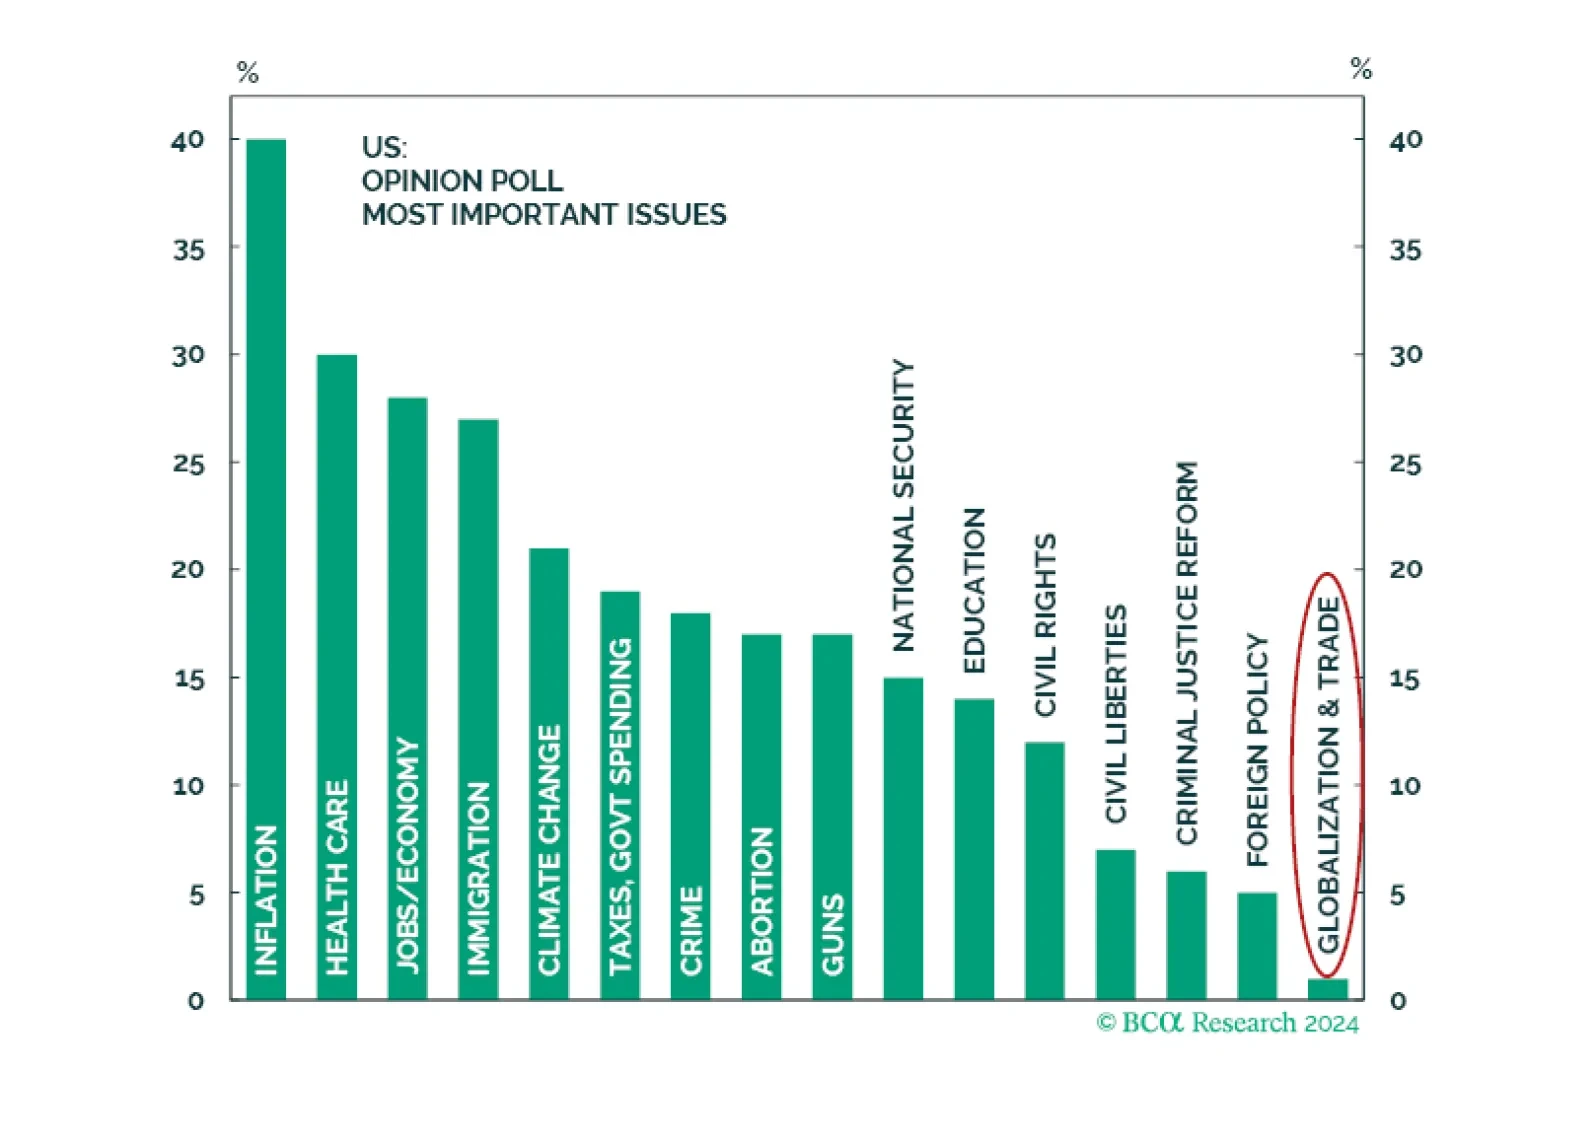
Ultimately, 2024 is not 2016 — a seemingly obvious point, but one with market relevance. In 2016, voters gave Trump a strong mandate for nominal GDP growth. It is not clear if this is the case today. Inflation is the most important issue, least relevant is trade and globalization. As such, Trump’s renewed mandate is for supply side reforms, not more populism and protectionism.

¡El mes de noviembre nos ha traído S&P 6,000! El presidente Trump ha ganado una “Red Sweep” (como esperábamos todo el año) y ha dado paso a un cambio de régimen en Estados Unidos. Por ahora, estamos abiertos a aprovechar el impulso. Sin embargo, el mayor riesgo para el mercado son los rendimientos de los bonos, que deberían subir a medida que los inversores empiecen a valorar las políticas del presidente Trump y su impacto en los déficits.

La perspectiva de una nueva guerra comercial compensa con creces las demás partes proempresariales de la agenda de Trump. Con el mercado laboral ya debilitándose de cara a las elecciones, estamos elevando nuestra probabilidad de recesión en Estados Unidos a 12 meses del 65% al 75%.

Given the charged atmosphere surrounding the US election, our Bank Credit Analyst colleagues investigate whether the Fed’s dovish pivot last December was politically motivated. The Fed’s actions appear overly dovish, but the answer lies deeper. Their dovish…
En los próximos meses, el nuevo gobierno de Japón relajará la política fiscal, lo que mejorará la demanda interna marginalmente. La política monetaria puede endurecerse más a corto plazo, pero no demasiado a largo plazo. El contexto geopolítico empuja a Japón hacia una política económica acomodaticia.
El día de las elecciones por fin ha llegado. No, este correo no contiene una previsión definitiva ni una "bala de plata". Solo nuestro pronóstico a largo plazo sobre cómo la elección, gane quien gane, afectará a los mercados.
China’s Caixin Manufacturing PMI rebounded one point in October to 50.3. This was in line with the NBS PMIs from earlier this week, which also showed a modest rebound. We are looking for a turning point in China as the government unrolls stimulus measures.…
Resumen Ejecutivo Las presiones inflacionarias subyacentes deberían desacelerarse claramente hasta bien entrado el próximo año. Si bien el mercado laboral se está debilitando, la Fed ha comenzado a ajustar la política para evitar que el desempleo aumente a niveles peligrosos. Algunas partes cíclicas de la economía global parecen tocar fondo. Aún es pronto para afirmarlo con certeza, pero hay razones para creer que Powell podría estar logrando un aterrizaje suave. ¿Cómo ha podido hacerlo? La baja deuda de los hogares, un sector corporativo resiliente, la escasez de vivienda en EE. UU. y la política fiscal estadounidense han actuado como amortiguadores contra la recesión en este ciclo. Por ahora, los balances de los hogares y las ganancias corporativas siguen siendo sólidos. Sin embargo, el sector de la vivienda – históricamente la parte más cíclica de la economía – ha empezado a mostrar algunas grietas. La mayor parte del atraso de inventario de los últimos dos años se ha desaparecido. La política fiscal probablemente no ayudará más al crecimiento, independientemente de quién sea el próximo presidente de EE. UU. Es posible que los consumidores y las empresas mantengan la economía en marcha. Sin embargo, la renta variable ya ha descontado en gran medida un resultado de aterrizaje suave. Entretanto, la subida de las tasas en anticipación a una victoria de Trump está empujando a la economía fuera de la senda de aterrizaje suave. Las tasas hipotecarias han vuelto a subir hasta el 7% —un nivel que impediría la estabilización de la vivienda. Cubrimos la posibilidad de una mayor subida de los rendimientos en caso de que Trump sea elegido degradando la duración a neutral. Dicho esto, los bonos gubernamentales empiezan a resultar atractivos para los inversores a largo plazo. En un escenario de aterrizaje suave, un Treasury estadounidense a 10 años rendiría más del 10%, y cerca del 20% si se produjera una recesión. Cambios en las recomendaciones Informe mensual TAA: ¿Podrá Powell lograr un aterrizaje suave antes de la tormenta Trump? Informe mensual TAA: ¿Podrá Powell lograr un aterrizaje suave antes de la tormenta Trump? Conclusión: Mantenemos la cautela por ahora. Aunque un aterrizaje suave es ahora una posibilidad, esto ya está, en gran medida, descontado por la renta variable. Aunque existe el riesgo de una mayor subida de los rendimientos a corto plazo, los bonos gubernamentales empiezan a resultar atractivos para los inversores a largo plazo. Esperaremos a la elección en EE. UU. para obtener más claridad sobre el panorama de políticas para el próximo año.   Según la Junta Nacional de Seguridad del Transporte, las tres razones más comunes detrás de los accidentes de avión son el error humano, las fallas mecánicas y las condiciones meteorológicas. Asignación Recomendada Informe mensual TAA: ¿Podrá Powell clavar el aterrizaje antes de la tormenta de Trump? Informe mensual TAA: ¿Podrá Powell clavar el aterrizaje antes de la tormenta de Trump? Las economías siguen un patrón similar. Las expansiones normalmente mueren por un error de política (error humano), desequilibrios estructurales (fallas mecánicas), shocks económicos/geopolíticos (condiciones meteorológicas) o una combinación de todo lo anterior. Sostuvimos la opinión de que un error de política hundiría la economía en una recesión. Si bien nuestra postura defensiva dio resultado en 2022, cuando tuvimos sobrepeso en efectivo, desde entonces hemos sido demasiado cautelosos. Es importante revisar por qué nos equivocamos y si todavía tiene sentido mantener nuestra posición defensiva. ¿Top Gun Powell? Los aterrizajes suaves son muy difíciles de lograr. Requieren calibrar la política monetaria para que sea lo suficientemente restrictiva como para erradicar la inflación (pero no tan restrictiva como para causar una recesión), y luego deshacer las subidas de tipos lo bastante despacio para evitar que la inflación vuelva a subir (pero con la suficiente rapidez para evitar que la economía se desacelere en exceso). Realizar esta maniobra sin permitir que la inflación se dispare de nuevo o sin provocar una recesión ha resultado imposible para casi todos los bancos centrales en la historia. Gráfico 1 Lo que Powell está logrando es histórico Informe mensual de TAA: ¿Puede Powell lograr un aterrizaje perfecto antes de la tormenta Trump? Informe mensual de TAA: ¿Puede Powell lograr un aterrizaje perfecto antes de la tormenta Trump? Gráfico 2 La inflación seguirá enfriándose La inflación seguirá enfriándose La inflación seguirá enfriándose ¿Podría ser diferente esta vez? Con el riesgo de violar el mantra más sagrado del inversor, debemos al menos reconocer la posibilidad. Powell ha conseguido la mayor caída de la inflación en la historia de EE. UU. sin provocar una recesión (Gráfico 1). Las fuentes de presiones inflacionarias subyacentes, como los salarios y la vivienda, se han enfriado, mientras que los indicadores adelantados apuntan a una normalización hacia los niveles prepandemia para el próximo año (Gráfico 2 El intercambio para devolver la inflación al objetivo ha sido un debilitamiento del mercado laboral. Como hemos mostrado recientemente, ha habido una desaceleración significativa en varios indicadores de empleo. Sin embargo, esto es intencionado, y la Fed entiende que a medida que la economía vuelve a la realidad, ahora debe centrarse en clavar el aterrizaje – es decir, evitar que la tasa de desempleo aumente mucho más (Gráfico 3). Gráfico 3 La Fed ahora está centrada en el mercado laboral La Fed Ahora Se Centra en el Mercado Laboral La Fed Ahora Se Centra en el Mercado Laboral Gráfico 4 El mercado laboral se está desacelerando pero aún no es recesivo Informe Mensual TAA: ¿Podrá Powell clavar el aterrizaje antes de la tormenta Trump? Informe Mensual TAA: ¿Podrá Powell clavar el aterrizaje antes de la tormenta Trump? Y hasta ahora, parece estar haciéndolo con éxito. Las nóminas no agrícolas actualmente se sitúan en un nivel consistente con una tasa de desempleo plana (Gráfico 4 – panel 1). Mientras tanto, el ingreso total por empleo se ha estabilizado y los consumidores siguen creyendo que, en general, los empleos son relativamente abundantes (Gráfico 4 – panel 2 y 3). Entretanto, otras partes de la economía han empezado a recuperarse. Tras caer en los últimos dos años, las intenciones de capex – que adelantan la inversión fija no residencial – han tocado fondo (Gráfico 5). El resto del mundo, que ha sido mucho más débil que EE. UU. en este ciclo, también muestra signos de vida. El impulso crediticio europeo ha rebotado y se proyecta que pase a ser positivo, lo que apunta a un repunte en la demanda de crédito (Gráfico 6 – panel 1) mientras que el cambio en la retórica del Partido Comunista Chino, como mínimo, ha creado un suelo en las condiciones de inversión (Gráfico 6 – panel 2). Gráfico 5 El capex está en vías de recuperación El Capex está en camino de recuperarse. El Capex está en camino de recuperarse. Gráfico 6 Señales de un suelo en Europa y China Señales de un fondo en Europa y China Señales de un fondo en Europa y China La economía SpaceX (por ahora) Una razón por la que Powell ha tenido más éxito que otros banqueros centrales es que la economía que heredó era estructuralmente más resiliente que la de sus predecesores. En 2007, la economía estaba repleta de apalancamiento y lista para desmoronarse ante el más mínimo signo de tensión. Ben Bernanke era como un piloto intentando aterrizar un Boeing deteriorado cuyo tren de aterrizaje se había desprendido en pleno vuelo. Había poco que pudiera hacer para evitar una recesión. En cambio, Powell es el capitán de un cohete de SpaceX —uno diseñado para soportar cambios extremos de temperatura (económica)— y que por tanto puede dispararse hasta la Luna y descender suavemente desde el espacio exterior hasta su punto de aterrizaje en una pieza. Gráfico 7 Balances domésticos robustos Balances patrimoniales sólidos de los hogares Balances patrimoniales sólidos de los hogares Ha habido cuatro pilares fundamentales detrás de esta fortaleza estructural: 1) bajo apalancamiento de los hogares, 2) un sector corporativo dinámico, 3) escasez de vivienda y 4) política fiscal acomodaticia. Es útil evaluar el estado actual de cada una de estas corrientes favorables. Los balances de los consumidores siguen siendo robustos. La deuda de los hogares se mantiene muy por debajo de los promedios históricos (Gráfico 7). El sector corporativo también permanece en buena salud. La productividad laboral ha sido un impulsor significativo del crecimiento de las ganancias (Gráfico 8 – panel 1). Un reciente documento de trabajo del FMI muestra que la mayor parte de esta ganancia de productividad se ha concentrado en el sector de la información y en los servicios profesionales, dos sectores sobrerrepresentados en EE. UU. respecto al resto del mundo (Gráfico 8 – panel 2 Gráfico 8 La productividad (particularmente en tecnología) ha mantenido las ganancias sólidas Informe mensual TAA: ¿Puede Powell clavar el aterrizaje antes de la tormenta Trump? Informe mensual TAA: ¿Puede Powell clavar el aterrizaje antes de la tormenta Trump? Independientemente del origen de esta fortaleza, la tendencia en las ganancias corporativas es importante porque las ganancias se contraen mucho antes de cada recesión en EE. UU. en los últimos 70 años. La lógica tras esta relación es simple. Cuando el crecimiento de las ganancias es robusto, hay muy pocas razones para que las empresas despidan empleados (Gráfico 9 – panel 1 y 2). Solo después de que las ganancias caen la tasa de desempleo empieza a aumentar con fuerza, conduciendo a una recesión y a un desempeño sostenido inferior de la renta variable respecto a los bonos (Gráfico 9 – panel 3). No hay precedentes de una recesión inminente después de un período de crecimiento corporativo positivo y acelerado en la era de posguerra. Gráfico 9 Las ganancias deben contraerse para desencadenar una recesión Las ganancias deben contraerse para desencadenar una recesión. Las ganancias deben contraerse para desencadenar una recesión. ¿Y la vivienda? En los últimos años este sector tomó por sorpresa a mucha gente (¡incluyéndonos a nosotros!). La vivienda fue impermeable a unas tasas de interés históricamente altas. La demanda excesiva de viviendas en 2021 y 2022, así como la oferta limitada en el mercado de viviendas existentes, se combinaron para provocar el mayor atraso de inventario de viviendas registrado (Gráfico 10 Hoy en día, hemos trabajado la mayor parte de estos atrasos y los inventarios han regresado a niveles prepandemia. Es crucial que, como ha mostrado nuestro colega Peter Berezin, las unidades en construcción han comenzado a contraerse (Gráfico 11). Históricamente, esto ha sido una señal de alarma, ya que la vivienda es el sector más sensible a las tasas de interés y, pese a ser relativamente pequeño, la inversión residencial es un motor importante de los ciclos económicos. Aunque podría haber algunos meses antes de que la inversión residencial se vuelva recesiva, este motor económico en gran medida ha perdido impulso. Gráfico 10 El atraso de inventario hizo a la vivienda impermeable a las tasas La acumulación de inventario hizo al mercado de la vivienda inmune a las tasas La acumulación de inventario hizo al mercado de la vivienda inmune a las tasas Gráfico 11 La construcción ha empezado a contraerse La construcción ha comenzado a contraerse La construcción ha comenzado a contraerse Lo mismo sucede con la política fiscal. El gasto público no podrá aportar más crecimiento a la economía ya que es poco probable que el déficit aumente más (Gráfico 12 Gráfico 12 La fiscalidad se convertirá en un freno al crecimiento La política fiscal se convertirá en un lastre para el crecimiento La política fiscal se convertirá en un lastre para el crecimiento Desviado por la tormenta Trump “Esta vez es diferente” siempre es una base peligrosa para una tesis de inversión. En este ciclo hemos aprendido que “Esta vez no puede ser diferente” podría ser igual de arriesgado. La confluencia de cuatro potentes motores económicos ayudó a aislar la economía estadounidense de un ciclo de subidas extremadamente agresivo más allá de nuestras expectativas y sin parangón con ningún otro ciclo anterior. ¿Qué implica nuestro análisis para la estrategia de inversión de aquí en adelante? En teoría, la economía podría seguir funcionando con solo dos de sus cuatro propulsores. Aún podría haber suficiente empuje por parte de los consumidores y las empresas estadounidenses para evitar una recesión. El problema es que este aterrizaje suave ya está completamente descontado por los mercados. El sentimiento hacia la renta variable sigue extremadamente elevado mientras los analistas esperan un crecimiento del BPA del 17% para el S&P500 en 2025 (Gráfico 13). Entretanto, la mayor probabilidad de que Trump gane las elecciones en EE. UU. ha impulsado las tasas de interés al alza, ya que los inversores descuentan una barrida roja (Red Sweep), un escenario que daría al expresidente carta blanca para gastar a su antojo. Gráfico 13 El sentimiento de la renta variable y las expectativas de beneficios están elevadas El sentimiento accionario y las expectativas de beneficios están elevados El sentimiento accionario y las expectativas de beneficios están elevados Gráfico 14 La reciente subida de los rendimientos ha descarrilado la recuperación de la vivienda El Reciente Aumento De Los Rendimientos Ha Descarrilado La Recuperación Del Mercado Inmobiliario El Reciente Aumento De Los Rendimientos Ha Descarrilado La Recuperación Del Mercado Inmobiliario Gráfico 15 Hasta los hogares más acomodados han empezado a sentir la presión Incluso los hogares ricos han empezado a sentir la presión Incluso los hogares ricos han empezado a sentir la presión Irónicamente, esto ha alejado a la economía de su trayectoria de aterrizaje suave. Tras caer al 6% principios de este año, las tasas hipotecarias han vuelto a subir hasta el 7% —una combinación de rendimientos gubernamentales más altos y un gran spread hipotecario debido al aumento de la volatilidad de las tasas (Gráfico 14 – panel 1). El nivel del 6% es importante porque parece ser el punto en el que los consumidores están dispuestos a empezar a reincorporarse al mercado hipotecario (Gráfico 14 – panel 2Tabla 1Gráfico 15). Tabla 1 La vivienda necesita una tasa hipotecaria por debajo del 6% para estabilizarse Informe Mensual de TAA: ¿Podrá Powell lograr el aterrizaje perfecto antes de la tormenta Trump? Informe Mensual de TAA: ¿Podrá Powell lograr el aterrizaje perfecto antes de la tormenta Trump? Teniendo esto en cuenta, creemos que es prudente mantener una posición defensiva por ahora. Una subida de las tasas de interés causada por primas fiscales y no por el crecimiento es negativa para los activos de riesgo (Gráfico 16Gráfico 17). Gráfico 16 La acción del mercado sugiere que las primas fiscales están impulsando los rendimientos La acción del mercado sugiere que las primas fiscales impulsan los rendimientos La acción del mercado sugiere que las primas fiscales impulsan los rendimientos Gráfico 17 Los inversores no están particularmente bajistas en duración Los inversores no son particularmente bajistas respecto a la duración Los inversores no son particularmente bajistas respecto a la duración Dicho esto, estaremos atentos para convertirnos en alcistas totales de bonos si las tasas suben demasiado. No solo Estados Unidos no es Zimbabue, sino que la subida de las tasas será finalmente auto-limitada, ya que casi con seguridad provocaría una recesión. Los bonos gubernamentales resultan cada vez más atractivos para los inversores a largo plazo. Considere que en el caso de un aterrizaje suave, donde la Fed sigue su trayectoria de política proyectada, un Treasury a 10 años tendría un rendimiento total del 12% desde los niveles actuales, mientras que una recesión devolvería un 17% (Tabla 2 Tabla 2 El perfil riesgo-recompensa a 12 meses de los Treasurys es atractivo Informe mensual TAA: ¿Puede Powell clavar el aterrizaje antes de la tormenta Trump? Informe mensual TAA: ¿Puede Powell clavar el aterrizaje antes de la tormenta Trump? Gráfico 18 La brecha de valoración EE. UU. vs resto del mundo supera a los fundamentales Informe mensual TAA: ¿Puede Powell clavar el aterrizaje antes de la tormenta Trump? Informe mensual TAA: ¿Puede Powell clavar el aterrizaje antes de la tormenta Trump? Renta variable: Si bien la mayor parte de la prima de valoración del mercado de acciones de EE. UU. frente al resto del mundo se debe a mejores fundamentales (menos apalancamiento, márgenes más altos y mejor rentabilidad), las valoraciones en EE. UU. han empezado a superar las diferencias de calidad (Gráfico 18Gráfico 19Gráfico 20 Gráfico 19 El BPA fuera de EE. UU. vuelve a crecer Las EPS fuera de Estados Unidos vuelven a crecer Las EPS fuera de Estados Unidos vuelven a crecer Gráfico 20 China es mucho más barata que Japón en los 90 China era mucho más barata que Japón en los años 90 China era mucho más barata que Japón en los años 90 Divisas: A diferencia de otros países con monedas defensivas como Japón y Suiza, que tienen grandes posiciones netas de inversión internacional (NIIP) positivas, EE. UU. tiene un NIIP negativo. El dólar es defensivo porque, a pesar de que sus pasivos internacionales eclipsan sus activos, paga menos interés del que recibe —resultado de su estatus de moneda de reserva. Sin embargo, esta dinámica está destinada a revertirse en unos años (Gráfico 21Gráfico 22). Gráfico 21 El dólar podría perder su carácter defensivo El dólar podría perder su carácter defensivo El dólar podría perder su carácter defensivo Gráfico 22 El RBA debería recortar menos que la Fed La RBA debería recortar menos que la Fed La RBA debería recortar menos que la Fed Renta fija: ¿Cuánto más podrían subir los rendimientos si Trump es elegido? El presupuesto de Liz Truss en el Reino Unido en 2022 ofrece una guía. La curva de bonos del Reino Unido se empinó en 90 puntos básicos respecto a la curva de EE. UU. durante ese episodio (Gráfico 23Gráfico 24estrategas de bonos estadounidenses, los MBS ofrecen un buen perfil riesgo-recompensa tanto en un aterrizaje suave, sin aterrizaje o en escenario de recesión. Mantenemos una postura positiva. Gráfico 23 El presupuesto Truss proporciona una hoja de ruta para los rendimientos El presupuesto de Truss ofrece una hoja de ruta para los rendimientos El presupuesto de Truss ofrece una hoja de ruta para los rendimientos Gráfico 24 El crédito está caro Informe mensual de TAA: ¿Puede Powell clavar el aterrizaje antes de la tormenta Trump? Informe mensual de TAA: ¿Puede Powell clavar el aterrizaje antes de la tormenta Trump? Materias primas: La capacidad de producción de petróleo de reserva sigue siendo elevada, lo que es un riesgo dado que la OPEP ha perdido una cuota de mercado significativa frente a EE. UU. que está deseando recuperar (Gráfico 25 – panel 1Gráfico 25 – panel 2Gráfico 26). Gráfico 25 Preocupaciones de oferta y demanda para el petróleo Preocupaciones Sobre la Oferta y la Demanda del Petróleo Preocupaciones Sobre la Oferta y la Demanda del Petróleo Gráfico 26 Bitcoin a punto de romper al alza Bitcoin a punto de romper al alza Bitcoin a punto de romper al alza Gráfico 27 Valoraciones de infraestructuras más baratas en Europa Valoraciones de infraestructura más económicas en Europa Valoraciones de infraestructura más económicas en Europa Mercados privados y alternativas: Nuestras principales preferencias son Infraestructura no básica y Capital Riesgo. En su reciente Quarterly, nuestro equipo de PMA añadió Infraestructura a su marco. Las valoraciones de infraestructura han disminuido desde sus máximos pero siguen mixtas (Gráfico 27   Juan Correa, Vicepresidente Asociado Asignación Global de Activos JuanC@bcaresearch.com Asignación de activos recomendada Cartera modelo (términos en USD)