Sorry, you need to enable JavaScript to visit this website.
Skip to main content

Fixed Income

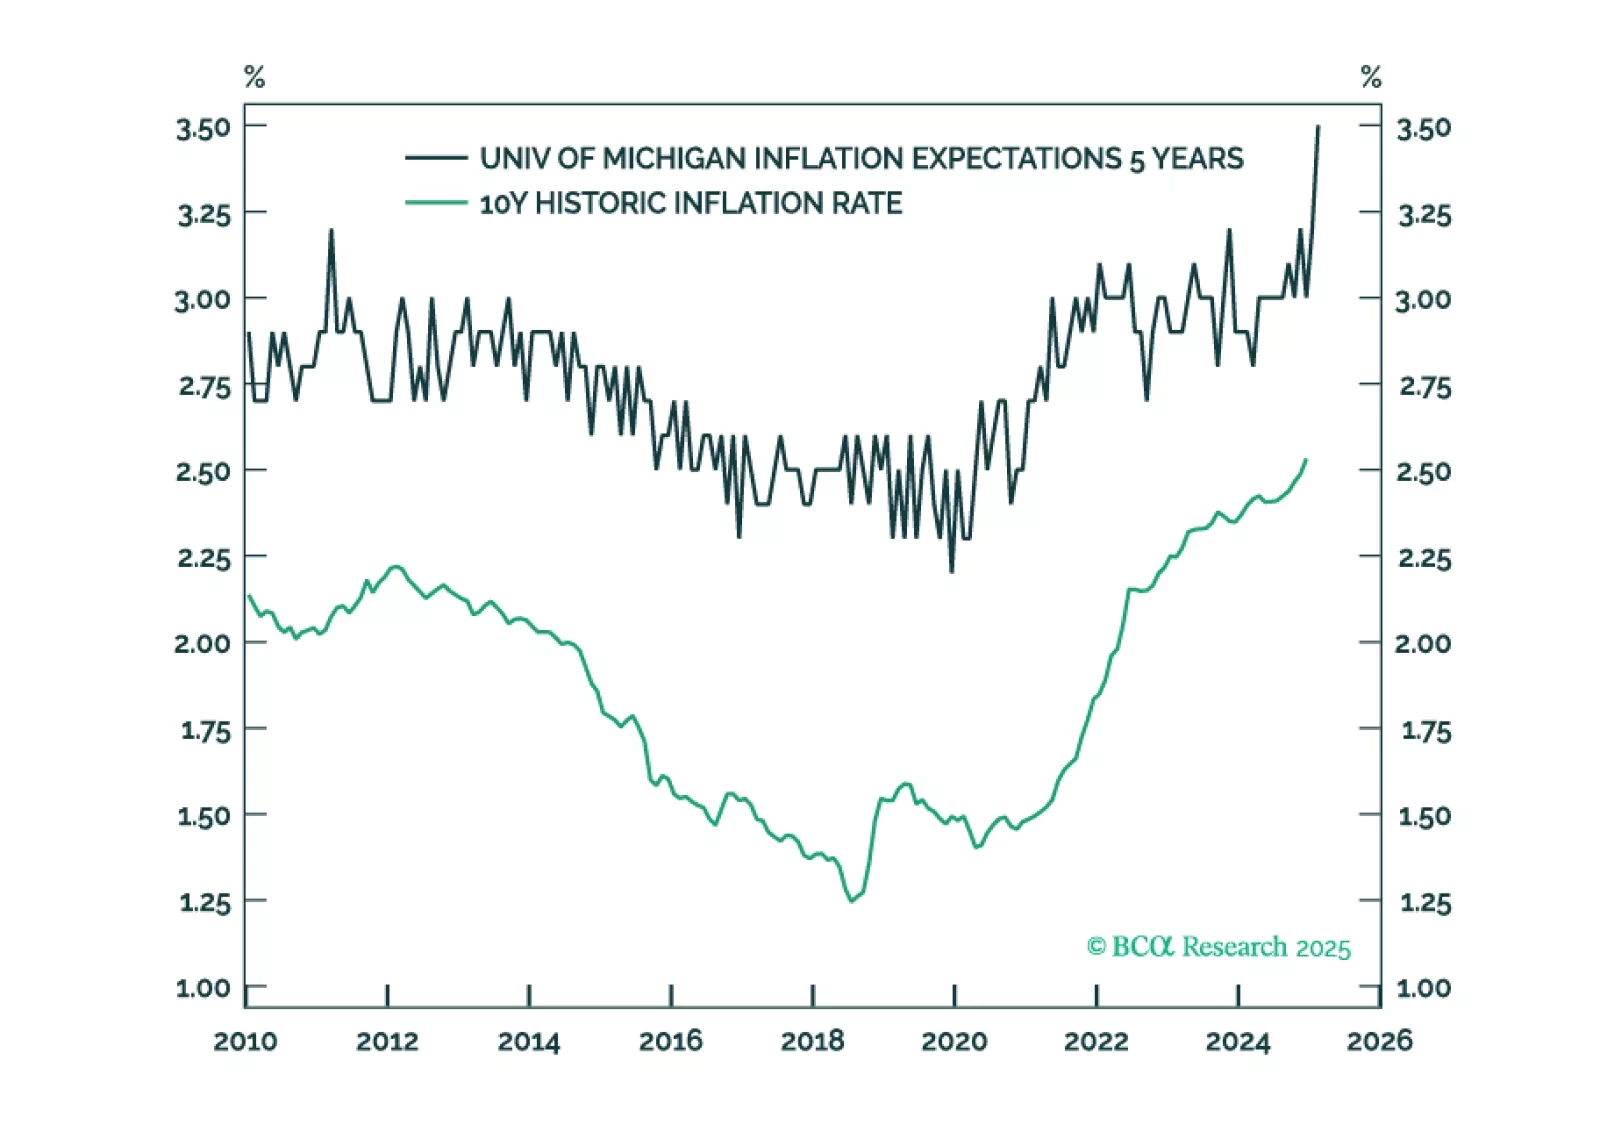
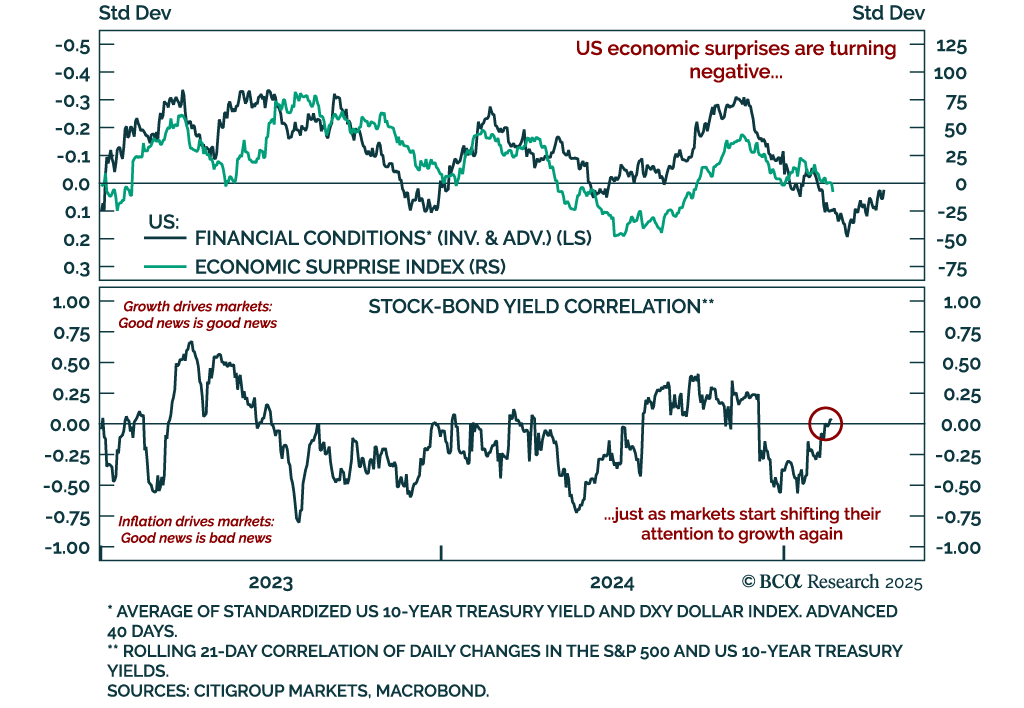
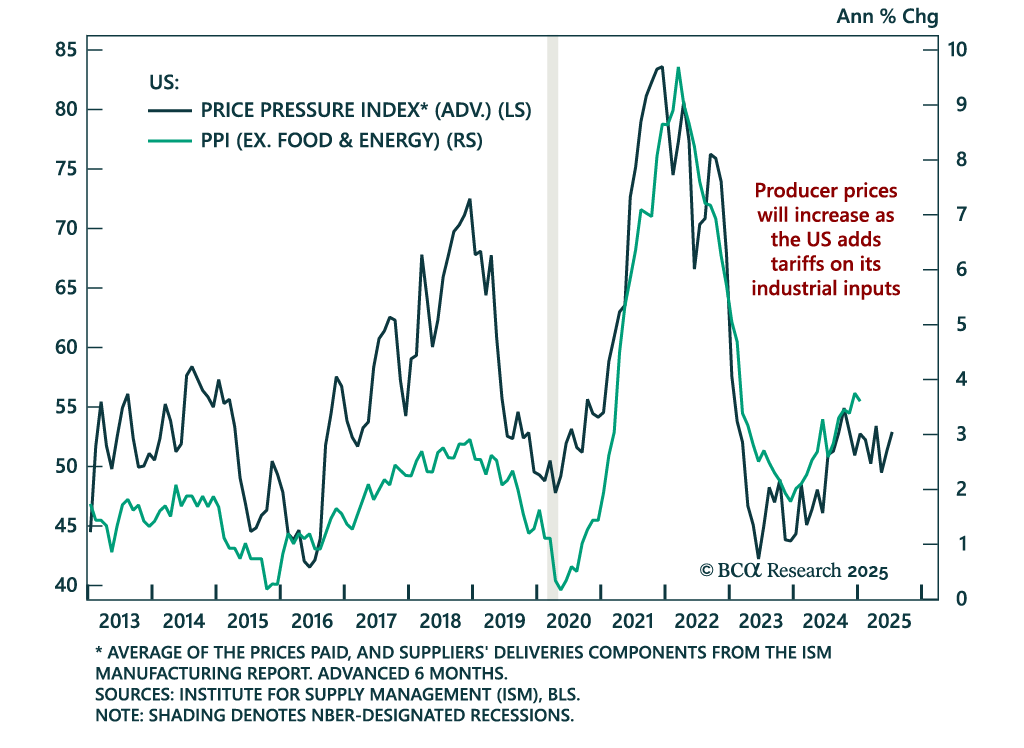
The US (and the UK) is staring down the barrel of a ‘mini-stagflation’ until a deflationary shock arrives to neutralise it. We describe a likely source for the deflationary shock and list three investment conclusions that are valid irrespective of how long it takes for the deflationary shock to arrive. Plus: RCI.B is deeply oversold and ripe for a rebound.

The House of Representatives passed a Budget Resolution bill that adds $2.8tn to the deficit by 2034. Our Geopolitical strategists highlighted during our BCA Live & Unfiltered meeting that the Senate is likely to modify it by increasing tax cuts and…
Fourth-quarter European negotiated wages growth cooled to 4.1% y/y, down from the 5.4% peak seen in Q3. The cooling is in line with the ECB’s Wage Tracker showing wage growth decelerating to 1.3% by the end of the year. Labor demand is easing in Europe,…
Our Chart Of The Week comes from Chester Ntonifor, Chief Strategist for our Foreign Exchange and Global Fixed Income Strategy services.   A big macro trade over the last few years has been to shun US Treasuries, in favor of gold. The key driver has…
Two of our favorite indicators recently sent important signals. The first one, the short-term stock-bond yield correlation, recently drifted back to neutral territory after being negative. The correlation had been negative since December, reflecting increased…

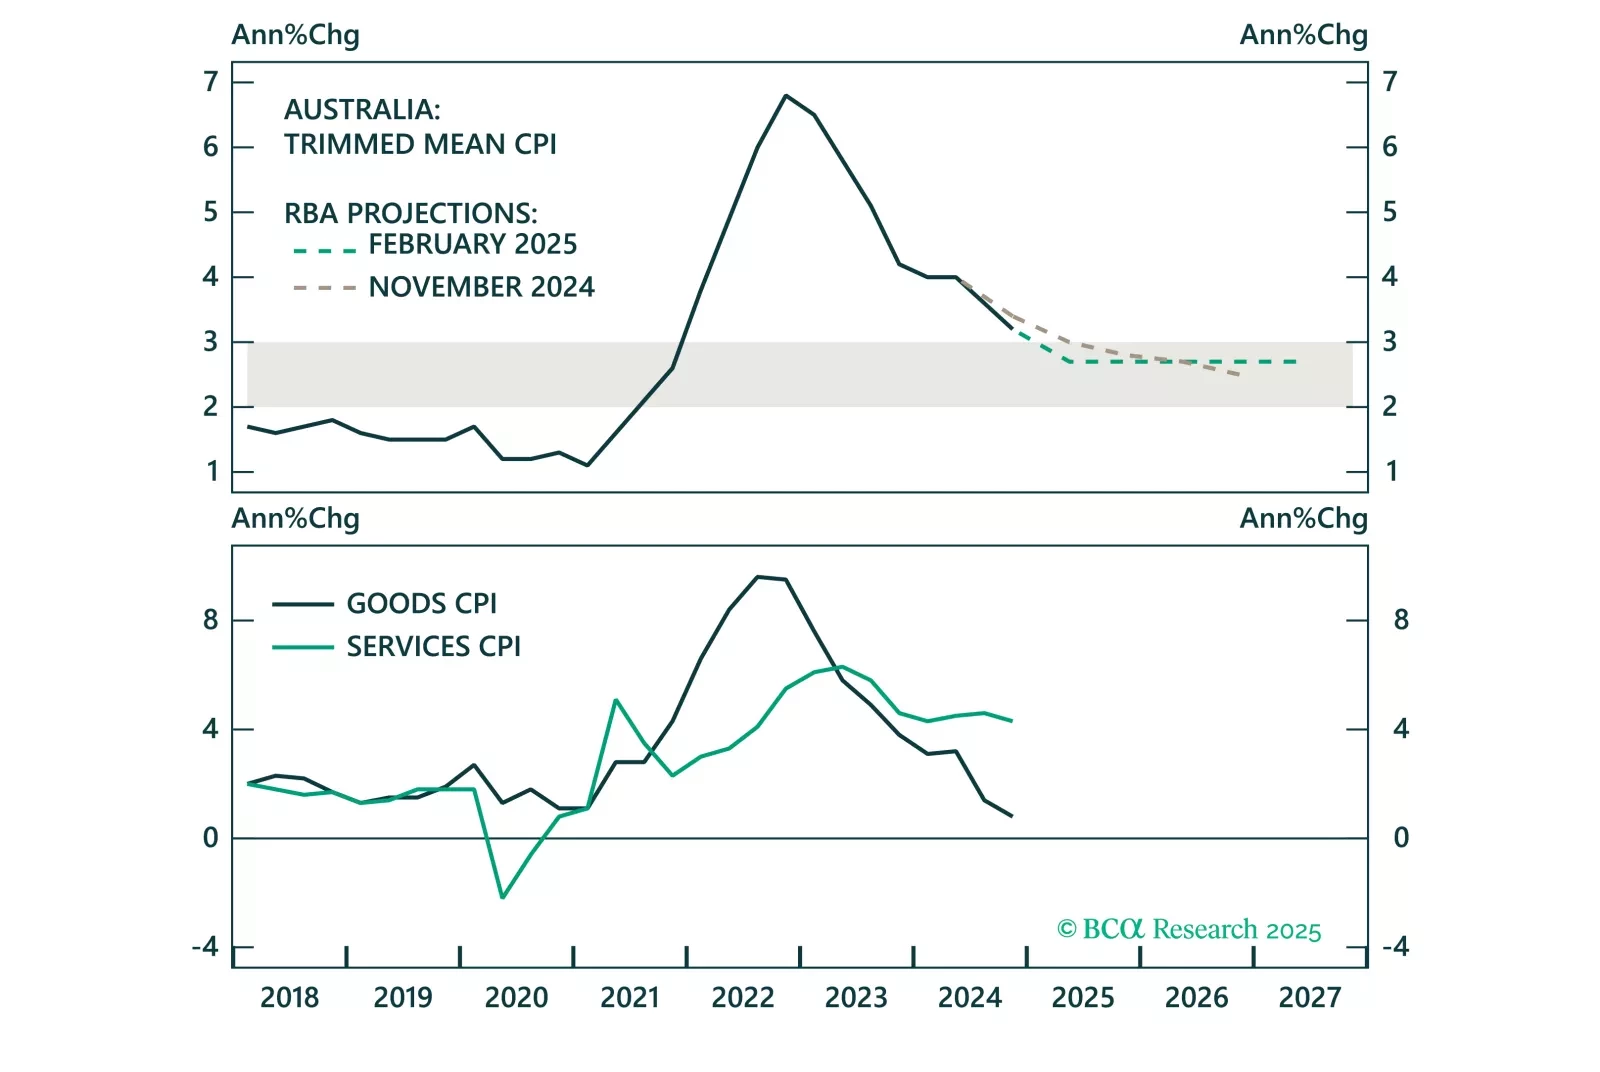
Overnight, the RBA cut the cash target rate for the first time since 2022, marking the beginning of the policy easing cycle in Australia. However, the RBA will proceed cautiously with further rate cuts, given a tight labor market and still elevated services inflation. This will keep Australian government bond yields elevated versus global yields, benefitting the Australian dollar.

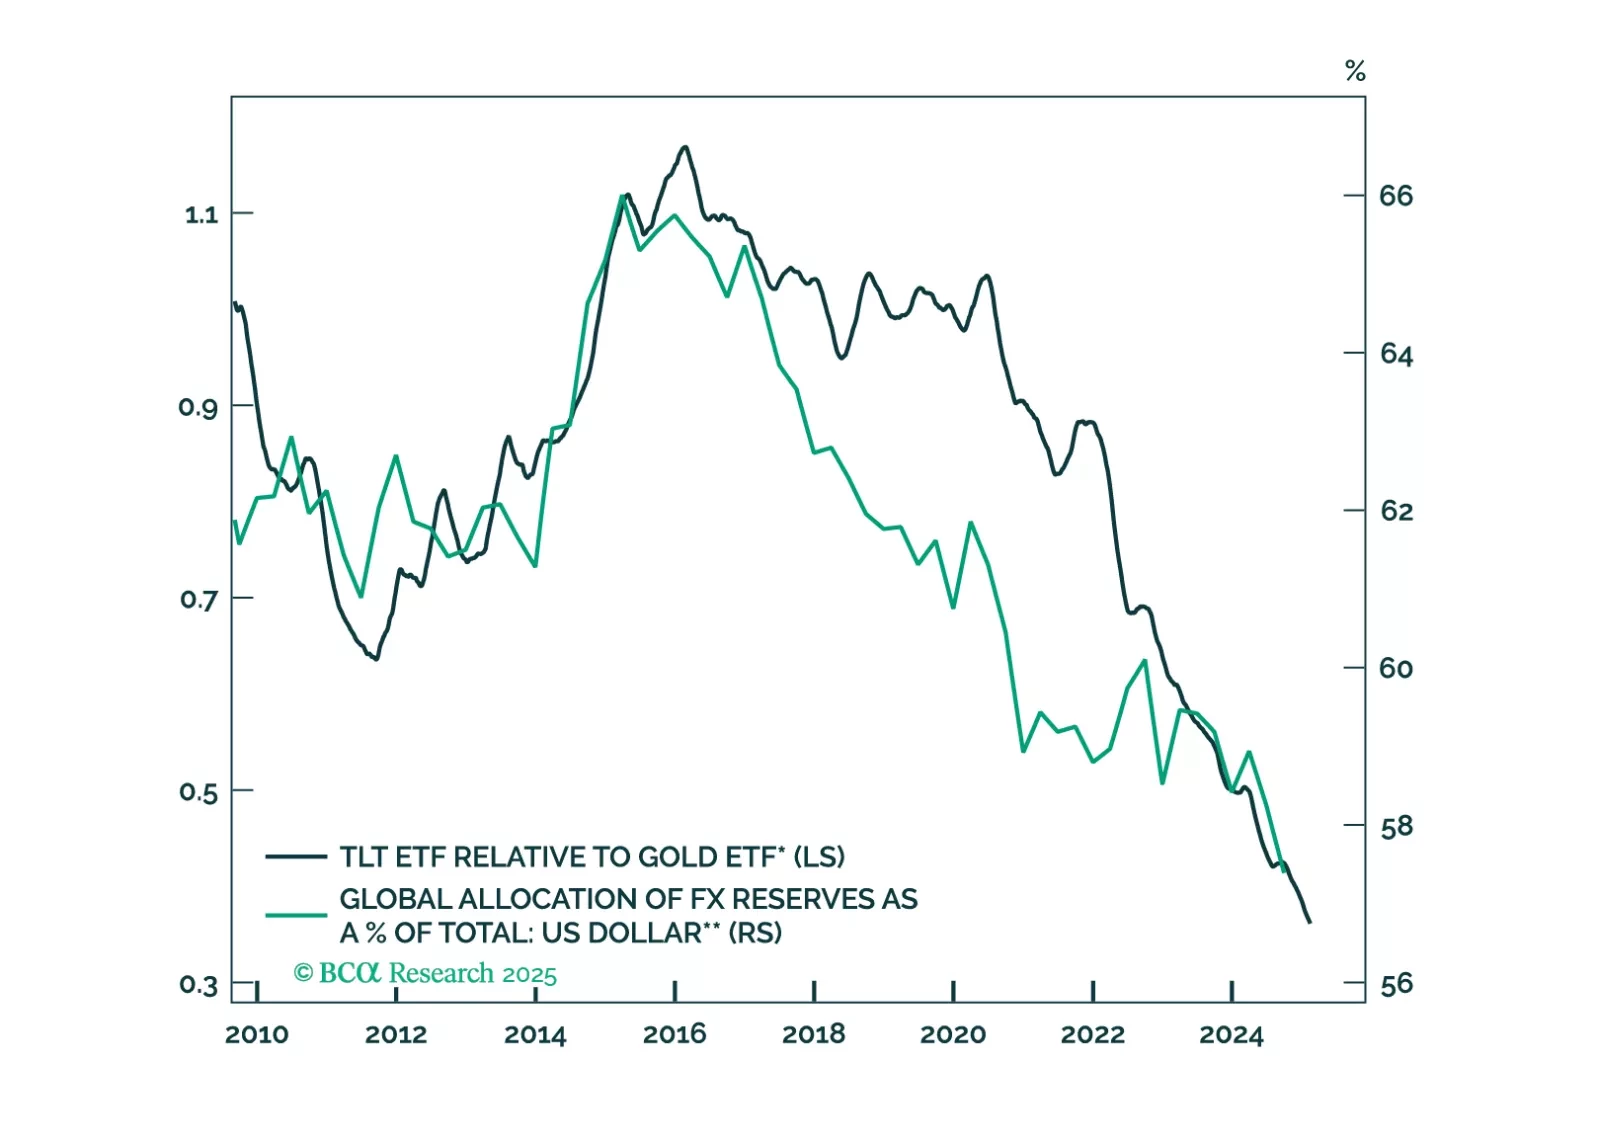
In lieu of all the geopolitical and economic news in media, this report looks at where next the dollar is likely to trend in the next one-to-three months. Our view is down, though on a cyclical horizon (six-to-twelve months), we would not be short the dollar, for now. 

Our Chart Of The Week comes from Jonathan LaBerge, Chief Strategist for our Special Reports Unit. Jonathan asks whether investors should be encouraged by the fact stocks are shrugging off US tariffs. The answer is no, because the same thing happened in…
The January US Producer Price Index came in slightly hotter than estimates, but decelerated to 0.4% m/m (3.5% y/y) from an upwardly-revised 0.5% in December. Core PPI, excluding food, energy, and trade services, was also stronger than expected, but also…

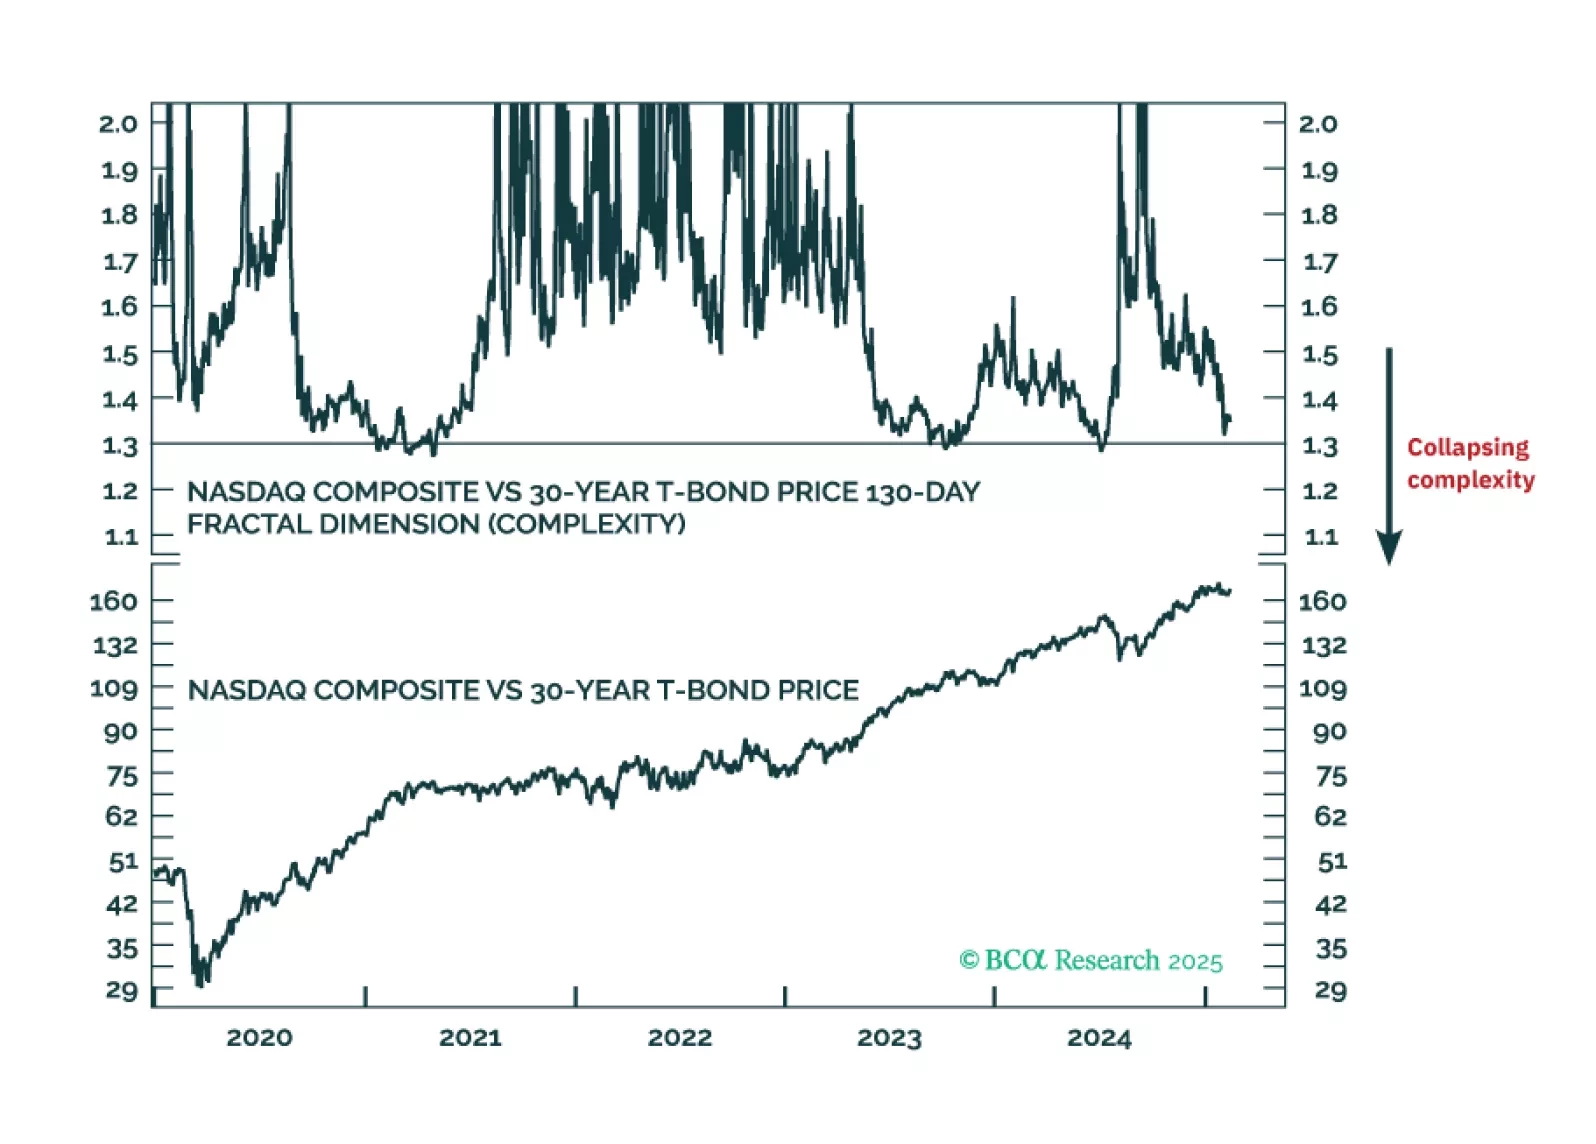
If the 130-day complexity of the Nasdaq versus 30-year T-bond collapsed to 1.30, it would signal the risk of a -20 percent market slump. This indicator, at 1.37, is not yet at critical, but we recommend that you keep a close eye on it on our website. Plus: an update on our recent trades.