航空貨物&物流
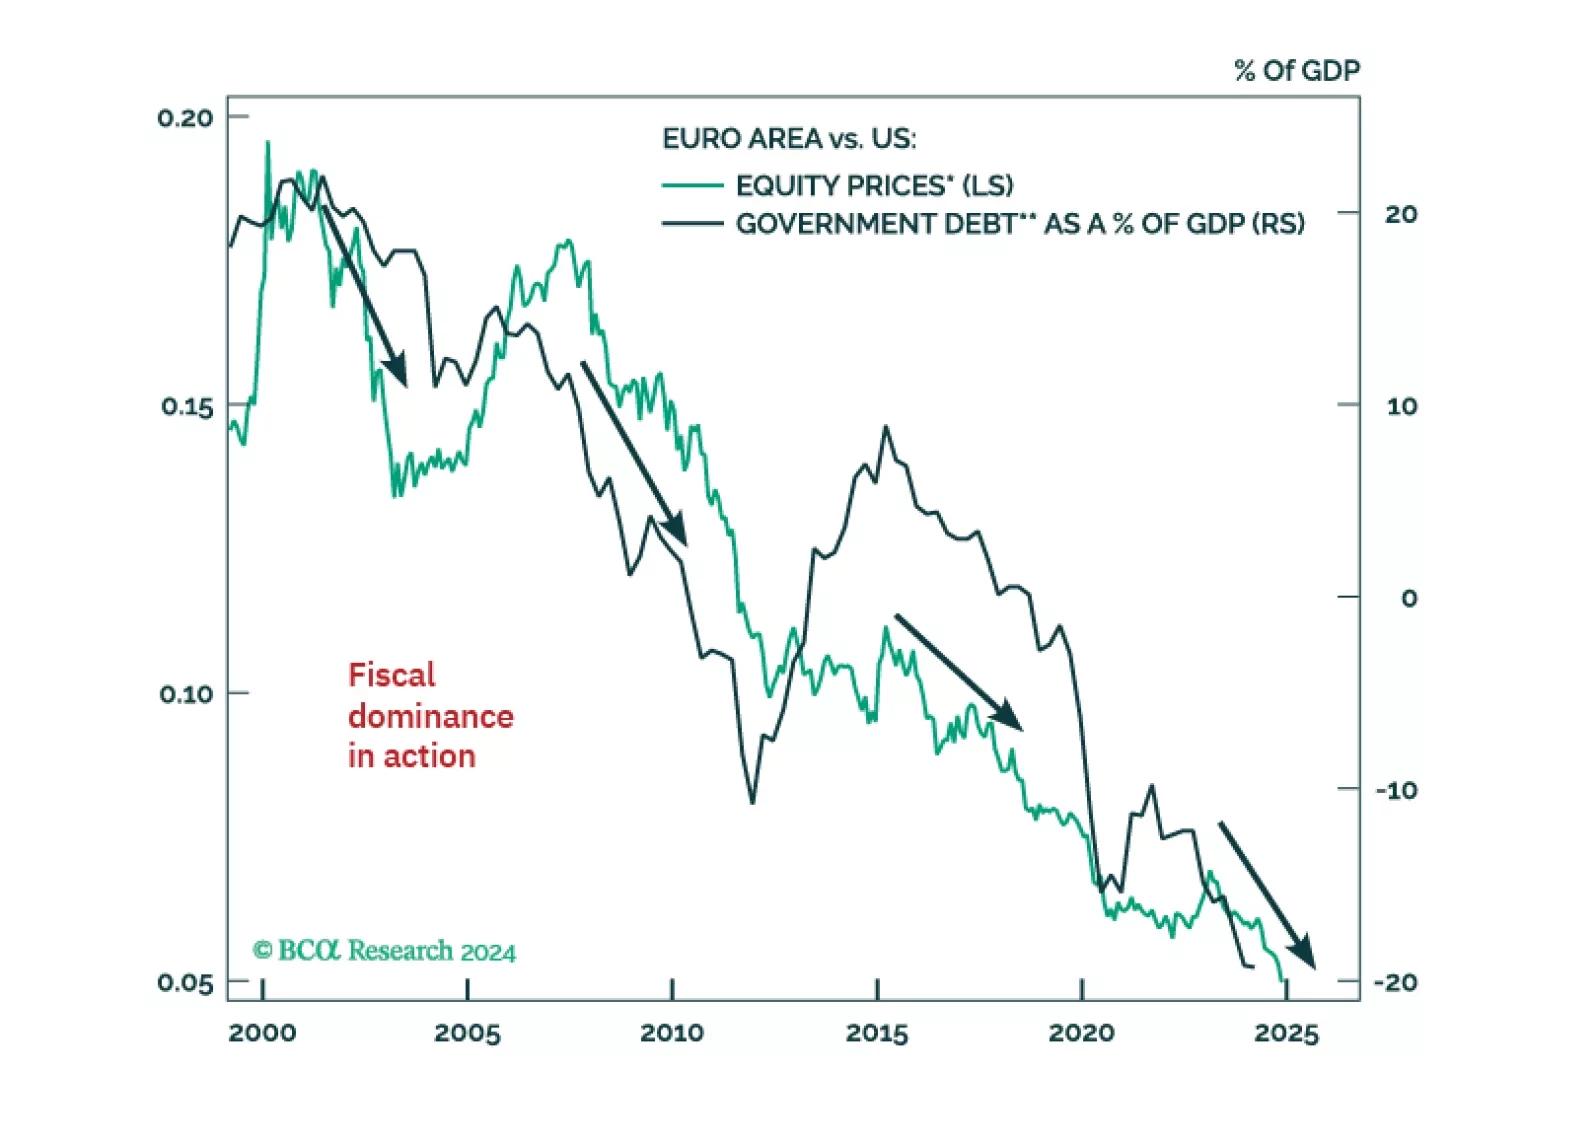
チャート 1
欧州資産:2016年よりも弱い
欧州資産:2016年よりも弱い
欧州市場は2007年7月以来アンダーパフォームしており、過去17年間で米国株に対して284%の遅れをとっている。一般に広まっている見方は、欧州は機能不全に陥り、そのビジネスモデルは壊れており、米国との新たな貿易対立が差し迫っているというものであり、それが欧州資産のさらなる割引や売りを正当化している。トランプ大統領の勝利以降、欧州株は2.2%下落したのに対し、スタンダード&プアーズ500は3.7%の上昇を記録し、ユーロは3.8%下落しており、トランプ勝利の可能性が高まっていた選挙前の2.7%の下落に拍車をかけている。チャート1はこれまでの市場の動きを2016年以降の反応と照らし合わせて示しており、欧州資産は最初の局面よりも劣後していることを示唆している。 欧州に対する否定的なセンチメントの多くは正当な根拠があるが、それらは陳腐化していたり誇張されている可能性がある。トランプのオーバルオフィスへの復帰は旧大陸に緊急感を生み、マリオ・ドラギが最近提案した生産性向上を促す政策の実現可能性を高めるかもしれない。その結果、米国資産に比べて生じている欧州資産の大幅な割引は、貿易戦争を巡る不確実性が収まれば長期投資家にとっての機会を提供する。 したがって本レポートでは、米国選挙後のトレード後のトレードを提唱する。公的市場の不確実性が少なくとも今後2四半期は支配的であろうが、プライベート・アセットは欧州へのエクスポージャーを得るための好ましい手段となる可能性がある。 現代のナラティブ:欧州は博物館である 欧州の問題点は投資家によく理解されており、株式に表れている22%の評価割引や米ドルに対するユーロの20%の割安さの背景にある。クライアントとの面談では同じ心配事が繰り返される:低い生産性、無形資産への投資率の低さ、イノベーションの欠如、そして衰退しつつあるドイツのビジネスモデル。この有害な組み合わせが欧州の生活水準と欧州企業の収益性を押し下げている。この文脈では、欧州資産の悲惨なパフォーマンスは理解しやすく、投資家はしばしば旧大陸を「休暇で訪れる素敵な博物館」と軽蔑的に表現する。 これらの課題はすべて事実である。欧州の生産性成長は2000年代以降、米国のそれを大きく下回っている(チャート2)。ドラギが指摘したように、純設備投資の鈍いペースが主要な原因である(チャート2、第2パネル)。すべての成長モデルは、資本集約度(生産関数における労働者1人当たりの資本量)を上げることが労働生産性の成長を決定する重要因であることを強調している。イノベーションの欠如がこれらの問題を複合化している。欧州の研究開発(R&D)は米国水準に大きく遅れ、R&D強度は生産性の主要な原動力の一つである(チャート3)。
チャート 2
生産性の低迷は設備投資の弱さを反映している
生産性の低迷は設備投資の弱さを反映している
チャート3
研究開発が不十分
研究開発が不十分
欧州の生産性が低迷している主たる原因の一つは、皮肉なことに、欧州連合内の統一性の欠如である。ユーロ懐疑派が嘆き悲しむほどには、加盟国の主権が十分に喪失されているわけではなく、欧州の首都はブリュッセルに対して驚くほど多くの権力を保持しており、これは米国の州都がワシントンDCに対して持つ権力よりも大きい。その結果、未完成の規制の寄せ集めが市場の断片化を悪化させ、欧州を不利にしている。 例えば、国際通貨基金(IMF)は最近、EU各国に存在する非関税障壁は物品に対して実質的に44%のアド・バローレム関税に相当すると推定した。米国の州間ではこれらの障壁はより小さく、およそ15%の関税に相当する。サービス部門では、EUの統合は物品市場よりさらに遅れており、規則や障壁は110%の関税に相当する1。その結果、欧州の企業は大型の設備投資プログラムやリスクの高い研究開発投資を資金調達するために必要な規模の経済を達成することがより困難になっている。EUにおけるマイクロ企業や小規模企業の比重が米国に比べて高いことは、このハードルを鮮明に示している(チャート4)。
チャート4
欧州の統合が不完全なため、規模の経済が実現できない
欧州の統合が不完全なため、規模の経済が実現できない
欧州の資金調達構造もまた、生産性を高める投資や研究開発を制約している。欧州の貸出は銀行が支配しており、企業の借入に占める比率は70%に達するのに対し、米国では26%であり、そこでは資本市場が主要な資金源である。銀行は資本市場ほど効率的にリスクを分散できない。そのため、欧州の銀行はリスク回避的であり、特に研究開発への資金供給に対して高いリスクプレミアムを要求する。加えて、資本市場の深さの欠如は、EUにおけるベンチャーキャピタル資金の少なさに寄与しており、これはリスクの高いR&Dを促進するもう一つの重要な要因である(チャート5)。最終的に、資本市場統合の欠如がこれらの欠陥の根底にある。欧州の資本市場は流動性も深みも米国市場に劣り、グローバルな資金を惹きつけられていない。したがって、欧州資産は米国資産よりも高いリスクプレミアムを被っている(チャート6)。
チャート5
リスクの高い研究開発を促進するためのベンチャーキャピタル資金が不足している
リスクの高い研究開発を促進するためのベンチャーキャピタル資金が不足している
チャート6
欧州のリスクプレミアムが打撃を受ける
欧州のリスクプレミアムが打撃を受ける
チャート7
ドイツのエネルギー政策は脆弱性を生んだ
ドイツのエネルギー政策は脆弱性を生んだ
ドイツ経済の弱さは欧州にとってさらなる重しになっている。パンデミック終結以降、ドイツのGDPはわずか0.3%の成長にとどまる一方で、ユーロ圏のその他の地域は1.1%成長している。この惨憺たるパフォーマンスの結果、投資家はドイツのビジネスモデルの存続可能性に疑問を投げかけている。 ドイツがロシアのエネルギー供給に大きく依存していたことは脅威となる依存関係を生み出した(チャート7)。しかし「安いロシア産天然ガスと中国市場に依存していた」という単純化された、かつ誤った格言は問題の本質を説明するのに役立たない。ロシアは決してドイツに「安価なエネルギー」を無償で提供したわけではない。実際、同国はこの世紀の初めの大部分において天然ガス価格を石油に連動させることで、欧州に対してむしろ割高な請求をしていた可能性が高い。ドイツはこの世紀を通じて持続的に高いエネルギーコストに直面してきたにもかかわらず、特に米国と比較して世界の輸出シェアを概ね維持してきた(チャート8)。これはドイツ製品が価格ではなく品質で競争してきたためである(チャート9)。
チャート8
エネルギー面でのハンディキャップがあったにもかかわらず、ヨーロッパは米国に市場シェアを失わなかった
エネルギー面でのハンディキャップがあったにもかかわらず、ヨーロッパは米国に市場シェアを失わなかった
チャート9
ヨーロッパの電力価格が収益性を圧迫
ヨーロッパの電力価格が収益性を圧迫
チャート10
ドイツのエネルギー集約型セクターは打撃を受けた
ドイツのエネルギー集約型セクターは打撃を受けた
しかし、ドイツ産業が対処することを学んだ持続的であったとはいえ管理可能なエネルギープレミアムは、ウクライナ戦争以降、圧倒的になった。ガスと産業用電力価格の急騰は、高く評価されたドイツの産業品質でも吸収しきれないほどであり、金属加工や化学製造といったドイツの主要産業セグメントに打撃を与えた。これらのエネルギー集約型セクターの生産と雇用は2022年以降、他の産業に比べて大きく遅れをとっている(チャート10)。成長への直接的な影響を超えて、高止まりしたエネルギーコストはドイツの収益性を損ねている。その結果、それらは設備投資の低水準に寄与し、生産性見通しに重くのしかかっている。公平を期すと、エネルギー調達の問題はドイツだけに固有のものではないが、この欧州の国で最も深刻である。もう一つの懸念は、多くのドイツ産業が現在中国の競争にさらされていることである。ドイツ経済研究所(Institut der Deutschen Wirtschaft、IW)によれば、約900社を対象としたパネル調査で約3分の2が中国を大きな課題と認識し、3分の1以上が中国企業との直接の競合を報告している。いくつかの例は示唆に富む。10年前、中国の化学品輸出はドイツの化学品出荷量の15%に相当していたが、現在では40%を占める。同様に、2020年に中国は世界最大の自動車輸出国としてドイツを追い抜いた(チャート11)。さらに懸念されるのは、中国製の電気自動車(EV)がドイツ車に比べて価格で約30%安く、消費者がEVを購入する際の主要な差別化要因である高度なソフトウェアをより洗練された形で提供している点である。中国からのこの競争はドイツの自動車産業を圧迫している。ドイツの政治は麻痺に拍車をかけている。その規制環境は複雑でリスクテイクを制約している。法人税率は30%と高水準であり、G10の中でも高い水準にある(チャート12)。構造改革は有益だが、現連立政権は常に内部で争いを続けており、その結果として財務相クリスチャン・リンドナーの解任と政府の崩壊に至った。政府全体が対外競争への対応や変動する世界環境がドイツの輸出機械にもたらす課題に対処できていない。その結果、ドイツの経済政策不確実性指数は1994年の100から現在では666へと跳ね上がり、G10で最も高い水準になっている(チャート13)。大きな不確実性は投資へのさらなる抑止力となり、ドイツの生産性の遅れを一層強調している。
チャート11
中国が自動車戦争で勝利している
中国が自動車戦争で勝利している
チャート12
ドイツの重い法人税負担
ドイツの重い法人税負担
財政政策もさらなる重荷を生んでいる。2009年、ドイツは基本法を改正して構造的な年間赤字をGDP比0.35%に制限する、いわゆる債務ブレーキ(債務ブレーキ(Die Schuldenbremse))を導入した。この政策は財政の柔軟性を制約し、したがって経済ショックに対するドイツの対応能力を制限している。OECDおよびIMFの両者によれば、ドイツはより強い成長を促すために政府投資を増やし、労働力の再スキル化に支出し、公共交通システムを整備するとともに、炭素排出目標も達成する必要がある。しかし債務ブレーキを厳格に遵守しているため、ドイツ経済を近代化するために必要な支出は存在していない。公共投資の対GDP比はドイツは他の主要経済よりも低い(チャート14)。
チャート13
ドイツの経済的不確実性は痛いほど高い
ドイツの経済的不確実性は痛いほど高い
チャート14
ドイツの債務ブレーキは公共インフラを破壊している
ドイツの債務ブレーキは公共インフラを破壊している
結論: 欧州は多くの周知の構造的問題に直面している。すなわち、生産性成長が低く、それが生活水準と収益性を押し下げている。この低生産性は投資水準の低迷を反映している。これらはEUの不完全な市場統合に起因しており、規模の経済を創出して大規模な設備投資や研究開発を効率的に資金調達する可能性を妨げている。ドイツの最近の苦境は欧州資産を取り巻く陰鬱さにさらなる拍車をかけている。この有害な混合が欧州資産の低迷とその評価に織り込まれた大きなディスカウントを説明している。 緊縮財政を忘れてはならない
チャート15
かつて生産性が低かったにもかかわらず、欧州は大幅にアウトパフォームしていた
かつて生産性が低かったにもかかわらず、欧州は大幅にアウトパフォームしていた
ヨーロッパとドイツが直面している構造的な問題は実在するが、それが全てではない。例えば、それらは世紀を通じて持続してきた。EUの共通市場は2000年代初頭でさえ不完全であり、その時期には欧州株は米国株を上回っていた(チャート15)。 景気循環的な要因も活動を抑制し、設備投資に対して大きな抑止力を生み出し、したがって生産性と収益性を抑えた。 これらの景気循環的な逆風の核心には、グローバル金融危機(GFC)およびソブリン債務危機以降に欧州各国に課された過度の緊縮財政がある。財政緊縮は公的部門の債務負担を軽くするために周辺国に課された。前述したようにドイツも同じ足かせに自らを縛りつけた。名目GDP成長を抑えることにより、欧州全体の緊縮財政は民間セクターのデレバレッジを苦痛なものにした。その結果、欧州は長期にわたる債務のデレバレッジ過程に直面し、国内需要をさらに押し下げた。
チャート 16
財政政策は相対的な成長とリターンに大きな影響を与える…
財政政策は相対的な成長とリターンに大きな影響を与える…
米国とユーロ圏の比較は参考になる。グローバル金融危機以降、欧州の財政政策は米国よりも著しく引き締められていた。両地域の財政姿勢の差は、米国がパンデミックに対して巨額の対応を行った一方で欧州がはるかに控えめな対応を採った2022年にGDPの3.9%にまで達した。米国の成長のアウトパフォーマンスは相対的な財政政策の推移に沿った(チャート16、上段)。 財政政策の影響は成長にとどまらず、収益率にも波及した。チャート16の下段が示すように、欧州が過度の財政緊縮を選択したことで、米国では投下資本利益率がユーロ圏に比べて拡大した。 これは生産性に重要な含意を持つ。企業は正味現在価値を高める機会を見いだしたときに投資を行う。財政緊縮は国内需要を抑えることで経済の収益率を低下させるため、企業が選べる潜在的な投資の幅を制限する(チャート17)。欧州の緊縮の裏返しは、米国の無分別な財政刺激への傾倒である。2016年に米国が財政ポピュリズムへ大きく舵を切って以来、米国はヨーロッパに比べて財政支出を4倍にした(チャート18)。その一部は確かに生産性を高める設備投資に充てられた。しかし多くはより高いGDP成長率に燃料を供給し、米国企業が欧州の同業他社に比べてより高い収益を享受することを可能にした。
チャート17
…そして、リターンが設備投資を左右する
…そして、リターンが設備投資を左右する
チャート18
米国の財政的狂宴 対 欧州の厳しい時期
米国の財政的狂宴 対 欧州の厳しい時期
チャート19
周辺国のデレバレッジがドイツに打撃を与えた
周辺国のデレバレッジがドイツに打撃を与えた
緊縮財政は債務ブレーキが引き起こした被害を超えてドイツの困難に寄与した。欧州の周辺国が債務負担を減らすために国内需要を削減すると、輸入は崩壊した。ある国の輸入は別の国の輸出である。債務危機が欧州を襲った時点で、ドイツの対大陸輸出はGDPの33%を占めていた。したがって周辺国の民間セクターがデレバレッジを進めると、ドイツの対欧州輸出は崩壊した(チャート19)。欧州の銀行システムの不健全さがこれらの問題を増幅した。2014年までに、イタリアとスペインの不良債権比率はそれぞれ17%超および9%超に跳ね上がり、銀行は著しく資本不足となっていた。加えて金利は急落し、欧州中央銀行の預金金利は2014年6月にマイナス圏に沈んだ。この組み合わせは欧州銀行の自己資本利益率を壊滅させ、2014年10月に2.4%という底を打った。その結果、欧州の銀行は引き締めを行い、信用の供給を制約し、それが周辺国における消費と投資(住宅投資および非住宅投資)をさらに傷つけた。 要点:欧州の生産性低下は欧州の市場断片化の結果であるだけでなく、過去十年の厳しい緊縮財政の帰結でもある。緊縮財政はデフレ環境を生み出し、民間セクターのデレバレッジを複雑にした。この組み合わせは国内需要を押し下げ、収益率を著しく損ない、投資率の低下、生産性成長の低下、トレンドGDP成長率の低下を招いた。 念のため言えば、我々の推奨は欧州が米国の度を越した財政拡張を受け入れるべきだというものではない。それには固有のリスクがある。例えば、我々は債券利回りの危険な上昇に伴い米国の財政バラマキ路線が終焉を迎えると予想している。2 したがって、極めて浪費的な財政政策によって大きく押し上げられた米国の欧州に対するアウトパフォーマンスは、欧州が何をしようともほとんどの場合終わる可能性が高い。しかし、ドイツの債務ブレーキと米国の「酔っ払い水夫」的なアプローチの間には、ある程度の穏健な財政政策の水準が存在すべきである。 助けてください、フリードリヒ・メルツ、あなたは私の唯一の希望です ヨーロッパの不振は投資家の間に悲観論を助長してきました。しかし、ヨーロッパを押し下げている多くの要因は今後数年で好転する可能性が高いです。 ドイツの政治 社会民主党(SPD)主導の連立政権の崩壊は、政策のリセットの可能性を開きます。キリスト教民主同盟(CDU)の指導者であるフリードリヒ・メルツは、アンゲラ・メルケルの比較的停滞した統治からの大きな逸脱を示しています。メルケルは財政的には保守的でしたが、改革者ではありませんでした。彼女はユーロ圏危機を巧みに導いたものの、必ずしも創造的ではなく、皮肉なことに彼女の前任のゲアハルト・シュレーダー首相の下でSPDが行った親企業的改革に主に乗っていたにすぎません。 メルツは2004年に政治の世界を離れ、CDU党首の座を巡るメルケルとの争いに敗れました。その後民間部門に入り、ブラックロックの監査役会の議長を務めました。2008年には『もっと大胆に資本主義を』という書籍を刊行しました。したがって、メルツはCDUを親企業的モデルへと大きくシフトさせる存在を表しています。 さらに、CDU主導の連立であれば債務ブレーキ規則を修正しても政治的反発は相対的に小さいでしょう。左派寄りの政党が財政政策を行うのは常に困難であり、右派の野党は無責任だと非難するからです。しかし、CDUは政権を握れば手の内の余地がある可能性が高いと考えられます。
チャート20
はじめまして、メルツ首相。
はじめまして、メルツ首相。
現在の世論調査はCDUが選挙に容易に勝つことを示唆しています(図表 20)。問題は彼らが親企業の自由民主党(FDP)だけと連立を組んで政権を形成できるかどうかです。我々の見解では、CDU、FDP、そして緑の党による「ジャマイカ連立」はCDUが主導権を握り、生産性を高める規制緩和の議題を実行しつつ、財政政策を景気循環に対抗する役割へ戻すことを可能にすると考えます。 デレバレッジの終焉 ドイツ政治以外では、民間セクターのデレバレッジの終了がヨーロッパにとって決定的な逆風を止めるでしょう。デレバレッジは大陸の需要の弱さと低い投資水準の主要因でした。周辺国は痛みを伴う処方箋を受け入れ、貯蓄を増やし、経常収支の赤字を黒字に転換しました(図表 21)。その結果、債務負担は2021年のGDP比166%のピークから今日では124%に低下しています。 現在、ヨーロッパの民間セクターは流動的なバランスシートを享受しています。パンデミック前、欧州の家計は可処分所得の13%を貯蓄していました。パンデミック以降、その貯蓄率は平均16%となっています。同様に、企業部門の利益も上昇しています(ただし、先述した財政支出の差により米国ほどではありません)。結果として、ヨーロッパの民間セクターは高水準の預金残高と流動資産保有を抱えています(図表 22)。
図表21
周辺国の貯蓄:乏しい状態から健全へ
周辺国の貯蓄:乏しい状態から健全へ
チャート22
欧州の民間部門は流動性の高いバランスシートを保有している
欧州の民間部門は流動性の高いバランスシートを保有している
チャート23
強固な銀行システムが再び成長を支えるだろう
強固な銀行システムが再び成長を支えるだろう
欧州の銀行は2010年代の惨状をはるかに超えて回復しました。地域のティア1資本比率は17%に達し、バーゼルIIIの要件を大きく上回っています。同様に、不良債権の減少と金利上昇により銀行の純金利マージンは回復しています。その結果、銀行の株主資本利益率(RoE)は13.2%まで回復しており、これは世界金融危機前の水準に近い数字です(図表 23)。健全化した銀行は、ユーロ圏における信用供給が前の十年のように制約されないことを意味します。健全な銀行、流動的なバランスシート、そして低い債務負担は、ECB(欧州中央銀行)の緩和キャンペーンが需要を再活性化するのに有効であることを示しています。具体的には、ヨーロッパの周辺国が改善し、ドイツの信用需要と住宅価格が安定すれば、デレバレッジは終了すると予想されます。したがって、需要は強まり、収益率は上向き、投資は正常化するでしょう。デレバレッジがなければ、ヨーロッパの生産性は回復可能です。 財政差異 トランプ大統領の当選以来、米国の国債利回りは9月下旬以降62ベーシスポイント上昇しています。これはFRBの利下げキャンペーンが行われているにもかかわらずの動きであり、極めて異例の展開で、FRBがイールドカーブのコントロールを事実上失ったことを示唆しています。我々のジオマクロ・ストラテジーの見方では、これは米国におけるさらなる財政的浪費に対する克服しがたい重大な制約を意味します。 もし我々の見立てが正しく、米国が国債市場の消化不良により財政的浪費に対して逆風に直面するならば、米国とヨーロッパの成長成果の差、ひいては両地域企業部門の収益差は縮小するはずです。投資家は、ユーロ圏の総合的な財政赤字と債務水準が米国に比べて滑稽なくらい健全であることを思い出すべきです(図表 24)。同時に、債務コストは米国の債務動態の衝撃的な上昇に比べれば取るに足らないものであり(図表 25)、大陸側にははるかに大きな財政の余地があることを示唆しています。
チャート24
ダイエットが必要なのは米国の公的部門であり、欧州のそれではない
ダイエットが必要なのは米国の公的部門であり、欧州のそれではない
チャート25
米国の利払いが問題になりつつある
米国の利払いが問題になりつつある
たとえヨーロッパの財政政策が魅力に欠けるままであったとしても、米国の財政的推進力の変化率は米国成長にとって予期せぬ、織り込まれていない、価格付けされていない足かせになるはずです。成長差が通貨変動に重要であることを考えれば(図表 26)、EUR/USDは投資家が米国の将来の財政推進力を過大評価していることに気づく2025年のいずれかの時点で底を探すはずです。その時点で資本フローは通貨フローに従う可能性があります。
チャート26
グロースと通貨は連動する
グロースと通貨は連動する
世界的な設備投資ブーム BCAの主要な仮説の一つであるジオマクロ・ストラテジーは、世界が継続する地政学的トリレンマのために世俗的な世界的設備投資ブームに入ったという点です。要するに、我々は西側の政策立案者が同時に多くのことをやろうとしていると仮定します:中国からのリスク削減、気候変動からのリスク削減、そしてロシアからのリスク削減です。これらすべての取り組みが同時に起こることで、設備投資関連財やコモディティへの需要過剰を生み出します。
チャート 27
欧州がグリーンテックをリード
欧州がグリーンテックをリード
チャート28
ドイツは機械産業の国で、それは良いことだ
ドイツは機械産業の国で、それは良いことだ
このより強い世界的設備投資環境はヨーロッパにとって無条件のポジティブです。ドラギ報告によれば、ヨーロッパは依然として多くのグリーン技術で優位を保っており、それゆえグローバルなグリーン転換から恩恵を受けるでしょう(図表 27)。加えて、グローバルな設備投資の回復はドイツを後押しします。機械出荷は自動車よりも同国の輸出における比重が大きく(図表 28)、ドイツは自動車分野では中国に劣るかもしれませんが、資本財では依然として競争力を維持しています(図表 28、下段)。多くの投資家はこの優位を見落としがちです。機械や工作機械は自動車ほど目立たないからです。 エネルギー収支の改善 我々は2022年夏に、欧州のエネルギー危機は短命であると物議をかもす予測を行いました。この予測は戦術的には的中し、オランダのTTF天然ガス価格は需要減と高い在庫水準により2022年のピークから90%下落しました(図表 29)。しかし、それは我々が意味したことの全てではありませんでした。我々が言いたかったのは、LNGの供給過剰が到来してヨーロッパを液化ガスの津波で満たすことで、エネルギー危機が恒久的に解消されるだろうということでした。 我々の多くの顧客や市場全体はこれに同意しませんでした。その結果、欧州の産業セクターはそれ以来、米国に比べてディスカウントを受けてきました(図表 30)。ほとんどの投資家にとって我々の戦術的な判断は正しかったと言えます。なぜなら、コモディティ価格は短期的には常に下落する均衡メカニズム、すなわち需要破壊によって低下するからです。すなわち、図表 31は、総供給がLNG輸入の増加によって十分に相殺されていないことを示しており、市場の均衡は住宅および産業の需要破壊によって達成されたことが示されています(図表 32)。
チャート29
欧州ガス価格:ピーク・パニックからLNG過剰供給へ
欧州ガス価格:ピーク・パニックからLNG過剰供給へ
チャート30
欧州のインダストリアル株は評価を引き下げられている
欧州のインダストリアル株は評価を引き下げられている
チャート31
供給不足…
供給不足…
チャート 32
…が需要破壊を引き起こした
…が需要破壊を引き起こした
しかし、これが我々を2022年に興奮させた理由ではありません。我々は顧客に地図 1の背後にある現実を指摘しました。要するに、まず米国を皮切りに、次いでカタール、カナダ、モザンビーク、さらにはロシアでさえも、世界のLNG生産者たちは世界需要を過大評価していました。彼らは合計で年間2億1600万トン(MTPA)のLNG供給を、単純にそれほどの天然ガスを受け入れる準備ができていない世界市場に投入しようとしています。ゴールドマン・サックスの最新予測によれば、2025年に稼働を開始する供給だけでも—主に米国発の供給—今日の既存の世界LNG供給量のさらに約4分の1を追加することになります。
マップ1
多数のLNGが稼働を開始
多数のLNGが稼働を開始
シェルとリスタッド・エネルギーの予測に基づくと、世界のLNG液化能力と受入ターミナル能力(供給)は2025年において世界のLNG需要を1億800万トン(MTPA)上回り、2030年には実に2億4700万トン(MTPA)上回る見込みです。一方、世界の受入ターミナル能力は欧州の地政学的な建設を主因として、2020年の860 MTPAから2025年には1,200 MTPAへと跳ね上がる見通しです(図表 33)。同様の話が世界のLNG船舶供給にも当てはまります(図表 34)。
チャート33
LNG受入能力の拡大
LNG受入能力の拡大
チャート34
そのガスを輸送する船は十分にある
そのガスを輸送する船は十分にある
さらに、ワシントンD.C.に拠点を置くエネルギー系シンクタンク、エネルギー経済・金融分析研究所(IEEFA)は、ヨーロッパのLNGインフラの半分以上が2030年までに座礁資産となる可能性があると指摘しています(図表 35)。したがって、これは非常に高価なエネルギー設備投資の拡張であり、おそらく誤った政策です。2026年までに、ヨーロッパは396 bcmのLNG再ガス化能力を有することになり、これは今日LNG、国内生産、およびパイプラインで賄われている大陸の天然ガス需要全体を置き換えるのに十分な能力です。
チャート35
LNGの津波がヨーロッパ沿岸に押し寄せる
LNGの津波がヨーロッパ沿岸に押し寄せる
チャート36
ロシアの供給を代替するにはLNGが十分に余っている
ロシアの供給を代替するにはLNGが十分に余っている
これはやや皮肉な話ですが、ヨーロッパは引き続きパイプライン経由でロシアの天然ガスを輸入しています。2023年の総輸入量は25.1 bcmでした。今後3〜5年でヨーロッパは60 bcmのLNG再ガス化能力を追加し、現在のパイプライン経由のロシア産天然ガスを事実上置き換え、それでも余剰の能力を持つことになります(図表 36)。 これらはヨーロッパにとってまさに福音です。これにより大陸は少なくともグローバルなLNG価格が崩壊して新たな需要の急増が誘発されるまで、アジアとLNG荷の争奪戦をして過剰支払する必要がなくなります。しかしLNG需要は輸入ターミナルというインフラの建設を要するため、ヨーロッパは数年間の余裕を持って行動できる可能性があります。 エネルギー価格の低下はヨーロッパにとって恩恵となります。エネルギー価格が高い間にヨーロッパは米国に大きくシェアを奪われたわけではありませんが、収益性は大幅に劣後しました。ガスおよび電力価格の低下はこの不利を解消し、株主と設備投資のためのキャッシュフローを解放します。この組み合わせは収益性、生産性、そして生活水準にとってポジティブです。 トランプとヨーロッパの結束 多くの投資家はトランプ大統領の復帰によってヨーロッパが打撃を受けると予想しています。我々はそれが必ずしもそうだとは完全には確信していません。 短期的には、トランプは間違いなく欧州資産に対してネガティブです。貿易戦争の脅威だけで欧州の成長を圧迫しています。それは不確実性を高め、設備投資の判断を抑制します。将来数四半期で関税が導入される可能性がある状況で、企業が今日何百万ユーロものプロジェクトにコミットするのは理にかなっていません。その結果、2025年前半には欧州の設備投資は既に低下している設備投資意向(図表 37)の示すものより下振れするでしょう。 しかし、今日のヨーロッパの主要な構造的問題は、EU加盟国間の規制の一体性の欠如と、ブリュッセルから配分される支出の割合が各国政府に比べて小さいことです。実際、ブリュッセルがコントロールするGDP比の規模は、米国におけるワシントンD.C.のそれよりはるかに小さいのです(図表 38)。
チャート37
欧州のキャップエックスは急落する…しかも今回の下落よりさらに大きく!
欧州のキャップエックスは急落する…しかも今回の下落よりさらに大きく!
チャート 38
ヨーロッパが足りない…
ヨーロッパが足りない…
欧州の各首都はあまりに本国中心的で、欧州全体の一貫した大構想を持つことや国内企業保護を放棄することができません。その結果、ヨーロッパは国内のチャンピオンを優遇し、GDPを重くする複雑な規制体系を抱えることになりました。これは大きな関税がかかる場合と同様の重しになります。日々その影響は見えています。ヨーロッパ企業がグリーン・ニュー・ディールについてよく口にする不満は、関与する金額そのものではなく、むしろそれらの資金にアクセスするために要求される複雑な手続きです。複雑な規制は当該プログラムを米国のIRAと比べてずっと魅力のないものにしていますが、両者は規模的にはほぼ同等なのです。トランプ大統領の政権はヨーロッパ諸国に共通の脅威を生み出し、それが諸国の結束を促す可能性がある。ヨーロッパの首都がより統一されれば、ブリュッセルはさらなる市場統合やキャピタル・マーケット・ユニオンのような、欧州が必要とするより野心的な改革に取り組むことができる。これらの進展は、欧州がドラギ氏が地域の生産性を向上させるために提案した年額7,710億ユーロに近い金額を配分するために必要である(表 1)。トランプのヨーロッパに対する脅しめいた態度は、キャピタル・マーケット・ユニオンの基礎となる共通債の発行の可能性も高める。さらに、トランプ政権は欧州がトランプ(および過去の米大統領)が要求してきたGDP比2%に合わせて防衛支出を増やす確率を高める。
表1
… ドラギ氏の提案に資金を提供するため
… ドラギ氏の提案に資金を提供するため
チャート 39
欧州は圧力下で改革できる
欧州は圧力下で改革できる
言い換えれば、トランプはまさに欧州が必要とする処方箋であり、大陸が「自分たちだけでやっていく」と認識するための外的触媒であり、それゆえ改革によって問題に対処しなければならない。最初のトランプ政権期に欧州がよりビジネスに友好的になるよう改革のペースを速め(チャート 39)、グリーン・ニューディールのような野心的(欠点はあるが)なプログラムを打ち出したのは偶然ではなかった。 規制の簡素化、市場の断片化の解消、そしてキャピタル・マーケット・ユニオン(つまり、より大胆な資本主義)への接近はいずれも、欧州が資本コストを引き下げ、投資水準を高めるためのステップである。その結果、トランプは欧州を必要とするより高い生産性の成長へと押し進める可能性が高い。 第2のトランプ政権が最初とは異なるかもしれない点は他に二つある。第一に、前述のLNGの供給過剰は大陸のエネルギーコストを和らげるだろう。トランプ大統領の規制緩和アジェンダはエネルギー部門に強く焦点を当てており、米国が十分な天然ガス輸出を認めることを確実にするはずで、たとえそれが国内の天然ガス価格を押し上げたとしてもである。ヨーロッパ人は2016年にトランプの化石燃料推進の利点を理解していなかったかもしれないが、今日では歓迎するだろう。そもそもEUは天然ガスを「エネルギー・トランジション」燃料とみなしている。 第二に、トランプ大統領が直面する欧州は2016〜2017年と比べて異なる。トランプはエマニュエル・マクロン大統領と良好な協働関係を築いてきた。しかし、本当のゲームチェンジャーとなるのはドイツの選挙であり、それはベルリンにもたらされる手堅く親ビジネスの「ウォール・ストリート」的メンタリティだろう。とはいえ、欧州は大陸を代表して「トランプのささやき」の多くを担う人物としてイタリアの首相ジョルジャ・メローニに頼らざるを得ないかもしれない。メローニはMAGAのイデオロギー圏内でやや神格化された地位に上っている。 トランプとウクライナ ウクライナ問題について、トランプ大統領は紛争を迅速に解決することに対して多くのヨーロッパ人から公然とした抵抗に直面する可能性が高い。しかし水面下では、ヨーロッパ人が表向きに示すよりもはるかに多くの支持が取引的アプローチに存在するだろう。私たちが最近のレポートで論じたように、ロシアに対する「永遠の戦争」アプローチに対する欧州の政治的コンセンサスは弱まりつつある。7 そのレポートでは、紛争が迅速に凍結された場合、市場に残された短期的で簡単なアルファの機会はないと主張したが、同時に戦争は欧州資産に恒久的なディスカウントをもたらしていると私たちは考えている。言い換えれば、解決は欧州資産が市場のファンダメンタルズに反応することを可能にし、本レポートで論じる通り、それらのファンダメンタルズは好転し始めるだろう。 結論:変化の風は欧州全体に吹き始めているようだ。ドイツの政治は転換点にあり、民間部門のデレバレッジは過去のものとなった。財政のインパルスは米国と比べてそれほど緊縮的ではなくなるだろうし、グローバルなキャップエックス・ブームは欧州の輸出を押し上げ、大陸のエネルギーの不均衡は改善するだろう。加えて、新たなトランプ政権は欧州にとって全てがネガティブというわけではない。地域に改革とさらなる統合の圧力をもたらし、さらにトランプ大統領はウクライナの紛争を終結させるだろう。これらの動きは今後数年間で欧州の投資率を押し上げ、地域の生産性を高め、欧州と米国の成長率の格差を縮めることを可能にするだろう。投資への示唆 現時点のバリュエーションでは、欧州資産は欧州と米国の生産性ギャップがこれからさらに拡大することを前提にしている。しかし、本稿は、欧州は今日最大幅で遅れをとっているに過ぎないと主張する。今後数年間で生産性が改善すれば、欧州の利益は米国に対して失った地位の一部を取り戻すことができる。したがって、欧州資産のリレーティングが生じるであろう。 短期的には、多くのリスクが依然として存在する。欧州株式および通貨は引き続き今後数か月でより厳しい局面に直面している。関税の脅威は欧州および世界の設備投資に重くのしかかっている。この組合せは、世界の工業サイクルに大きくレバレッジされている欧州株式に打撃を与える。さらに、ユーロは循環性が強いため不確実性の上昇に対してアレルギー反応を示す(チャート 40)。したがって、特に同一通貨ベースでは、欧州株式は短期的に米国株式にさらにアンダーパフォームする可能性が高い。 これらの短期的逆風を超えると、欧州資産にはより良い日々が待っている。第一に、欧州株式が米国株式に対して50年にわたる下落トレンドにある中でも、定期的に約5年程度続く欧州のアウトパフォーマンスの局面が発生している(チャート 41)。欧州株式は下方に行き過ぎており、反転点に近いように見える。
チャート40
不確実性が欧州資産に打撃を与える
不確実性が欧州資産に打撃を与える
チャート41
構造的なアンダーパフォーマンスが数年にわたるラリーによって中断された
構造的なアンダーパフォーマンスが数年にわたるラリーによって中断された
チャート42
投資家は欧州株を嫌っている…
投資家は欧州株を嫌っている…
バリュエーションはそのような反発を示唆している。いかに切っても、欧州株式は米国株式に比べて非常に割安である。未調整の株式倍率は40%のディスカウントで取引されており、これは通常、欧州の相対的パフォーマンスの底を示す水準である。さらに重要なのは、セクター構成を調整しても、欧州の収益倍率は米国のそれと比べて史上ほぼ最低水準にあることである(チャート 42)。同様に、欧州のリスク・プレミアムは米国のリスク・プレミアムより445ベーシスポイント高く、欧州の収益の期待長期成長率はパンデミック期を除けば米国の収益期待と比べて最も低い水準にある(チャート 42、下段)。 欧州に対する低迷したセンチメントはユーロのバリュエーションにも表れている。EUR/USDはBCAの外国為替ストラテジー・チームによる購買力推定値を20%下回って取引されている(チャート 43)。バラッサ=サミュエルソン効果は、生産性の高い国は高価な通貨を維持できると主張する。したがって、ユーロのディスカウントは、ユーロ圏の生産性が最近のように米国に対して引き続き大きく遅れると予想するのであれば正当化され得る。しかし、これは我々の見解と相反する。我々は、低下した一時的要因が欧州の生産性低下を悪化させたと考えている。したがって、我々はユーロが反発すると予想する。特にトランプ政権はユーロ圏でユーロ高を誘導するために関税を用いる可能性が高い。ユーロ圏の経常収支の€40 billionの黒字はそのような調整の余地があることを示している。 米国もまた、ドルおよび米国株式に対して欧州株式を有利にする競争に直面し始めている。チャート 44が示すとおり、米国の単位労働コスト(ULC)は2013年以降、中国のそれと比べて30%上昇している。しかし、欧州のULCは中国のそれに対して横ばいである。これは、安いユーロが中国の台頭に対する重要な相殺要因を生み出した一方で、強いドルは米国の生産者にとってより高い生産性成長の恩恵を相殺してしまったことを意味する。これは米国資産が外国資産に対して脆弱になる要因をさらに加える。
チャート 43
…そしてユーロ
…そしてユーロ
チャート44
高いドルが米国の優れた生産性を相殺する
高いドルが米国の優れた生産性を相殺する
チャート45
欧州の緊縮財政がエクイティのアンダーパフォーマンスを引き起こしている
欧州の緊縮財政がエクイティのアンダーパフォーマンスを引き起こしている
財政のダイナミクスは間もなく欧州株式に有利に働くだろう。緩やかな財政政策は米国資産が欧州資産に対してアウトパフォームした主要な原動力であった。緩やかな政策は成長とリターン率を押し上げ、したがって米国資産をより魅力的にした(チャート 45)。我々は、最終的に米国の利回りに対する圧迫が米国の財政政策の再考を強いると予測している。一方で、欧州の政策はこれまでよりも制約が緩くなる可能性が高い。これは、ユーロ圏と米国の相対的な財政ダイナミクスによって生み出された欧州資産への逆風が消えることを意味する。そのような欧州の利益に対する足かせがなければ、欧州資産が米国資産に対して割安であることを正当化するのは難しい。 人口動態のトレンドは、米国にとって欧州に対するもう一つの大きな優位性をもたらしてきた。米国は長年欧州に対して人口動態上の優位性を享受してきたが、違法移民が4年前に米国へ急増して以来この利点は拡大した。移民増加は米国内需を押し上げるとともに米国雇用者の賃金交渉力を高めた。それにより収益性が高まった。欧州が人口動態において大きな変化を経験する可能性は低いが、トランプ政権は移民流入の管理を優先事項としてきた。米国の動向の変化だけを考慮しても、米国と欧州の人口ギャップは縮小し、米国資産のバリュエーション・プレミアムは維持し難くなるだろう。
チャート46
欧州の不確実性が高いリスク・プレミアムの背景にある
欧州の不確実性が高いリスク・プレミアムの背景にある
米国より低い経済的不確実性が米国市場のアウトパフォーマンスの最後の原動力を生み出した。欧州の不確実性の高まりは同地域の経済成長、したがって収益性を損ない、またより高いリスク・プレミアムを正当化する。しかし、欧州の経済政策不確実性は米国に対して頂点に達している(チャート 46)。一方で、トランプ政権は貿易政策、移民政策、財政政策などを通じて米国の不確実性を高めることが見込まれる。これは米国での安定の期間が終わったことを示唆する。その結果、米国の相対的不確実性は欧州よりも高まるだろう。これが米国の相対的成長および相対リターンに重くのしかかる。 我々の結論はシンプルである:欧州の資本に対するリターン率は米国に対して谷底に達しており、バリュエーションの差が示すように投資家は現状を基に未来を外挿している。しかし、その際に投資家は欧州のリターン率を低下させたのが循環的要因であることを十分に評価しておらず、同じ要因は今後数年で効力を失うであろうことを見落としている。したがって欧州のリターン率は上昇し、それが欧州の株式や通貨を含む欧州資産の魅力を高める(チャート 47)。結果として、長期投資家は米国を犠牲にして一部資産を欧州にシフトし始めることが有益であろう。
チャート47
投下資本利益率が改善すれば、エクイティは回復する
投下資本利益率が改善すれば、エクイティは回復する
当面、プライベート・アセットは欧州への最良の参入ポイントを提供する。先に指摘したように、欧州株式と通貨は今後約6か月間で重要な逆風に直面し続ける。プライベート・アセットは重要な利点を提供する;マーケットで時価評価されないため、変動性がそれほど高くない。最近の欧州のアンダーパフォーマンスの波では、これらはパブリック・マーケット証券ほど強く罰せられないだろう。さらに、流動性プレミアムを提供し、これはパブリック・マーケット証券の低下したバリュエーションが既に示唆するリターンに上乗せされる。ちなみに、BCAのプライベート・マーケット・ストラテジー・サービスは長期間のアンダーウェイトの後に最近欧州をニュートラルに格上げした。8 結論:欧州株式および通貨は依然として短期的には重大な逆風に直面している。しかし、彼らは最近の相対的に低い生産性と収益性の期間が遠い未来まで続くと見越して米国に比べて極端に割安になっている。これは近視眼的な見方である。欧州のこれら二つの面でのアンダーパフォーマンスは構造的要因と同様に循環的要因にも起因しており、後者は間もなく弱まるであろう。したがって、長期投資家は欧州の機会を探し始めるべきである。当面は、プライベート・マーケットが短期的なボラティリティから投資家を保護しつつ流動性プレミアムを享受できるため、欧州エクスポージャーを集め始めるのに最適な手段である。欧州のパブリック株式ベンチマークを米国に対してアップグレードする時期は2025年後半に来るであろう。 Mathieu Savaryチーフ・ヨーロピアン・ストラテジストmathieu@bcaresearch.com Marko Papicチーフ・ストラテジストmarko@bcaresearch.com
Investors have given up on European assets, which now suffer exceptional discounts to US ones. However, tighter US fiscal policy, the end of Europe’s austerity and deleveraging, the LNG Tsunami about to hit European shores, and the global capex fueled by the Impossible Geopolitical Trinity mean that Europe’s time to shine will soon come back.

The 10-year Treasury yield rose in the aftermath of the Fed’s jumbo rate cut on Wednesday. Our US Bond strategists noted that this move reflects the fact that the downward revisions to the dots still fall short of the magnitude of cuts embedded in the…

景気循環の傷はまだ癒えていない
景気循環の傷はまだ癒えていない
ニュートラル - 格下げ警戒
輸送業界は景気の先行指標であり、輸送サービス需要の増加は景気の堅調化と同義であり、その逆も同様です。最近のフェデックスの決算は、運輸セクターの健全性(第2パネル)と米国経済、特に景気循環性の高い製造業セクターについての警戒信号を点灯させました。同社は世界的なマクロ環境の弱さを理由に挙げ、通期の利益見通しを大幅に下方修正しました。
フェデックスはまた、中国との貿易協定が存在しないことが貨物の自由な移動を複雑にすると指摘(下段のパネル)しており、米中間の不確実性が長引くほど世界貿易の成長が回復するのに時間を要すると述べています。エアフレイト株にとっての救いは業界の価格決定力の回復でしたが、セクターのインフレが今後数か月で鈍化する明確な兆候が増えてきています(第3パネル)。
当社は以前のフェデックスの利益警告を受けて、S&P エアフレイト&ロジスティクス指数を高い確信を持つオーバーウェイト・リストから外して以降、同指数についてニュートラルのスタンスを取ってきましたが、現在この輸送サブグループと輸送株全体の指数を格下げ監視リストに入れています。
結論:当社はS&P 輸送株指数に対してニュートラルの立場を維持していますが、現在は格下げ警戒中です。輸送セクター内における当社のバーベル・ストラテジーは引き続き維持しており、航空株をオーバーウェイト、エアフレイト&ロジスティクスをニュートラル(ただし現在は格下げ警戒中)、鉄道株をアンダーウェイトとしています。続報にご注目ください。
Highlights Portfolio Strategy Corporate sector selling price inflation is nil while leading wage inflation indicators signal additional labor cost increases in the coming months. The risk is that profit margins have already peaked for the cycle. We reiterate our tactically cautious overall equity market view. Galloping higher private and public sector software outlays, a structurally enticing software demand backdrop and ongoing industry M&A all signal that it still pays to be bullish software stocks Recent Changes Last Thursday we downgraded the S&P railroads index to underweight. Also last Thursday we trimmed the S&P air freight & logistics index to neutral. Table 1 Feature The SPX stalled last week, digesting the now-complete Fed pivot. Our sense is that the Fed’s dovish turn is now fully reflected in equities. Importantly, the longer and wider the dichotomy between stocks and bonds gets, the more painful the ramifications from the eventual snap will be, likely with equities yielding to the bond market (Chart 1). As we first posited on March 4, short-term equity market caution is still warranted.1 Chart 1Time To Get Back Together While the Fed meeting and sharp decline in Treasury yields dominated headlines last week, it was the NFIB’s latest release that really caught our attention. Importantly, it revealed that taxes and big government are no longer the biggest problems facing small and medium business owners, but labor is: “Twenty-two percent of owners cited the difficulty of finding qualified workers as their Single Most Important Business Problem, only 3 points below the record high. Ten percent of owners find labor costs as their biggest problem, a record high for the 45-year survey.”2 Historically, such extreme tightness in the SME labor market is a precursor of a yield curve inversion (NFIB cost of labor shown inverted, Chart 2). The link is clearer if we show this same NFIB series with the Labor Department’s average hourly earnings monthly release that is currently running at a 3.4%/annum clip (Chart 3). In other words, a tight labor market is conducive to corporations bidding up the price of labor which in turn causes the Fed to raise interest rates, eventually inverting the yield curve. Chart 2Cycle Is Long In The Tooth Chart 3Wage Growth... This macro backdrop is slightly unnerving and our biggest concern is the S&P 500’s profit margins (Chart 4). Q3/2018 marked the all-time peak in SPX quarterly margins according to Standard & Poor’s,3 and in Q4/2018 margins have deflated from a high mark of 12.13% to 10.11%, or a 16.7% q/q drop. Chart 4...Denting Margins Undoubtedly, last year’s fiscal easing-induced all-time highs in SPX margins is unsustainable, and a tight labor market is a warning shot. Using the same NFIB series on cost of labor being the most important problem SMEs face and subtracting it from our corporate pricing power proxy, we constructed an equity market margin proxy, shown as a Z-score in Chart 5. Historically, the y/y change in SPX profit margins move in lockstep with our margin proxy and the current message is grim (Chart 5). Chart 5Margin Trouble Ahead Before getting too bearish though, we want to make three salient points: First, while the NFIB survey’s labor related indicators are disconcerting, unit labor costs – the best measure of wage growth – remain muted as productivity growth has ramped up recently. Second, using empirical evidence dating back to the 1960s, the ultimate SPX profit margin mean reversion occurs during recessions, when EPS suffer a major setback. The implication is that margins can move sideways or grind lower in the coming year. As a reminder, BCA’s review remains that the U.S. will avoid recession in the next 12 months. Third, the most important yield curve slope, the 10/2, has not yet inverted, and even when it does invert, investors will have time to start positioning defensively; we have shown in recent research that the S&P peaks after the yield curve inverts.4 On a related note, we use this opportunity to update our corporate pricing power proxy, and Table 2 summarizes the sectorial results. Table 2Industry Group Pricing Power Corporate sector selling price inflation has ground to a halt at a time when wage inflation is rearing its ugly head. Worrisomely, our pricing power diffusion index’s breadth sunk below the 50% line, whereas our wage growth diffusion index spiked higher; 70% of the 44 industries we track are struggling with rising wages (second & third panels, Chart 6). Taken together, there is evidence that broad-based profit margin pressures are escalating, the mirror image of what our gauges were signaling in our last update late-last year.5 Chart 6Margins Have Likely Peaked Digging beneath the surface of our corporate pricing power proxy is revealing. As a reminder, we calculate industry group pricing power from the relevant CPI, PPI, PCE and commodity growth rates for each of the 60 industry groups we track. Table 2 also highlights shorter term pricing power trends and each industry's spread to overall inflation. 57% of the industries we cover are lifting selling prices, but only 27% are raising prices at a faster clip than overall inflation. Both figures are lower than our early-November report. Outright deflating sectors increased by eight to twenty four since our last update, fifteen of which are deflating at 1%/annum pace or lower. One third of the industries we cover are experiencing a downtrend in selling price inflation, representing a 43% increase since our most recent report (Table 2). Deep cyclicals/commodity-related industries (ex-oil) continue to dominate the top ranks, occupying the top six slots (Table 2). Despite the ongoing global manufacturing deceleration and still unresolved U.S./China trade tussle, the commodity complex's ability to increase prices remains resilient. On the flip side, energy-related industries occupy the bottom of the ranks as WTI crude oil is still 22% lower than the most recent peak in October 2018. In sum, business sector selling price inflation is nil while leading wage inflation indicators signal additional labor cost increases in the coming months. The risk is that profit margins have already peaked for the cycle. We reiterate our tactically cautious overall equity market view. This week we update a high-conviction overweight tech subgroup and recap our transportation subsurface moves from last Thursday. Buy The Software Breakout Software stocks are on fire and leading profit indicators suggest that more gains are in store in the coming months. Last week, we published a table ranking all the sectors and subsectors by 12-month forward profit growth estimates (please refer to Table 2 from the March 18 Weekly Report). While the broad tech sector is on an even keel with the SPX, software EPS are racing at twice the speed of the broad market, roughly 14%. Keep in mind, when growth gets scarce, investors flock to industries with accelerating profit prospects. The software profit juggernaut is intact and we reiterate our high-conviction overweight recommendation. Sustained capital outlays on software are a key driver of industry profits (bottom panel, Chart 7). In an otherwise muted Q4 GDP release, rising non-residential fixed investment in general and surging investment in software in particular suggest that our bullish software capex thesis is alive and kicking (middle panel, Chart 7). Chart 7Software On A Tear The move to cloud computing and SaaS, the proliferation of AI, machine learning and augmented reality are not fads but enjoy a secular growth profile, and signal that capital outlays on software are also in a structural uptrend. Not only private sector software capex is near all-time highs as a share of total outlays, but also government investment in software is reaccelerating at the fastest pace since the tech bubble. When productivity gains are anemic, both the business and government sectors resort to software upgrades in order to boost productivity. Cyber security is another more recent source of software related demand as governments are taking such risks extremely seriously the world over (second panel, Chart 8). Chart 8Earnings Led Advance Meanwhile, fear of missing out has rekindled industry M&A and both the dollar amount and number of deals are sky high, with acquirers bidding up premia to the stratosphere (Chart 9). This supply reduction is bullish for industry pricing power. Chart 9M&A Frenzy Granted the M&A frenzy has pushed relative valuations on the expensive side especially on a forward P/E basis, but on EV/EBITDA software stocks are trading below the historical mean and still significantly lower than the late-1990s peak valuation (bottom panel, Chart 8). If our bullish software profit thesis continues to pan out, then software stocks will grow into their pricey valuations. Finally, shareholder friendly activities are ongoing in this key tech subsector and buybacks in particular provide an added layer of artificial EPS growth (bottom panel, Chart 9). Adding it up, galloping higher private and public sector software outlays, a structurally enticing software demand backdrop and ongoing industry M&A, all signal that it still pays to be bullish software stocks. Bottom Line: Buy the software breakout. The S&P software index remains a high-conviction overweight. The ticker symbols for the stocks in this index are: BLBG: S5SOFT – MSFT, ORCL, ADBE, CRM, INTU, ADSK, RHT, CDNS, SNPS, ANSS, SYMC, CTXS, FTNT. Tweaking Transport Subgroup Positioning The S&P transports index’s recovery rally has stalled recently and is a cause for concern for the overall market. In more detail, the recent gulf between relative share prices and the SPX has widened and warns that the overall market is at a risk of suffering a pullback (Chart 10). Chart 10Engine Trouble Thus on Thursday last week, we made two subsurface transport changes, downgrading a subgroup to underweight that commands lofty valuations at a time when leading profit indicators are flashing red, and also downgrading to neutral a globally exposed transport sub-index. Get Off The Rails In our downgrade of the S&P railroads index late last year to a benchmark allocation, we highlighted that two of our key industry Indicators, the Railroad Indicator and our Rail Shipment Diffusion Indicator, had turned negative.6 These indicators have continued to deteriorate, including total rail shipments which have now started to contract for the first time since the 2015-16 manufacturing recession (third panel, Chart 11). Intermodal shipments in particular have nosedived, likely a result of weak retail sales, as we highlighted earlier this month.7 Chart 11Downgrade Rails To... This contraction would be far less concerning were it not for the rapid degradation of industry balance sheets as firms have sought to increase relatively cheap leverage in order to retire equity. Railroads are now significantly more indebted than the broad market which itself has not shown an aversion to adding leverage (bottom panel, Chart 11). Such a change in railroad capital structure has kept EPS growth rates artificially high while simultaneously adding an extra measure of equity risk premium that does not yet appear fully reflected in relative share prices. Moreover, when we downgraded the S&P railroads index to neutral last year, deteriorating Indicators were offset by exceptionally healthy pricing power.8 After a multi-year expansion, selling price inflation has now rolled over (second panel, Chart 12), taking away the remaining pillar supporting a neutral view which compelled us to move to an underweight allocation last week. Chart 12...Underweight Pricing power is one of the key determinants in our earnings model that, when combined with the previously noted contracting volumes, is indicating the end to the industry’s above-trend earnings growth is nigh (third panel, Chart 12). With relative earnings growth slowing and rising leverage adding incremental risk, the S&P railroads index’s premium valuation multiple looks increasingly dicey (bottom panel, Chart 12). Bottom Line: Broad based declines in traffic volumes, falling pricing power and high leverage suggest that earnings will underwhelm. Accordingly, last Thursday we moved to an underweight recommendation on the S&P railroads index as we expect a de-rating phase to materialize. The ticker symbols for the stocks in this index are: BLBG: S5RAIL - UNP, CSX, NSC, KSU. Air Freight Had Its Wings Clipped We have been offside on the high-conviction overweight call on the S&P air freight & logistics index and the recent FedEx warning suggests that profits will come under pressure for this index for the rest of the year and will trail the SPX. As such, we trimmed exposure to neutral late-last week and removed it from the high-conviction overweight list for a loss of 14%. Chart 13 shows that all the profit drivers we had identified in early December last year have taken a sharp turn for the worse. Energy costs are no longer in deflation as oil prices have jumped from $42/bbl to near $60/bbl. Not only is global growth still decelerating, but also U.S. growth is in a softpatch: the manufacturing shipments-to-inventory ratio is on the verge of contraction, warning that delivery services’ selling prices are in for a turbulent ride (second panel, Chart 13). In addition, definitive news of Amazon becoming a formidable competitor in courier delivery services is structurally negative for the industry. Chart 13Air Freight: Move To The Sidelines Nevertheless, we refrain from turning outright bearish as air freight stocks are technically oversold and valuations are trading at the steepest discount to the broad market since mid-2002. Bottom Line: Last Thursday we downgraded the S&P air freight & logistics index to neutral and also removed it from the high-conviction overweight list. The ticker symbols for the stocks in this index are: BLBG: S5AIRF - UPS, FDX, CHRW, EXPD. Anastasios Avgeriou, U.S. Equity Strategist anastasios@bcaresearch.com Footnotes 1 Please see BCA U.S. Equity Strategy Weekly Report, “The Good, The Bad And The Ugly” dated March 4, 2019, available at uses.bcaresearch.com. 2https://www.nfib.com/assets/jobs0219hwwd.pdf 3https://ca.spindices.com/documents/additional-material/sp-500-eps-est.xlsx?force_download=true 4 Please see BCA U.S. Equity Strategy Weekly Report, “Signal Vs. Noise” dated December 17, 2018, available at uses.bcaresearch.com. 5 Please see BCA U.S. Equity Strategy Weekly Report, “Recuperating” dated November 5, 2018, available at uses.bcaresearch.com. 6 Please see BCA U.S. Equity Strategy Weekly Report, “Critical Reset“, dated October 29, 2018, available at uses.bcaresearch.com. 7 Please see BCA U.S. Equity Strategy Weekly Report, “The Good, The Bad And The Ugly“, dated March 4, 2019, available at uses.bcaresearch.com. 8 Please see BCA U.S. Equity Strategy Weekly Report, “Critical Reset“, dated October 29, 2018, available at uses.bcaresearch.com. Current Recommendations Current Trades Size And Style Views Favor value over growth Favor large over small caps
Neutral We have been offside on the high-conviction overweight call on the S&P air freight & logistics index and the recent FedEx warning suggests that profits will come under pressure for this index for the rest of the year and will trail the SPX. As such, we are trimming exposure to neutral and removing it from the high-conviction overweight list today for a loss of 14%. The chart shows that all the profit drivers we had identified in early December last year have taken a sharp turn for the worse. Energy costs are no longer in deflation as oil prices have jumped from $42/bbl to near $60/bbl. Not only is global growth still decelerating, but also U.S. growth is in a softpatch: the manufacturing shipments-to-inventory ratio is on the verge of contraction, warning that delivery services’ selling prices are in for a turbulent ride (second panel). In addition, definitive news of Amazon becoming a formidable competitor in courier delivery services is structurally negative for the industry. Nevertheless, we refrain from turning outright bearish as air freight stocks are technically oversold and valuations are trading at the steepest discount to the broad market since mid-2002. Bottom Line: Downgrade the S&P air freight & logistics index to neutral and also remove it from the high-conviction overweight list today. The ticker symbols for the stocks in this index are: BLBG: S5AIRF - UPS, FDX, CHRW, EXPD.
Highlights Portfolio Strategy Higher interest rates, with the Federal Reserve tightening monetary policy three more times in the next seven months, will be the dominant theme next year. All four of our high-conviction underweight calls are levered to this theme. The later stages of the U.S. capex upcycle underpin three of our high-conviction overweight calls for 2019. Recent Changes Downgrade the S&P Home Improvement Retail index to underweight today. Trim the S&P Interactive Media & Services index to a below benchmark allocation today. Table 1 Feature Fed policy will dominate markets next year as the dual tightening backdrop – rising fed funds rate and accelerated downsizing of the Fed balance sheet – remains intact. Two weeks ago we raised the question: is the Fed tightening monetary policy too far too fast?1 In more detail, we put the latest monetary tightening cycle in historical perspective and examined trough-to-peak moves in the fed funds rate since the 1950s (Chart 1). Chart 1Too Far Too Fast? A good friend I call “the smartest man in California” correctly pointed out that 500bps of tightening today is not the same as in the 1970s or 1980s. Chart 2 adjusts for that by including the average nominal GDP growth rate during these tightening episodes and adds more color to each era. As a reminder, the latest cycle that commenced in December 2015 is already 25bps above the median, if one uses the Wu-Xia shadow fed funds rate to capture the full quantitative easing effect, and above-average nominal output growth. Chart 2Trough-To-Peak Tightening Cycle Already Above Historical Median Trying to answer the question, we are concerned that as the Fed remains committed to tighten monetary policy three more times by mid-2019, a yield curve inversion looms, especially if the U.S. economy suffers a soft patch in the first half of next year (please refer to our Economic Impulse Indicator analysis in the October 22ndand November 19th Weekly Reports). This would signal at least a pause, if not reversal, in Fed policy. With that in mind, this week we are revealing our high-conviction calls for 2019. Four of our calls are a play on this tightening monetary backdrop that is one of BCA’s themes for next year.2 The later stages of the U.S. capex upcycle underpin three of our high-conviction calls. Table 22018 High-Conviction Calls Recap However, before we highlight our 2019 high-conviction calls in detail, Table 2 tallies our calls from last year. We had a stellar performance in our 2018 high-conviction calls with an average excess return of 11.6% versus the S&P 500. As the year turns the corner, closing out the remaining calls brings down the average relative return to 7.5%, still a very impressive number, with a total of ten hits and only two misses for the year. Anastasios Avgeriou, Vice President U.S. Equity Strategy anastasios@bcaresearch.com Software (Overweight, Capex Theme) Software stocks are our first hold out from last year’s high-conviction overweight list, levered to the capex upcycle theme. Chart 3 shows that relative capital outlays and the share price ratio are joined at the hip. Software upgrades offer the simplest, quickest and most effective capital deployment, especially when productivity gains ground to a halt. Importantly, leading indicators of overall capex remain upbeat and should continue to underpin software profits. Beyond capex, M&A has been fueling software stock prices. It did not take long for the large CA acquisition to get surpassed by RHT and more recently SYMC was also rumored to be in play (Chart 3). Inter-industry M&A activity is reaching fever pitch and this frenzy is bidding up premia to stratospheric levels. The push to the cloud, SaaS and even AI has boosted the appeal of software stocks and brought them to the forefront of potential takeout candidates. These are secular trends and will likely continue to gain steam irrespective of the different stages in the business cycle. As a result, software stocks should remain core tech holdings in equity portfolios. The recovery in the software price deflator (Chart 3), a proxy for industry pricing power, corroborates the upbeat demand backdrop. With regard to financial statements, software stocks have pristine balance sheets with more cash on hand than debt, which sustains the net debt-to-EBITDA ratio in negative territory. Interest coverage is great at 10x and free cash flow generation is expanding smartly. The ticker symbols for the stocks in this index are: BLBG: S5SOFT - MSFT, ORCL, ADBE, CRM, INTU, RHT, ADSK, SNPS, CTXS, ANSS, CDNS, FTNT and SYMC. Chart 3Software Air Freight & Logistics (Overweight, Capex Theme) Air freight & logistics stocks are the second hold out from our high-conviction overweight list, although we added it to list only in late-March. This transportation sub-index laggered is a capex and trade de-escalation play for the first half of 2019. Importantly, energy costs comprise a large chunk of freight services input costs and the recent drubbing in oil markets will boost margins especially on the eve of the busiest season for courier delivery services (top panel, Chart 4). On that front, there are high odds that this holiday sales season will be another record setting one, as wage inflation is underpinning discretionary incomes. Keep in mind that the accelerating domestic manufacturing shipments-to-inventories ratio confirms that demand for hauling services is upbeat. The implication is that rising demand for freight services will buoy industry profits and lift valuations out of their recent funk (Chart 4). Firming industry operating metrics also tell a positive story and suggest that relative share prices will soon take off. Air freight pricing power has been healthy, in expansionary territory and above overall inflation measures. While the U.S./China trade tussle and the appreciating greenback are clear risks to our sanguine S&P air freight & logistics transportation subindex, most of the grim news is already reflected in depressed relative forward profit estimates, bombed out valuations and washed out technicals (Chart 4). The ticker symbols for the stocks in this index are: BLBG: S5AIRF - FDX, UPS, EXPD and CHRW. Chart 4Air Freight & Logistics Defense (Overweight, Capex Theme) We have been overweight the pure-play BCA defense index since late-2015 and there are high odds that this juggernaut that really commenced with the George Walker Bush presidency remains in a secular growth trajectory. Our strategy is to add exposure on any meaningful pullbacks and keep this index as a structural overweight within the GICS1 S&P industrials index. The recent drawdown offers such an opportunity and we are adding this index to the 2019 high-conviction overweight list. The rise of global "multipolarity" - or competition between the world's great nations - and the decline of globalization, along with a global arms race and increased risk of cyber-attacks, have been documented in our "Brothers In Arms" Special Report. These trends all signal that global defense related spending will remain upbeat in the coming decade.3 In the U.S. in particular, where military spending in absolute terms is greater than the rest of the world put together, defense spending and investment have bottomed and will continue to accelerate (Chart 5). In fact, the CBO continues to project that defense outlays will jump further next year. While such a breakneck pace is clearly unsustainable, President Trump is serious about upgrading and updating the U.S. military in order to keep China's geopolitical and military ascendancy in check (as well as to deal with Russia and Iran).4 The upshot is that defense outlays will continue to expand into the 2020s. Such a buoyant demand backdrop is music to the ears of defense contractor CEOs, and represents a boost to defense equity revenue growth prospects. This capital goods sub-industry has extremely high fixed costs and thus any increase in top line growth flows straight to the bottom line. Put differently, defense contractors enjoy high operating leverage. No wonder M&A activity is robust: at least four large deals have been announced in the past year that are underpinning takeout premia. A closer look at operating metrics corroborates that defense goods manufacturers are firing on all cylinders. New orders recently jumped to fresh all-time highs and the industry's shipments-to-inventories ratio is rising, on track to surpass the 2008 peak. Unfilled orders are also running at a high rate, signaling that factories will keep on humming at least for the next few quarters. Importantly, the industry is not standing still and is making significant investments. U.S. defense capex as reported in the financial statements of constituent firms is growing at roughly 20%/annum or twice as fast as overall capex (Chart 5 on page 7). While interest coverage has been modestly deteriorating, it is twice as high as the overall market (Chart 5 on page 7). Impressively, defense ROE is running near 30%, again roughly double the rate of the broad market. The ticker symbols for the stocks in the BCA defense index are: LMT, LLL, NOC, GD and RTN. Chart 5Defense Consumer Discretionary (Underweight, Higher Fed Funds Rate Theme) We recommend investors avoid the consumer discretionary sector that suffers when interest rates rise. Chart 6 depicts this inverse correlation consumer discretionary equities have with interest rates, especially the fed funds rate. Most discretionary equites are levered off of floating rates and thus any increase in the fed funds rates gets reflected immediately in banks' prime lending rate. Also, most consumer debt is floating rate debt and thus tighter monetary conditions, at the margin, dampen consumer debt uptake and, as a knock-on effect, weigh on discretionary consumer outlays. Recently we highlighted that, now that the Fed has been raising rates and allowing bonds to roll off its balance sheet, volatility is making a comeback. Unsurprisingly, the consumer discretionary share price ratio is inversely correlated with the VIX index, signaling that more pain lies ahead for this early cyclical index (VIX shown inverted, Chart 6). Sentiment and technical indicators also point to more downside ahead for this interest-rate sensitive index. Our sector advance/decline line is waning and EPS breadth has plunged. Worrisomely, sell-side analysts are penciling in an extremely optimistic 5-year outlook with EPS growth 23.4%/annum or 1.4 times higher than the overall market. Clearly this is not realistic as it assumes a tripling of EPS in the coming 5 years. Relative EPS estimates have already given way as AMZN commands very little EPS weight, despite its massive market cap weight (30% of the S&P consumer discretionary sector), and suggests that relative share prices will converge lower (Chart 6 on page 9). As a result, the 12-month forward P/E ratio is trading at a 24% premium to the broad market and significantly above the historical mean. Technicals are almost as extended as relative valuations and cyclical momentum has likely peaked, warning that a downdraft in relative share prices looms (Chart 6 on page 9). Chart 6Consumer Discretionary Home Improvement Retail (Underweight, Higher Fed Funds Rate Theme) While the probablity of a housing recession remains low, we are concerned that too much euphoria is already priced in the S&P home improvement retail (HIR) index, and there are high odds that next year HIR will suffer the same fate as homebuilders did this year (Chart 7). Thus, we are downgrading the S&P HIR index to underweight and adding it to the high-conviction underweight list for 2019. Fixed residential investment (FRI) as a percentage of GDP is up 50% from trough to the recent peak, whereas relative HIR performance is up 170% in the same time frame. Our worry is that optimistic sell side analysts' relative profit forecasts will be hard to attain, let alone surpass as FRI is steadily sinking (Chart 7). Worrisomely, our HIR model has plunged on the back of the wholesale liquidation in lumber prices and rising interest rates (Chart 7). Lumber deflation will prove a profit headwind as building supply Big Box retailers make a set margin on wood products. Select industry operating metrics suggest that the easy profits are behind HIR. Not only is our productivity growth proxy (sales per employee) on the verge of deflating, but also an inventory surge has sunk the HIR sales-to-inventories ratio into the contraction zone. Finally, there is rising supply of new and existing homes for sale already on the market, and that puts off remodeling activity at least until this supply glut clears (months' supply shown inverted, Chart 7). The ticker symbols for the stocks in this index are: BLBG: S5HOMI - HD, LOW. Chart 7Home Improvement Retail Short Small Caps/Long Large Caps (Higher Fed Funds Rate Theme) The days in the sun are over for small cap stocks and we are compelled to put the size bias favoring large caps in our high-conviction calls list for 2019. Small caps are severely debt saddled. Sustained small cap balance sheet degradation is worrying, with S&P 600 net debt-to-EBITDA close to 4 compared with less than 2 for the SPX (Chart 8). Such gearing is fraught with danger as the default rate has nowhere to go but higher. Small and medium enterprises (SMEs) have a higher dependency on bank credit as opposed to the bond market access that mega caps enjoy. Most bank credit is floating rate debt and so are lines of credit, and as the Fed remains firm on tightening monetary policy, interest expense costs are skyrocketing for SMEs. In a relative sense this will weigh on net profits. Moreover, small caps are a lot more sensitive to interest rates, and the selloff in the 10-year Treasury note heralds more pain in 2019 (Chart 8). Small caps are high(er) beta stocks and when volatility spikes they underperform large caps. When the Fed ballooned its balance sheet and dropped the fed funds rate to zero it suppressed volatility. Now that the Fed has been decreasing the size of its balance sheet and raising interest rates, this is working in reverse and volatility is making a comeback as we have been highlighting in our research, and will continue to weigh on small caps (VIX shown inverted, middle panel, Chart 8). Another way to showcase small caps' riskier status is the close correlation they have with the relative EM equity share price ratio. When EMs outperform the SPX, small caps follow suit and vice versa. Importantly a wide gap has opened recently and we suspect that it will narrow via small caps following the EM higher beta stocks lower (SPX vs. EM ratio shown inverted, fourth panel, Chart 8 on page 12). Chart 8Small Vs. Large Interactive Media & Services (Underweight, Higher Fed Funds Rate Theme) In our initiation of coverage on the S&P interactive media & services index,5 we highlighted three key risks that offset the revenue & profit growth vigor of this group, comprised almost entirely of Alphabet (Google) and Facebook. These were a renewed regulatory focus, rapid unpredictable changes in tastes & technology and an appreciating U.S. dollar. It is the first of these that has risen most dramatically since that report. Tack on the inverse correlation these growth stocks have with interest rates (top panel, Chart 9) and that is causing us to lower our recommendation to underweight and include this index in the high-conviction underweight list for 2019. Increasing regulatory efforts on technology will be a key theme next year, one we explored this past summer.6 Our conclusion was that both antitrust (particularly in the case of Alphabet) and privacy regulation (particularly in the case of Facebook) added significant risk to these near monopolies; calls for legislating both have dramatically amplified. Tim Cook, Apple’s CEO, recently commented that more regulation for Facebook and Alphabet was inevitable; we agree. While the form such regulation might take remains open to debate (for example, the U.S. could adopt an EU-style General Data Protection Regulation (GDPR)), we fear the associated headline risk (not to mention likely profit headwinds) will impair stock prices in the S&P interactive media & services index. This communication services sub-index is particularly prone to such a risk when it already trades at close to a 40% valuation premium to the broad market (middle panel, Chart 9 on page 14). Adding insult to injury is the PEG ratio that is trading at a 60% premium to the broad market (bottom panel, Chart 9 on page 14). In the face of the Fed’s sustained tightening cycle these extreme growth stocks are vulnerable to massive gravitational pull. The ticker symbols in the stocks in this index are: S5INMS – GOOGL, GOOG, FB, TWTR and TRIP. Chart 9Interactive Media & Services Footnotes 1 Please see BCA U.S. Equity Strategy Report, "Manic Market," dated November 19, 2018, available at uses.bcaresearch.com. 2 Please see BCA The Bank Credit Analyst Report, "OUTLOOK 2019: Late-Cycle Turbulence", dated November 26, 2018, available at bca.bcaresearch.com. 3 Please see BCA U.S. Equity Strategy Special Report, "Brothers In Arms," dated October 31, 2016, available at uses.bcaresearch.com. 4 Please see BCA Geopolitical Strategy Special Report, "A Global Show Of Force?" dated October 10, 2018, available at gps.bcaresearch.com. 5 Please see BCA U.S. Equity Strategy Special Report, "New Lines Of Communication," dated October 1, 2018, available at uses.bcaresearch.com. 6 Please see BCA U.S. Equity Strategy Special Report, "Is The Stock Rally Long In The FAANG?", dated August 1, 2018, available at uses.bcaresearch.com. Current Recommendations Current Trades Size And Style Views Favor value over growth Favor large over small caps
Energy costs comprise a large chunk of the input costs for freight service firms. The recent drubbing oil suffered will boost margins for airfreight & logistics companies, especially as it materialized on the eve of the busiest season for courier delivery…
Overweight (High-conviction) Air freight & logistics stocks have been bouncing along the bottom for the better part of the past year and have formed a base that should serve as a launch board higher in the coming months. Energy costs comprise a large chunk of freight services input costs and the recent drubbing in oil markets will boost margins especially on the eve of the busiest season for courier delivery services (top panel). On that front, there are high odds that this holiday sales season will be another record setting one, especially given that corporations have paid out bonuses and shared part of the lowering in corporate taxes and also wage inflation is underpinning discretionary incomes. Keep in mind that the accelerating domestic manufacturing shipments-to-inventories ratio confirms that demand for hauling services is upbeat. The implication is that rising demand for freight services will buoy industry profits and lift stock prices out of their recent funk (middle panel). While the U.S./China trade tussle and the greenback are clear risks to our sanguine S&P air freight & logistics transportation subindex and have been intense headwinds for the sector, they are already reflected in depressed valuations (bottom panel). Bottom Line: We reiterate our high-conviction overweight status in the S&P air freight & logistics index; please see last week’s Weekly Report for more details. The ticker symbols for the stocks in this index are: BLBG: S5AIRF - FDX, UPS, EXPD and CHRW.
Dear Client, Next week on November 26th instead of our regular weekly publication you will receive our flagship publication “The Bank Credit Analyst” with our annual investment outlook. Our regular publication service will resume on December 3rd with our high-conviction trades for 2019. Kind regards, Anastasios Avgeriou Highlights Portfolio Strategy We maintain our sanguine U.S. equity market view for the coming 9-12 months and reiterate our conviction that it is a good time to deploy longer-term oriented capital. The signal from our Economic Impulse Indicator represents a yellow flag and we will continue to monitor the economy for additional soft-patch signals, especially as the Fed remains committed to tighten monetary policy three more times by mid-2019. Firming pricing power on the back of recovering demand coupled with input cost deflation suggest that an earnings led recovery in the S&P airlines index is in order. Take profits and boost to an overweight stance today. Burgeoning domestic demand for freight services, healthy industry operating metrics, the recent margin boost owing to the crude oil price collapse along with compelling valuations and technicals, suggest that the path of least resistance is higher for the S&P air freight & logistics group. Recent Changes Book gains in the S&P Airlines index of 18% since inception and lift from below benchmark to overweight today. Table 1 FEATURE The SPX was rudderless last week, as the tug-of-war between bears and bulls has yet to be decided. Equities have been experiencing mini-aftershocks following October's seismic move because the Fed has injected some volatility back into the markets via raising interest rates and allowing bonds to roll off its balance sheet at an accelerating pace. While the Fed stayed pat in November, it will most definitely tighten monetary policy next month for the ninth time this cycle. Fed policy is at the epicenter of recent S&P 500 oscillations, which raises the question: is the Fed tightening monetary policy too far too fast to cause equity market consternation? To put the latest monetary tightening cycle in perspective, we examined trough-to-peak moves in the fed funds rate since the 1950s. Chart 1 shows the results of our analysis. During the past ten Fed tightening cycles, the median trough-to-peak delta in the fed funds rate heading into recession has been 495bps. The latest cycle that commenced in December 2015 is already 25bps above the median, if one uses the Wu-Xia shadow fed funds rate to capture the full quantitative easing effect (Chart 2). Were the Fed to hike three more times by the first half of 2019, as our fixed income strategists expect, this will push the current cycle 100bps above the historical median. Chart 1Too Far Too Fast? Chart 2Trough-To-Peak Tightening Cycle Already Above Historical Median While almost everyone raves about the stellar U.S. economic performance squarely focused on levels of different economic indicators (Chart 3), drilling beneath the surface reveals that small cracks are forming, as we first highlighted in the October 22nd Weekly Report when we introduced our Economic Impulse Indicator (EII).1 The EII is a second derivate equally-weighted composite of six indicators of the U.S. economy, highlighting that peak economy was likely hit this year in Q2, when nominal GDP grew 7.6% on a quarter-over-quarter annualized growth rate basis. Chart 3Do Not Focus On Levels Alone... Chart 4 shows that 5 out of the 6 indicators included in the EII are losing steam, 4 out of 6 are in outright contraction, and only capex is showing modest signs of life. While this backdrop in isolation does not portend recession, were the Fed to go ahead with three additional hikes by mid-year 2019 that would push the fed funds rate to a range of 2.75%-3% and a possible negative Q2/2019 GDP print could then easily invert the yield curve, ticking the box in one of our three recession indicators we track.2 Chart 4...Impulses Tell A Different Story The latest Fed Senior Loan Officer survey released last week also struck a nerve. While bankers are willing extenders of credit throughout most loan categories, demand for loans is declining across the board (Chart 5A); only other consumer (likely student) loans are in high demand, and subprime residential loans are also threatening to break above the zero line.3 Nevertheless, before getting too bearish, a bond valuation examination is in order. BCA's 10-year bond valuation index has been an excellent predictor of cycle ends dating back to the 1960s. It has accurately forecast 6 out of the last 7 recessions missing only the 1974 iteration. When this valuation metric swings to extremely undervalued territory - defined as at least one standard deviation above the historical mean - it signals that a recession is approaching. Why? Typically a selloff in the bond market is associated with a fed tightening cycle and such steep monetary tightening slams the breaks on the economy via the slowing housing market and the dent in consumer spending power. True, we are closing in on this level, but we are not there yet (Chart 5B). Chart 5ALoan Demand In Freefall Chart 5BWatch Bond Valuations Finally, we bought the proverbial dip on October 26th as we did not (and still do not) foresee recession in the coming 9-12 months, underscoring that likely the trough is in place.4 On that front the Minneapolis Fed's implied probability of a 20%+ correction remains tame near the 10% probability mark, corroborating our sense that the worst is behind the equity market, at least for now (Chart 6). Chart 6Risk Of A Bear Market Is Low Netting it all out, we maintain our sanguine equity market view for the coming 9-12 months and reiterate our conviction that it is a good time to deploy longer-term oriented capital. The signal from our EII represents a yellow flag and we will continue to monitor the economy for additional soft-patch signals especially as the Fed remains committed to tighten monetary policy three more times by mid-2019. This week we crystalize gains in the smallest transportation sub-index we cover and boost exposure to overweight, and reiterate our high-conviction overweight stance on a large transportation sub-index. Airlines: Up In The Air Within transports we have been advocating a barbell portfolio preferring air freight & logistics (see below for an update) to airlines (as a reminder we recently downgraded rails to neutral5). The recent carnage in oil markets has breathed a huge sigh of relief into the S&P airlines index (most of which do not hedge fuels costs) as the collapse in WTI crude oil prices has also taken down kerosene prices. Chart 7 shows that input cost relief will be a key driver of a rebound in relative airline profits in the coming months. Thus, we are compelled to trigger our upgrade alert and cement gains of 18% in our underweight and lift exposure to overweight in the niche S&P airlines index. Chart 7Energy Price Plunge Is Bullish For Airline EPS Not only will airlines get a boost from falling jet fuel prices, but also demand for travel remains upbeat. Consumer confidence is sky high and consumer spending is running at a healthy clip, at a time when job certainty is high and wage inflation is making a comeback (Chart 8). Chart 8Air Travel Demand... In fact, a larger proportion of the consumer's wallet is used for air travel, a trend that has been recently gaining steam according to national accounts. Airline load factors are pushing cyclical highs and passenger revenue per available seat mile is also gaining momentum, corroborating the U.S. government consumption expenditure data (Chart 9). Chart 9...Is Upbeat... As a result, airlines have been successful at raising selling prices and will soon exit the deflationary zone. International airfares are also in positive territory. Taken together, robust demand and higher selling prices along with declining fuel costs are a harbinger of rising margins and profits (Chart 10). Chart 10Firming Ticket Prices Is A Boon To Margins This is not yet reflected in depressed relative forward sales and profit growth estimates. Net earnings revisions have also recovered to the zero line and there is scope for additional positive EPS revisions, especially if jet fuel prices stay tamed and travel demand remains healthy. The implication is that relative share price momentum can lift off further (Chart 11). Chart 11Low Hurdle Finally, valuations are perched deeply in the undervalued zone while technicals have only recently returned to a neutral setting (Chart 12). Chart 12Unloved and Under-owned Adding it up, it no longer pays to be bearish airlines. Firming pricing power on the back of recovering demand coupled with input cost deflation suggest that an earnings led recovery in the S&P airlines index is in order. Bottom Line: Take profits in the S&P airlines index of 18% since inception and lift exposure to an above benchmark allocation. The ticker symbols for the stocks in this index are: BLBG: S5AIRL - DAL, LUV, UAL, AAL and ALK. Air Freight & Logistics: We Have Liftoff Air freight & logistics stocks have been bouncing along the bottom for the better part of the past year and have formed a base that should serve as a launch board higher in the coming months. Firming industry operating metrics tell a positive story and suggest that relative share prices will soon take off. Air freight pricing power has been healthy, in expansionary territory and above overall inflation measures, at a time when industry executives have been showing labor restraint, with employment growth decelerating steadily over the past two years (Chart 13). This is a conducive backdrop for air freight profit margins and sell-side analysts have taken notice, penciling in higher margins in the coming 12 months. Chart 13Enticing Margin Prospects Importantly, energy costs comprise a large chunk of freight services input costs and the recent drubbing in oil markets will boost margins especially on the eve of the busiest season for courier delivery services (top panel, Chart 14). Chart 14Holiday Selling Season Beneficiary On that front, there are high odds that this holiday sales season will be another record setting one, especially given that corporations have paid out bonuses and shared part of the lowering in corporate taxes and also wage inflation is underpinning discretionary incomes. Keep in mind that the accelerating domestic manufacturing shipments-to-inventories ratio confirms that demand for hauling services is upbeat. The implication is that rising demand for freight services will buoy industry profits and lift valuations out of their recent funk (middle & bottom panels, Chart 14). With regard to the global macro and trade backdrop, while global revenue ton miles and G3 capital goods orders remain near cyclical highs (Chart 15), were Trump's trade rhetoric to re-escalate then global exports would give way. Already international and U.S. export expectations are on the verge of contracting - according to the IFO World Economic Survey and ISM manufacturing survey, respectively. Tack on the appreciating U.S. currency and the clouds darken further (bottom panel, Chart 15). The U.S./China trade tussle and the greenback are clear risks to our sanguine S&P air freight & logistics transportation subindex. Chart 15Greenback And Decelerating Global Growth Are Key Risks... Nevertheless, most of the grim news is already reflected in depressed relative forward profit estimates, bombed out valuations and washed out technicals. In sum, firming domestic demand for freight services, healthy industry operating metrics, the recent margin boost owing to the crude oil price collapse along with compelling valuations and technicals suggest that the path of least resistance is higher for the S&P air freight & logistics group (Chart 16). Chart 16...But Already Reflected In Depressed Valuations And Washed Out Technicals Bottom Line: We reiterate our high-conviction overweight status in the S&P air freight & logistics index. The ticker symbols for the stocks in this index are: BLBG: S5AIRF - FDX, UPS, EXPD and CHRW. Anastasios Avgeriou, Vice President U.S. Equity Strategy anastasios@bcaresearch.com 1 Please see BCA U.S. Equity Strategy Report, "Icarus Moment?" dated October 22, 2018, available at uses.bcaresearch.com. 2 Ibid. 3 https://www.federalreserve.gov/data/documents/sloos-201810-charts.pdf 4 Please see BCA U.S. Equity Strategy Insight Report, “Time To Bargain Hunt” dated October 26, 2018, available at uses.bcaresearch.com. 5 Please see BCA U.S. Equity Strategy Report, "Critical Reset" dated October 29, 2018, available at uses.bcaresearch.com. Current Recommendations Current Trades Size And Style Views Favor value over growth Favor large over small caps