特別レポート
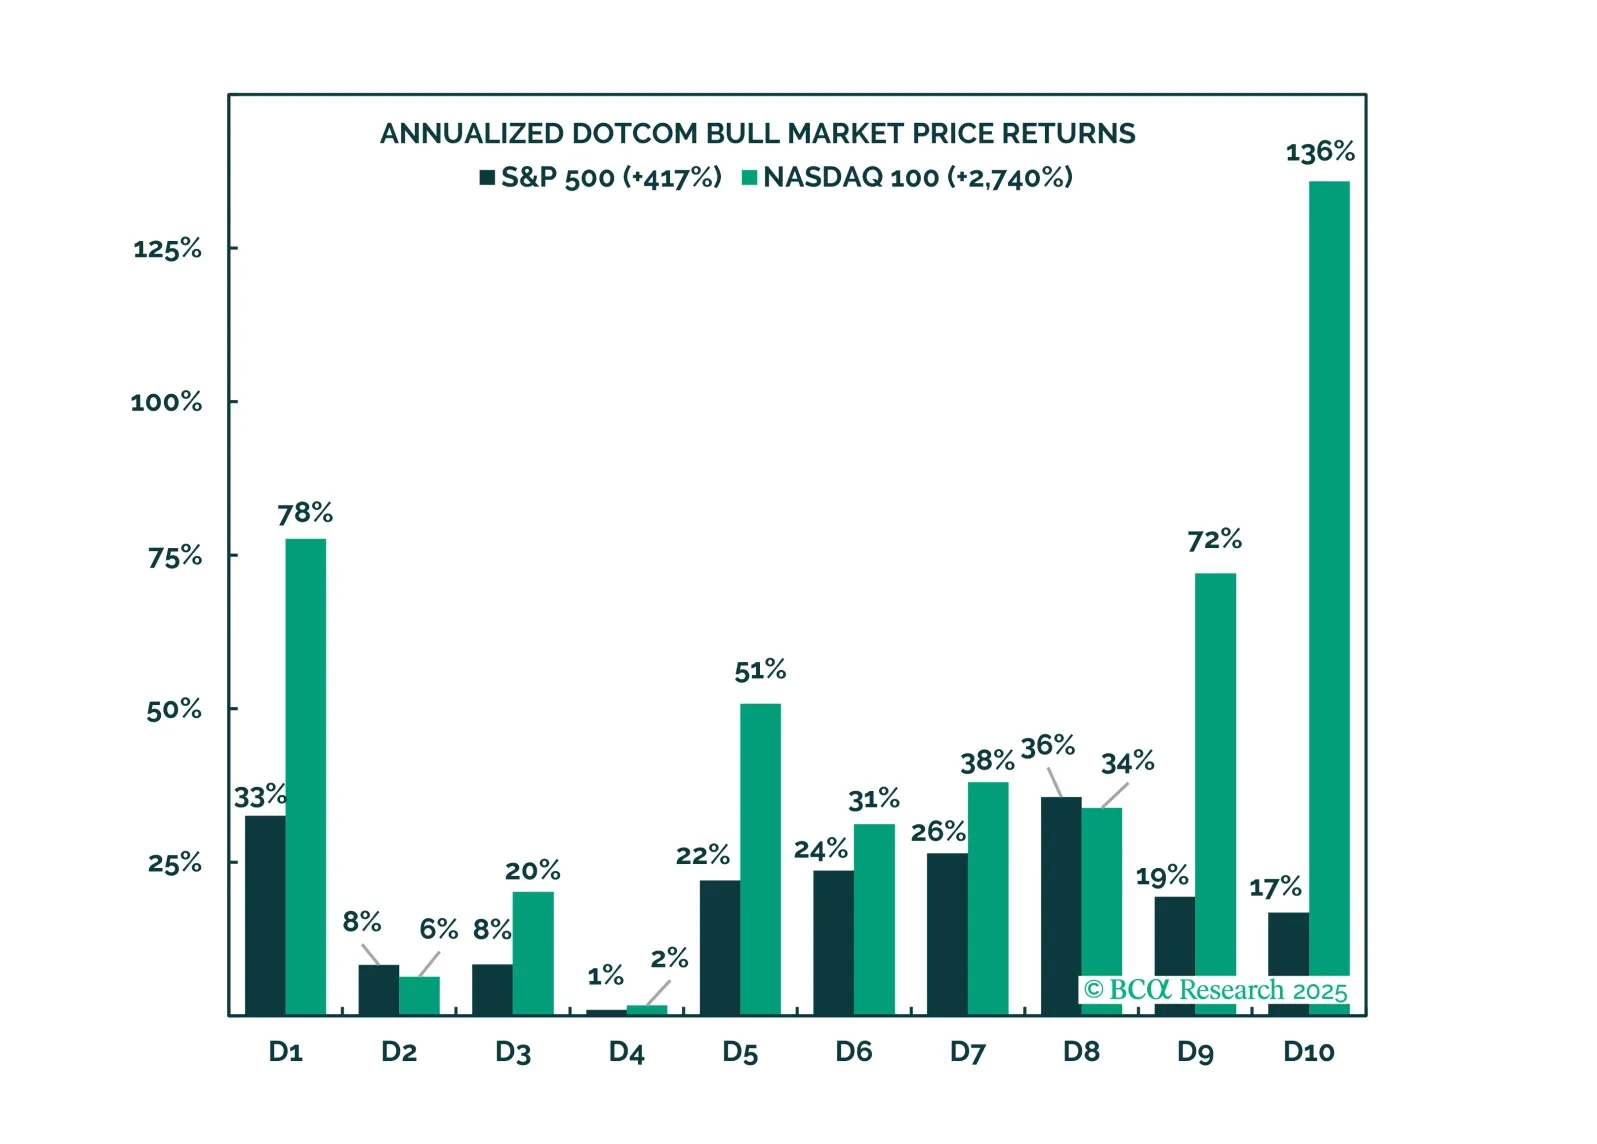
Highlights Even after the COVID-19 pandemic is over, likely within 18 months, many behavioral changes that were forced on society by social distancing will remain. Individuals who have gotten used to working from home, shopping online, and using the internet for socializing and entertainment will continue to do so. Amid any large structural shift, it is easier to spot losers than winners. The biggest losers are likely to be: (1) Parts of the real estate industry, as companies shed expensive city-center office space and office workers move away from big cities; and (2) the travel industry, since business travel will decline. The winners will include: Health care (as governments spend to strengthen medical services); capital-goods producers (with US manufacturers increasingly reshoring production but automating more); and the broadly-defined IT sector which, while expensively valued, is nowhere near its 2000 level and has several years of strong growth ahead. “We always overestimate the change that will occur in the next two years and underestimate the change that will occur in the next ten.” – Bill Gates “There are decades where nothing happens, and there are weeks where decades happen.” – Lenin Introduction The world has been turned upside down since February by the coronavirus pandemic. Households all around the globe have been forced to stay indoors; companies have been forced to drastically change working practices; some industries, such as online shopping or videoconferencing software, have seen a surge in demand. But once the pandemic is over, how many of these changes will stick? What will be the long-term impact on society, the workplace, consumer attitudes, and companies’ strategic planning? How should investors position themselves to take advantage of secular changes in the sectors that will be most affected, ranging from health care and technology, to real estate, retailing, and travel? In this Special Report (which should be read in conjunction with two other recent BCA Research Special Reports on the macro-economic and geopolitical consequences, respectively, of COVID-191), we look at the social and industry implications of the coronavirus pandemic. We assume that, within the next 12-to-18 months, the pandemic will be a thing of the past, either because a vaccine has been developed, or because enough people have caught it for herd immunity to develop. This does not mean that people will be unconcerned about a reoccurrence, or about a new virus triggering another epidemic. Pandemics are not rare, even in modern history (Table 1). And COVID-19 may return as an annual mild seasonal flu (as the 1968 Asian flu did), but which is not serious enough to alter behavior. But the assumption in this report is that, within a couple of years, people will feel comfortable again about being in crowded spaces and traveling, without a need for social distancing or periodic lockdowns. Table 1Estimated Mortality And Infection Rates Of Pandemics During The Past Century But that doesn’t mean that everything will return to the status quo ante. At least some individuals who have gotten used to working from home, video conferencing, and shopping online will continue these practices. Companies will, therefore, need to rethink their employment policies, as well as how they manage their office space, global supply chains, and just-in-time inventories. Government policies towards health care and education will need to be rethought. None of these changes are new. Indeed, the result of an exogenous shock is often simply to accelerate trends that were already in place. E-commerce, telecommuting, and “reshoring” have already been growing steadily for years. COVID-19 is, however, likely to accelerate these shifts. Not every individual or company will change their behavior, but even small changes at the margin can have a significant impact. Ultimately, what these changes amount to is a liberalization of space and time. Employees do not need to be in the same physical space to work together. Students can choose when to listen to a lecture. Music lovers based in a small city can have the same access to a live (streamed) concert as those in London or New York. This Special Report is divided into two sections. In the first section, we examine the meta-changes in consumer and corporate behavior that could result from the pandemic. How widely will the shift from office-based work to “working from home” stick? How much will shopping, entertainment, and education stay online? Will companies really bring back a large chunk of manufacturing from overseas? In the second section, we analyze the impact on specific industries, such as real estate, health care, technology, and retailing, and make some suggestions as to how investors should tilt their portfolios over the longer term to take advantage of these trends. In summary, we identify the winners as health care, technology, and capital-goods producers. The clear losers are in real estate and travel. Retailing and consumer goods will see a significant shakeout, with both winners and losers, but the overall impact on these industries will be neutral. Social Impacts Working From Home Teleworking, or working from home, is hardly new. Craftsmen before the industrial revolution did so as a matter of course. But the development of computers and telecommunications in the 1980s made it feasible for white-collar workers to work from home too. As Peter Drucker wrote as long ago as 1993: "...commuting to office work is obsolete. It is now infinitely easier, cheaper and faster to do what the nineteenth century could not do: move information, and with it office work, to where the people are."2 Until now, however, teleworking has been rare. But the requirements imposed by the pandemic could cause that to change. Technically, it is possible for workers in many job categories to telework effectively. A recent study by Jonathan Dingel and Brent Neiman3 estimated, based on job characteristics, that it is feasible for 37% of all jobs in the US to be done entirely from home (46% if weighted by wages). The vast majority of jobs in sectors such as education, professional services, and company management could be done from home (Table 2). Extending the analysis to other countries, they find that more than 35% of jobs in most developing countries can be done from home, but less than 25% in manufacturing-heavy emerging economies such as Turkey and Mexico (Chart 1). Table 2Share Of Jobs That Can Be Done At Home, By Industry Chart 1Share Of Jobs That Can Be Done At Home, By Country But, in practice, before the coronavirus pandemic, many fewer people than this worked from home. Partly this was simply because many companies did not allow it. A survey by OWL Labs in 2018 found that 44% of companies around the world required employees to work from an office, with no option to work remotely.4 The percentage was even higher, 53%, in both Asia and Latin America. By contrast, OWL did find that 52% of employees globally worked from home at least occasionally, and that as many as 18% of respondents reported working from home always. The pandemic forced many white-collar workers to telework for the first time. The Pew Research Center found that 40% of US adults – and as many as 62% of those with at least a bachelor’s degree – worked from home during the crisis.5 How white-collar workers found the experience, and whether they plan to continue to work from home some of the time even if not required to do so, vary widely. Employers are generally positive about the idea. A survey of hiring managers by Upwork found that 56% believed that remote working functioned better than expected during the crisis (Chart 2). They cited reduced meetings, fewer distractions, increased productivity, and greater autonomy as reasons for this. The major drawbacks were technological issues, reduced team cohesion, and communication difficulties. Another survey, by realtor Redfin, found that 76% of US office workers had worked from home during the crisis (compared to only 36% who worked from home at least some of the time beforehand) and that 33% of respondents who had not worked remotely pre-shutdown expect to work remotely after shutdowns end (with another 39% unsure) (Chart 3). Chart 2Employers Found That Teleworking Worked Well Chart 3Many Employees Expect To Continue Working Remotely After The Pandemic Ends But there are problems too. Research published in the Journal of Applied Psychology found that, while teleworking has some clear advantages, such as improved work-family interface, greater job satisfaction, and enhanced autonomy, it also has drawbacks. Most notably, if workers aren’t in the office at least half the week, relationships with fellow workers suffer, as does collaboration.6 There are also developed countries where backward technology has made the experience of working from home difficult. This is particularly the case in Japan. A survey by the Japan Productivity Center found that 66% of office workers said their productivity fell when working from home; 43% were dissatisfied with the experience. The reasons cited for the dissatisfaction were “lack of access to documents when not in the office” (49%), “a poor telecommunications environment” (44%), and a difficult working environment, such as lack of desk space (44%). Japanese companies remain rather paper-based, and household living space tends to be small. Research carried out on employees at Chinese online travel company Ctrip before the pandemic concluded that home working led to a 13% performance increase but, crucially, there were four requirements for working from home to succeed: Children must be in school or daycare; employees must have a home office that is not a bedroom; complete privacy in that room is essential; and employees must have a choice of whether to work from home.7 After the pandemic, a significant shift in the pattern of office work is likely. Many workers will work remotely part or most of the time. But they will also benefit from coming to an office a certain number of days a month to work together, bond with co-workers, exchange ideas, etc. Online Shopping E-commerce has been growing steadily for years. In the US, it increased by 15% year-on-year in 2019, to reach $602 bn, or 16% of total retail sales (Charts 4 and 5). The share is even higher in some other countries: For example, 25% in China and 22% in the UK. The pandemic caused a big acceleration in e-commerce the first few months of this year, as consumers in most countries around the world were either not allowed to go outside, or felt unsafe doing so. Chart 4The Share Of E-commerce Has Been Steadily Expanding For Years… Data from Mastercard show that, in the worst period of lockdowns in April, e-commerce grew by 63% in the US, and 64% in the UK year-on-year, compared to a decline of 15% and 8%, respectively, in overall retail sales (Chart 6). The growth was particularly apparent in products such as home improvement, footwear, and apparel (Chart 7). Chart 5…With Growth Of Around 15% A Year Chart 6In April, Online Sales Soared… Chart 7…Especially In Certain Categories Moreover, many consumers in advanced economies bought goods such as clothing, medicine, and books online for the first time, and used services such as online grocery delivery, and apps to order food from restaurants (Chart 8). Note, however, that few consumers bought financial services, magazines, music, and videos online for the first time. Presumably these are products that the vast majority of households had already been consuming online. Chart 8Consumers Shifted Purchases Of Many Items Online It is hard to know how sticky these trends will be. Once shops permanently reopen without restrictions, will consumers simply return to their old habits of going to supermarkets, restaurants, and clothing stores? Perhaps many enjoy the experience of browsing. It seems likely, however, that the newly acquired habit of shopping online will at least accelerate the trend towards e-commerce. Many of those who ordered, for example, supermarket deliveries online for the first time will continue to do so at least occasionally in the future. Other changes are likely too: Many smaller retailers were forced to close their physical stores during the pandemic and so had no choice but to set up an online delivery service. Some struggled with this, but others were aided by companies such as Shopify, which simplify the process of setting up a website, processing payments, and arranging delivery. Shopify now works with over a million merchants. These smaller retailers are now better able to compete with giants such as Amazon. During the lockdown, US consumers notably diversified their online product searches away from Amazon and Google to smaller retailers (Chart 9). Chart 9Search Diversified Away From Amazon And Google We might see a trend towards smaller-scale, local shops benefiting as consumers stick to shopping in smaller stores closer to their homes. Many stores during the pandemic refused to accept cash; this might accelerate the shift towards contactless payments. Consumers may be less focused in future on conspicuous consumption. The trend towards wellness, home-cooking, gardening, crafts, and self-investment might continue. Other Uses Of Technology It is not only work and shopping habits that changed during lockdowns. Individuals also got used to a range of technologies for socializing, entertainment, education, and medical consultation. Consumer surveys by the Pew Research Center show that a third of American adults have socialized online using services such as Zoom, and a quarter have used online systems for work or conferences (Chart 10). But these percentages are much higher for certain demographics. For example, 48% of 18-to-29 year-olds have socialized online, and 30% of this age group have taken online fitness classes. The percentage using video systems for work is as high as 48% for people with a college degree. And, unsurprisingly, with many university courses moving online since the spring, 38% of 18-to-29 year-olds say they have taken an online class. Chart 10Individuals Have Been Socializing And Communicating More Online How sticky these trends will be once the pandemic is over is not easy to forecast. But further research by Pew showed that 27% of US adults believed that online and telephone contacts are “just as good as in-person contact,” and only 8% thought of them as not much help at all, although a rather larger 64% answered that online socializing is “useful but will not be a replacement for in-person contact.” The responses differed little between gender, race, and political views, although fewer people under the age of 30 thought online contacts were as good as in-person ones (Table 3). Table 3How Do Online Interactions Compare To In-Person Ones? Another survey in Japan by Ipsos suggests that people’s values have changed as a result of the pandemic and quarantines, with a greater focus on wellbeing, home-based activities such as cooking, and self-improvement. When questioned, a large percentage of people believe they will persist with these habits even when lockdowns end. For example, 51% of Japanese respondents believe they will continue to enjoy themselves as much as possible at home in their spare time, compared to only 20% who favored entertainment at home before the pandemic (Chart 11). Chart 11Pandemic Brought A Greater Focus On Wellbeing And Home-Based Activities Other areas that have moved online en masse include education, health care, the judiciary, concerts, and sports (e-sports, and popular sports such as soccer and baseball that are now being played in empty venues). Education at the tertiary level in advanced economies was already partly online before the pandemic. In the US, out of 19.7 million tertiary students in 2017, 2.2 million (13.3%) were enrolled in exclusively online/distance learning courses, and another 3.2 million (19.5%) took at least one course online.8 Of course, everything changed during the pandemic, with 98% of US institutions moving the majority of in-person courses online, and many planning to continue this through the Fall 2020 semester. At the elementary and secondary school level, online education was much more limited pre-pandemic. According to the National Center for Educational Statistics, 21% of US schools offered some courses entirely online in 2016 but, of this 21%, only 6% offered all their courses online and only another 6% the majority of courses. Many of these schools were forced to shift entirely online during lockdowns: According to UNESCO data, at the peak of the pandemic 1.6 billion children (90% of the total in school) in 191 countries attended schools that had closed physically. It seems likely that, while in-person teaching will remain the central method of education, distance and online learning solutions, even at the high school level, will become more prevalent in the future. The health care sector has lagged in technology, in terms of using AI for diagnosis, digitalizing patient records, and offering online doctor-patient consultation. But the use of digital tools had started to increase in recent years, particularly in the number of practices using telemedicine and virtual visits (Chart 12). At the peak of the pandemic in April, the number of telehealth visits in the US rose by 14% year-on-year, compared to a 69% decline in in-person visits to a doctor.9 It seems likely that this trend will continue, as medical practitioners find viritual consultations more efficient and effective for many simple initial diagnoses, and as sick or elderly patients prefer to avoid a physical visit to a surgery.10 Chart 12The Transition To A Digital-Driven Health Care Model Travel Travelers have been very reluctant to get back on airplanes and stay in hotels again, even in countries and regions where the pandemic has eased over the past couple of months (Chart 13). Based on our assumption that the pandemic will be completely over within 18 months, it seems likely that people will eventually resume travelling, at least for leisure and to see family and friends. After previous disruptions to global travel, such as 9/11 and SARS, it took only two-to-three years for air travel to resumed its pre-crisis trend (Chart 14). Chart 13Travelers Remained Reluctant Even When Pandemic Eased Business travel might be very different, however. Salespeople who have become used to making sales calls over Zoom may not feel the need to travel to see clients so much. Conferences, exhibitions, and other events will be increasingly (at least partly) online. Travel budgets are a large expense for many companies. According to estimates by Certify, a travel software provider, spending on business trips in 2019 totalled $1.5 trillion (including $315 billion by US businesses). The availability of a technological alternative to at least some business trips will provide a good excuse for many companies to meaningfully reduce the number of trips and their travel budget. In the future, business travel may become more of a privilege than a necessity. It is easy to imagine a significant decline in overall business travel. Manufacturing Supply Chains Corporate behavior could also change as a result of the disruptions caused by the coronavirus. Companies in the US and Europe realized how vulnerable their complex supply chains are. Popular and political pressure is pushing firms to reshore at least some of their overseas production. Firms will need to build in more “operational resilience,” with higher levels of inventory, less debt, and greater redundancy in their systems. Developed economies such as the US have been deindustrializing for 40 years – since reforms in China in the late 1970s, followed by Mexico and central Europe in the 1990s, made these countries appealing locations for cheap manufacturing. US manufacturing employment has almost halved since 1980, falling to only 27% of the workforce (Chart 15). Manufacturing output, especially outside of the computer sector, has substantially lagged that of the overall private sector (Chart 16). The US has also fallen behind in automation, with a much lower number of robots per manufacturing worker than in countries such as Germany and Japan (Chart 17). Chart 15US Manufacturing Employment Has Halved Since 1980 Chart 16Manufacturing Output Outside The Computer Sector Has Lagged Chart 17The US Has Relatively Few Robots The pandemic highlighted how vulnerable widely distributed supply chains are. This was clearest in the health care sector. The US is far away the biggest spender on health care research and development (Chart 18). And yet it was unable to provide critical medical equipment such as face masks, testing kits, and ventilators to its population at an adequate rate, mainly because almost 70% of the facilities which manufacture essential medicines are based abroad (Chart 19). During the pandemic, countries such as China and India prioritized their own citizens, forcing the US government to strike emergency deals to avoid drug shortages. Chart 18The US Spends A Lot On R&D In Health Care… Chart 19…But Drug Production Is Mostly Done Overseas Once the crisis subsides, CEOs of American companies (as well as the US government) will have to decide if they are comfortable with the fact that, while they possess a vast store of intellectual capital, the manufacturing of their products happens halfway around the world. What happens if there is another pandemic? What about a global disaster caused by climate change? Finally, and perhaps more worryingly, what happens if tensions between the US and China escalate seriously? This shift will not happen overnight: China still has much cheaper labor, an enormous manufacturing base of factories and parts suppliers, and formidable transportation infrastructure. Many aspects of supply chains are too deep-rooted and the economics too compelling for them to be unwound quickly. Some production will shift from China to other emerging economies. A Biden administration might be less confrontational with China, and could lower some of the Trump tariffs. But, at the margin, companies will choose to build new factories in the US (and in western Europe and Japan), with highly automated systems. Government policy (via both subsidies and tariffs) will encourage these trends. Manufacturers which have lived “on the edge” in recent years, with dispersed supply chains, just-in-time processes, minimal inventories, the fewest possible workers, and the maximum amount of debt compatible with their targeted credit rating (often BBB) now understand the need to build redundancy into their systems. Corporate debt levels are high by historical standards in many countries (Chart 20). Companies may want to build up a buffer of net cash in the future, as Japanese companies did for decades after the bubble there burst in 1990. Inventories have risen a little relative to sales since the Global Financial Crisis but will probably rise further (Chart 21). These trends are likely to be negative for profit margins. Chart 20In The Future, Will Companies Be Happy With This Much Debt... Chart 21...And Such Low Level Of Inventories? Implications For Industries In light of the social changes described above, how will various industries be reshaped over the coming years? Which sectors should investors tilt towards because they are likely to emerge as winners from post-COVID structural shifts? And which are the sectors that investors should avoid since they will suffer from the creative destruction? In the midst of major social and technological change, it is often easier to spot losers than winners. Think of the arrival of the internet in the 1990s. How many investors would have correctly picked Google, Amazon, Apple, and only a handful of others as the winners? It would have been easier to correctly identify industries that were likely to lose out to disruption, such as book retailers, travel agents, newspaper publishers, and TV broadcasters. We start, therefore, with the industries likely to lose out from post-COVID changes. The Losers Real Estate Over the next few years, prime real estate seems the most likely loser. It is not clear how many white-collar workers will choose to work from home in the future, or how many days a month they will want to come into an office to meet with fellow workers. But it seems likely there will be a strong continued trend in the direction of remote working. As a result, demand for prime central-business-district property will fall, given that it is very expensive. In Manhattan, for example, the average workspace for each of the 1.5 million office workers is around 310 square feet. At pre-COVID rental costs, that amounts to an average of $20,000 per employee – and more than $30,000 for A+ grade buildings. And rent is only part of what a company pays: There are also costs for cleaning, utilities, technology, security, coffee machines, and cafeterias on top of that. Employees working at home pay for their own space, utilities, food (and often even computer equipment). The size, location, and layout of offices will need to be rethought. Maybe companies will choose to build a campus in the suburbs, with a range of different working spaces (for meetings, quiet work, or collaboration). They may prefer to rent shared co-working spaces by the day or week. Some real estate developers and builders would be beneficiaries of this. Companies would save money in real estate costs. But they may need to pay a stipend to employees who work at home to cover the extra space they will require, and to upgrade their technology (computer equipment, internet speed, and so on). On the other hand, companies may pay lower salaries for workers who move out of high-cost locations such as Manhattan or London to places where it is cheaper to live. Many office spaces are leased on a long-term basis, so some companies will not be able to move out of big cities immediately. But residential property is more liquid. The trends in work practices might accelerate a shift to the suburbs which has already been emerging over the past few years (Chart 22). Workers will not need to live so close to the company’s office if they will visit it for only a few days a month. Small towns with a lively community and pleasant environment (and decent transportation links to a big city) could grow in popularity. This would be bad news for developers which are specialized in developing residential property in cities such as London, Sydney, Toronto, and Vancouver, and for the owners of those properties. But it might be positive for builders who will develop the new houses and out-of-town office campuses. Chart 22The Shift To The Suburbs Was Already Taking Place This does not mean that cities will wither away. After previous epidemics and crises in history (think the Great Plague of London in the 17th century, or 9/11), they have always bounced back. “Casual collisions” – chance meetings with interesting people which lead to collaborative relationships – are crucial in creative industries, and happen online only with difficulty. Buildings will be repurposed: Retail space will be turned into warehouses or apartments, for example. A fall in rents would allow cities to “degentrify” and attract back young people, making the city more dynamic again. But the period of transition could be painful for some segments of the real estate industry. Travel A permanent decline in business travel would be a significant blow to airlines and hotel chains. Business travelers account for only about 12% of the number of air tickets purchased, but they generate 70%-75% of airlines’ profits. Even discount leisure airlines such as Southwest have in recent years started to target business travelers. And it will not just be airlines that are affected. Data from the US Travel Association show that 26% of the $2.5 trillion in travel-related revenues in the US in 2018 came from business travelers. Of that, 17% goes to air travel, 13% to accommodation, and 5% to car rental. An even larger portion goes to food (21%). Around 40% of hotel rooms are occupied by business travelers. Conference organizers and venues could also suffer: 62% of US business trips are to attend conferences. “Sharing economy” companies would be affected too. In 2018, 700,000 business travelers booked accommodation through AirBnB, and 78% of business travelers use Uber and other ride-sharing services. Furthermore, a slowdown in business travel would have knock-on effects on the leisure travel sector. Surveys suggest that almost 40% of business trips in the US are extended to include leisure activities (“bleisure” in the travel industry parlance). The Winners Health Care A recent report by BCA Research’s Global Asset Allocation service argued in detail that the macro environment for global health care equities will remain very positive in the coming years.11 An aging population in the world, and a growing middle class in emerging countries will steadily raise demand for health care services (Charts 23 and 24). China, in particular, has underinvested in health care: It spends only 5% of GDP, barely higher than it did 20 years ago, and well behind other emerging economies such as Brazil and South Africa (Chart 25). Chart 23Positives For Health Care Include An Aging Population… Chart 24…And A Growing Emerging Market Middle Class As a result of the COVID-19 pandemic, governments everywhere will need to spend more money on health care (or, in the case of the US, perhaps spend it more effectively). In the US, before the pandemic, intensive-care beds were sufficient to cope only with the peak of a normal seasonal influenza breakout. The World Health Organization warns that, while pandemics are rare, highly disruptive regional and local outbreaks of infectious diseases are becoming more common (Chart 26). More money will need to be spent, in particular, on developing health care technology (online consultations, digitalized patient records, track-and-trace systems), on improving senior care homes (80% of COVID-19 deaths in the Canadian province of Quebec were in such facilities), and on biotech (such as gene-related therapies). Chart 25Expenditures On Health Care Will Have To Grow Chart 26Number Of Countries Experiencing Serious Outbreak Of Infectious Disease The health care equity sector is not expensive, trading in line with its long-run average valuation (Chart 27). Within the sector, biotech and health care technology look more attractive than pharmaceuticals, which are expensive and vulnerable to the price caps proposed by Joe Biden if he is elected US president this November. Chart 27Health Care Stocks Are Not Expensive Technology In a plethora of ways, the pandemic has propelled the use of technology: For working at home, communication, online shopping, entertainment, etc. Companies such as Zoom have moved from niche players to mainstream business providers: Zoom’s peak daily users rose from 10 million in December 2019 to 300 million in April. Chart 28Tech Stocks Are Nowhere Close To Previous Peaks Assuming that at least some of these developments remain in place once the pandemic is over, it is easy to see how technology stocks (broadly defined to include any company that uses information technology as a central part of its business) will continue to prosper. These stocks will not be just in the IT sector, but also in communications and consumer discretionary. Picking the individual winners will be hard: Will Microsoft overtake Amazon in cloud computing? Will Zoom’s much-discussed privacy issues undermine it? Will competitors emerge to Shopify in merchant services? Can Spotify compete with Apple in online music streaming? But the broadly-defined sector seems likely to have improving fundamentals for some years to come. The only question is whether the good news is already priced in, after the huge run-up in stock prices over the past few years. We do not believe it is fully. The valuations of these sectors are still nowhere close to the level they reached at the peak of the TMT Bubble in 1999-2000 (Chart 28), they have strong balance-sheets, and considerable earnings power. For their outperformance to end, it will take one of two things. The first trigger could be a significant shift down in growth. Over the past three years, Amazon has grown EPS at a compound rate of 47%, and Netflix at 76% (Chart 29). Over the next three years (2020-2023), analysts forecast compound EPS growth of 32% for Netflix, 30% for Amazon, 15% for Facebook (compared to 24% in 2016-2019), and 12% for Microsoft (compared to 16%). Those are still impressive growth numbers, and should be achievable as long as these companies can continue to grow market share. Chart 29Can The Big Tech Stocks Keep Growing Earnings At This Rate? The second set of risks would be regulatory: A move to break up companies such as Google and Amazon, the US introducing data privacy legislation similar to that in the European Union, or a move to a digital tax or minimum global taxation. None of these seems likely in the immediate future. Automation/Robotics/Capital Goods The return, at the margin, of some manufacturing to the United States (and other developed economies) will bring about economic changes. Unable to tap into the pool of cheap international labor as easily as before, companies will have to invest significantly in this sector. This will result in the following: A resurgence of manufacturing productivity, thanks to increased investment. An intensification of automation. The US will need to boost the number of robots per capita to compete with Korea, Germany, and Japan. This will further improve productivity. The development of a high-tech manufacturing sector. Analogous to the FAANG stocks during the 2010s, a new group of innovative manufacturing companies could emerge. New infrastructure, roads, factories, and machinery will be needed to replace what is now an outdated capital stock in the US (Chart 30). These trends should all be positive for the capital-goods sector. Such a project would also need large amounts of raw materials. This might push up the prices of commodities such as industrial metals, and benefit materials producers. As mentioned above, it could boost the price of real estate outside of the major cities, where the new manufacturers would be likely to set up. Chart 30The US Capital Stock Is Becoming Outdated Mixed Retailing / Consumer Goods Retailing is likely to see a significant shakeout over the next few years. The cracks have been apparent for some years: Decreasing footfall, and empty units on many high streets and shopping malls, amid the shift to online shopping. A shift to the suburbs and further growth in online shopping will change retailing further. Rents in the highest end Manhattan shopping districts have already fallen noticeably since the start of the year, especially Lower Fifth Avenue (between 42nd and 49th Streets) which is dominated by large chain stores (Chart 31). Shopping malls, particularly undistinguished ones in poorer areas, will continue to suffer. Overall, the US in particular has an excess of retailing space, almost five times as much per capita as the major European economies (Chart 32). Chart 31Manhattan Retail Store Rents Already Falling Sharply Chart 32The US Has Far Too Much Retail Space But it is hard to predict the winners from this shake-out. Overall spending by consumers is unlikely to be significantly affected, so it is a matter of forecasting which companies and formats will emerge victorious. Will Walmart and Target and other large retail chains improve their online offering to fight back against Amazon? Facebook, Shopify, and others have set up new services to compete with Amazon on price – will they be successful? Will small stores start to win back market share? Will supermarkets figure out how to make profits from their order-online-and-deliver services (which are now very costly because most often a human has to run around the store picking out the items ordered), or will new, fully automated competitors emerge? Will new technologies materialize to make it easier to buy clothes online (for example, digitized body measuring systems)? These changes will also affect producers of consumer products. They will have to understand the new channels, and adapt their offerings and positioning strategies accordingly. These changes will make the sector a tricky one. A skilled fund manager might be able to predict which companies’ strategies will be successful. But it could be a problematic area for investors owning individual stocks within the sector who do not have detailed expertise. Garry Evans, Senior Vice President Global Asset Allocation garry@bcaresearch.com Footnotes 1 Please see The Bank Credit Analyst, "Beyond The Virus," dated May 22, 2020 and Geopolitical Strategy, "Nationalism And Globalization After COVID-19," dated June 26, 2020. 2 Peter E. Drucker, "The Ecological Vision: Reflections on the American Condition," 1993, p.340. 3 Jonathan I. Dingel and Brent Neiman, "How Many Jobs Can Be Done At Home?" NBER Working Paper No. 26948, April 2020. 4 OWL Labs, “The State of Remote Work Report,” available at www.owllabs.com. 5 Pew Research Center survey conducted March 19-24 2020. Please see https://www.pewsocialtrends.org/2020/03/30/most-americans-say-coronavirus-outbreak-has-impacted-their-lives/psdt_03-30-20_covid-impact-00-4/ 6 Gajendran, R.S., & Harrison, D.A., “The Good, the Bad, and the Unknown about Telecommuting”, Journal of Applied Psychology 92(6), 2007. 7 Nicholas Bloom, James Liang, John Roberts & Zhichun Jenny Ying, “Does Working from Home Work? Evidence From a Chinese Experiment,” The Quarterly Journal of Economics (2015), 165-218. 8 Please see educationdata.org. 9 Ateev Mehrotra, Michael Chernew, David Linetsky, Hilary Hatch, and David Cutler, "The Impact of the COVID-19 Pandemic on Outpatient Visits: A Rebound Emerges," The Commonwealth Fund, dated May 19, 2020. 10For more on the long-term outlook for the health care sector, Global Asset Allocation Special Report, "The Healthcare Revolution: The Case For Staying Overweight," dated July 24, 2020, available at gaa.bcaresearch.com. 11Please see Global Asset Allocation Special Report, "The Healthcare Revolution: The Case For Staying Overweight,"dated July 24, 2020, available at gaa.bcaresearch.com.