パラジウム
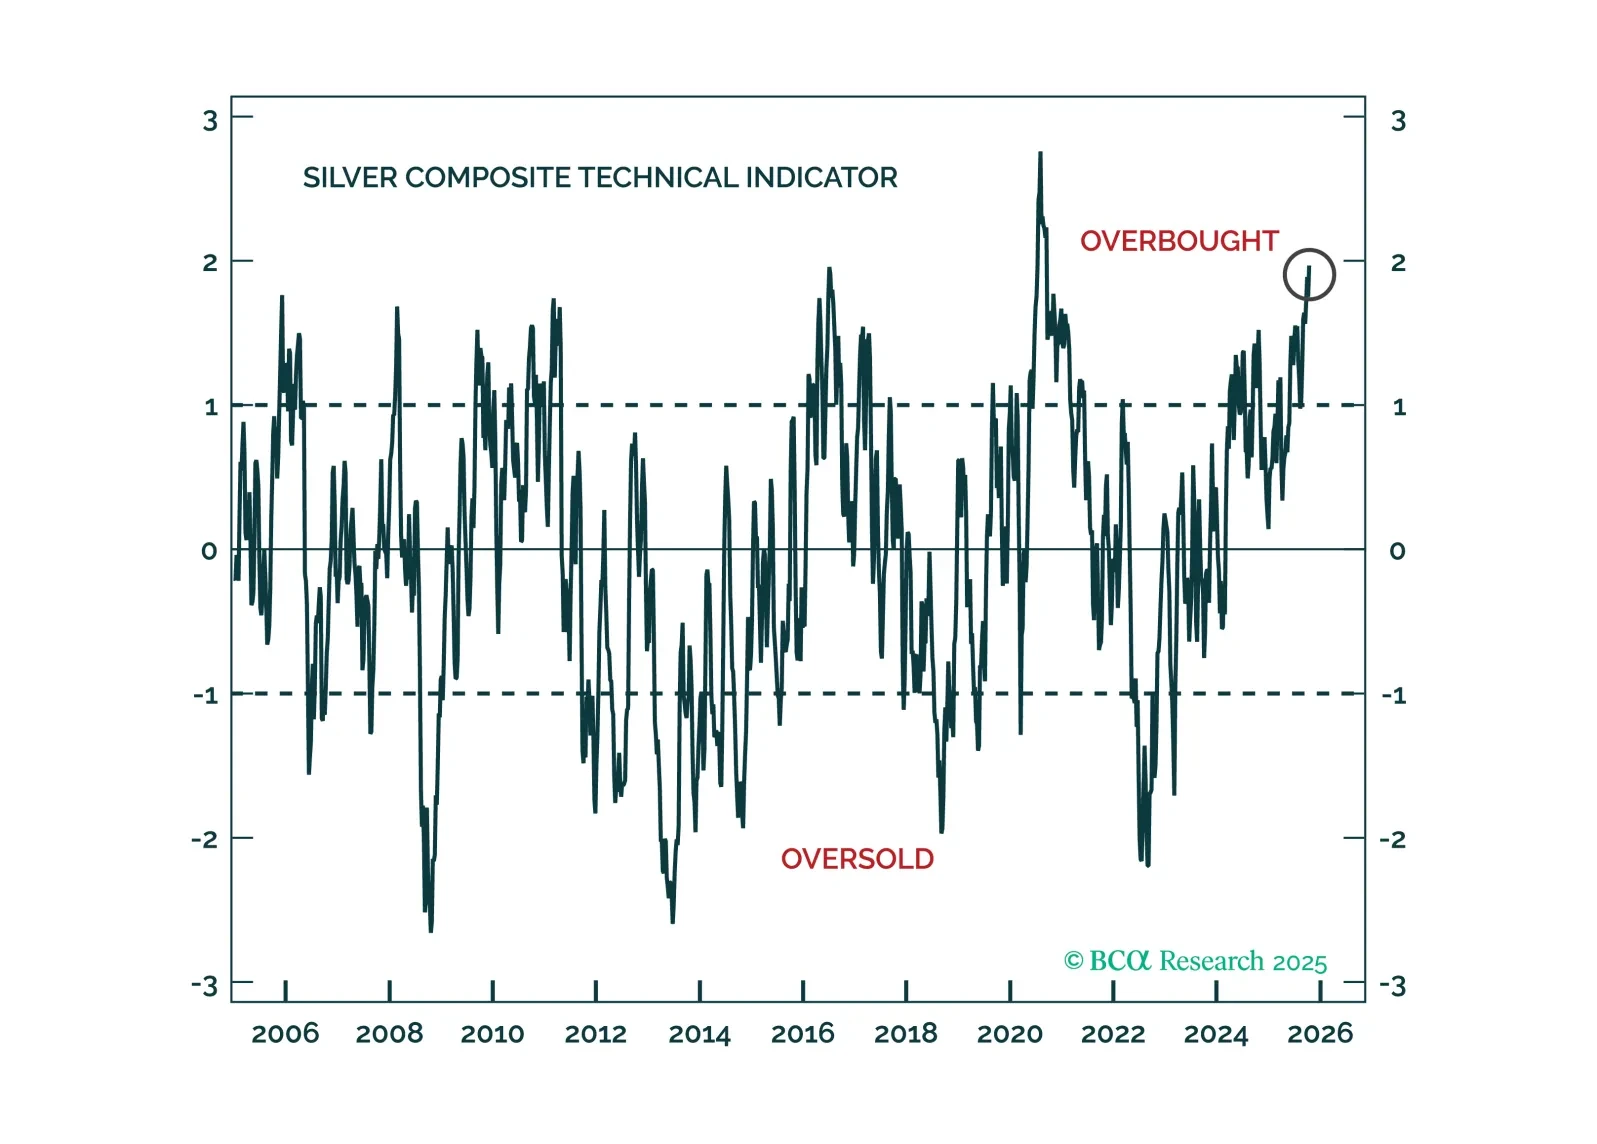
全ての貴金属市場に投機的な熱狂が広がっていますが、金は構造的な追い風のおかげで他の貴金属よりも調整局面をうまく乗り切ることができるでしょう。
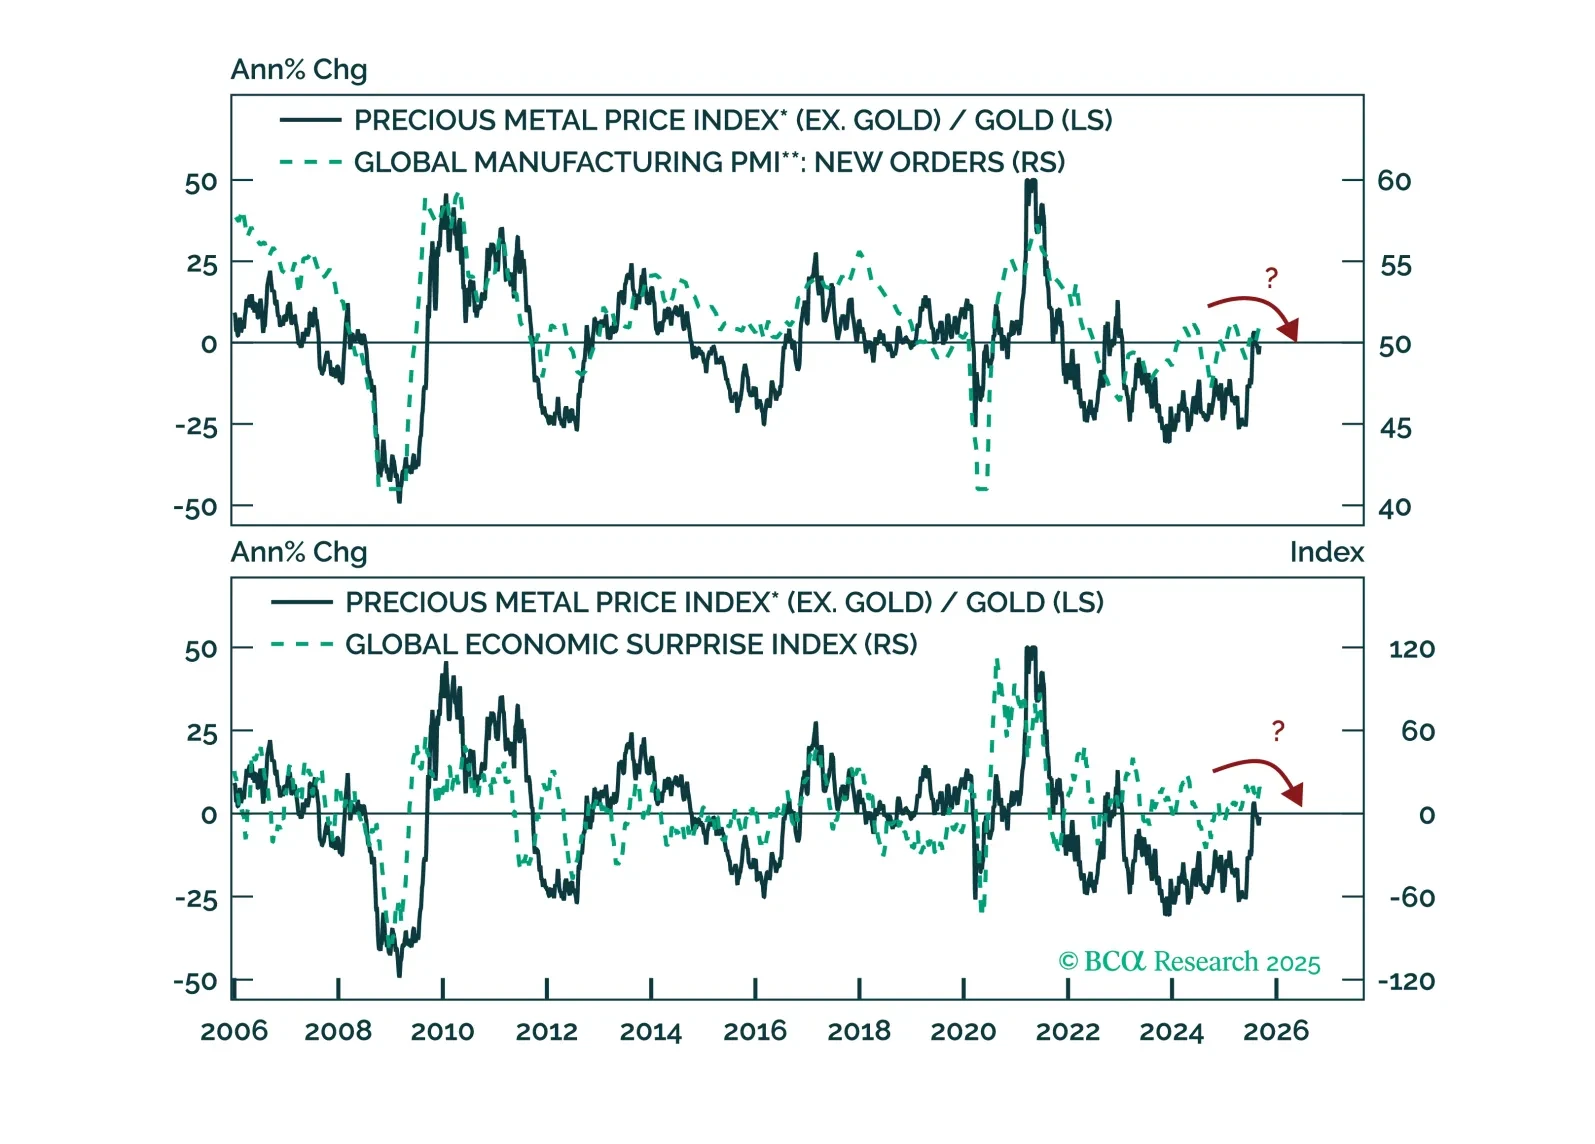
銀、プラチナ、パラジウムは、今後数ヶ月にわたり金と同様の循環的な追い風を受ける可能性があります。しかし、4つの重要なリスクがイエローメタルに対するそれらの相対的なパフォーマンスを脅かしています。
ドルは下落していますが、資本が米国から流出しているためです。投資家が答えるべき重要な質問は、ドルに残された下落の余地がどれほどあるのか、そして減価が今後数ヶ月間にわたり直線的に続くのか、それとも一時停止し(さらには逆行して反発を示すのか)です。戦術的には、私たちはドルを買います。これは、私たちのテクニカル指標がドルが非常に売られ過ぎており、逆行的な反発が予測されることを示しているためです。トレードアイデア#1: DXYを購入グリーンバックは2008年、金融危機の最深部で底を打ち、それ以来上昇トレンドにあります。DXYでは、そのトレンドは金融危機以降の一貫した高値と低値の更新によって定義されています(チャート1)。そのブルマーケットは現在、脅威にさらされています。年初来、DXYは約10.4%下落しました。米ドルが非常に長いサイクルで動く歴史を考慮すると、多くの投資家が今日直面する問題はこうです:さらなる弱さが続くのか、それとも逆張りする時期なのか?純粋にテクニカルな視点から、独立記念日にDXYを買う理由は3つあります。DXYは重要なサポートレベルに近づいています。このサポートレベルは、2008年の安値から引かれた上向きのトレンドラインによって定義されており、現在約96でサポートを示しています。このレベルでは、短期ショートポジションを解消する動きの結果、少なくとも戦術的な反発が予期されます。当社の包括的なモメンタムおよびポジショニング指標によると、ドルはかなり売られすぎの状態となっています。過去の履歴では、これがドルの逆トレンドの反発につながることが多かったことが示されています(チャート2)。この指標は平均値から標準偏差1未満の位置にあります。過去にこれらのレベルに達した際には、急激な反転が頻繁に発生しました。高頻度モメンタムコンポーネントが平均値から標準偏差2未満にほぼ到達したことは注目に値します。5%~10%のDXYの上昇は、長期的な弱気市場の文脈内で一般的に見られます。特に、世界経済が景気後退に陥った場合にはその可能性が高まります。2000年から2008年までのドルの弱気市場では、多くの逆方向の上昇が見られ、特に2005年が注目されます。同様に、2008年以降の強気市場でも多くの調整が見られ、一部は10%もの大幅なものもありました。これらはすべて戦術的なトレーディングの機会でした。DXYは重要なサポートレベルに近づいています。これは2008年の安値から描かれた上向きのトレンドラインによって定義されており、現在では96付近でサポートされています。この水準では、売りポジションを解消する動きが見られるため、少なくとも戦術的反発を予想します。私たちの包括的なモメンタムおよびポジショニング指標によると、ドルは非常に売られすぎの状態です。歴史的に、この状況はグリーンバックの反転反発を引き起こす傾向がありました (チャート2)。この指標は平均値から標準偏差1つ分下に位置しています。過去にこれらの水準に達した際には、急激な反転がしばしば発生しました。高頻度モメンタムのコンポーネントが平均値からほぼ標準偏差2つ分下に達したことは注目に値します。DXYが5%から10%程度の反発を示すことは、長期的な弱気市場の文脈においてよく見られることです。特に世界経済が景気後退に入った場合、この傾向が顕著になるでしょう。2000年から2008年のドルの弱気市場では、2005年をはじめとして多くの逆トレンドの反発が見られました。同様に、2008年以降の強気市場でも10%程度の深い調整を含む反発が何度も見られました。これらはすべて戦術的な取引機会でした。重要なポイントは、ドルが体制の転換期を迎えている可能性があるということです。この体制転換はより国際収支に焦点を当てたものになり、ドルの準備通貨としての地位がドナルド・トランプ大統領の政策の中で注目されている状況下で進むでしょう。これはUSDにとって長期的に弱気材料となります。とはいえ、現時点ではドルの下落が、逆トレンドの動きを通常示唆するレベルに戦術的に近づいています。それはDXYが96の水準付近に達する頃となるでしょう。トレードアイデア #2: 石油生産者対消費者ドルは、すべてのその他のFX市場の動きを自然に牽引する主要な要素です。これは、私たちの予測通り戦術的にドルが反発する場合、他のG10および新興国通貨に圧力をかけることを意味します。良いニュースとして、ドルの全体的なトレンドと密接に相関していないクロスではいくつかの魅力的な取引が存在します。その中で最も明確なものは、石油消費国に対して石油生産国の通貨バスケットを購入することです。この取引が有益である可能性がある理由は以下の3つです:まず、ほとんどの石油生産国は経常収支の黒字を持つ傾向がある一方、エネルギー輸入国は赤字国である傾向があります。したがって、国際収支にますます注目が集まる世界では、石油生産国の通貨バスケットを保有するのが自然です (チャート3)。第二に、米国が世界最大の原油生産国であることから、ドルは事実上のペトロカレンシーとなっています。これは、原油価格の上昇がサウジアラビア、カナダ、ノルウェー、ナイジェリア、アンゴラ、さらにはイランにとって恩恵となるように、米国にとっても利益をもたらすことを意味します(チャート4)。したがって、原油価格の上昇を予想する場合、USDに対してペトロカレンシーを買い持ちするというトレーディング・ストラテジーはうまくいきません。第二に、米国が世界最大の原油生産国であることから、ドルは事実上のペトロカレンシーとなっています。これは、原油価格の上昇がサウジアラビア、カナダ、ノルウェー、ナイジェリア、アンゴラ、さらにはイランにとって恩恵となるように、米国にとっても利益をもたらすことを意味します(チャート4)。したがって、原油価格の上昇を予想する場合、USDに対してペトロカレンシーを買い持ちするというトレーディング・ストラテジーはうまくいきません。
チャート3
米ドルはペトロ通貨である
米ドルはペトロ通貨である
チャート4
選択された石油生産者のバスケットを購入
選択された石油生産者のバスケットを購入
チャート3
米ドルはペトロ通貨である
米ドルはペトロ通貨である
チャート4
選択された石油生産者のバスケットを購入
選択された石油生産者のバスケットを購入
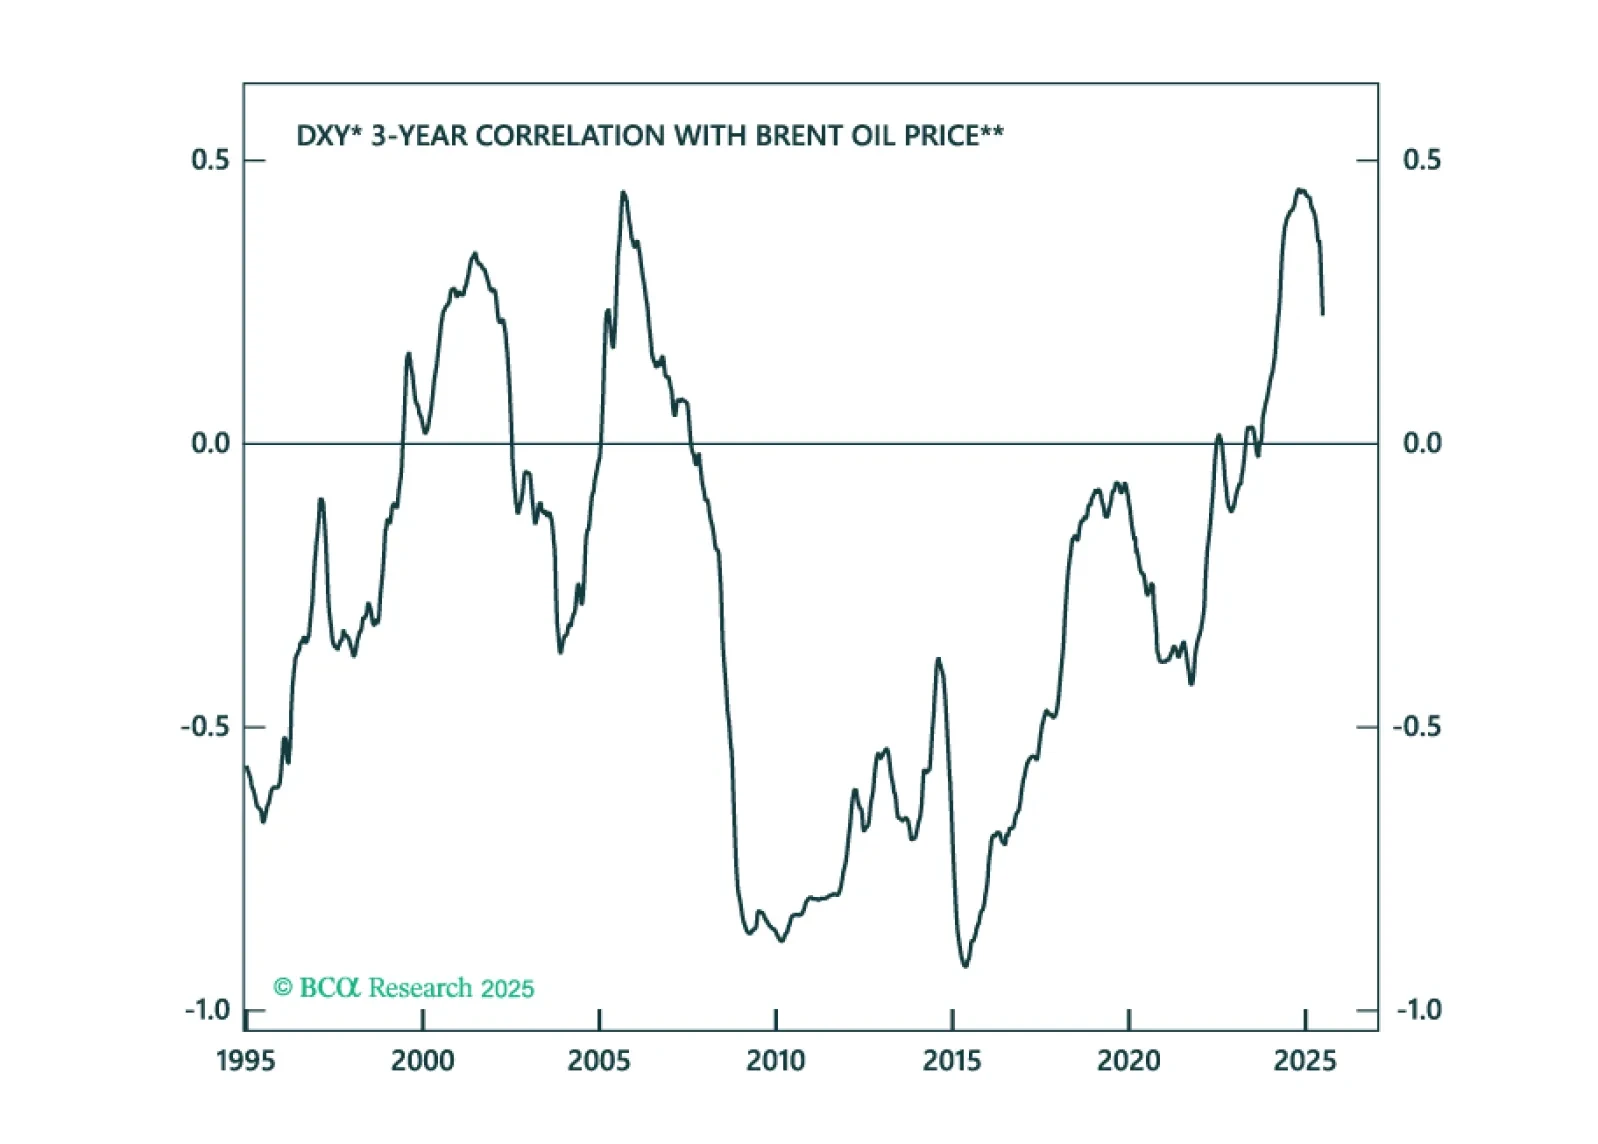
最後に、現在の原油価格である68ドルには、非常に少ない地政学的リスクのプレミアムが含まれています。この価格は、カンザス連邦準備銀行が米国生産者の限界生産コストとして推定しているものです。 最後に、現在の原油価格である68ドルには、非常に少ない地政学的リスクのプレミアムが含まれています。この価格は、カンザス連邦準備銀行が米国生産者の限界生産コストとして推定しているものです。 結論: ドルと原油価格の相関性は構造的にポジティブに転じています (チャート5)。原油に対する弱気な賭けは、この場合ドルが安くなることを意味します。とはいえ、市場を動かしているダイナミクスが国際収支である場合、経常収支が黒字である傾向がある原油生産国のバスケットを買い持ちし、原油消費国に対するポジションを取ることが有益です。このトレードはまた、原油価格の地政学的リスクプレミアム上昇から利益を得る可能性があります。
チャート5
原油価格の上昇はドルを押し上げる
原油価格の上昇はドルを押し上げる
チャート6
貴金属を買う
貴金属を買う
チャート5
原油価格の上昇はドルを押し上げる
原油価格の上昇はドルを押し上げる
チャート6
貴金属を買う
貴金属を買う
トレードアイディア3: 貴金属を買う世界的に取引のほぼ90%が未だに米ドルで行われています。脱ドル化について多くが語られる中、その割合は過去10年間で増加しています。今年明確だったのは、外国人がこのドル依存から多様化を図る意欲を示したことです。これは例えばロシアのような石油輸出国や、中国のような米国と地政学的に対立する国々にも当てはまります。発展途上国にとって、明確な選択肢は米ドルを金に置き換えることです。2010年には、金は中央銀行準備金の約10%を占めていました。本日は、米ドルとユーロを除いた中央銀行の最大保有資産となっています。ドルは長期的な周期で動く傾向があるため、それは貴金属にも同様に当てはまります。このドルからの脱却が続く中で、金は依然として恩恵を受けるでしょうが、より安価な貴金属がその勢いの中で注目を集めることになるでしょう。それはすでに銀やプラチナ価格で見られています。次の候補はパラジウムです(チャート6)。 チェスター・ントニフォー外国為替/グローバル・フィクスト・インカム・ストラテジストchestern@bcaresearch.comフォローはこちらLinkedIn & X

As we anticipated in an Insight we published in May, palladium continues to underperform platinum. Last week, platinum's discount to palladium shrunk to its smallest since August 2018. While the prices of both metals have fallen so far this year, palladium's…
Palladium is by far the worst performing precious metal so far this year. The 30% year-to-date price decline is significantly worse than platinum’s 10% loss and contrasts with higher gold (+8%) and silver (+4%) prices. Interestingly, palladium’s dismal…
Palladium did not participate in last year’s commodity rally. While industrial commodities such as copper and oil soared by double digits, palladium ended the year 22% lower. However, it is up 23% since the beginning of the year. At $2343/oz it has regained…

Highlights While difficult to forecast, the trajectory of global auto sales likely will follow that of GDP growth (Chart of the Week). As a result, palladium’s supply constraints will re-emerge, but its “epic rally” likely unfolds at a slower pace as global economic conditions normalize at an uneven rate.1 We expect the COVID-19 pandemic will be contained – likely via a vaccine later this year or early next year, if public-health officials are correct in their assessments, and populations become habituated to observing social-distancing and face-mask measures.2 There is evidence to suggest that in the post-pandemic world consumers will avoid public transportation in favor of their own vehicles. This would lift palladium demand at the margin – assuming environmental regulations are not relaxed dramatically. South Africa’s derelict power grid will continue to limit palladium supply growth, despite new investment in Russia. We expect palladium prices to remain close to current levels at ~ $2,300/oz to year-end. Chart of The WeekGlobal Auto Production Will Follow GDP’s Trajectory Feature COVID-19 clobbered palladium, just as it has commodities generally – taking prices from close to $2,900/oz in February to just under $1,600/oz in mid-March (Chart 2). Since then, prices rallied to more than $2,350/oz and are now languishing just above $2,200/oz. As dramatic as the metal’s price action has been, the pandemic's demand destruction only provided a respite from what remains a fraught supply backdrop. Chart 2Palladium’s Rollercoaster Ride Will Not Encourage New Output South African palladium output, which represents 36% of global supply, is once again threatened by rolling electricity blackouts, which have plagued the economy for years.3 Russia accounts for 42% of global palladium supply, and its top producer, Nornickel is maintaining production guidance of ~2.7mm ounces of palladium output this year. Even so, Nornickel expects global palladium output will total ~ 6.3mm ounces this year, down 1.3 mm ounces from 2019 levels (Chart 3).4 Inventories remain tight, and, with any recovery, can be expected to contract further (Chart 4). Chart 3Palladium's Physical Deficit Will Persist Chart 4Any Increase In Automobile Demand Will Further Strain Inventories This will continue a decade-long contraction in supply relative to demand, which spurred prices from $407.3/oz in 2010 to current levels but failed to energize supply growth or capex, which, from 2015 to 2019, grew by 7% and 15.2%, respectively. Auto Production Drives Palladium Demand Forecasting a recovery in palladium demand is extremely difficult, so much so even the most in-the-know market participants have suspended their usual balances assessments.5 All the same, there is a strong relationship between GDP and automobile production, as the Chart of the Week shows.6 This production drives the demand for palladium, as it is critical to the functioning of anti-pollution technology in gasoline-powered cars, which predominate in the global automobile market. Monthly car production in our sample peaked in November 2017 at 5.6mm units. In our modeling, we expected production will come in at ~ 4.3mm units in December of this year, and 4.6mm units in December 2021. This translates into a downturn of close to 6% in auto production this year versus 2019, and a recovery of ~ 9% for next year. If realized, this year’s downturn in auto production would only amount to a brief respite from the chronic supply-side weakness that has plagued the palladium market for a decade. In its May 2020 assessment, Johnson Matthey (JM) projects South African platinum-group metals (PGM) mining output will fall “at least 20%” this year. This suggests to us the physical deficits in palladium will widen and continue to do so over the medium term, which, all else equal – i.e., the global economic recovery we anticipate remains on track – will force prices higher if for no other reason than to attract capex to the PGM space. Upside Price Risk For Palladium Palladium prices will be prone to upside risk if the massive fiscal and monetary stimulus deployed globally is effective in reviving consumer demand for automobiles as household budgets are restored (Chart 5). Chart 5Rising Incomes Will Boost Auto Demand We find GDP (income) growth is an important explanatory variable for price, and would expect rising incomes in DM and EM markets would restore global employment growth and consumer confidence, leading to higher demand for new autos (Chart 6). In addition, anti-pollution regulations continue to be enforced, although states could relax these to help auto manufacturers reduce unsold inventories and to reduce the overall contribution palladium makes to a vehicle’s cost (Chart 7). Chart 6Fiscal And Monetary Stimulus Will Revive Consumer Demand These regulations pushed palladium loadings in internal-combustion engines globally up 14% last year, led by stout increases in Europe and China, according to JM. At 9.6mm ounces of the total gross demand for palladium, autocatalysts accounted for ~ 84% of global consumption last year (Chart 8). Chart 7Environmental Regulations Drive Palladium Demand Chart 8Autocatalysts Dominate Palladium Demand Bottom Line: The COVID-19 pandemic provided a respite for the palladium market’s relentless drive to take prices high enough to encourage new capex to bring no new supply. However, with the massive stimulus now deployed globally, we expect global GDP growth to revive in line with the World Bank’s estimates, which drive our modeling of GDP growth. This will cause demand for automobiles to revive next year, pushing demand for palladium higher as supplies are contracting – assuming, of course, governments do not relax environmental regulations pushing demand for the metal higher. Robert P. Ryan Chief Commodity & Energy Strategist rryan@bcaresearch.com Fernando Crupi Research Associate Commodity & Energy Strategy FernandoC@bcaresearch.com Commodities Round-Up Energy: Overweight Brent crude oil trade through $46/bbl, or ~ 3.7% in early trading Wednesday, on the back of sharp inventory drawdowns for the week ended reported by the US EIA Wednesday. We continue to forecast a physical deficit for the balance of the year and expect to see continued draws as a result. Our price forecast for the 2H20 remains at $44/bbl and $65/bbl next year for Brent, with WTI expected to trade ~ $3/bbl below that this year and next (Chart 9). Base Metals: Neutral Copper production in Peru, the second-largest producer in the world, fell 20.4% y/y in 1H20, according to mining.com. Production appears to have recovered by June, with output increasing almost 41% m/m to 180,792 MT. The government began relaxing its quarantine restrictions, imposed in March, in May. Precious Metals: Neutral We are moving our rolling stop on gold to $1,950/oz at tonight’s close, up from our previous stop of $1,850/oz. Gold was trading close to $2,050/oz early Wednesday. We also are moving our silver stop-loss to $26/oz at tonight’s close, up from $23.50/oz, and making this a strategic position. We remain bullish these precious metals, expecting central banks globally, led by the Fed, to continue to flood markets with liquidity, particularly USD liquidity. This will keep real rates low, and will, in our view, continue to support a weakening of the USD, both of which are bullish for gold and silver (Chart 10). The Fed has made it clear they are not considering any rate increases in the foreseeable future, which will lead markets to expect continued weakness in real rates. Ags/Softs: Underweight The USDA reported 72% of the US corn crop was in good-to-excellent condition for the week ended August 2, compared to 57% for the same period last year in the 18 states accounting for 91% of the crop. 73% of the soybean crop was in good-to-excellent condition vs. 54% last year at this time. Chart 9 Chart 10 Footnotes 1 Please see Epic Palladium Rally Likely Continues, which we published February 27, 2020. 2 Please see Anthony Fauci Explains Why the US Still Hasn’t Beaten Covid published by wired.com July 29, 2020. 3 Eskom, the South African electricity monopoly supplying ~ 90% of the country’s power, resumed rolling blackouts last month as COVID-19-induced lockdowns were relaxed. The lockdowns provided a brief respite to the overloaded grid. Please see Eskom: SA on the brink of load shedding again, as six units ‘trip-out’ published by thesouthafrican.com news service July 27, 2020. We discuss this in our earlier publication cited in fn 1. 4 Please see Pandemic helps Russia tighten its grip on a key strategic metal published by miningweekly.com July 2, 2020. 5 See, e.g., Johnson Matthey’s Pgm Market Report: May 2020 published May 18, 2020, which notes, “At the time of writing, it was not possible to quantify these changes to supply and demand and we have elected not to publish forecasts for 2020. Our autocatalyst pgm demand models incorporate external industry estimates of vehicle production; at the time of preparing our report, these industry forecasts for 2020 were undergoing regular downgrades as the pandemic progressed across Asia and then to Europe and North America. It is also unclear to what extent primary and secondary supplies will be disrupted.” 6 Automobile demand also could get a boost at the margin from more people choosing to use their own cars and light vehicles instead of public transportation in the post-COVID-19 world. The IBM Institute for Business Value surveyed 25k US consumers in April, and found COVID-19 prompted almost 20% of their sample to say they intended to use their personal vehicles more frequently. Please see https://newsroom.ibm.com/2020-05-01-IBM-Study-COVID-19-Is-Significantly-Altering-U-S-Consumer-Behavior-and-Plans-Post-Crisis. Investment Views and Themes Recommendations Strategic Recommendations Tactical Trades Trade Recommendation Performance In 2020 Q2 Commodity Prices and Plays Reference Table Trades Closed In Summary of Trades Closed In
Yesterday, BCA Research's Commodity & Energy Strategy service wrote that it expects palladium prices will move higher on the expanding deficit, and backwardation in the forward curve will persist in incentivizing the release of inventories to…
Highlights Supply constraints and unstoppable demand growth – the result of stricter regulations requiring higher loadings in autocatalysts to treat toxic pollution in automobile-engine emissions – will continue to push palladium’s price higher, despite a near-vertical move higher that began in 2H19. South Africa’s power grid is in a state of near-collapse, which will add volatility to mining operations focused on platinum-group metals – chiefly palladium, platinum and rhodium. South Africa accounts for 36% of global palladium production and 73% of platinum production, which makes it difficult to make the case that platinum could be substituted for palladium as its price rises. Palladium stocks are at risk of being further depleted globally as demand from automobile manufacturers in China, the US and Europe remains robust. This will keep palladium forward curves backwardated for the foreseeable future. While pressure to find alternatives for palladium will grow as prices rise, in absolute terms the additional cost resulting from higher prices for the metal – ~ $400 per vehicle – is not yet enough to draw significant investment to this effort. Feature Palladium markets are fundamentally tight and unresponsive to macroeconomic uncertainty. Table 1Top 5 Best Performing Commodities In 2019, for the third year in a row, palladium prices outperformed other major commodities, returning an impressive 54% over the year (Table 1). This is the result of a massive 13% increase in demand for the metal – powered by strong autocatalyst demand for gasoline-powered cars in China and Europe, even as collapsing auto production globally and elevated trade uncertainty continue to dog automobile sales (Chart 1). This apparent contradiction is explained by stricter vehicle emissions regulations in major consuming markets – chiefly the Euro 6d, China 6 and US Tier 3 regimes – and power shortages in South Africa, which are introducing considerable volatility on the supply side in the second-largest producing country for the metal. Chart of the WeekSurging Autocatalyst Palladium Demand Again this year, palladium markets are fundamentally tight and unresponsive to macroeconomic uncertainty. Palladium prices soared 39% YTD, its fastest 40-day increase since 2010. Unlike other commodity markets, palladium is completely disregarding the COVID-19 outbreak that originated in China late last year. Favorable supply-side fundamentals continue to drive the palladium rally: The metal’s decade-long physical supply deficit intensified in 2019 and we expect it to widen this year (Chart 2, panel 1). On the demand side, Chinese consumption is at risk. China is the world’s largest auto manufacturing market. Hubei Province – COVID-19’s epicenter – is a large car manufacturing hub, accounting for ~ 10% of the country’s annual automobile output. In the wake of COVID-19, the country’s car production is expected to fall 10% in 1Q20. In addition, the virus had infected more than 80,000 people globally, and has spread rapidly outside Hubei into Asia, Europe, the Middle East, Africa, and North America, raising the odds of a pandemic. Interestingly, speculative positioning and ETF investment demand is subdued, and is not inflating prices (Chart 2, panel 2). Chart 2Palladium Deficit To Widen This Year Palladium Demand Soars As Auto Production Collapses Strong global automobile catalyst demand drove the rally in palladium prices last year. This occurred as car production fell by 9%, 8%, and 15% in US, China, and India – an unusual divergence in fundamentals. The culprit: Technical changes to autocatalysts from stricter emissions regulations. In China, the latest phase of car emissions regulations – China 6 – was gradually introduced in high-population centers, which also suffer from high levels of pollution. These centers accounted for ~ 60% of annual Chinese car sales in 2019. China 6 represents a major shift in emissions regulations and will make the Chinese auto fleet compliant with Europe’s best practices. As a result, palladium loadings in conforming light-duty gasoline vehicles reportedly increased by ~20% in 2019. This pushed China’s autocatalyst consumption up by 570k oz despite the drop in annual car sales, which created the rare dislocation between the country’s car production and palladium prices (Chart 3). We expect this trend to continue this year: China 6 is on track to be enforced countrywide – i.e., the remaining 40% of car sales – by mid-year, providing an additional ~ 10% boost in loadings of the metal. Chart 3Stricter Regulations Support Prices Amid Falling Car Production In Europe, the introduction of Euro 6c legislation in September 2018 and the extension to all new vehicles of Euro 6d-TEMP regulations in September 2019 – mainly the real driving emissions (RDE) testing procedure adopted in the wake of the Volkswagen “dieselgate” scandal in 2015 – pushed palladium loading in autocatalysts up by ~ 25% from 2017 to 2019.1 The regulations became stricter in January 2020, putting additional stress on manufacturers to comply with the new standards, which will continue to support higher palladium loadings. We expect the COVID-19 outbreak to delay the recovery in global gasoline-powered vehicle production and consumption to 2H20. Lastly, in the US – which remains an important market for autocatalyst palladium demand (Chart 4) – the ongoing implementation of the Tier 3 legislation will continue to gradually increase palladium content in autocatalysts until 2025. For 2020, we do not expect this to significantly boost loadings per vehicle and are factoring in 2% growth. These legislative changes in major automotive markets produced a structural break in our palladium demand model (Chart 5). After adjusting our estimates for greater palladium content in gasoline aftertreatment systems, our model suggests that demand provides strong support to palladium prices, but also suggests other factors – i.e. supply and inventory – are at play. Chart 4North America's Auto Sector Remains A Large Share Of Palladium Demand Chart 5Higher Palladium Loadings Largely Explains Last Year's Price Surge In the US and Europe, consumers can absorb higher vehicle sales despite being close to saturated in terms of vehicle ownership. We expect the COVID-19 outbreak to delay the recovery in global gasoline-powered vehicle production and consumption to 2H20. In China, we expect the government will overstimulate its economy to meet its long-term goal of doubling its GDP and per capita income by 2020.2 Automobile ownership and vehicle sales there are low vs. DM economies, suggesting more upside for sales in China (Chart 6). In the US and Europe, consumers can absorb higher vehicle sales despite being close to saturated in terms of vehicle ownership. Car sales move in cycles around long-term demographic trends: The longer the current economic expansion, the further above-trend car sales can rise (Chart 7). Chart 6China: Structural Outlook For Autos Is Bright China Car Consumption Will Rebound In 2H20... Chart 7... Likewise For Europe And US Bottom Line: The combination of stricter environmental regulations in key gasoline-powered automobile markets and the post-coronavirus rebound in global auto consumption will push the palladium market further in deficit this year as it faces an inelastic supply, critically low inventories and low substitutability over the short-term (more on this below). Palladium Supply In 2020: Weak growth And Low Price-Elasticity Palladium supply is highly constrained. The largest supplies are concentrated in Russia (42%), South Africa (36%) and North America (14%). From 2015 to 2019, supply and capex grew by a very subdued 7% and 15.2% respectively, completely disregarding the 200% rise in prices (Chart 8, panel 1). This illustrates palladium supply’s extremely low price-elasticity.3 Palladium supply growth will remain muted for the foreseeable future, as Eskom begins long-delayed maintenance to refurbish its derelict generation fleet. Primary supplies declined by close to 2% last year on falling shipments from Russia and record electricity load-shedding – i.e. blackouts – in South Africa (Chart 8, panel 2).4 As tight as palladium markets are fundamentally, South Africa’s crippled power grid – long in need of upgrading and repair – has been, and remains, a key driver of short-term platinum-group metals (PGM) prices.5 Following the breakdown of close to 25% of the country’s generating capacity, Eskom – the nation’s utility monopoly responsible for ~ 90% of its electricity generation – has been forced to implement rolling blackouts to balance power supply and demand and prevent permanent damage to the country’s power grid. Palladium supply growth will remain muted for the foreseeable future, as Eskom begins long-delayed maintenance to refurbish its derelict generation fleet. Consequently, Stage 6 load-shedding events likely will become more frequent. These efforts are complicated by massive debt – ~ $30 billion – which has required government bailouts and forced the company to take loans from a Chinese industrial bank. Chart 8Top Palladium Producers' Capex Price-Elasticity Is Low This is playing havoc with PGM supplies. During the unmatched Stage 6 load-shedding in December 2019 – cutting power to 37% of grid users – PGM supplies were reduced by 50%. Stockpiles covered the loss, but persistent blackouts lasting years could push markets into an actual shortage of palladium as inventories would rapidly be depleted. This is a significant risk: Eskom itself warned rolling blackouts will persist for the next 18 months.6 Elevated local currency PGM prices are postponing announced shafts closures, as miners seek to profit from the favorable pricing environment (Chart 9). But insufficient electricity capacity will weigh on mine supply growth over the next few years as companies hold-back on much-needed long-term investments. The final units of Eskom’s Medupi and Kusile projects are expected to be completed over the next two years – adding 4800MW to its installed capacity. This can partially alleviate South Africa’s electricity difficulties, but these units are not enough to support a rebound in economic and mine production growth. South Africa is in profound need of large-scale investments in its power sector. Close to 5000MW of power capacity is scheduled to shut down over the next five years (Chart 10). Chart 9Favorable Domestic Metal Prices For South African Miners Chart 10South Africa Needs Additional Power Generation Capacity After years of pressure from mining companies, South Africa’s minister of Mineral Resources and Energy announced it would allow companies to generate unlimited electricity for their own activities. The current political and economic climate is not constructive for meeting this challenge. The World Bank recently slashed South Africa’s 2020 GDP growth forecast to 0.9% from 1.5% previously on the back of electricity and infrastructure constraints impeding domestic growth and weak external demand. Likewise, rating agency Moody's signaled – ahead of its review of South Africa’s Baa3 credit rating in March – it could downgrade the country to speculative grade, citing the detrimental impact of recurring power outages on manufacturing and mining output. After years of pressure from mining companies, South Africa’s minister of Mineral Resources and Energy announced it would allow companies to generate unlimited electricity for their own activities. This will provide much-needed help to the country’s power sector. According to the Minerals Council South Africa, mining companies could bring an additional ~ 1500MW capacity online in the next 9 to 36 months. But doubts remain with regard to the timeline for companies to obtain the necessary licenses and if these can easily be acquired. Johnson Matthey expects supply growth in Russia – the largest producer – will be capped this year as Nornickel’s processing of old mines' copper concentrate – which boosted the company’s palladium supply over the past few years – is finalized. Still, a paltry 1% gain is possible from expected efficiency gains at existing mines, according to Nornickel. The company also announced it will increase production at its Talnakh and South Cluster mines, but this additional supply will only reach markets gradually as processing capacity constraints won’t be resolved until 2023, according to Johnson Matthey. Bottom Line: Growth prospects in the top two palladium-producing countries are weak in 2020. This will not suffice to meet the soaring autocatalyst demand. Higher recycling and inventory releases – both incentivized by higher prices – will be needed to balance the market. Palladium Stockpiles Are Dangerously Low We expect palladium prices will move higher on the expanding deficit, and backwardation in the forward curve will persist to incentivize the release of inventories to market (Chart 11). Yet, global palladium stockpiles have been declining since 2014 and are now at critically low levels, raising the risk of a disrupting shortage of the metal:7 ETF and exchange inventories now stand at a paltry 600k oz (Chart 12). These are the most price-elastic stocks and will get close to zero as prices increase. Chart 10Expect Backwardation To Persist Chart 12Price-Sensitive Stockpiles Are Dangerously Low Exhaustion of inventory would spike prices until demand destruction or additional supply – both inelastic in the short-run – are able to balance the market. The Russian Ministry of Finance’s reserves – a state secret – are now almost exhausted, according to Russia’s Norilsk Nickel, the largest supplier of physical palladium in the world. Last year, Norilsk Nickel held an estimated 1mm oz of the metal in its Global Palladium Fund, and signaled it is increasingly using its reserves to balance markets and provide needed liquidity. Earlier this year, the company released 3 MT of palladium to the market from stocks. Complete exhaustion of inventory would spike prices until demand destruction or additional supply – both inelastic in the short-run – are able to balance the market. Don’t Count On Substitution, Yet Switching to platinum requires significant capital- and resource-intensive R&D and appears to be beyond the current capabilities of automakers. We expect platinum prices to rise in 2020 supported by improving fundamentals, growing safe-haven demand, and markets pricing in increasing anticipation of substitution from palladium to platinum. Unlike palladium, platinum is also affected by safe-haven demand and gets bid up with gold and silver prices in periods of high uncertainty (Chart 13). With gold prices now above $1,600/oz, platinum will benefit from safe-haven flows due to its relative price advantage (Chart 14). Chart 13Safe-Haven Flows Support Platinum Prices Chart 14Platinum Is Cheap Relative To Gold We believe substitution will commence over the coming years, but this is a gradual process. Substitution from expensive palladium to low-priced platinum in industrial applications is the largest risk to our positive view on the palladium-to-platinum (Pd-to-Pt) ratio (Chart 15). This started in smaller and more price-elastic segments (e.g. dental, jewelry and diesel autocatalyst). However, to have a real impact on overall demand and thus the price ratio, substitution needs to take place in gasoline autocatalyst technology. The discount has been at a level consistent with substitution for more than a year, but the urgency to upgrade current designs to meet new environmental legislation and RDE regulations in China, Europe, and the US is the main focus of automakers this year. Switching to platinum requires significant capital- and resource-intensive R&D and appears to be beyond the current capabilities of automakers scrambling to meet the latest anti-pollution regulations globally. Moreover, large-scale substitution will take place only if automakers’ cost-benefit analysis points to significant long-term profits from switching. That said, platinum’s supply security remains a risk in the long-term: South Africa accounts for 73% of global production and our analysis suggests output growth there likely will remain weak over the next few years, especially as Eskom rebuilds its failing power grid. This lack of diversity increases sourcing risks for automakers, who, not without reason, would not want to switch over to platinum only to find that supply is also in doubt down the road. The overall platinum market is 26% smaller than that of palladium. Assuming a one-for-one substitution of Pd to Pt in gasoline catalyzers, a 1.2mm oz reduction in Pd demand – the amount required to reduce palladium’s deficit to zero – would send platinum markets to a 1.4mm oz deficit.8 Without substantial production growth, platinum prices would spike, reducing the profitability of investing in these new catalysts. Thus, substitution will eventually impact the price ratio, but will not be large enough to overturn absolute price level trends. In addition, the amount of PGMs in the typical autocatalyst – ~ 5 grams – adds $400 to the cost of the average automobile (Chart 15, lower panel). We do not believe this cost drives automakers' decisions, which is another reason the substitution of Pt for Pd likely will remain a topic of discussion more than action. Chart 15Palladium's Price Surge Adds ~0 Per Gasoline Car Bottom Line: We believe substitution will commence over the coming years, but this is a gradual process and it will not happen on a meaningful scale this year. Thus, we expect the continuation of relative demand and inventory trends will provide a favorable setting for the Pd-to-Pt ratio this year (Chart 16). Chart 16Pd-to-Pt Price Ratio Will Increase Again in 2020 Hugo Bélanger Associate Editor Commodity & Energy Strategy HugoB@bcaresearch.com Robert P. Ryan Chief Commodity & Energy Strategist rryan@bcaresearch.com Commodities Round-Up Energy: Overweight Brent and WTI crude oil lost 5% and 4% this week, as fears of a global pandemic in the wake of the COVID-19 outbreak gripped markets. Reports of outbreaks in Asia ex-China, the Middle East and Europe fueled these concerns. Against this backdrop, OPEC 2.0 will be meeting in Vienna March 5 and 6 to consider cuts of 600k b/d recommended by its technical committee earlier this month. We continue to expect the full coalition to approve these cuts at the upcoming meetings. Saudi Arabia, Kuwait and the United Arab Emirates reportedly are considering an additional 300k b/d of cuts to offset the global demand hit delivered by COVID-19. The IEA estimates the COVID-19 outbreak will reduce Chinese refining throughput by 1.1mm b/d, and will reduce the call on OPEC crude by 1.7mm b/d in 1Q20. Base Metals: Neutral Iron ore prices weakened, following global equities lower, as the COVID-19 outbreak spread around the world. However, traders continue to report lower stocks of iron ore, which should keep prices supported, according to MB Fastmarkets (Chart 17). We remain long December 2020 high-grade iron ore (65% Fe) vs. short the benchmark 62% Fe contract on the Singapore Commodity Exchange, which we initiated November 7, 2019. This recommendation was up 5.3% as of Tuesday’s close, when we mark to market. Precious Metals: Neutral After retreating slightly from its run toward $1,700/oz earlier this week, gold remains well supported by safe-haven demand (Chart 18). In addition, actual and expected policy stimulus – e.g., Hong Kong's “helicopter money” drop of USD 1,200 to all permanent residents over the age of 18 – and expectations of additional central bank easing globally to offset the global spread of COVID0-19 will keep gold and precious metals generally supported. Markets should start pricing in higher inflation expectations as additional stimulus starts to roll in. Ags/Softs: Underweight Global grain markets could be set to rally sharply, as unusually wet weather in the Middle East and East Africa spawned by higher-than-usual cyclone activity produces perfect breeding conditions for desert locusts in the region over the next two months. According to National Geographic, by June the locusts could increase their populations “400-fold compared with today, triggering widespread devastation to crops and pastures in a region that’s already extremely vulnerable to famine.” This could put more than 13mm people in East Africa at risk of “severe acute food insecurity,” and imperil millions more. Chart 17China's Iron Ore Stocks Tight Chart 18Safe Havens Gold, USD Well Bid Footnotes 1 Please see New legislation planned in response to dieselgate, published by Autocar June 9, 2016. See also Johnson Matthey’s February 2020 Pgm Market Report. 2 Our view of strong Chinese fiscal and monetary stimulus was discussed in detail in our February 13, 2020 weekly report titled Iron Ore, Steel Poised For Rally. 3 Historically produced as an inferior byproduct from nickel, gold, and platinum mines, the price incentive from palladium alone isn’t enough to generate the needed investments in new mine production. According to Nornickel, this is slowly changing, palladium is an increasingly large part of mining companies’ revenues, making the metal a valuable co-product. This could improve mines investments’ responsiveness to movement in palladium prices over the medium term. 4 According to Eskom, “Load shedding is aimed at removing load from the power system when there is an imbalance between the electricity available and the demand for electricity. If we did not shed load, then the whole national power system would switch off and no one would have electricity.” The company’s load-shedding program includes 8 stages, where each stage represents the removal of 1000MW of demand – e.g., stage 5 removes 5000MW. This is done by shutting down specific sections of the grid. 5 The PGMs are ruthenium, rhodium, palladium, osmium, iridium, and platinum. 6 Things got worse after the December load-shedding event. Less than a month later, Reuters noted more than two times the power shed in December went “offline because of plant breakdowns. 7 This can be seen in the close to 12mm oz. decline in UK and Switzerland – home of the largest secured vaults of Palladium and Platinum – net imports. 8 Technological improvement in palladium catalysts has made the metal more efficient in for gasoline-powered engines vs. platinum. It has superior properties in terms of thermal durability and NOx reduction. Thus, the conversion could be greater than 1-to-1 and would imply a smaller share of palladium autocatalyst substitution could be absorbed by existing platinum supplies. Investment Views and Themes Recommendations Strategic Recommendations Tactical Trades TRADE RECOMMENDATION PERFORMANCE IN 2019 Q4 Commodity Prices and Plays Reference Table Trades Closed in 2020 Summary of Closed Trades
Palladium prices bottomed at $167/oz in the aftermath of the financial crisis and have since skyrocketed to $2458/oz, making it the most expensive precious metal in the PGM space. In annual terms, this constitutes a total return of 28% per year, easily…