Highlights
- Dovish Central Banks & Duration: Bond markets have shifted rapidly in recent weeks, pricing out any and all rate hikes expected over the next year in the major developed economies. With global growth likely to rebound in the latter half of the year, bond yields are now exposed to a hawkish repricing and recovery in inflation expectations, especially in the U.S. Stay below benchmark on overall portfolio duration on a medium-term basis.
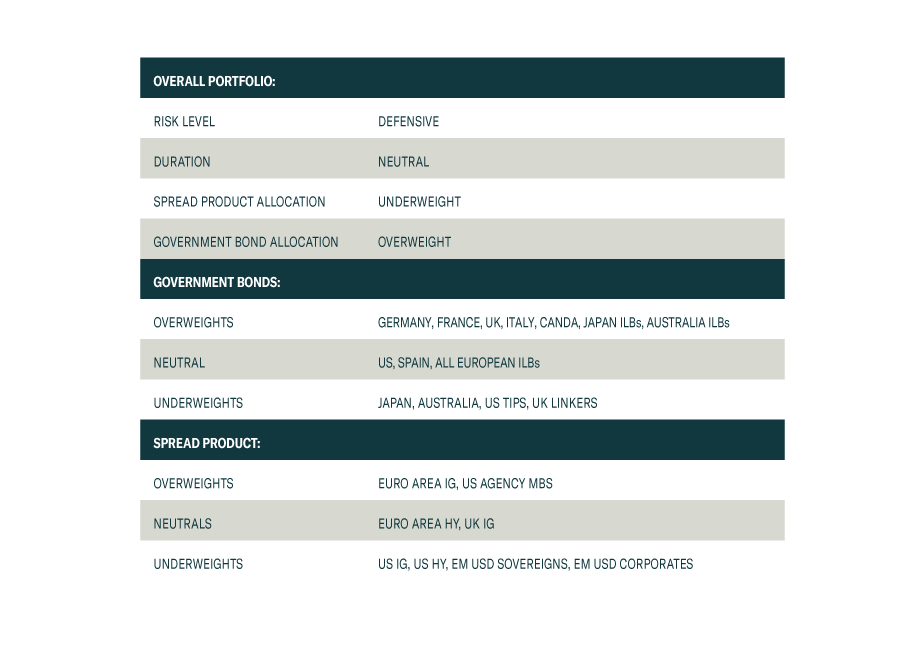
- Model Bond Country Allocations: We are sticking with our current country tilts in our model bond portfolio, as the recent shift in central banker biases has done little to change the relative fundamental drivers between countries. Stay underweight the U.S., Canada & Italy, and overweight core Europe, Japan, the U.K., Spain & Australia, in currency-hedged global government bond portfolios.
Feature
Well, That Escalated Quickly
With global growth remaining soggy, an increasing number of major central banks have been forced to rapidly shift in a more dovish direction. This past week alone, the European Central Bank (ECB), the Bank of Canada (BoC) and the Reserve Bank of Australia (RBA) all signaled that interest rates would be on hold for some time. The ECB went the extra step of announcing a new bank funding program (TLTRO-3), as we predicted last week, to prevent a deeper euro area growth downturn at a time of, as ECB President Mario Draghi described it, “pervasive uncertainty”. Government bond yields declined sharply in all three regions, as markets digested the dovish message from more cautious policymakers.
Our Central Bank Monitors for the major developed economies are all decelerating, in line with the soft patch of global growth. Yet only the RBA Monitor has fallen to a level clearly signaling a need for easier monetary policy in Australia. For the other major countries, the Monitors are indicating that an unchanged monetary policy stance is appropriate, and all for the same reason – the loss of economic momentum has not been enough to loosen tight labor markets and drive core inflation rates lower.
Government bond yields have already responded to a loss of global growth momentum by pricing out any rate hikes that were expected over the next year, most notably in the U.S. and Canada. Inflation expectations have also adjusted downwards in response to both diminished growth expectations and last year’s sharp plunge in global energy prices.
We expect global growth to rebound in the latter half of 2019, alongside higher oil prices, leaving bond yields exposed to upside data surprises and a repricing of expectations for inflation and rate hikes (Chart of the Week). We continue to recommend a below-benchmark overall portfolio duration stance on a 6-12 month horizon, as government bond yields are likely to rise above the very flat forwards in most markets.
Chart 1
A Bottoming Out Process For Bond Yields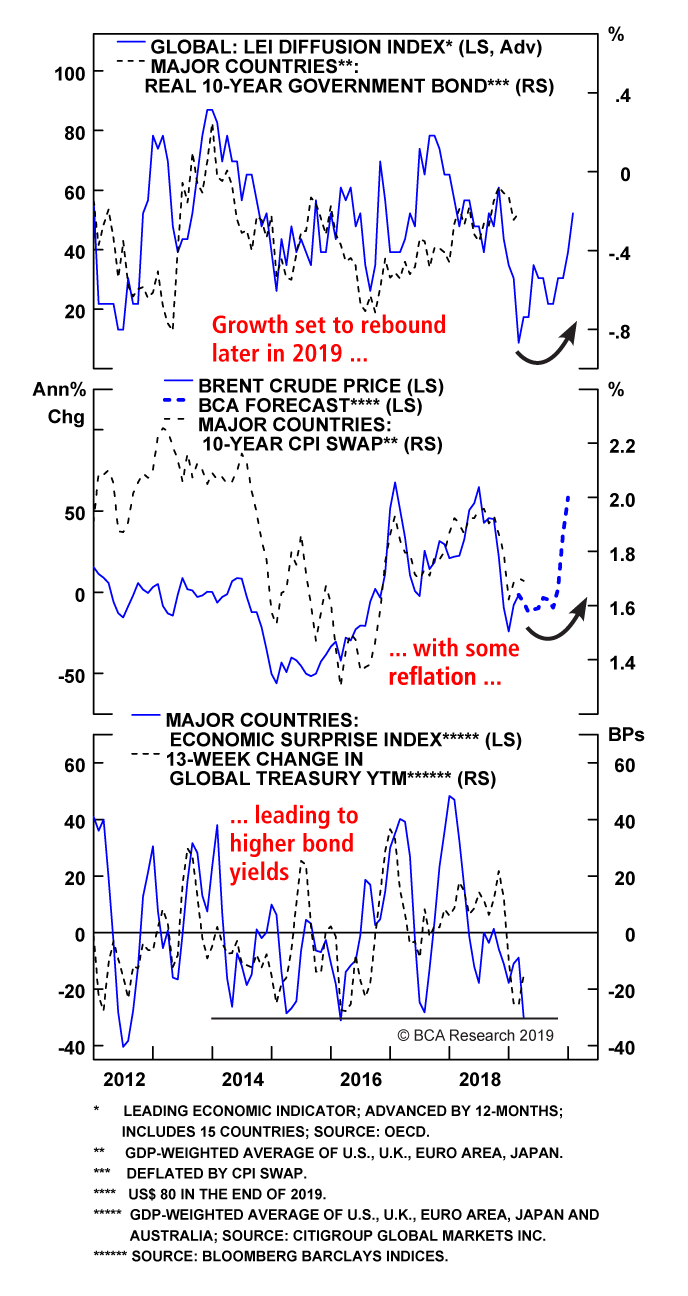
 Fullscreen Fullscreen |  Interactive Chart Interactive Chart |
While maintaining a below-benchmark duration stance, the synchronized shift in central bank forward guidance justifies a review of the recommended country allocations in our model fixed income portfolio.
Taking Stock Of Our Country Tilts In Our Model Bond Portfolio
Global government bond yields peaked back in early November and have fallen in all of the major developed economies (Chart 2). Decomposing the move in benchmark 10-year yields into inflation expectations (using CPI swap rates) and real yields (the difference between nominal yields and CPI swap rates) shows that the bulk of that decline has come from lower real rates in the countries with positive policy rates (U.S., Canada, U.K. and Australia). For countries with zero or negative policy rates (core Europe, Japan), most of the yield decline has been due to falling inflation expectations. Yet the drivers of the decline in yields have changed from the latter two months of 2018 to the first few months of 2019. Generally speaking, the late-2018 bond market rally reflected falling inflation expectations, while recent changes have been a function of moves in real yields. Only in Australia have real yields and inflation expectations both declined steadily since the early November peak in global bond yields.
Chart 2
Decomposing 10-Year Government Bond Yield Changes Since The November 2018 Peak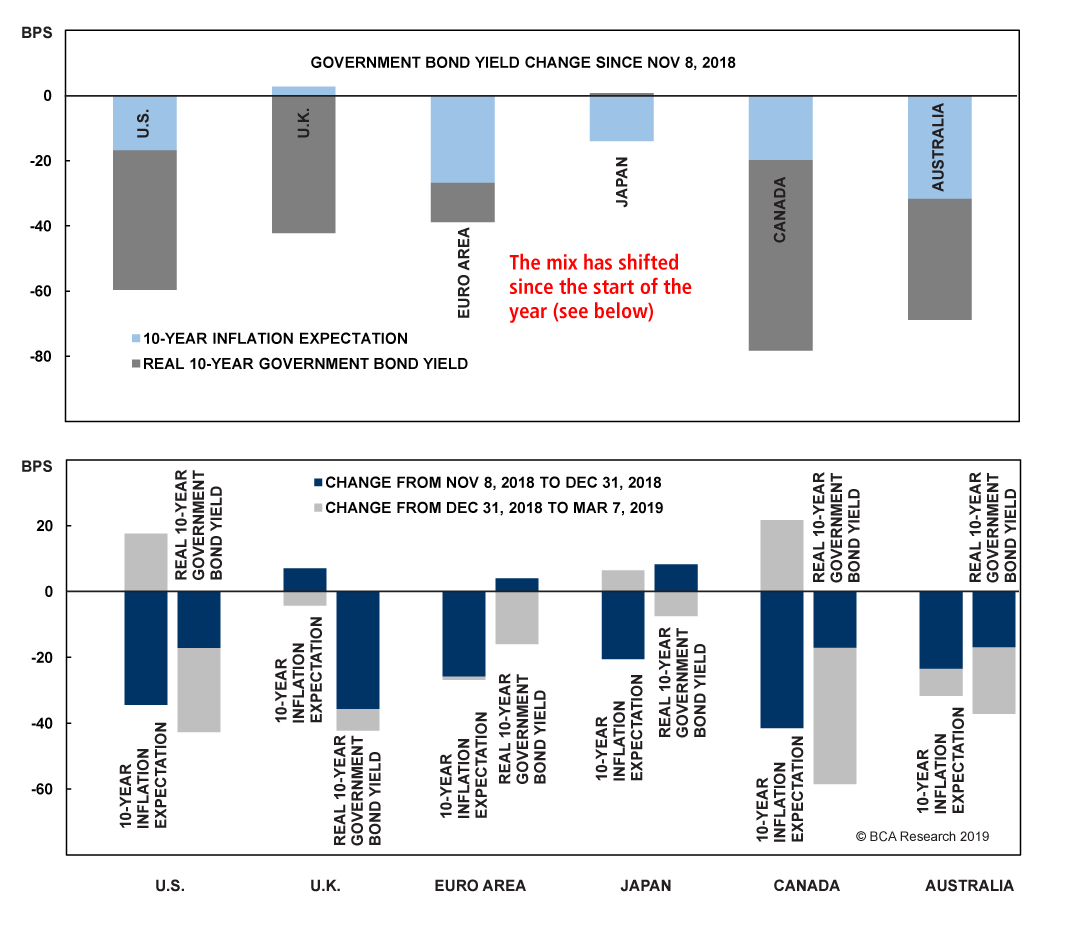
 Fullscreen Fullscreen |
The greater influence of the real component of yields makes sense, as markets now discount fewer rate hikes and more accommodative monetary policy.
Currently, our recommended country allocation in the Governments portion of our model bond portfolio includes underweights in the U.S., Canada and Italy and overweights in Australia, the U.K., Japan, Germany, France and Spain (the latter is a position versus Italy within an overall underweight stance on Peripheral European debt). In light of the more ubiquitously neutral/dovish global policy bias, we are reevaluating those country tilts per the following indicators:
1. Cyclical growth indicators: Both manufacturing purchasing managers indices (PMIs) and the leading economic indicators (LEIs) produced by the OECD are well off the cyclical peaks (Chart 3). In terms of levels, the PMIs are holding above the 50 threshold, suggesting expanding manufacturing activity, in the U.S., U.K., Canada and Australia, but are below 50 in the euro area and Japan.
Chart 3
Growth Has Lost Momentum Everywhere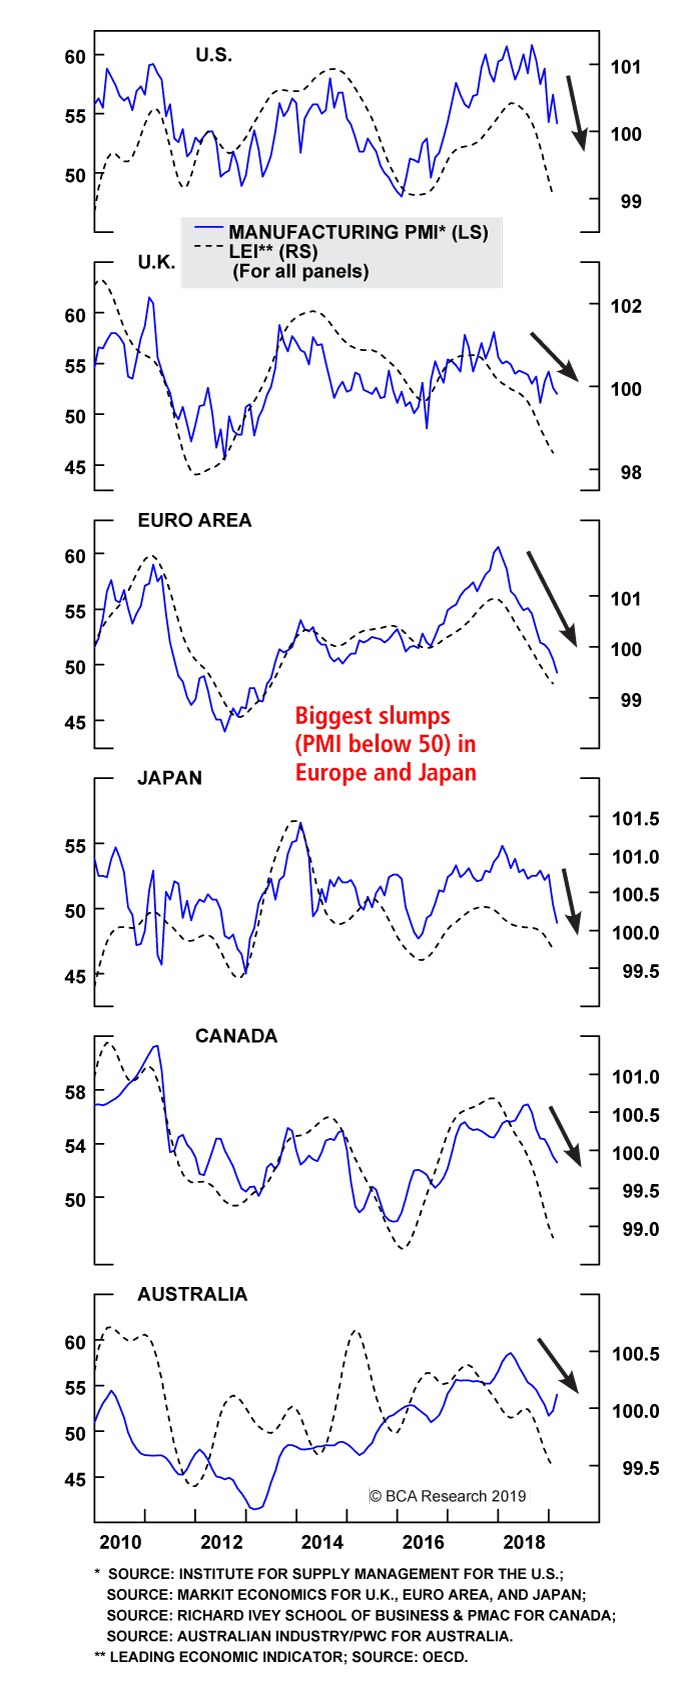
 Fullscreen Fullscreen |  Interactive Chart Interactive Chart |
2. Market-based inflation expectations: 10-year CPI swap rates have generally stabilized alongside energy prices, after the sharp drops seen in the latter months of 2018 (Chart 4). Australia is the lone exception where expectations continue to drift lower. The correlations between CPI swap rates and oil prices denominated in local currency are strongest in the U.S. and Canada and weakest in Australia. There is great diversity of the levels of CPI swap rates, however, from as low as 0.2% in Japan to as high as 3.5% in the U.K.
Chart 4
Inflation Expectations Are Stabilizing Outside Of Japan & Australia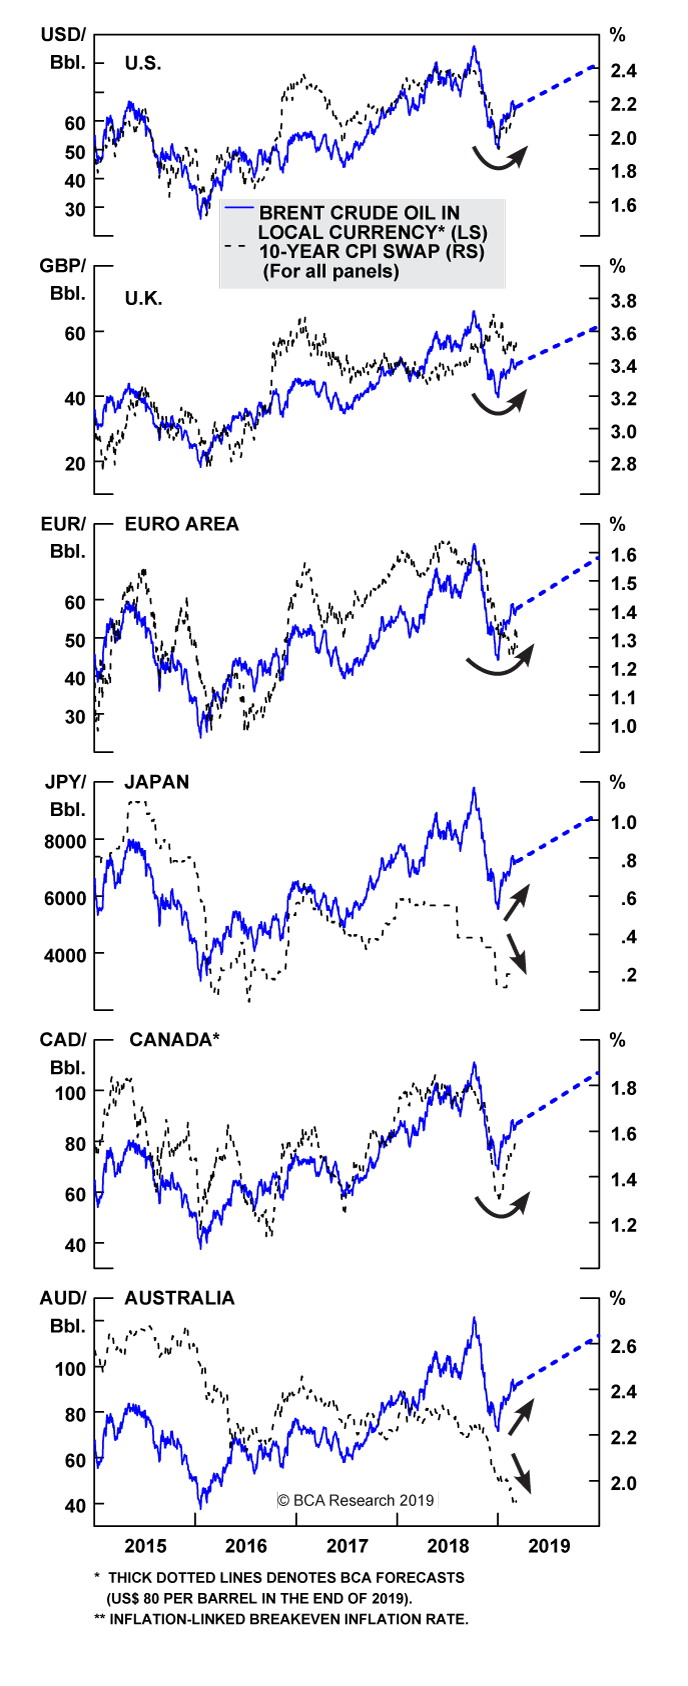
 Fullscreen Fullscreen |  Interactive Chart Interactive Chart |
3. Our Central Bank Monitors vs. our 12-month discounters: Except for Australia, our Monitors are all hovering very close to the zero line, indicating no pressure on policymakers to move policy rates (Chart 5). Our 12-month discounters, which measure the interest rate changes over the next year priced into Overnight Index Swap (OIS), are all close to zero, as well (again, with the exception of Australia, where a full 25bp rate cut is already priced).
Chart 5
Our Central Bank Monitors Are Calling For Stable Policy (ex Australia)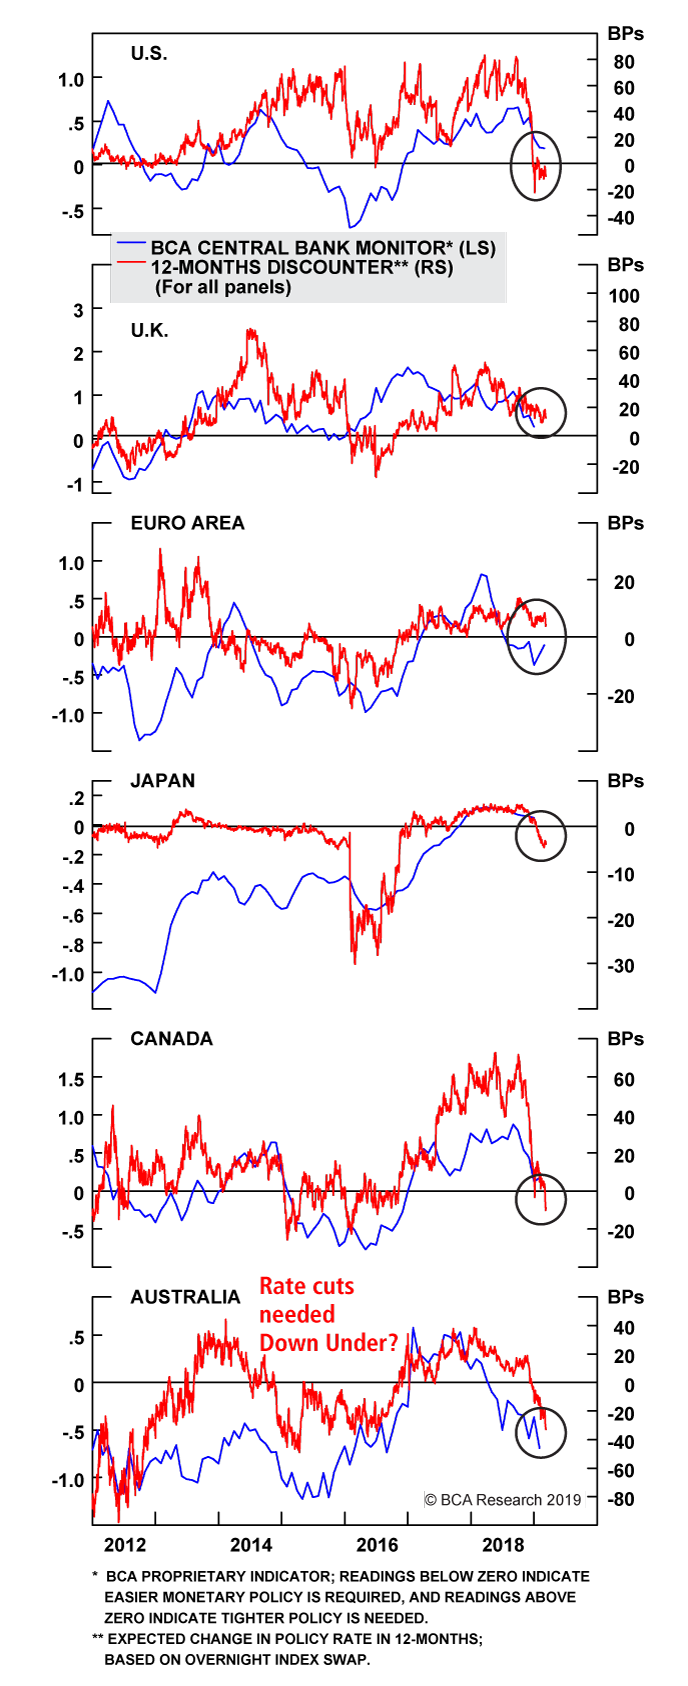
 Fullscreen Fullscreen |  Interactive Chart Interactive Chart |
Just looking at these indicators, the ideal combination would be to underweight countries where yields are vulnerable to an upward repricing (PMIs still above 50, higher oil/CPI swaps correlations and no rate hikes priced) and to overweight countries where yields are less likely to rise (PMIs below 50, lower oil/CPI swaps correlations and where our 12-month discounters are not priced for rate cuts).
Under these criteria, underweights in the U.S. and Canada are still justified, as are overweights in core Europe and Japan. The surprising firmness of the U.K. manufacturing PMI relative to the persistent downtrend in the U.K. LEI muddies the message a bit on Gilts, although the relatively high level of our 12-month discounter (still 13bps of hikes priced) is a bullish sign with our BoE Monitor now sitting right near zero. In Australia, the manufacturing PMI is also surprisingly firm but, the underlying weak momentum in overall Australian growth is leaving the door open to potential RBA rate cuts later this year.
For all our country recommendations within our model bond portfolio framework, we always look at yields and returns on a currency-hedged basis in U.S. dollar terms. We do this to separate the fixed income component of global bond returns from the currency component. Yet when looking at the government bond yield curves in our model bond portfolio universe, hedged into USD, there is very little differentiation among those countries with the higher credit ratings (Chart 6). Only Spain (A-rated) and Italy (BBB-rated) have hedged yields that are outside the 2-3% range seen in the other major developed economies.
Chart 6
Currency-Hedged Yield Convergence For Highly-Rated Countries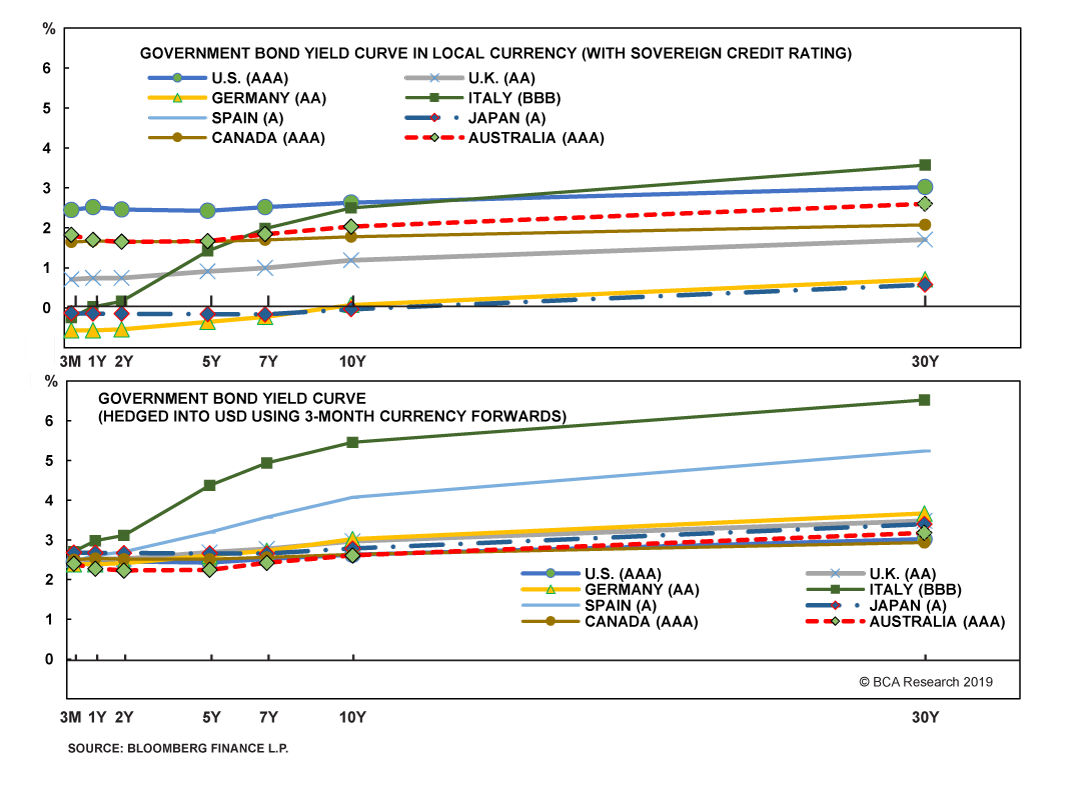
 Fullscreen Fullscreen |
From a fundamental point of view, those narrow yield differentials among the higher-rated markets largely reflect the convergence of trend economic growth rates.
In a recent Weekly Report, we looked at the long-run growth rates of potential GDP and labor productivity for the U.S., euro area and Japan and noted that the differences between them were fairly modest.1 This justified narrow currency-hedged yield differentials between U.S. Treasuries, German Bunds and Japanese government bonds (JGBs). When we add Canada, Australia and the U.K. to the mix (Chart 7), we can see similar convergence of potential GDP growth to rates between 1-2% and long-run productivity growth around 0.5% (using OECD data for both).
Chart 7
No Major Differences In Long-Run Growth Rates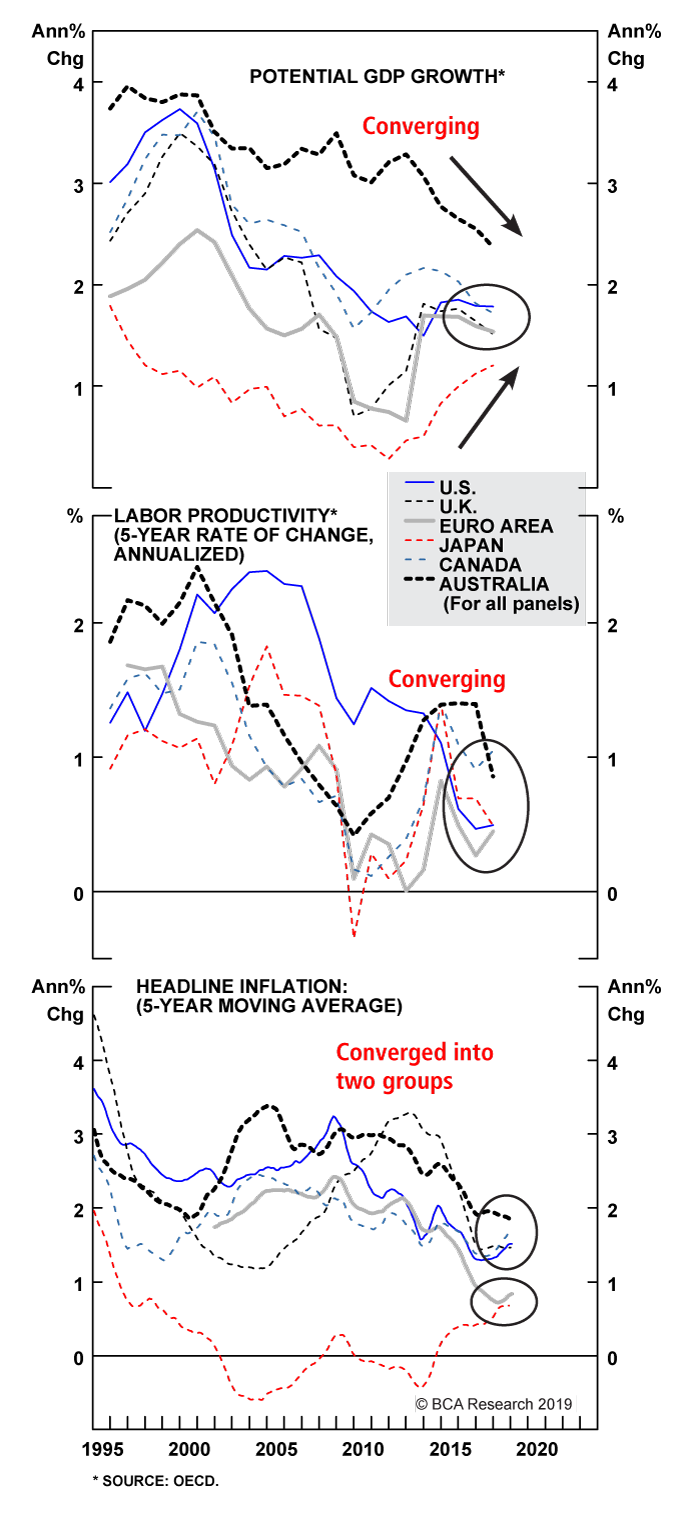
 Fullscreen Fullscreen |  Interactive Chart Interactive Chart |
The convergence is largely complete for all countries except Australia, where potential GDP growth is estimated to be 2.4%. Yet the long-run downtrend in potential growth is powerful and full convergence to the sub-2% levels seen in the other countries appears inevitable (and goes a long way in explaining the historically low level of Australian bond yields versus global peers).
We can also see convergence in looking at the more recent history of the market pricing of the expected long-run neutral interest rate, using our real terminal rate proxy (the 5-year OIS rate, 5-years forward minus the 5-year CPI swap rate 5-years forward). Those measures for all of the major developed markets in our model bond portfolio are shown in Chart 8. The markets are pricing in real policy rate convergence, as well, with real rates expected to stay in a range between -0.5% (core Europe) and +0.5% (Canada). The U.K. is the one outlier, with the market pricing in a terminal real rate of -2%, although this likely reflects the markets discounting in the long-run effects of Brexit on the U.K. economy.
Chart 8
Markets Expect Near-Zero Real Terminal Rates (ex the U.K.)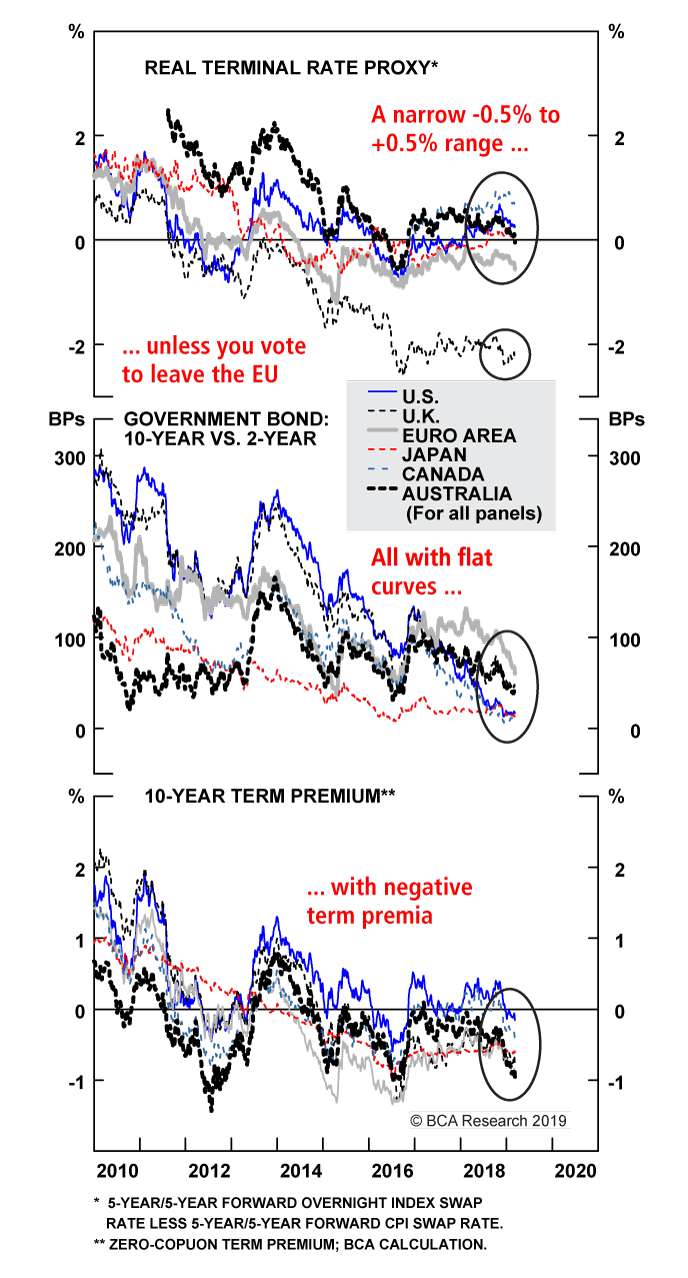
 Fullscreen Fullscreen |  Interactive Chart Interactive Chart |
So what does all this mean for our recommended country allocations in our model bond portfolio? In Chart 9, we show the relative performance of the each country, hedged into U.S. dollars and duration-matched) versus the Bloomberg Barclays Global Treasury Index. Our overweight tilts are in the top panel, while our underweight tilts are in the bottom panel.
Chart 9
Sticking With The Country Allocations In Our Model Bond Portfolio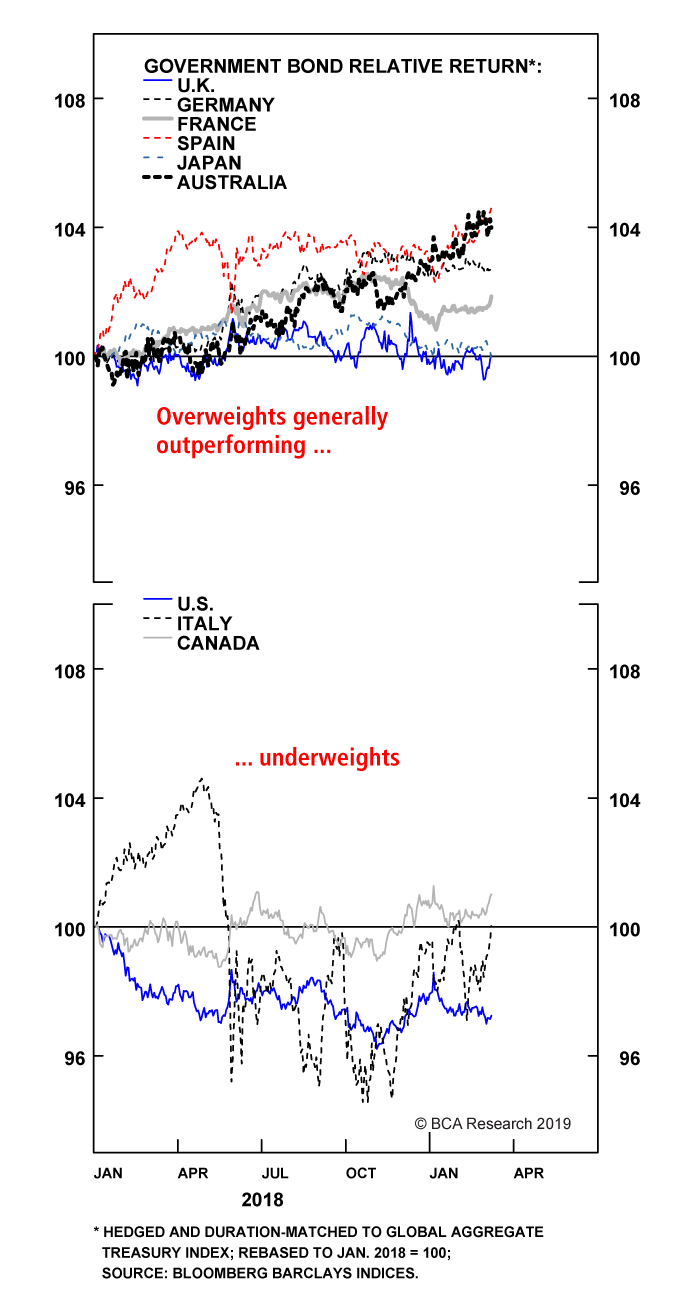
 Fullscreen Fullscreen |  Interactive Chart Interactive Chart |
Generally speaking, are recommendations have done well. Given our read on the indicators above, we see little reason to change the allocations. Our biggest concerns would be the underweights in Canada and Italy, given the sharp weakening of growth in both countries. For Italy, however, we view that as a negative given Italy’s high debt levels that require faster nominal growth to ensure debt sustainability. A more dovish ECB should help keep European bond volatility low, to the benefit of carry trades like Italian government bonds. However, we prefer to play that through our overweight in Spain while we await signs of stabilization in the Italian LEI before upgrading Italy in our model bond portfolio.
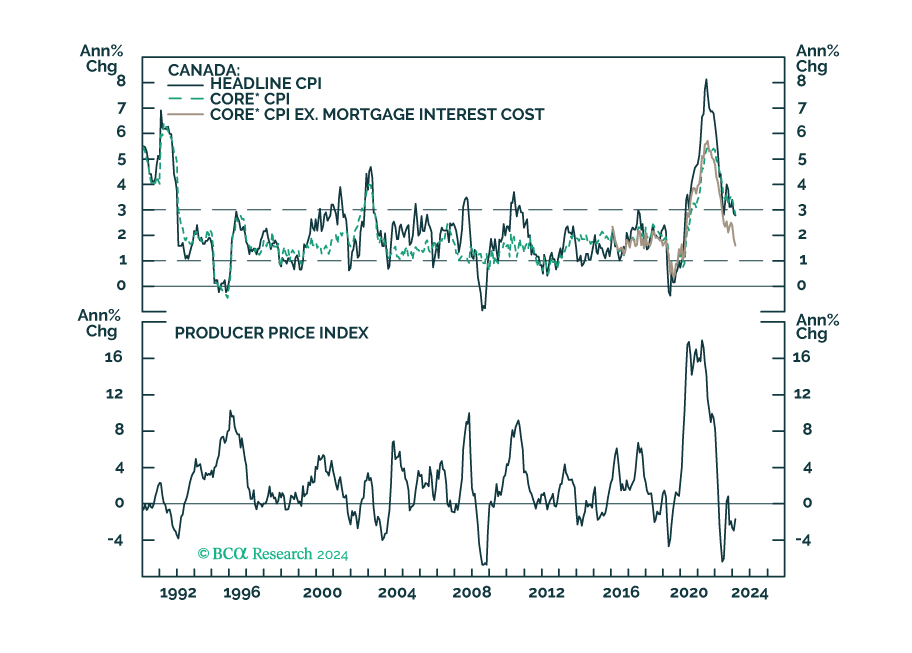
As for Canada, we plan on doing a deeper dive on their economy and inflation trends in next week’s report before considering any changes to our allocation.
Bottom Line: We are sticking with our current country tilts in our model bond portfolio, as the recent shift in central banker biases has done little to change the relative fundamental drivers between countries. Stay underweight the U.S., Canada & Italy, and overweight core Europe, Japan, the U.K., Spain & Australia, in currency-hedged global government bond portfolios.
Robert Robis, CFA,
Chief Fixed Income Strategist
rrobis@bcaresearch.com
- 1 Please see BCA Global Fixed Income Strategy Weekly Report, “Europe & Japan: The Anchor Weighing On Global Bond Yields”, dated February 26, 2019, available at gfis.bcaresearch.com
Recommendations
The GFIS Recommended Portfolio Vs. The Custom Benchmark Index
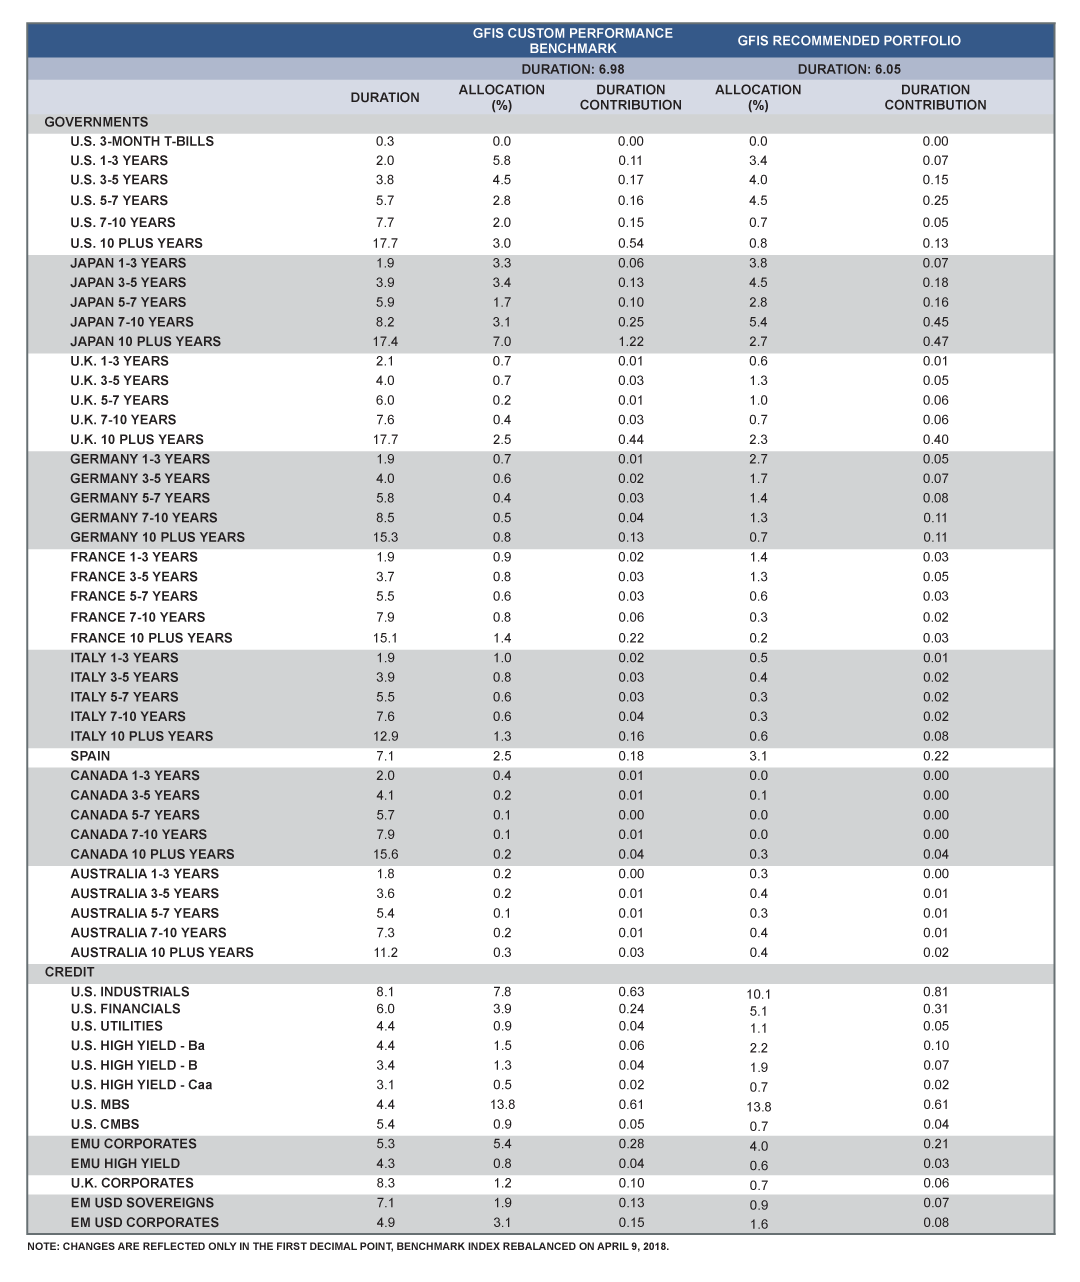
 Fullscreen Fullscreen |
Regional Allocation
| REGION | REGIONAL WEIGHT* | POLICY RATE | CURRENCY VIEW** |
| U.S. | 2 | UP | UP |
| JAPAN | 5 | FLAT | DOWN |
| GERMANY | 3 | FLAT | DOWN |
| FRANCE | 3 | FLAT | DOWN |
| OTHER CORE | 3 | FLAT | DOWN |
| SPAIN | 2 | FLAT | DOWN |
| PORTUGAL | 2 | FLAT | DOWN |
| ITALY | 2 | FLAT | DOWN |
| U.K. | 4 | FLAT | FLAT |
| CANADA | 2 | UP | UP |
| AUSTRALIA | 4 | FLAT | FLAT |
| NEW ZEALAND | 4 | FLAT | FLAT |
| EM (US$ pay) | 2 | . | . |
*RELATIVE TO GLOBAL HEDGE BENCHMARK WEIGHTS. ALLOCATION REPRESENTS OUR 6 MONTH VIEW.
1-MAX UNDERWEIGHT 2-UNDERWEIGHT 3-BENCHMARK WEIGHTING 4-OVERWEIGHT 5-MAX OVERWEIGHT
**VERSUS USD.
Spread Product 4/5
| WITHIN REGIONS | SECTOR WEIGHT* | |
| U.S. | AGENCIES CORPORATES HIGH-YIELD MORTGAGES MUNIS Government | 4 4 4 3 4 2 |
| U.K. | CORPORATES Government | 3 3 |
| EURO AREA | CORPORATES HIGH-YIELD HIGH-GRADE** Government | 3 3 3 2 |
| CANADA | PROVINCIALS CORPORATES Government | 2 4 2 |
* 1-MAX UNDERWEIGHT 2-UNDERWEIGHT 3-BENCHMARK WEIGHTING 4-OVERWEIGHT 5-MAX OVERWEIGHT
REFLECTS 6 TO 9 MONTH VIEWS ON A CURRENCY HEDGED BASIS
**VERSUS USD.
Tactical Trades
| TRADES | INCEPTION DATE | INCEPTION LEVEL | CURRENT LEVEL | GAINS & LOSSES |
| CURVE TRADE | ||||
| SHORT U.S. 7-YEAR BULLET VS. 2/30 BARBELL | Jan 22/19 | 5 BPS | 8 BPS | -40 BPS |
| LONG SWEDEN 10-YEAR GOVERNMENT BONDS VS. 2-YEAR | May 08/17 | 119 BPS | 86 BPS | 63 BPS |
| LONG U.K. GOVERNMENT BOND 5-YEAR BULLET VS. 2/10 BARBELL | Mar 27/17 | 9 BPS | -2 BPS | 4 BPS |
| RELATIVE VALUE | ||||
| LONG NEW ZEALAND 5-YEAR VS. GERMANY | Nov 20/18 | 263 BPS | 215 BPS | 210 BPS |
| SHORT 2-YEAR SWEDEN GOVERNMENT BOND VS. GERMANY | May 08/17 | 8 BPS | 14 BPS | -4 BPS |
| LONG NEW ZEALAND 5-YEAR VS. U.S. | May 30/17 | 74 BPS | -78 BPS | 584 BPS |
| SHORT ITALY 5-YEAR GOVERNMENT BOND VS. SPAIN | Dec 13/16 | 41 BPS | 81 BPS | 7 BPS |
| INFLATION PROTECTION | ||||
| LONG CANADA 10-YEAR BREAKEVEN INFLATION * | Jan 08/18 | 1.76% | 1.5 % | -229 BPS |
| LONG EURO AREA 10-YEAR CPI SWAP | Dec 20/16 | 1.44% | 1.3 % | 113 BPS |
| LONG U.S. TIPS VS. NOMINAL U.S. GOVERNMENT BOND | Aug 23/16 | 1.48% | 1.9 % | 216 BPS |
* NOTE: CROSS-COUNTRY TRADES ARE ASSUMED TO BE CURRENCY HEDGED INTO THE FUNDING (SHORT) POSITION WITH 3-MONTH CURRENCY FORWARD RATES, UNLESS OTHERWISE SPECIFIED; RETURNS ARE CALCULATED USING TOTAL RETURN INDEX DATA FROM BLOOMBERG FINANCE L.P. EXCEPT FOR LONG EURO AREA 10-YEAR CPI SWAP AND LONG U.S. TIPS VS. NOMINAL U.S. TREASURIES WHICH ARE TAKEN FROM BLOOMBERG BARCLAYS INDICIES.
Yields & Returns
Global Bond Yields
| 10-YEAR GOVERNMENT BOND YIELDS | |||||||
| REGION | YIELD Mar 08 | YEAR-TO-DATE YIELD CHANGE (bps) | HEDGED YIELD* | ||||
| USD | GBP | EUR | JPY | CAD | |||
| U.S. | 2.63 | 1 | 2.63 | 0.77 | -0.50 | -0.29 | 1.79 |
| GERMANY | 0.07 | -10 | 3.11 | 1.30 | 0.07 | 0.27 | 2.29 |
| FRANCE | 0.41 | -24 | 3.45 | 1.64 | 0.41 | 0.61 | 2.63 |
| SPAIN | 1.05 | -35 | 4.09 | 2.28 | 1.05 | 1.25 | 3.27 |
| ITALY | 2.50 | -19 | 5.54 | 3.73 | 2.50 | 2.71 | 4.72 |
| JAPAN | -0.03 | -4 | 2.81 | 1.00 | -0.24 | -0.03 | 1.99 |
| U.K. | 1.19 | -2 | 3.02 | 1.19 | -0.06 | 0.15 | 2.19 |
| CANADA | 1.77 | -14 | 2.60 | 0.75 | -0.51 | -0.30 | 1.77 |
| AUSTRALIA | 2.03 | -26 | 2.45 | 0.59 | -0.68 | -0.47 | 1.60 |
| NEW ZEALAND | 2.07 | -30 | 2.79 | 0.94 | -0.32 | -0.11 | 1.95 |
| SWEDEN | 0.45 | 5 | 3.25 | 1.44 | 0.21 | 0.41 | 2.43 |
| SWITZERLAND | -0.34 | -9 | 3.04 | 1.24 | 0.01 | 0.22 | 2.23 |
| NORWAY | 1.61 | -7 | 3.02 | 1.18 | -0.07 | 0.14 | 2.19 |
*HEDGED OVER 3-MONTH HORIZON USING MID-MARKET RATES
Historical Returns
| GOVERNMENT BOND INDEXES* | ||||
| REGION | YEAR-TO-DATE TOTAL RETURN (%) | |||
| HEDGED** | UNHEDGED | |||
| USD | EUR | USD | EUR | |
| U.S. | 0.57 | 0.02 | 0.57 | 1.65 |
| EURO AREA | 1.93 | 1.37 | 0.30 | 1.37 |
| GERMANY | 1.18 | 0.63 | -0.44 | 0.63 |
| FRANCE | 2.02 | 1.47 | 0.40 | 1.47 |
| SPAIN | 2.84 | 2.28 | 1.20 | 2.28 |
| ITALY | 1.67 | 1.11 | 0.04 | 1.11 |
| JAPAN | 1.35 | 0.79 | -0.84 | 0.22 |
| U.K. | 1.38 | 0.83 | 4.38 | 5.50 |
| CANADA | 1.37 | 0.81 | 2.46 | 3.56 |
| AUSTRALIA | 2.22 | 1.67 | 2.68 | 3.78 |
| NEW ZEALAND | 1.99 | 1.44 | 3.83 | 4.94 |
| SWEDEN | 1.16 | 0.61 | -4.34 | -3.32 |
| SWITZERLAND | 2.25 | 1.70 | -0.32 | 0.75 |
| NORWAY | 0.77 | 0.21 | -0.45 | 0.61 |
*SOURCE: BARCLAYS TREASURY INDEXES.
**HEDGED OVER 1-MONTH HORIZON.
 You are reading a complimentary report. To find out more about our services,
